Embed Size (px)
Citation preview
Translational Cancer Mechanisms and Therapy
TargetingPIMKinasewithPD1 Inhibition ImprovesImmunotherapeutic Antitumor T-cell ResponseShilpak Chatterjee1, Paramita Chakraborty1, Anusara Daenthanasanmak2,Supinya Iamsawat2, Gabriela Andrejeva3, Libia A. Luevano4, Melissa Wolf3,Uday Baliga5, Carsten Krieg2, Craig C. Beeson6, Meenal Mehrotra5, Elizabeth G. Hill7,Jeffery C. Rathmell3, Xue-Zhong Yu2, Andrew S. Kraft4, and Shikhar Mehrotra1
Abstract
Purpose: Adoptive T-cell therapy (ACT) of cancer, whichinvolves the infusion of ex vivo–engineered tumor epitopereactive autologous T cells into the tumor-bearing host, is apotential treatmentmodality for cancer. However, the durableantitumor response following ACT is hampered either by lossof effector function or survival of the antitumor T cells.Therefore, strategies to improve the persistence and sustainthe effector function of the antitumor T cells are of immenseimportance. Given the role of metabolism in determining thetherapeutic efficacyof T cells,wehypothesize that inhibitionofPIM kinases, a family of serine/threonine kinase that promotecell-cycle transition, cell growth, and regulate mTORC1 activ-ity, can improve the potency of T cells in controlling tumor.
Experimental Design: The role of PIM kinases in T cells wasstudied either by genetic ablation (PIM1�/�PIM2�/�PIM3�/�)or its pharmacologic inhibition (pan-PIM kinase inhibitor,PimKi). Murine melanoma B16 was established subcutane-
ously and treated by transferring tumor epitope gp100–reac-tive T cells along with treatment regimen that involved inhi-biting PIM kinases, anti-PD1 or both.
Results: With inhibition of PIM kinases, T cells hadsignificant reduction in their uptake of glucose, and upre-gulated expression of memory-associated genes that inverse-ly correlate with glycolysis. In addition, the expression ofCD38, which negatively regulates the metabolic fitness ofthe T cells, was also reduced in PimKi-treated cells. Impor-tantly, the efficacy of antitumor T-cell therapy was markedlyimproved by inhibiting PIM kinases in tumor-bearing micereceiving ACT, and further enhanced by adding anti-PD1antibody to this combination.
Conclusions: This study highlights the potential therapeu-tic significance of combinatorial strategies where ACT andinhibition of signaling kinase with checkpoint blockade couldimprove tumor control.
IntroductionHarnessing the cytotoxic ability of T cells against tumor is a
promising approach to devise effective T-cell–based immuno-therapy of cancer (1, 2). Extensive studies have focused onoptimizing the culture conditions for expanding tumor epi-tope–specific T cells. One of the important intrinsic parametersdriving T-cell differentiation and function is their metaboliccommitment (3). It has been shown that dependence on glycol-
ysis regulates the effector response of the T cells (e.g., IFNgproduction) and leads to the generation of terminal effectorT cells (4–6). Similarly, reliance on oxidative phosphorylation(OXPHOS) potentiates T-cell memory response with improvedpersistence (7–9). Therefore, approaches to reinforce the differ-entiation of T cells to central memory phenotype (Tcm) havebeen successful by interfering with glycolytic activity of T cellseither by blocking mTOR, AKT, or glycolytic pathway enzymes(6, 10–17). Another strategy to increase the therapeutic efficacy ofT cells for ACT is to reprogram the expanding T cells toward "stemcell–like memory" (Tscm) phenotype (18–21). However, main-taining Tcm or Tscm phenotype in a tumor-bearing host hasremained a challenge. Thus, understanding the mechanisms thatlead to generation of stable antitumor Tcm phenotype in vivo hashigh translational potential to improve the quality of ACT.
PIM proteins are members of a family of short-lived, evolu-tionary conserved serine/threonine kinases composed of 3 iso-forms (PIM1, PIM2, and PIM3) that act downstream of cytokinereceptors and are critical for various aspects of cellular processesincluding signal transduction, cell-cycle progression, apoptosis,and cell metabolism (22). It has been shown that PIM kinases canpromote the activity of mTOR and thus regulate cell growthand protein synthesis in various cancer types (23). Our datasuggest that T cells obtained from triple PIM isoform knockout(TKO)mice exhibit low glycolytic activity, as evident by the lowerglucose levels and reduced mTOR activity when compared withWT controls. Importantly, no significant difference in T-cell acti-vation or proliferation was detected in TKO versus WT T cells.
1Department of Surgery, Medical University of South Carolina, Charleston, SouthCarolina. 2Department of Microbiology & Immunology, Medical University ofSouth Carolina, Charleston, South Carolina. 3Department of Pathology, Micro-biology and Immunology, Vanderbilt University Medical Center, Nashville,Tennessee. 4University of Arizona Cancer Center, University of Arizona, Tucson,Arizona. 5Department of Pathology& LaboratoryMedicine, Medical University ofSouth Carolina, Charleston, South Carolina. 6Department of Pharmaceutical andBiomedical Sciences, Medical University of South Carolina, Charleston, SouthCarolina. 7Department of Public Health, Hollings Cancer Center, Medical Uni-versity of South Carolina, Charleston, South Carolina.
Note: Supplementary data for this article are available at Clinical CancerResearch Online (http://clincancerres.aacrjournals.org/).
S. Chatterjee and P. Chakraborty contributed equally to this article.
Corresponding Author: Shikhar Mehrotra, Medical University of South Carolina,86 Jonathan Lucas Street, Charleston, SC 29425. Phone: 843-792-9195; Fax:843-792-2556; E-mail: [email protected]
doi: 10.1158/1078-0432.CCR-18-0706
�2018 American Association for Cancer Research.
ClinicalCancerResearch
Clin Cancer Res; 25(3) February 1, 20191036
on March 14, 2020. © 2019 American Association for Cancer Research. clincancerres.aacrjournals.org Downloaded from
Published OnlineFirst October 16, 2018; DOI: 10.1158/1078-0432.CCR-18-0706
Similar observations were obtained when T cells were activated inthe presence of the pan-PIM kinase inhibitor (PimKi) AZD1208.Moreover, PIM kinase inhibition in T cells led to higher Foxo1activity, which translated to a Tcm phenotype (CD44þCD62Lþ)when compared with the control (vehicle-treated) T cells. Next,given the role of PIM kinases in downmodulating MYC (24),which also controls PD1 expression (25, 26), we assessedwhethercombining anti-PD1 þ pan-PIM inhibitor þ adoptive transfer ofT cells (triple combination therapy, PPiT) could improve tumorresponse. We observed that when AZD1208 was administeredwith anti-PD1antibody and tumor-reactive T cells, therewas long-term tumor control. Thus, we propose that targeting Pim kinasealong with checkpoint blockade and adoptive T-cell therapy is apotent strategy to control tumor growth.
Materials and MethodsMice
C57BL/6, B6-Thy1.1 (B6.PL-Thy1a/CyJ) and pMel mice wereobtained from Jackson Laboratory. PIM1�/�PIM2�/�PIM3�/�
mice (triple knockout or TKO mice) were obtained in collabo-ration with Andrew S. Kraft, University of Arizona (Tucson, AZ).Animals were maintained in pathogen-free facilities and experi-mental procedures were approved by Institutional Animal Careand Use Committees of Medical University of South Carolina(Charleston, SC).
Reagents and cell linesPenicillin, streptomycin, glucose-free RPMI1640, and Iscove
modified Dulbecco's medium (IMDM) were purchased from LifeTechnologies. FBS was procured from Atlanta Biologicals.hgp10025–33 peptide (KVPRNQDW) peptide was purchased fromGenScript. Recombinant IL2 (rIL2) was procured from NCI,Biological Resources Branch. Fluorochrome-conjugated anti-mouse CD8 (53-6.7), CD71 (RI7217), CD25 (PC61), CD69(H1.2F3), CD44 (IM7), CD62L (MEL-14), Sca1 (D7), CD38(90), PD1 (RPM1-30), IFNg (XMG1.2), IL17a (TC11-18H10.1), CXCR3 (CXCR3-173) and anti-human CD8 (SK1),CD44 (IM7), CD62L (DREG-56), CD28 (CD28.2), CD27 (M-T271), PD1 (NAT105) were purchased from BioLegend. Anti-mouse Vb13 (MR12-3) was procured from BD Biosciences. Anti-human Vb12 was from Thermo Scientific. Anti-mouse pS6conjugated with Alexa647, pAkt (S473) conjugated with PE and
pFoxo1 (S256) were purchased from Cell Signaling Technology.Anti-mouse PD1 (RMP1-14), CD3 (145-2C11), and CD28(37.51) were purchased from BioXcell. B16-F10 melanoma(catalog No. CRL-6475) was obtained from ATCC and 624-MELfrom Dr. Michael Nishimura (Loyola University, Chicago, IL).PBMCs from healthy donors were obtained from a commercialvendor, Research Blood Components, LLC, after institutionalapproval by the Human Investigation Review Board.
Cell cultureSplenocytes from either TKO or WT (FvB) mice were activated
with plate-bound anti-CD3 (2 mg/mL) and anti-CD28 (2 mg/mL)in presence of rIL2 (100 IU/mL) for 3 days. In some cases,splenocytes from pMel mice were activated using hgp10025–33peptide (KVPRNQDW, 1 mg/mL) either in presence of AZD1208(3 mmol/L) or vehicle (DMSO) for 3 days. rIL2 (100 IU/mL) wasadded during T-cell activation. Complete IMDM supplement-ed with 10% FCS, 4 mmol/L L-glutamine, 100 U/mL penicillin,100 mg/mL streptomycin, 55 mmol/L beta-mercaptoethanol wasused for T-cell culture. Purified CD4þ T cells were differentiatedto either Th1 or Th17 type according to the protocol publishedrecently (27).
Adoptive T-cell protocolMouse melanoma tumor (B16-F10) and human melanoma
(624-MEL) were maintained in vitro in complete IMDM. B16-F10(0.25 � 106) or 624-MEL (2.5 � 106) were injected subcutane-ously (s.c.) into the left flank of C57BL/6 or NSG-A2 mice,respectively. On day 6 following B16-F10 cell inoculation, theC57BL/6 recipient mice were injected intraperitoneally (i.p.) withcyclophosphamide at 4 mg/mice. After 24 hours of cyclophos-phamide injection, tumor-bearing C57BL/6 were either keptuntreated or adoptively transferred with 3-day–activated pMelcells (1� 106/mouse). For xenograft tumor experiments, 15 dayssubcutaneously established 624-MEL in NSG-A2 mice wereeither kept untreated or treatedwith 3-day–activatedCD4þVb12þ
(h3T) T cells (0.5 � 106/mouse). Recipient mice were givenIL2 (50,000 U/mouse; i.p.) for 3 consecutive days after ACT. Insome cases, following ACT, recipient mice were either kept un-treated or injected (i.p.) with vehicle (methyl acetate), AZD1208(15 mg/kg of body weight), anti-PD1 Ab (200 mg/mouse), orbothAZD1208 andanti-PD1Ab. BothAZD1208 andanti-PD1Abwas given every other day until day 21.
Flow cytometryDetailed protocol for staining of cell surface molecules and
intracellular proteins has been described earlier (27). Sampleswere acquired on LSRFortessa and analysed with FlowJo software.
Real-time quantitative PCRTotal RNA was isolated from pellets of the indicated T-cell
subsets (2 � 106 cells) using TRIzol reagent (Life Technologies).cDNA was generated from 1 mg total RNA using iScript cDNASynthesis Kit (Bio-Rad). SYBR Green incorporation quantitativereal-time PCR was performed using a SYBR Green Mix (Bio-Rad)in the CFX96 Detection System (Bio-Rad).
Activation-induced T-cell deathThree-day–activated T cells from either WT or TKO mice were
either left untreated or restimulated overnight with plate-boundanti-CD3 (2 mg/mL). Apoptosis was measured by Annexin V (BD
Translational Relevance
Adoptive T-cell immunotherapy studies predominantlycomprise terminally differentiated T cells with effectormemory (Tem) phenotype, which have a limited life span.We believe that targeting PIM kinases, which along with Aktphosphorylate overlapping substrates to activate commonpathways that control various physiologic processes, areimportant for controlling tumor growth by altering the anti-tumor T-cell phenotype. This study shows that PIM inhibitionnot only leads to increased central memory phenotype ofT cells, but it also results in a durable tumor control whenused in combination with anti-PD1 antibody. Thus, thesestudies have high translational potential for tumor immuno-therapy protocols being used to treat patients with cancer.
PIM-K Inhibition Potentiates ACT
www.aacrjournals.org Clin Cancer Res; 25(3) February 1, 2019 1037
on March 14, 2020. © 2019 American Association for Cancer Research. clincancerres.aacrjournals.org Downloaded from
Published OnlineFirst October 16, 2018; DOI: 10.1158/1078-0432.CCR-18-0706
Biosciences) versus 7AAD staining according to the manufac-turer's protocol, followed by flow cytometry. Data were analyzedwith FlowJo software (Tree Star).
Glucose uptake, oxygen consumption, and glycolytic fluxGlucose uptake by activated T cells were determined by incu-
bating cells with 100 mmol/L 2NBDG (Cayman Chemical) for 30minutes before measuring fluorescence by flow cytometry. Extra-cellular acidification rate (ECAR) was evaluated as describedearlier (27).
Foxo1 activity assayUsing equal amounts of nuclear protein extracted by NE-PER
Nuclear and Cytoplasmic Extraction Reagents (Thermo FisherScientific), Foxo1 activity (FKHR transcription Factor Assay Kit,Active Motif) was determined as per manufacturer's protocol.
Statistical analysisAll data reported are the arithmetic mean from 3 independent
experiments performed in triplicate� SD unless stated otherwise.The unpaired Student t test was used to evaluate the significance ofdifferences observed between groups, accepting P < 0.05 as athreshold of significance. Data analyses were performed using thePrism software (GraphPad). For tumor experiments, all analyseswere performed using R version 3.2.3 and SAS version 9.4. Time-to-sacrifice was defined as the number of days from treatment toeuthanasia (tumor size � 400 mm2 or other criteria for sacrificemet). Time-to-sacrifice values for animals notmeeting euthanasiacriteria at the end of the experiment were right-censored. Kaplan–Meier (KM) curveswere constructed for each treatment group, andcomparisons relative to control were performed using log-ranktests. Because KM curves frequently overlapped, curves wereshifted slightly to facilitate visualization. Tumor size at each timepoint was measured relative to tumor size at treatment initiationto adjust for differences in tumor size at baseline between animals.We transformed resulting fold change (FC) values using a log base2 transformation to achieve approximate normality, evaluatedusing histograms and quantile–quantile plots. To facilitate trans-formation, we added 0.5 to tumor sizes of 0 mm2. Using max-imum likelihood, we fit linear mixed effects regression models oflog2FC as a function of experimental group, time (as a continuousvariable), group-by-time interaction and mouse-specific randomeffects to account for the correlation among measures obtainedfrom the same animal over time. We evaluated the functionalform of time in each model, and considered nonlinear transfor-mations as appropriate based on fractional polynomials (28).Group comparisons were performed using model-based linearcontrasts.
ResultsInhibition of PIM kinases in T cells reduces their glycolyticactivity
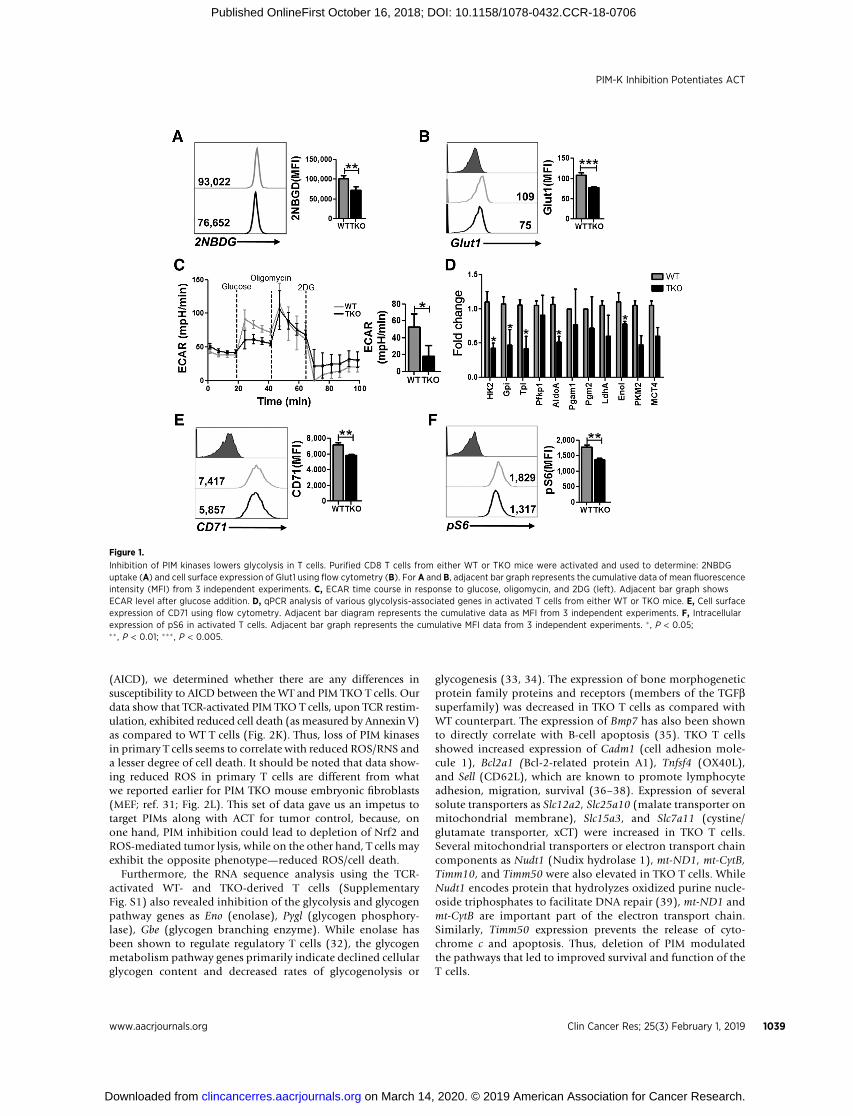
Because different T-cell subsets (i.e., effector, memory, orregulatory) have been shown to exhibit unique metabolic com-mitment (29), we determined the metabolic phenotype ofT cells in the absence of PIM expression. We observed that PimTKOT cells significantly reduced their ability to uptakefluorescentglucose analogue (2-NBDG, Fig. 1A), which could be due to thereduced expression of Glut1 on activated TKOT cells as comparedwithWTT cells (Fig. 1B). To further interrogatewhether absence of
PIM kinases in T cells affects glycolysis, we evaluated extracellularacidification rate (ECAR), a measure of lactate production byaerobic glycolysis, in activated TKO and WT T cells using ametabolic flux analyzer. As shown in Fig. 1C, following theaddition of glucose, TKO T cells exhibited a decreased ECAR valueas comparedwithWT T cells, indicating that the ability of the TKOT cells to metabolize glucose through glycolysis is lower ascompared with WT T cells.
To further determine whether reduced ECAR in TKO T cellswas due to differential expression of key enzymes involved inthe glycolytic pathway, we evaluated the transcript levels ofvarious glycolytic enzymes using qPCR. Our data indicate thatthe transcript level of various glycolysis-associated genes wassignificantly downregulated in TKO T cells as compared with WTT cells (Fig. 1D). In addition to decreased glycolysis, deletion ofPIM kinases in T cells also reduced the surface expression oftransferrin receptor, CD71, which correlates positively with theglycolytic activity of these T cells (Fig. 1E). Because glycolysispositively correlates with the activation of mTOR, we next eval-uated the phosphorylation of ribosomal protein S6 (pS6), adownstream target of mTOR, inWT and TKO T cells. We observedthat WT T cells had a higher level of phosphorylated S6 ascompared with TKO T cells (Fig. 1F). These data together implythat PIM kinases are involved in glycolytic commitment of T cells.
PIM kinase–deficient T cells exhibit increased TCM phenotpeand reduced reactive oxygen species (ROS) generation
Because the glucose requirement is a key determinant ofthe IFNg signature of T cells (5), we next determined whetherreduced glycolysis in TKO T cells affects the cytokine signature.Analysis of effector cytokines in activated T cells showed reducedIFNg secretion by TKO T cells compared withWT T cells (Fig. 2A).Similarly, TKO T cells differentiated in vitro to either Th1 or Th17cells exhibited reduced signature cytokine secretion comparedwith WT T cells (Fig. 2B).
Next, to determine whether the reduced cytokine responseexhibited by TKO T cells is due to lack of proper activation ordifferentiation, we compared the phenotype of activated WT andTKOT cells after 3 days.We observed that bothWT and TKOT-cellpopulations had a similar level of CD25 and CD69 expression(Fig. 2C), indicating an equal degree of activation. However,we noticed that compared with WT T cells, the majority of theTKO T cells exhibited the CD62LþCD44þ phenotype (�60% vs.40%, Fig. 2D). Thiswas also accompaniedby increased expressionof stem cell antigen (Sca1) on this Tcm fraction in TKO T cells(Fig. 2E). Thus, inhibition of PIM kinases results in an increasedTcm fraction with a stem cell phenotype. Various negative costi-mulatory molecules (PD1 and CD38) that have been shown todampen the effector response of the T cells at the tumor site weremarkedly reduced on TKO T cells as compared with WT T cells(Fig. 2F andG). T-cell receptor (TCR) restimulation results in ROSsecretion that has been shown to be important for initial prolif-eration of the T cells (30). Thus, we examinedwhether there is anydifference in ROS accumulation betweenWT and TKOT cells. Ourdata show that PIM TKO T cells secreted lower levels of ROSspecies H2O2 (measured using DCFDA) and reactive nitrogenspecies (RNS, measured using DAF; Fig. 2H and I). The antiox-idant genes (such as catalase, superoxide dismutase, thioredoxin;measured using qPCR)were also found to be elevated in PIMTKOT cells (Fig. 2J). Because excessive ROS/RNS accumulation uponchronic TCR activation leads to activation-induced cell death
Chatterjee et al.
Clin Cancer Res; 25(3) February 1, 2019 Clinical Cancer Research1038
on March 14, 2020. © 2019 American Association for Cancer Research. clincancerres.aacrjournals.org Downloaded from
Published OnlineFirst October 16, 2018; DOI: 10.1158/1078-0432.CCR-18-0706
(AICD), we determined whether there are any differences insusceptibility to AICD between the WT and PIM TKO T cells. Ourdata show that TCR-activated PIM TKO T cells, upon TCR restim-ulation, exhibited reduced cell death (as measured by Annexin V)as compared to WT T cells (Fig. 2K). Thus, loss of PIM kinasesin primary T cells seems to correlate with reduced ROS/RNS anda lesser degree of cell death. It should be noted that data show-ing reduced ROS in primary T cells are different from whatwe reported earlier for PIM TKO mouse embryonic fibroblasts(MEF; ref. 31; Fig. 2L). This set of data gave us an impetus totarget PIMs along with ACT for tumor control, because, onone hand, PIM inhibition could lead to depletion of Nrf2 andROS-mediated tumor lysis, while on the other hand, T cells mayexhibit the opposite phenotype—reduced ROS/cell death.
Furthermore, the RNA sequence analysis using the TCR-activated WT- and TKO-derived T cells (SupplementaryFig. S1) also revealed inhibition of the glycolysis and glycogenpathway genes as Eno (enolase), Pygl (glycogen phosphory-lase), Gbe (glycogen branching enzyme). While enolase hasbeen shown to regulate regulatory T cells (32), the glycogenmetabolism pathway genes primarily indicate declined cellularglycogen content and decreased rates of glycogenolysis or
glycogenesis (33, 34). The expression of bone morphogeneticprotein family proteins and receptors (members of the TGFbsuperfamily) was decreased in TKO T cells as compared withWT counterpart. The expression of Bmp7 has also been shownto directly correlate with B-cell apoptosis (35). TKO T cellsshowed increased expression of Cadm1 (cell adhesion mole-cule 1), Bcl2a1 (Bcl-2-related protein A1), Tnfsf4 (OX40L),and Sell (CD62L), which are known to promote lymphocyteadhesion, migration, survival (36–38). Expression of severalsolute transporters as Slc12a2, Slc25a10 (malate transporter onmitochondrial membrane), Slc15a3, and Slc7a11 (cystine/glutamate transporter, xCT) were increased in TKO T cells.Several mitochondrial transporters or electron transport chaincomponents as Nudt1 (Nudix hydrolase 1), mt-ND1, mt-CytB,Timm10, and Timm50 were also elevated in TKO T cells. WhileNudt1 encodes protein that hydrolyzes oxidized purine nucle-oside triphosphates to facilitate DNA repair (39), mt-ND1 andmt-CytB are important part of the electron transport chain.Similarly, Timm50 expression prevents the release of cyto-chrome c and apoptosis. Thus, deletion of PIM modulatedthe pathways that led to improved survival and function of theT cells.
Figure 1.
Inhibition of PIM kinases lowers glycolysis in T cells. Purified CD8 T cells from either WT or TKO mice were activated and used to determine: 2NBDGuptake (A) and cell surface expression of Glut1 using flow cytometry (B). For A and B, adjacent bar graph represents the cumulative data of mean fluorescenceintensity (MFI) from 3 independent experiments. C, ECAR time course in response to glucose, oligomycin, and 2DG (left). Adjacent bar graph showsECAR level after glucose addition. D, qPCR analysis of various glycolysis-associated genes in activated T cells from either WT or TKO mice. E, Cell surfaceexpression of CD71 using flow cytometry. Adjacent bar diagram represents the cumulative data as MFI from 3 independent experiments. F, Intracellularexpression of pS6 in activated T cells. Adjacent bar graph represents the cumulative MFI data from 3 independent experiments. � , P < 0.05;�� , P < 0.01; ��� , P < 0.005.
PIM-K Inhibition Potentiates ACT
www.aacrjournals.org Clin Cancer Res; 25(3) February 1, 2019 1039
on March 14, 2020. © 2019 American Association for Cancer Research. clincancerres.aacrjournals.org Downloaded from
Published OnlineFirst October 16, 2018; DOI: 10.1158/1078-0432.CCR-18-0706
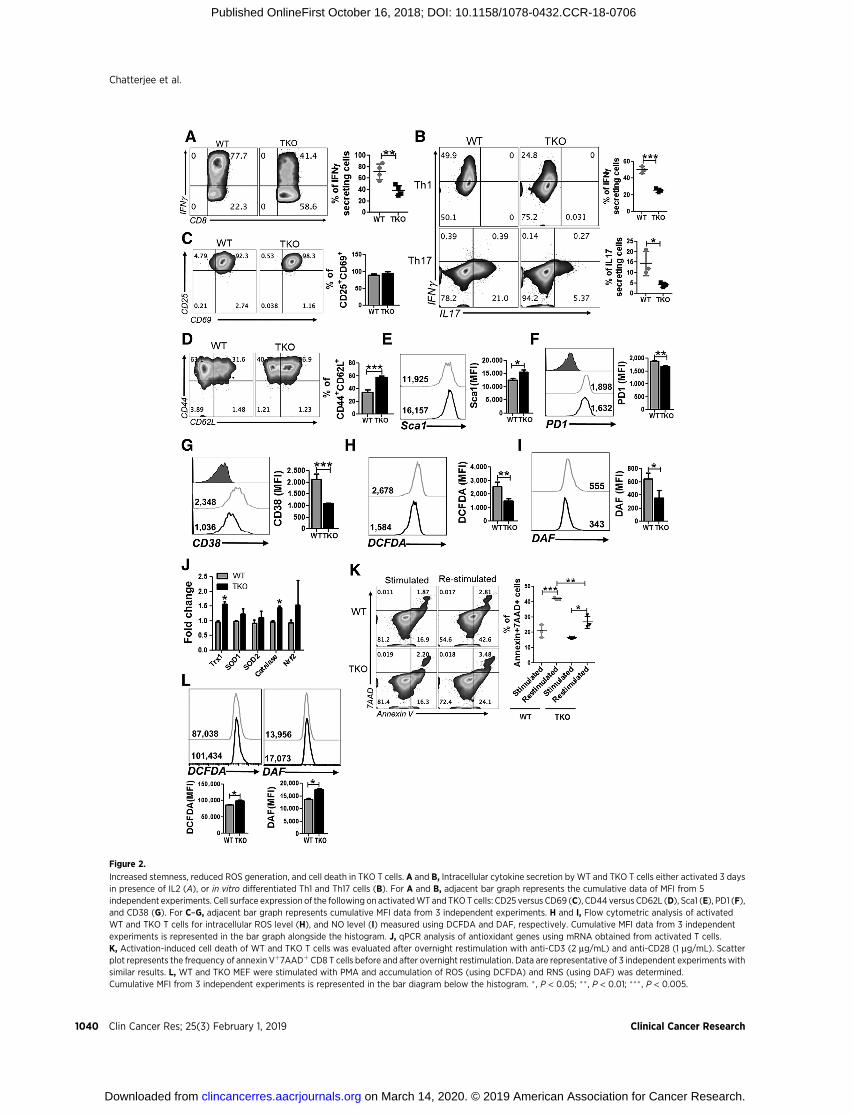
Figure 2.
Increased stemness, reduced ROS generation, and cell death in TKO T cells. A and B, Intracellular cytokine secretion by WT and TKO T cells either activated 3 daysin presence of IL2 (A), or in vitro differentiated Th1 and Th17 cells (B). For A and B, adjacent bar graph represents the cumulative data of MFI from 5independent experiments. Cell surface expression of the following on activatedWT and TKOT cells: CD25 versus CD69 (C), CD44 versus CD62L (D), Sca1 (E), PD1 (F),and CD38 (G). For C–G, adjacent bar graph represents cumulative MFI data from 3 independent experiments. H and I, Flow cytometric analysis of activatedWT and TKO T cells for intracellular ROS level (H), and NO level (I) measured using DCFDA and DAF, respectively. Cumulative MFI data from 3 independentexperiments is represented in the bar graph alongside the histogram. J, qPCR analysis of antioxidant genes using mRNA obtained from activated T cells.K, Activation-induced cell death of WT and TKO T cells was evaluated after overnight restimulation with anti-CD3 (2 mg/mL) and anti-CD28 (1 mg/mL). Scatterplot represents the frequency of annexin Vþ7AADþ CD8 T cells before and after overnight restimulation. Data are representative of 3 independent experiments withsimilar results. L, WT and TKO MEF were stimulated with PMA and accumulation of ROS (using DCFDA) and RNS (using DAF) was determined.Cumulative MFI from 3 independent experiments is represented in the bar diagram below the histogram. � , P < 0.05; �� , P < 0.01; ��� , P < 0.005.
Chatterjee et al.
Clin Cancer Res; 25(3) February 1, 2019 Clinical Cancer Research1040
on March 14, 2020. © 2019 American Association for Cancer Research. clincancerres.aacrjournals.org Downloaded from
Published OnlineFirst October 16, 2018; DOI: 10.1158/1078-0432.CCR-18-0706
Pharmacologic inhibition of PIM kinases decreases T-cellmetabolism
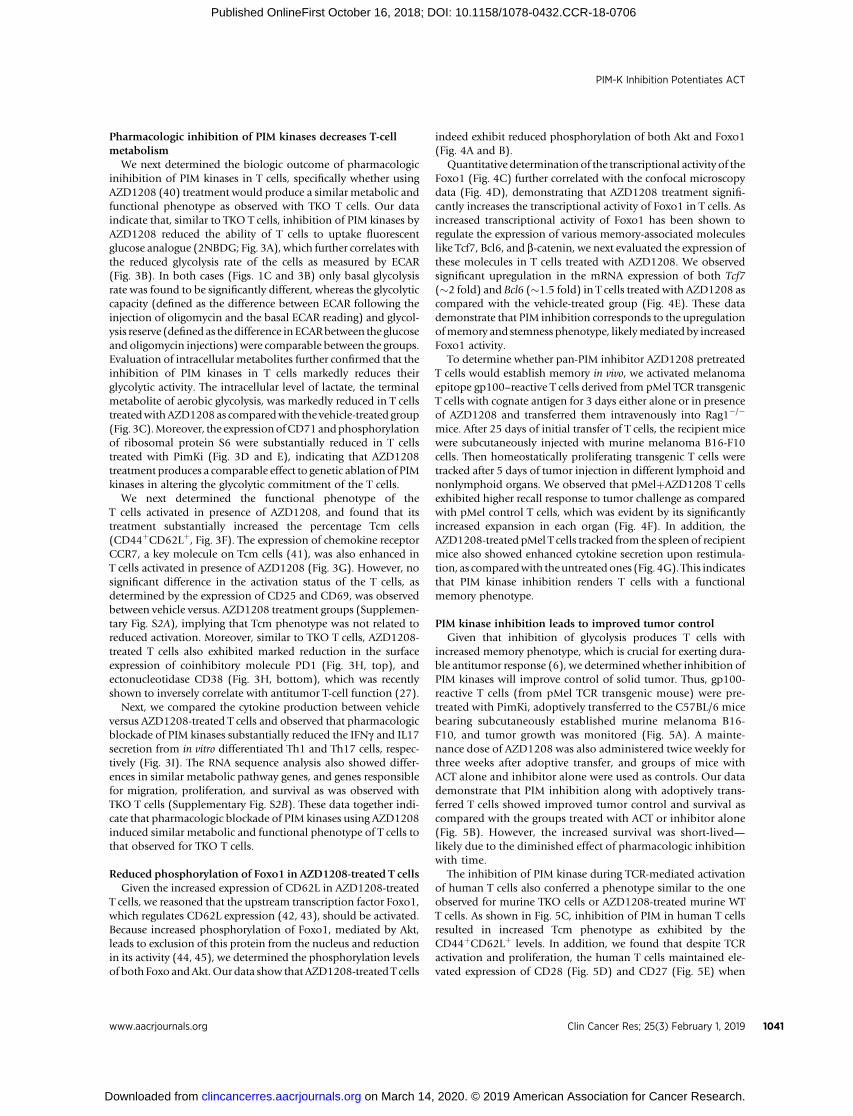
We next determined the biologic outcome of pharmacologicinihibition of PIM kinases in T cells, specifically whether usingAZD1208 (40) treatment would produce a similar metabolic andfunctional phenotype as observed with TKO T cells. Our dataindicate that, similar to TKO T cells, inhibition of PIM kinases byAZD1208 reduced the ability of T cells to uptake fluorescentglucose analogue (2NBDG; Fig. 3A), which further correlates withthe reduced glycolysis rate of the cells as measured by ECAR(Fig. 3B). In both cases (Figs. 1C and 3B) only basal glycolysisrate was found to be significantly different, whereas the glycolyticcapacity (defined as the difference between ECAR following theinjection of oligomycin and the basal ECAR reading) and glycol-ysis reserve (defined as the difference in ECARbetween the glucoseand oligomycin injections) were comparable between the groups.Evaluation of intracellular metabolites further confirmed that theinhibition of PIM kinases in T cells markedly reduces theirglycolytic activity. The intracellular level of lactate, the terminalmetabolite of aerobic glycolysis, was markedly reduced in T cellstreatedwithAZD1208 as comparedwith the vehicle-treated group(Fig. 3C).Moreover, the expressionofCD71andphosphorylationof ribosomal protein S6 were substantially reduced in T cellstreated with PimKi (Fig. 3D and E), indicating that AZD1208treatment produces a comparable effect to genetic ablation of PIMkinases in altering the glycolytic commitment of the T cells.
We next determined the functional phenotype of theT cells activated in presence of AZD1208, and found that itstreatment substantially increased the percentage Tcm cells(CD44þCD62Lþ, Fig. 3F). The expression of chemokine receptorCCR7, a key molecule on Tcm cells (41), was also enhanced inT cells activated in presence of AZD1208 (Fig. 3G). However, nosignificant difference in the activation status of the T cells, asdetermined by the expression of CD25 and CD69, was observedbetween vehicle versus. AZD1208 treatment groups (Supplemen-tary Fig. S2A), implying that Tcm phenotype was not related toreduced activation. Moreover, similar to TKO T cells, AZD1208-treated T cells also exhibited marked reduction in the surfaceexpression of coinhibitory molecule PD1 (Fig. 3H, top), andectonucleotidase CD38 (Fig. 3H, bottom), which was recentlyshown to inversely correlate with antitumor T-cell function (27).
Next, we compared the cytokine production between vehicleversus AZD1208-treated T cells and observed that pharmacologicblockade of PIM kinases substantially reduced the IFNg and IL17secretion from in vitro differentiated Th1 and Th17 cells, respec-tively (Fig. 3I). The RNA sequence analysis also showed differ-ences in similar metabolic pathway genes, and genes responsiblefor migration, proliferation, and survival as was observed withTKO T cells (Supplementary Fig. S2B). These data together indi-cate that pharmacologic blockade of PIM kinases using AZD1208induced similar metabolic and functional phenotype of T cells tothat observed for TKO T cells.
Reduced phosphorylation of Foxo1 in AZD1208-treated T cellsGiven the increased expression of CD62L in AZD1208-treated
T cells, we reasoned that the upstream transcription factor Foxo1,which regulates CD62L expression (42, 43), should be activated.Because increased phosphorylation of Foxo1, mediated by Akt,leads to exclusion of this protein from the nucleus and reductionin its activity (44, 45), we determined the phosphorylation levelsof both Foxo andAkt.Our data show that AZD1208-treated T cells
indeed exhibit reduced phosphorylation of both Akt and Foxo1(Fig. 4A and B).
Quantitative determination of the transcriptional activity of theFoxo1 (Fig. 4C) further correlated with the confocal microscopydata (Fig. 4D), demonstrating that AZD1208 treatment signifi-cantly increases the transcriptional activity of Foxo1 in T cells. Asincreased transcriptional activity of Foxo1 has been shown toregulate the expression of various memory-associated moleculeslike Tcf7, Bcl6, and b-catenin, we next evaluated the expression ofthese molecules in T cells treated with AZD1208. We observedsignificant upregulation in the mRNA expression of both Tcf7(�2 fold) and Bcl6 (�1.5 fold) in T cells treated with AZD1208 ascompared with the vehicle-treated group (Fig. 4E). These datademonstrate that PIM inhibition corresponds to the upregulationofmemory and stemness phenotype, likelymediated by increasedFoxo1 activity.
To determine whether pan-PIM inhibitor AZD1208 pretreatedT cells would establish memory in vivo, we activated melanomaepitope gp100–reactive T cells derived from pMel TCR transgenicT cells with cognate antigen for 3 days either alone or in presenceof AZD1208 and transferred them intravenously into Rag1�/�
mice. After 25 days of initial transfer of T cells, the recipient micewere subcutaneously injected with murine melanoma B16-F10cells. Then homeostatically proliferating transgenic T cells weretracked after 5 days of tumor injection in different lymphoid andnonlymphoid organs. We observed that pMelþAZD1208 T cellsexhibited higher recall response to tumor challenge as comparedwith pMel control T cells, which was evident by its significantlyincreased expansion in each organ (Fig. 4F). In addition, theAZD1208-treated pMel T cells tracked from the spleen of recipientmice also showed enhanced cytokine secretion upon restimula-tion, as comparedwith theuntreated ones (Fig. 4G). This indicatesthat PIM kinase inhibition renders T cells with a functionalmemory phenotype.
PIM kinase inhibition leads to improved tumor controlGiven that inhibition of glycolysis produces T cells with
increased memory phenotype, which is crucial for exerting dura-ble antitumor response (6), we determined whether inhibition ofPIM kinases will improve control of solid tumor. Thus, gp100-reactive T cells (from pMel TCR transgenic mouse) were pre-treated with PimKi, adoptively transferred to the C57BL/6 micebearing subcutaneously established murine melanoma B16-F10, and tumor growth was monitored (Fig. 5A). A mainte-nance dose of AZD1208 was also administered twice weekly forthree weeks after adoptive transfer, and groups of mice withACT alone and inhibitor alone were used as controls. Our datademonstrate that PIM inhibition along with adoptively trans-ferred T cells showed improved tumor control and survival ascompared with the groups treated with ACT or inhibitor alone(Fig. 5B). However, the increased survival was short-lived—likely due to the diminished effect of pharmacologic inhibitionwith time.
The inhibition of PIM kinase during TCR-mediated activationof human T cells also conferred a phenotype similar to the oneobserved for murine TKO cells or AZD1208-treated murine WTT cells. As shown in Fig. 5C, inhibition of PIM in human T cellsresulted in increased Tcm phenotype as exhibited by theCD44þCD62Lþ levels. In addition, we found that despite TCRactivation and proliferation, the human T cells maintained ele-vated expression of CD28 (Fig. 5D) and CD27 (Fig. 5E) when
PIM-K Inhibition Potentiates ACT
www.aacrjournals.org Clin Cancer Res; 25(3) February 1, 2019 1041
on March 14, 2020. © 2019 American Association for Cancer Research. clincancerres.aacrjournals.org Downloaded from
Published OnlineFirst October 16, 2018; DOI: 10.1158/1078-0432.CCR-18-0706
Figure 3.
Pan-PIM kinases inhibitor AZD1208 mimics the phenotype observed with TKO T cells. pMel T cells activated with the cognate antigen either in presence of vehiclecontrol (DMSO) or AZD1208 (3 mmol/L) were used to determine: uptake of 2NBDG (A), ECAR time course following addition of glucose, oligomycin, and2DG (left; B), and ECAR level following addition of glucose (right; C) intracellular level of lactate using NMR, cell surface expression of CD71 (D), intracellularexpression of pS6 (E), cell surface expression of CD44 and CD62L (F), CCR7 (G), and PD1 (top; H), and CD38 (bottom). For A–H, the bar graph representsthe cumulative MFI data from 3 independent experiments. I, Intracellular cytokine production by Th1 or Th17 cells differentiated in vitro either inpresence or absence of AZD1208 (3 mmol/L). The adjacent scatter plot represents the cumulative data of MFI from 3 independent experiments. � , P < 0.05;�� , P < 0.01; ��� , P < 0.005.
Chatterjee et al.
Clin Cancer Res; 25(3) February 1, 2019 Clinical Cancer Research1042
on March 14, 2020. © 2019 American Association for Cancer Research. clincancerres.aacrjournals.org Downloaded from
Published OnlineFirst October 16, 2018; DOI: 10.1158/1078-0432.CCR-18-0706
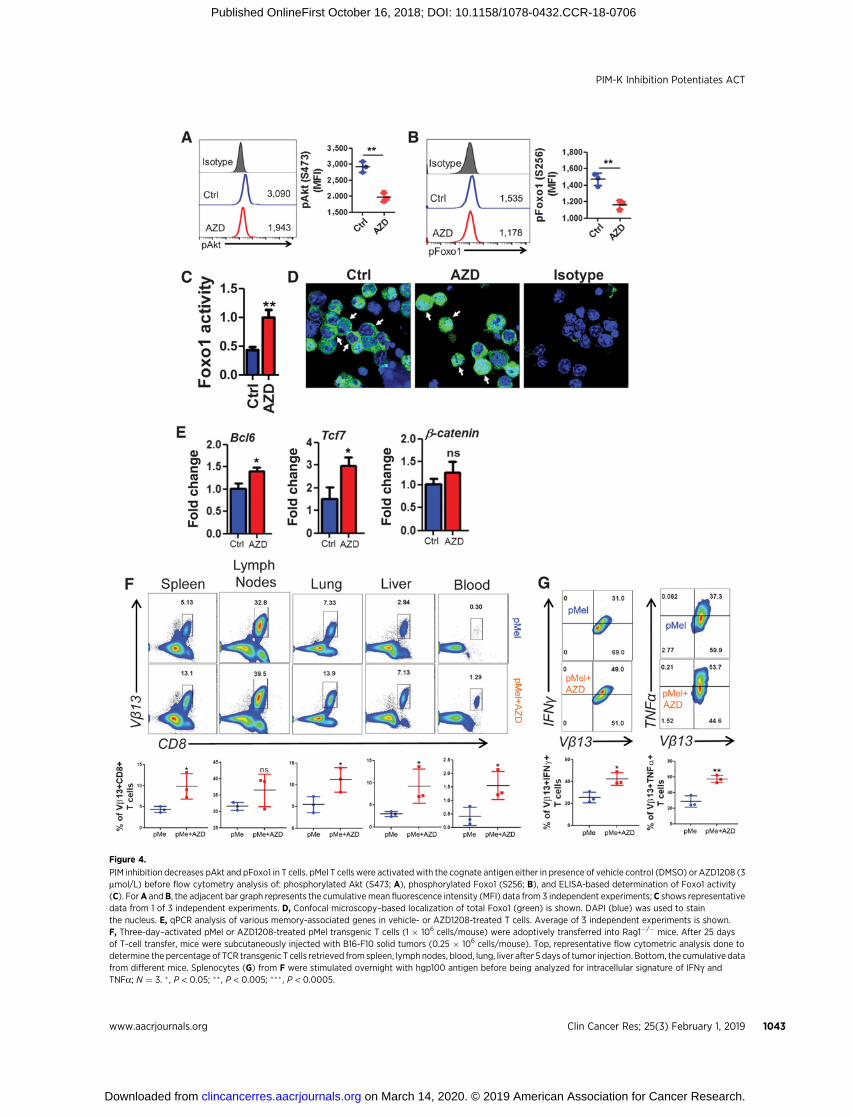
Figure 4.
PIM inhibition decreases pAkt and pFoxo1 in T cells. pMel T cells were activated with the cognate antigen either in presence of vehicle control (DMSO) or AZD1208 (3mmol/L) before flow cytometry analysis of: phosphorylated Akt (S473; A), phosphorylated Foxo1 (S256; B), and ELISA-based determination of Foxo1 activity(C). ForA andB, the adjacent bar graph represents the cumulative mean fluorescence intensity (MFI) data from 3 independent experiments; C shows representativedata from 1 of 3 independent experiments. D, Confocal microscopy–based localization of total Foxo1 (green) is shown. DAPI (blue) was used to stainthe nucleus. E, qPCR analysis of various memory-associated genes in vehicle- or AZD1208-treated T cells. Average of 3 independent experiments is shown.F, Three-day–activated pMel or AZD1208-treated pMel transgenic T cells (1 � 106 cells/mouse) were adoptively transferred into Rag1�/� mice. After 25 daysof T-cell transfer, mice were subcutaneously injected with B16-F10 solid tumors (0.25 � 106 cells/mouse). Top, representative flow cytometric analysis done todetermine the percentage of TCR transgenic T cells retrieved from spleen, lymph nodes, blood, lung, liver after 5 days of tumor injection. Bottom, the cumulative datafrom different mice. Splenocytes (G) from F were stimulated overnight with hgp100 antigen before being analyzed for intracellular signature of IFNg andTNFa; N ¼ 3. � , P < 0.05; �� , P < 0.005; ��� , P < 0.0005.
PIM-K Inhibition Potentiates ACT
www.aacrjournals.org Clin Cancer Res; 25(3) February 1, 2019 1043
on March 14, 2020. © 2019 American Association for Cancer Research. clincancerres.aacrjournals.org Downloaded from
Published OnlineFirst October 16, 2018; DOI: 10.1158/1078-0432.CCR-18-0706
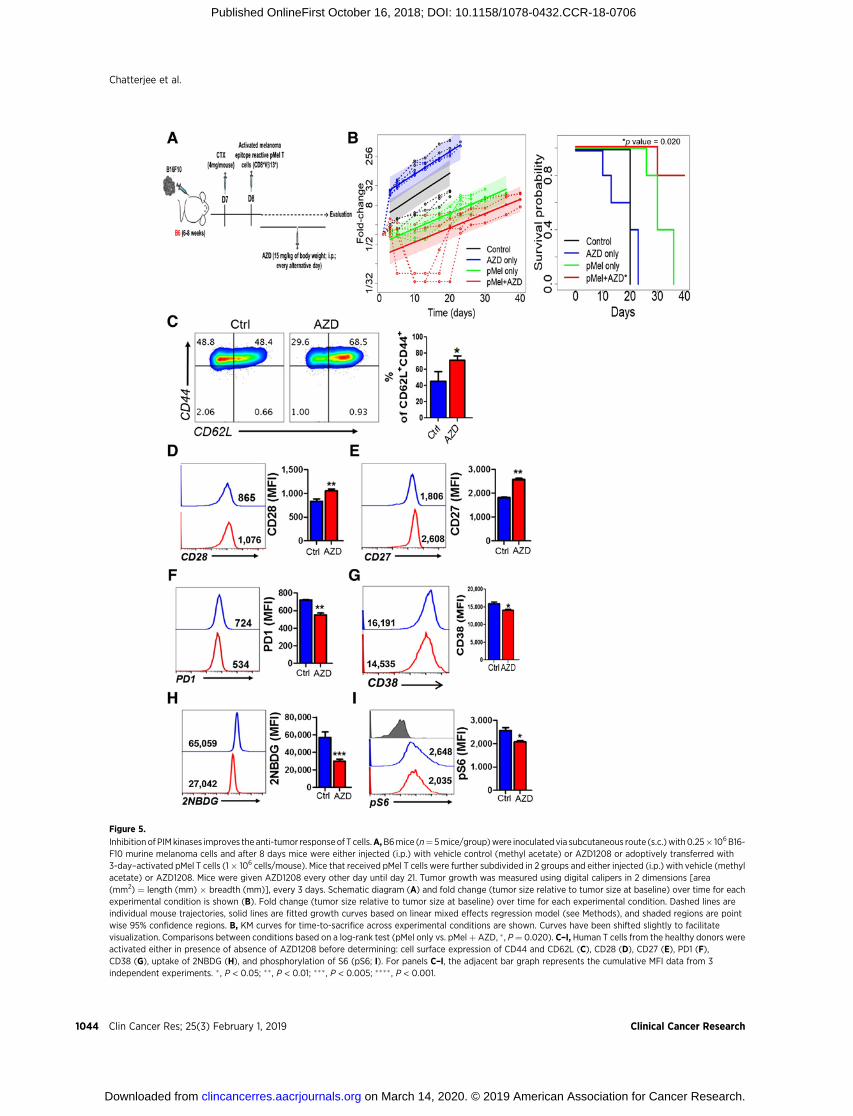
Figure 5.
Inhibition of PIMkinases improves the anti-tumor responseof T cells.A,B6mice (n¼ 5mice/group)were inoculated via subcutaneous route (s.c.)with0.25� 106B16-F10 murine melanoma cells and after 8 days mice were either injected (i.p.) with vehicle control (methyl acetate) or AZD1208 or adoptively transferred with3-day–activated pMel T cells (1� 106 cells/mouse). Mice that received pMel T cells were further subdivided in 2 groups and either injected (i.p.) with vehicle (methylacetate) or AZD1208. Mice were given AZD1208 every other day until day 21. Tumor growth was measured using digital calipers in 2 dimensions [area(mm2) ¼ length (mm) � breadth (mm)], every 3 days. Schematic diagram (A) and fold change (tumor size relative to tumor size at baseline) over time for eachexperimental condition is shown (B). Fold change (tumor size relative to tumor size at baseline) over time for each experimental condition. Dashed lines areindividual mouse trajectories, solid lines are fitted growth curves based on linear mixed effects regression model (see Methods), and shaded regions are pointwise 95% confidence regions. B, KM curves for time-to-sacrifice across experimental conditions are shown. Curves have been shifted slightly to facilitatevisualization. Comparisons between conditions based on a log-rank test (pMel only vs. pMelþ AZD, � , P¼ 0.020). C–I, Human T cells from the healthy donors wereactivated either in presence of absence of AZD1208 before determining: cell surface expression of CD44 and CD62L (C), CD28 (D), CD27 (E), PD1 (F),CD38 (G), uptake of 2NBDG (H), and phosphorylation of S6 (pS6; I). For panels C–I, the adjacent bar graph represents the cumulative MFI data from 3independent experiments. � , P < 0.05; ��, P < 0.01; ���, P < 0.005; ���� , P < 0.001.
Chatterjee et al.
Clin Cancer Res; 25(3) February 1, 2019 Clinical Cancer Research1044
on March 14, 2020. © 2019 American Association for Cancer Research. clincancerres.aacrjournals.org Downloaded from
Published OnlineFirst October 16, 2018; DOI: 10.1158/1078-0432.CCR-18-0706
compared with the untreated T cells. Moreover, as observed inmurine T cells, the human T cells activated in presence ofAZD1208 also showed reduced expression of PD1 (Fig. 5F)and CD38 (Fig. 5G) as compared with those activated withoutit. Next, we analyzed the metabolic phenotype of the humanT cells treated with PimKi and found that similar to the murineT cells, inhibition of PIM kinases significantly reduced theability of the human T cells to uptake fluorescent glucose (2-NBDG, Fig. 5H). These data indicate that, like in the mouse,inhibition of PIM kinases in human T cells hampered theirglycolytic activity, which was further correlated with thereduced phosphorylation of ribosomal protein S6 (pS6) inhuman T cells treated with AZD1208 (Fig. 5I).
To further evaluate whether ACT in the presence of PimKi isequally efficacious in controlling human tumors, we subcutane-ously established HLA-A2þ human melanoma 624MEL cells inNSG-A2 recipient mice. The h3T TCR transgenic mouse-derivedhuman tyrosinase epitope-reactive T cells were used for adoptivetransfer either alone or combined with AZD1208 treatment(Supplementary Fig. S3A). Our data show that human tumorsalso showed the similar trend with slower growth and bettersurvival in the mice that were treated with the combination ofPimKi and tumor-reactive T cells (Supplementary Fig. S3B andS3C).However, it seems that slow tumor growth was restricted tothe 3-week duration when the maintenance does of PimKi wasadministered [with P value being 0.0264 (d8), 0.001 (d15),0.0006 (d17), 0.0006 (d20), 01692 (d26)]. Thus, the strategy tocombine PimKi with ACT could be beneficial for achieving tumorcontrol in immunotherapy protocols, but may require a long-term pharmacologic inhibition of PimK.
The combination AZD1208 treatment with anti-PD1 antibodyfurther improves ACT
The murine B16F10 melanoma cell line is resistant to check-point blockade with antibodies targeting the PD-1 and/or CTLA-4receptors (46, 47). Therefore, strategies that could increase efficacyof immune checkpoint blockade are needed. Because PimKiincreased Tcm/Tscm phenotype, we hypothesized that a combi-natorial approach using anti-PD1 þ pan-PIM inhibitor þ adop-tive transfer of T cells (triple combination therapy, PPiT) couldimprove monotherapy with anti-PD1 or ACT. Our experimentsdemonstrated that PPiT worked the best in controlling growth ofestablished melanoma (Fig. 6A), and markedly enhanced thesurvival of tumor-bearing mice (Fig. 6B). Importantly, the tumorgrowth was significantly lower when Pmel T cells were adminis-tered with PimKi with anti-PD1 (brown solid curve, PPiT group)as compared with PimKi alone (red solid curve). However, thisreduced tumor growth in PPiT group was limited to the durationof PimKi administration, as the tumors grew back and reached tothe size similar to one's observed in the group treated with T cellsand AZD1208. The statistical analysis showed that as comparedwith Pmel group, PPiT group remained statistically significant(<0.0001) from day 8 to 32, whereas in Pmel þ AZD group, theP values were 0.0685 (d8), 0.012 (d11), 0.0083 (d13), 0.0081(d15), 0.0176 (d19), 0.0389 (d21), 0.2673 (d25), 0.5737 (d27,nonsignificant), and 0.5859 (d32, nonsignificant). Thus, it seemsthat the PPiT-treated group had a better overall tumor control ascompared with pMelþ AZD1208 group. These data indicate thatadding AZD1208 throughout the anti-PD1 regimen could havepotential clinical relevance for patients being treated with thisantibody.
To determine whether differences in T-cell migration or per-sistence played a role in the enhanced tumor control observedwith PPiT, we tracked the adoptively transferred T cells in thespleen, blood, and tumor site. A higher number of adoptivelytransferred gp100-reactive T cells were observed in mice thatreceived triple combination (Fig. 6C). Importantly, for PPiT-treated mice, expression of PD1 (Fig. 6D) and CD38 (Fig. 6E)was reduced in T cells retrieved from the tumor site, and there wasalso an increase in cytokine response (IFNg , TNFa) along withgranzyme B (Fig. 6F).We also observed that the expression of PD1and CD38 was considerably lower on adoptively transferred Tcells retrieved from the spleen or blood of tumor-bearing micereceiving PPiT (Fig. 6G and H). Moreover, the expression ofCXCR3, which correlates with the improved migration of theantitumor T cells to the tumor site, was also elevated on the tumorepitope–specific T cells from spleen or blood of tumor-bearingmice receiving PPiT (Fig. 6I and J). It must be noted that the datain Fig. 6C-I were generated when the tumor size in pMel þ AZDand PPiT group were almost similar, as the last administration ofPimKi was about 2 or more weeks before the experimentalendpoint, which would have resulted in the diminished PimKinhibition leading the tumor to grow after day 21 andmasking thedifferences in phenotype and function of infiltrated T cells.However, the data do indicate that PIM inhibitor and anti-PD1produced quantitative and qualitative changes in T-cell pheno-type that leads to long-lasting tumor control. Together, theseresults suggest that the PPiT strategy could be potentially trans-lated to clinics for targeting tumors where anti-PD1 therapy hasnot yielded durable antitumor control.
DiscussionStudies in animal models indicate that adoptive transfer of
long-lived, Tcm cells significantly improves their persistence andthe therapeutic efficacy of adoptive immunotherapies. However,most adoptive cell transfer (ACT) trials use rapidly expandedT cells, either TCR- or chimeric antigen receptor–engineered ortumor-infiltrating lymphocytes (TILs), that are terminally differ-entiated and/or have an Tem phenotype (1, 48). These terminallydifferentiated T cells also exhibit negative costimulatory mole-cules (i.e., CTLA4, PD1, Tim-3) that correlate with T-cell dysfunc-tionality or exhaustion and have limited life span in vivo, makingthem less likely to mediate clinical responses (49, 50). On thebasis of the promising results seen when using checkpoint block-ade, it is important that themechanisms underlying the resistanceto these therapies are better understood and targeted for increas-ing the efficacy of tumor control across various tumor types (51–53). Thus, strategies that could potentiate antitumor immuno-therapy are needed.
The 3 Pim kinases are members of a small family of serine/threonine kinases regulating several signaling pathways thatare fundamental to cancer development and progression (54).It has been shown that similar to the rapamycin target TOR, thePim kinases also contribute to the regulation of lymphocytegrowth and proliferation (55). This study also showed thatPIM1�/�PIM2�/� T cells have increased sensitivity to rapamycin.Because rapamycin-mediated mTOR inhibition has beenshown to increase the T-cell memory response (13, 56, 57), wehypothesized that targeting PIM kinases could produce an evenstronger T-cell memory phenotype and thereby potentiate tumorcontrol.We showhere that combining PIMkinase inhibitionwith
www.aacrjournals.org Clin Cancer Res; 25(3) February 1, 2019 1045
PIM-K Inhibition Potentiates ACT
on March 14, 2020. © 2019 American Association for Cancer Research. clincancerres.aacrjournals.org Downloaded from
Published OnlineFirst October 16, 2018; DOI: 10.1158/1078-0432.CCR-18-0706
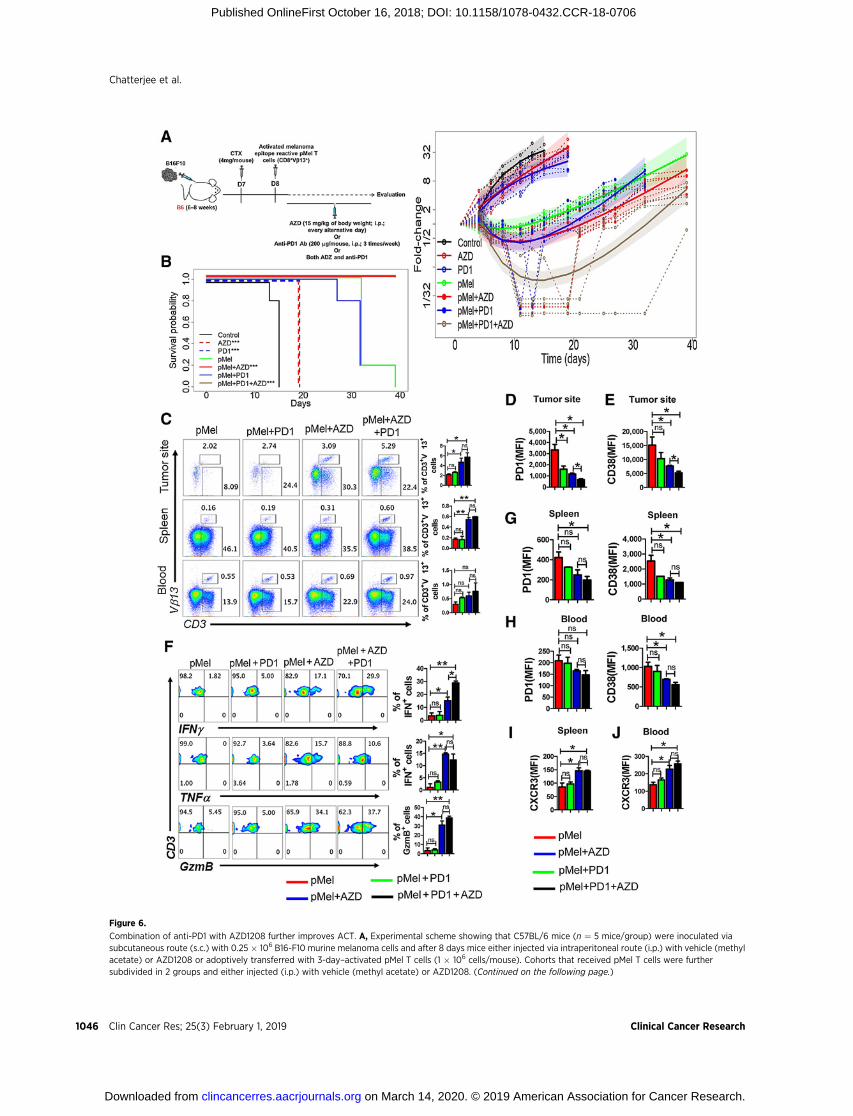
Figure 6.
Combination of anti-PD1 with AZD1208 further improves ACT. A, Experimental scheme showing that C57BL/6 mice (n ¼ 5 mice/group) were inoculated viasubcutaneous route (s.c.) with 0.25 � 106 B16-F10 murine melanoma cells and after 8 days mice either injected via intraperitoneal route (i.p.) with vehicle (methylacetate) or AZD1208 or adoptively transferred with 3-day–activated pMel T cells (1 � 106 cells/mouse). Cohorts that received pMel T cells were furthersubdivided in 2 groups and either injected (i.p.) with vehicle (methyl acetate) or AZD1208. (Continued on the following page.)
Clin Cancer Res; 25(3) February 1, 2019 Clinical Cancer Research1046
Chatterjee et al.
on March 14, 2020. © 2019 American Association for Cancer Research. clincancerres.aacrjournals.org Downloaded from
Published OnlineFirst October 16, 2018; DOI: 10.1158/1078-0432.CCR-18-0706
anti-PD1 antibody renders T cells with Tcm/Tscm phenotype,which is maintained in vivo, and improves tumor control whenthis approach is used to treat poorly immunogenic murinemelanoma B16-F10 tumors. Importantly, the TILs obtained fromthe tumors of groups that were treatedwith PIM inhibitor showeddecreased expression of both CD38 and PD1. A recent study hasshown that discrete chromatin states correlate with reprogramm-ability and surface protein expression profiles, where high CD38expression was associated with nonreprogrammable PD1hi dys-functional T cells within heterogeneous T-cell populations (58).Reduced CD38 expression has also been shown to result inincreased levels of NADþ within the T cells, which rendersantitumor T cells with a "metabolic fitness" and result inimproved tumor control (27). Thus, maintaining high NADþ byblocking CD38 expression due to PIM inhibition may have alsocontributed to the improved tumor response and needs to befurther investigated.
It has been shown that blocking T-cell differentiation promotesthe generation of Tscm cells with CD44loCD62LhiSca-1hi pheno-type that exhibit enhanced antitumor capacity (20). However, weobserved that inhibition of PIM kinase leads to enhanced Tscmphenotype without hampering T-cell activation, which could bedue to differences in phosphorylation status of its downstreamsubstrates that are involved in cellular differentiation (59). To ourknowledge, the synergy between adoptive T-cell immunotherapy,checkpoint blockade, and a protein kinase inhibitor, reported inthis study, to significantly increase tumor control has not beendemonstrated earlier.
PIM kinase and Akt are the 2 pro-survival kinases that arecommonly amplified in cancer (60), and they are also known tocross-talk (60). These oncogenic proteins are serine/threoninekinases that phosphorylate various substrates that control the cellcycle, cellular metabolism, proliferation, and survival (60). Weobserved that PimKi-treated T cells also exhibited reduced phos-phorylation of Foxo, which is mediated by phosphorylated Akt(61). Foxo1 is required to maintain na€�ve T-cell homeostasisthrough the regulation of several genes crucially involved in T-celltrafficking and survival (44). The Foxo subfamily of transcriptionfactors also has a highly conserved role in the regulation of lifespan, cell-cycle progression, apoptosis, glucose metabolism, andstress resistance, which works by integrating information pertain-ing to the abundance of nutrients, growth factors and stress signals(45). The increased nuclear retention of Foxo1 that correlates withits enhanced functional activity was likely responsible for the shiftto a Tcm phenotype and higher levels of its downstream tran-scriptional target, that is, CD62L (42). Systemic administration ofPimKi in our approach could also have resulted in the continuous
activity of Foxo1, which has recently been shown to be requiredfor preventing anergy andmaintaining thememory state of CD8þ
T cells (62).Our data also suggest that PIM kinases positively regulate
glycolysis in T cells and its inhibition leads to reduced glycolysis,increased persistence, and enhanced tumor control. These datarecapitulate the previous striking observation that inhibition ofglycolysis in T cells potentiates tumor control by increasing per-sistence andmaintaining effector function in vivo (6). The systemicadministration of pan-PIM inhibitor may also havemetabolicallymodulated other endogenous lymphoid and myeloid cells of thetumor-bearing host. Inhibition of mTOR promotes dendritic cell(DC) activation and enhances T-cell response upon vaccination(63). The improved performance ofDCs inwhichmTORhas beeninhibited is correlated with an extended lifespan following acti-vation and a prolonged increase in expression of costimulatorymolecules (63). A recent study has also shown that glucose-deprivedGM-DCs demonstrate increased costimulatorymoleculeand IL12 expression, signals known to be important for theinduction of T-cell proliferation and the acquisition of T-celleffector function (64). Foxo1 also induces DC activity by regulat-ing ICAM-1 and CCR7 (65) by binding to the CCR7 and ICAM-1promoters, stimulatingCCR7 and ICAM-1 transcriptional activity,and regulating their expression (65).
We observed that inhibition of PIM kinase does affect thehuman T-cell survival and function. While there was an increasein Tcm phenotype, we also noticed reduced pFoxo, pAkt, andenhanced Foxo activity in AZD1208-treated T cells in vitro. TheFOXObinding site (TGTTTAC) and several FOXO target genes areconserved from worms to mammals, raising the possibility thatthe PIM-mediated regulation of FOXO-dependent transcriptionmay be conserved across species (66). We also noticed increasedCD28, a positive costimulatorymolecule that controls mitochon-drial dynamics and metabolic fate of T cells (67). Thus, thelikelihood of translating the PPiT strategy into patients is high,as this combination approach may have the potential to increasetumor control by metabolically altering T cells in the tumormicroenvironment.
Although our data demonstrate that PimKi-treated T cells havereduced pAkt, pFoxo, and pS6, there still could be various sub-strates that may be hypophosphorylated, causing differences inTCR signaling ormetabolic signaling. Recently, the role of proteinphosphorylation as a major switch mechanism for metabolicregulation has been discussed (68). Protein kinases phosphory-late a substrate, modulating its activity. While it seems simple,multiple kinases can phosphorylate the same substrates, mostlyon different sites within the same protein. This could lead to a
(Continued.) Both AZD1208 and anti-PD1 Ab were given every other day until day 21. Tumor growth was measured in 2 dimensions [area (mm2) ¼ length(mm)� breadth (mm)], using digital calipers every 3 days. Right, shows fold-change (tumor size relative to tumor size at baseline) over time for each experimentalcondition. Dashed lines are individual mouse trajectories, solid lines are fitted growth curves based on linear mixed effects regression model (see text),and shaded regions are point wise 95% confidence regions. B, KM curves for time-to-sacrifice across experimental conditions are shown. Curves havebeen shifted slightly to facilitate visualization. Comparisons relative to control based on log-rank tests (control vs. AZD,P¼0.0035; control vs. PD1, P¼0.0035; pMelvs. pMel þ AZD, P ¼ 0.0016; pMel vs. pMel þ PD1 þ AZD, P ¼ 0.0016). C, Frequency of adoptively transferred pMel T cells (Vb13þCD3þ) present at the tumorsite, in spleen, and in blood of the tumor-bearing mice 30 days following ACT. Adjacent bar graph represents the cumulative data of frequency of Vb13þCD3þ cellsfrom 3 excremental mice. Tumor-infiltrating T cells retrieved from the tumor-bearing mice on day 30 were used to determine either surface expressionof PD1 (D) and CD38 (E) orwere activated in vitrowith PMA and ionomycin and assessed for intercellular IFNg , TNFa, and GzmBproduction using flow cytometry (F).For F, the adjacent bar graph represents the cumulative data of frequency of cytokine-secreting cells from 3 excremental mice. G–J, Bar diagramsrepresent the cumulative data ofMFI of the cell surface expression of either PD1 andCD38 or CXCR3 on the adoptively transferredVb13þCD3þT cells present either inthe spleen (G and I) or blood (H and J) of tumor-bearing mice. � , P < 0.05; �� , P < 0.01; ��� , P < 0.005; ���� , P < 0.001.
www.aacrjournals.org Clin Cancer Res; 25(3) February 1, 2019 1047
PIM-K Inhibition Potentiates ACT
on March 14, 2020. © 2019 American Association for Cancer Research. clincancerres.aacrjournals.org Downloaded from
Published OnlineFirst October 16, 2018; DOI: 10.1158/1078-0432.CCR-18-0706
highly connected network of metabolic control points. Futurestudies will be needed to identify the differences in phosphory-lation state of different PIM substrates within diverse immunecells. These findings could help us identify the specific signalingpathways that are altered by kinase inhibitors and contribute totumor control.
While we do observe high levels of effector cytokines (IFNg ,TNFa), along with enhanced levels of the cytolytic molecule,granzyme B, and reduced T-cell exhaustion in the AZD1208- orPPiT-treated tumor-bearing animals, the administration ofAZD1208 alone did not produce significant tumor control;thus, it is likely that this agent may affect tumor or themicroenvironment, making the tumor more susceptible to lysisby adoptively transferred T cells, which alone were also lesseffective, yet in contrast these cells had remarkably preservedeffector function and stemness in the PPiT treatment group.Identifying targets of modulation within transferred or hostimmune cells when using the PPiT strategy will be importantfor designing future target-specific trials. Similarly, elucidatingthe role of individual PIM isoforms in T cells would be requiredto refine this approach for boosting antitumor T-cell effectorand memory responses (69, 70). Importantly, this study estab-lishes that strategies that target tumor tissues and boost the hostimmune response have the potential for achieving long-termtumor control.
Disclosure of Potential Conflicts of InterestNo potential conflicts of interest were disclosed.
Authors' ContributionsConception and design: S. Chatterjee, P. Chakraborty, C. Krieg, C. Beeson,J.C. Rathmell, X.-Z. Yu, A.S. Kraft, S. MehrotraDevelopment of methodology: P. Chakraborty, A. Daenthanasanmak,S. Iamsawat, C. Beeson, S. MehrotraAcquisition of data (provided animals, acquired and managed patients,provided facilities, etc.): P. Chakraborty, A. Daenthanasanmak, S. Iamsawat,G. Andrejeva, L.A. Luevano, U. Baliga, C. Beeson, M. Mehrotra, J.C. RathmellAnalysis and interpretation of data (e.g., statistical analysis, biostatistics,computational analysis): S. Chatterjee, P. Chakraborty, G. Andrejeva,M.M. Wolf, C. Beeson, E.G. Hill, X.-Z. YuWriting, review, and/or revision of the manuscript: S. Chatterjee,P. Chakraborty, U. Baliga, C. Krieg, M. Mehrotra, E.G. Hill, X.-Z. Yu,A.S. Kraft, S. MehrotraAdministrative, technical, or material support (i.e., reporting or organizingdata, constructing databases): A.S. KraftStudy supervision: C. Beeson, S. Mehrotra
AcknowledgmentsThe work was supported in part by NIH grants R21CA137725,
R01CA138930, and P01CA154778 subcontract (to S.Mehrotra). Support fromHollings Cancer Center Shared Resources (partly supported by P30 CA138313)at MUSC is also acknowledged. This study was also supported by Universityof Arizona Cancer Center support grant P30CA023074, NIH awardR01CA173200, and DOD award W81XWH-12-1-0560 (to A.S. Kraft).
The costs of publication of this articlewere defrayed inpart by the payment ofpage charges. This article must therefore be hereby marked advertisement inaccordance with 18 U.S.C. Section 1734 solely to indicate this fact.
Received March 2, 2018; revised June 29, 2018; accepted October 10, 2018;published first October 16, 2018.
References1. Yang JC, Rosenberg SA. Adoptive T-cell therapy for cancer. Adv Immunol
2016;130:279–94.2. Fesnak AD, June CH, Levine BL. Engineered T cells: the promise and
challenges of cancer immunotherapy. Nat Rev Cancer 2016;16:566–81.3. Sugiura A, Rathmell JC. Metabolic barriers to T cell function in tumors.
J Immunol 2018;200:400–7.4. Chang CH, Curtis JD, Maggi LB Jr, Faubert B, Villarino AV, O'Sullivan D,
et al. Posttranscriptional control of T cell effector function by aerobicglycolysis. Cell 2013;153:1239–51.
5. Cham CM, Gajewski TF. Glucose availability regulates IFN-gamma pro-duction and p70S6 kinase activation in CD8þ effector T cells. J Immunol2005;174:4670–7.
6. SukumarM, Liu J, Ji Y, SubramanianM,Crompton JG, YuZ, et al. Inhibitingglycolytic metabolism enhances CD8þ T cell memory and antitumorfunction. J Clin Invest 2013;123:4479–88.
7. van der Windt GJ, Everts B, Chang CH, Curtis JD, Freitas TC, Amiel E, et al.Mitochondrial respiratory capacity is a critical regulator of CD8þ T cellmemory development. Immunity 2012;36:68–78.
8. van der Windt GJ, Pearce EL. Metabolic switching and fuel choice duringT-cell differentiation and memory development. Immunol Rev 2012;249:27–42.
9. van der Windt GJ, O'Sullivan D, Everts B, Huang SC, Buck MD, Curtis JD,et al. CD8memory T cells have abioenergetic advantage that underlies theirrapid recall ability. Proc Natl Acad Sci U S A 2013;110:14336–41.
10. Gattinoni L, Klebanoff CA, Restifo NP. Pharmacologic induction of CD8þT cell memory: better living through chemistry. Sci Transl Med 2009;1:11ps2.
11. Li Q, Rao R, Vazzana J, Goedegebuure P, Odunsi K, Gillanders W, et al.Regulating mammalian target of rapamycin to tune vaccination-induced CD8(þ) T cell responses for tumor immunity. J Immunol2012;188:3080–7.
12. Li Q, Rao RR, Araki K, Pollizzi K, Odunsi K, Powell JD, et al. A central rolefor mTOR kinase in homeostatic proliferation induced CD8þ T cellmemory and tumor immunity. Immunity 2011;34:541–53.
13. Srivastava RK, Utley A, Shrikant PA. Rapamycin: a rheostat for CD8(þ)T-cell-mediated tumor therapy. Oncoimmunology 2012;1:1189–90.
14. Crompton JG, Sukumar M, Restifo NP. Targeting Akt in cell transferimmunotherapy for cancer. Oncoimmunology 2016;5:e1014776.
15. Crompton JG, SukumarM, Roychoudhuri R, Clever D, Gros A, Eil RL, et al.Akt inhibition enhances expansion of potent tumor-specific lymphocyteswith memory cell characteristics. Cancer Res 2015;75:296–305.
16. Klebanoff CA, Crompton JG, Leonardi AJ, Yamamoto TN, Chandran SS, EilRL, et al. Inhibition of AKT signaling uncouples T cell differentiation fromexpansion for receptor-engineered adoptive immunotherapy. JCI Insight2017;2(23). pii: 95103.
17. SukumarM, Roychoudhuri R, RestifoNP.Nutrient competition: a new axisof tumor immunosuppression. Cell 2015;162:1206–8.
18. Gattinoni L, Klebanoff CA, Restifo NP. Paths to stemness: building theultimate antitumour T cell. Nat Rev Cancer 2012;12:671–84.
19. Gattinoni L, Speiser DE, Lichterfeld M, Bonini C. T memory stem cells inhealth and disease. Nat Med 2017;23:18–27.
20. Gattinoni L, Zhong XS, Palmer DC, Ji Y, Hinrichs CS, Yu Z, et al. Wntsignaling arrests effector T cell differentiation and generatesCD8þmemorystem cells. Nat Med 2009;15:808–13.
21. Gattinoni L, Lugli E, Ji Y, Pos Z, Paulos CM, Quigley MF, et al. A humanmemory T cell subset with stem cell-like properties. Nat Med 2011;17:1290–7.
22. SantioNM, Koskinen PJ. PIM kinases: From survival factors to regulators ofcell motility. Int J Biochem Cell Biol 2017;93:74–85.
23. Rebello RJ, Huglo AV, Furic L. PIM activity in tumours: A key node oftherapy resistance. Adv Biol Regul 2018;67:163–9.
24. Zhang Y, Wang Z, Li X, Magnuson NS. Pim kinase-dependent inhibition ofc-Myc degradation. Oncogene 2008;27:4809–19.
25. Casey SC, Tong L, Li Y, Do R,Walz S, Fitzgerald KN, et al.MYC regulates theantitumor immune response through CD47 and PD-L1. Science 2016;352:227–31.
26. MYC promotes tumorigenesis via activation of CD47 and PD-L1.Cancer Discov 2016;6:472.
Clin Cancer Res; 25(3) February 1, 2019 Clinical Cancer Research1048
Chatterjee et al.
on March 14, 2020. © 2019 American Association for Cancer Research. clincancerres.aacrjournals.org Downloaded from
Published OnlineFirst October 16, 2018; DOI: 10.1158/1078-0432.CCR-18-0706
27. Chatterjee S, Daenthanasanmak A, Chakraborty P, Wyatt MW, Dhar P,Selvam SP, et al. CD38-NAD(þ)Axis regulates immunotherapeutic anti-tumor T cell response. Cell Metab 2018;27:85–100.
28. Royston P, SauerbreiW.Anewmeasure of prognostic separation in survivaldata. Stat Med 2004;23:723–48.
29. Chang CH, Pearce EL. Emerging concepts of T cell metabolism as a target ofimmunotherapy. Nat Immunol 2016;17:364–8.
30. Sena LA, Li S, Jairaman A, Prakriya M, Ezponda T, Hildeman DA, et al.Mitochondria are required for antigen-specific T cell activation throughreactive oxygen species signaling. Immunity 2013;38:225–36.
31. Warfel NA, Sainz AG, Song JH, Kraft AS. PIM Kinase inhibitors kill hypoxictumor cells by reducing Nrf2 signaling and increasing reactive oxygenspecies. Mol Cancer Ther 2016;15:1637–47.
32. De Rosa V, Galgani M, Porcellini A, Colamatteo A, Santopaolo M,Zuchegna C, et al. Glycolysis controls the induction of human regulatoryT cells by modulating the expression of FOXP3 exon 2 splicing variants.Nat Immunol 2015;16:1174–84.
33. Taylor A, Rudd CE. Glycogen synthase kinase 3 inactivation compen-sates for the lack of CD28 in the priming of CD8(þ) cytotoxic T-cells:implications for anti-PD-1 immunotherapy. Front Immunol 2017;8:1653.
34. Taylor A, Harker JA, Chanthong K, Stevenson PG, Zuniga EI, Rudd CE.Glycogen synthase kinase 3 inactivation drives T-bet-mediated downre-gulation of co-receptor PD-1 to enhance CD8(þ) cytolytic T cell responses.Immunity 2016;44:274–86.
35. Bollum LK, Huse K, Oksvold MP, Bai B, Hilden VI, Forfang L, et al.BMP-7 induces apoptosis in human germinal center B cells and isinfluenced by TGF-beta receptor type I ALK5. PLoS One 2017;12:e0177188.
36. Giangreco A, Hoste E, Takai Y, Rosewell I, Watt FM. Epidermal Cadm1expression promotes autoimmune alopecia via enhanced T cell adhesionand cytotoxicity. J Immunol 2012;188:1514–22.
37. MandalM, Borowski C, Palomero T, Ferrando AA, Oberdoerffer P, Meng F,et al. The BCL2A1 gene as a pre-T cell receptor-induced regulator ofthymocyte survival. J Exp Med 2005;201:603–14.
38. Mendel I, Shevach EM. Activated T cells express the OX40 ligand: require-ments for induction and costimulatory function. Immunology 2006;117:196–204.
39. Garre P, Briceno V, Xicola RM,Doyle BJ, de laHoyaM, Sanz J, et al. Analysisof the oxidative damage repair genes NUDT1, OGG1, and MUTYH inpatients frommismatch repair proficient HNPCC families (MSS-HNPCC).Clin Cancer Res 2011;17:1701–12.
40. Braso-Maristany F, Filosto S, Catchpole S, Marlow R, Quist J, Francesch-Domenech E, et al. PIM1 kinase regulates cell death, tumor growth andchemotherapy response in triple-negative breast cancer. Nat Med 2016;22:1303–13.
41. Unsoeld H, Pircher H. Complex memory T-cell phenotypes revealed bycoexpression of CD62L and CCR7. J Virol 2005;79:4510–3.
42. Kerdiles YM, Beisner DR, Tinoco R, Dejean AS, Castrillon DH, DePinhoRA, et al. Foxo1 links homing and survival of naive T cells by regulatingL-selectin, CCR7 and interleukin 7 receptor. Nat Immunol 2009;10:176–84.
43. Fabre S, Carrette F, Chen J, Lang V, SemichonM,Denoyelle C, et al. FOXO1regulates L-Selectin and a network of human T cell homing moleculesdownstream of phosphatidylinositol 3-kinase. J Immunol 2008;181:2980–9.
44. Deng Y, Wang F, Hughes T, Yu J. FOXOs in cancer immunity: Knowns andunknowns. Semin Cancer Biol 2018;50:53–64.
45. Hedrick SM,HessMichelini R, Doedens AL, Goldrath AW, Stone EL. FOXOtranscription factors throughout T cell biology. Nat Rev Immunol2012;12:649–61.
46. van Elsas A, Hurwitz AA, Allison JP. Combination immunotherapy ofB16 melanoma using anti-cytotoxic T lymphocyte-associated antigen 4(CTLA-4) and granulocyte/macrophage colony-stimulating factor (GM-CSF)-producing vaccines induces rejection of subcutaneous and meta-static tumors accompanied by autoimmune depigmentation. J Exp Med1999;190:355–66.
47. Chen S, Lee LF, Fisher TS, Jessen B, Elliott M, EveringW, et al. Combinationof 4–1BB agonist and PD-1 antagonist promotes antitumor effector/memory CD8 T cells in a poorly immunogenic tumor model. CancerImmunol Res 2015;3:149–60.
48. Feldman SA, Assadipour Y, Kriley I, Goff SL, Rosenberg SA. Adoptive celltherapy–tumor-infiltrating lymphocytes, T-cell receptors, and chimericantigen receptors. Semin Oncol 2015;42:626–39.
49. Roychoudhuri R, Eil RL, RestifoNP. The interplay of effector and regulatoryT cells in cancer. Curr Opin Immunol 2015;33:101–11.
50. Gurusamy D, Clever D, Eil R, Restifo NP. Novel "elements" of immunesuppression within the tumor microenvironment. Cancer Immunol Res2017;5:426–33.
51. Ye Z,QianQ, JinH,QianQ.Cancer vaccine: learning lessons from immunecheckpoint inhibitors. J Cancer 2018;9:263–8.
52. Robert L, Ribas A, Hu-Lieskovan S. Combining targeted therapy withimmunotherapy. Can 1þ1 equal more than 2? Semin Immunol 2016;28:73–80.
53. Nowicki TS, Hu-Lieskovan S, Ribas A. Mechanisms of Resistance to PD-1and PD-L1 Blockade. Cancer J 2018;24:47–53.
54. Swords R, Kelly K, Carew J, Nawrocki S, Mahalingam D, Sarantopoulos J,et al. The Pim kinases: new targets for drug development. Curr Drug Targets2011;12:2059–66.
55. Fox CJ, Hammerman PS, Thompson CB. The Pim kinases control rapa-mycin-resistant T cell survival and activation. J ExpMed 2005;201:259–66.
56. Kesarwani P, Al-Khami AA, Scurti G, Thyagarajan K, Kaur N, Husain S, et al.Promoting thiol expression increases the durability of antitumor T-cellfunctions. Cancer Res 2014;74:6036–47.
57. Araki K, Youngblood B, AhmedR. The role ofmTOR inmemoryCD8T-celldifferentiation. Immunol Rev 2010;235:234–43.
58. Philip M, Fairchild L, Sun L, Horste EL, Camara S, Shakiba M, et al.Chromatin states define tumour-specific T cell dysfunction and reprogram-ming. Nature 2017;545:452–6.
59. Amaravadi R, Thompson CB. The survival kinases Akt and Pim as potentialpharmacological targets. J Clin Invest 2005;115:2618–24.
60. Warfel NA, Kraft AS. PIMkinase (and Akt) biology and signaling in tumors.Pharmacol Ther 2015;151:41–9.
61. Tzivion G, Dobson M, Ramakrishnan G. FoxO transcription factors;regulation by AKT and 14–3–3 proteins. BiochimBiophys Acta 2011;1813:1938–45.
62. Delpoux A,Michelini RH, Verma S, Lai CY,Omilusik KD,Utzschneider DT,et al. Continuous activity of Foxo1 is required to prevent anergy andmaintain the memory state of CD8(þ) T cells. J Exp Med 2018;215:575–94.
63. Amiel E, Everts B, Freitas TC, King IL, Curtis JD, Pearce EL, et al. Inhibitionof mechanistic target of rapamycin promotes dendritic cell activation andenhances therapeutic autologous vaccination in mice. J Immunol2012;189:2151–8.
64. Lawless SJ, Kedia-Mehta N, Walls JF, McGarrigle R, Convery O, Sinclair LV,et al. Glucose represses dendritic cell-induced T cell responses. Nat Com-mun 2017;8:15620.
65. Dong G, Wang Y, Xiao W, Pacios Pujado S, Xu F, Tian C, et al. FOXO1regulates dendritic cell activity through ICAM-1 and CCR7. J Immunol2015;194:3745–55.
66. Webb AE, Kundaje A, Brunet A. Characterization of the direct targets ofFOXO transcription factors throughout evolution. Aging Cell 2016;15:673–85.
67. Klein Geltink RI, O'Sullivan D, Corrado M, Bremser A, Buck MD, BuescherJM, et al. Mitochondrial priming by CD28. Cell 2017;171:385–97.
68. Humphrey SJ, James DE, Mann M. Protein phosphorylation: a majorswitch mechanism for metabolic regulation. Trends Endocrinol Metab2015;26:676–87.
69. Knudson KM, Pritzl CJ, Saxena V, Altman A, Daniels MA, Teixeiro E.NFkappaB-Pim-1-Eomesodermin axis is critical formaintainingCD8T-cellmemory quality. Proc Natl Acad Sci U S A 2017;114:E1659–E67.
70. Daenthanasanmak A,Wu Y, Iamsawat S, NguyenHD, Bastian D, ZhangM,et al. PIM-2 protein kinase negatively regulates T cell responses in trans-plantation and tumor immunity. J Clin Invest 2018;128:2787–2801.
www.aacrjournals.org Clin Cancer Res; 25(3) February 1, 2019 1049
PIM-K Inhibition Potentiates ACT
on March 14, 2020. © 2019 American Association for Cancer Research. clincancerres.aacrjournals.org Downloaded from
Published OnlineFirst October 16, 2018; DOI: 10.1158/1078-0432.CCR-18-0706
2019;25:1036-1049. Published OnlineFirst October 16, 2018.Clin Cancer Res Shilpak Chatterjee, Paramita Chakraborty, Anusara Daenthanasanmak, et al. Immunotherapeutic Antitumor T-cell ResponseTargeting PIM Kinase with PD1 Inhibition Improves
Updated version
10.1158/1078-0432.CCR-18-0706doi:
Access the most recent version of this article at:
Material
Supplementary
http://clincancerres.aacrjournals.org/content/suppl/2018/10/16/1078-0432.CCR-18-0706.DC1
Access the most recent supplemental material at:
Cited articles
http://clincancerres.aacrjournals.org/content/25/3/1036.full#ref-list-1
This article cites 69 articles, 22 of which you can access for free at:
Citing articles
http://clincancerres.aacrjournals.org/content/25/3/1036.full#related-urls
This article has been cited by 1 HighWire-hosted articles. Access the articles at:
E-mail alerts related to this article or journal.Sign up to receive free email-alerts
Subscriptions
Reprints and
To order reprints of this article or to subscribe to the journal, contact the AACR Publications Department at
Permissions
Rightslink site. Click on "Request Permissions" which will take you to the Copyright Clearance Center's (CCC)
.http://clincancerres.aacrjournals.org/content/25/3/1036To request permission to re-use all or part of this article, use this link
on March 14, 2020. © 2019 American Association for Cancer Research. clincancerres.aacrjournals.org Downloaded from
Published OnlineFirst October 16, 2018; DOI: 10.1158/1078-0432.CCR-18-0706


![Hexaaquanickel(II) tetraaquabis([mu]-pyridine-2,6 ......phen (198 mg, 1 mmol) in 1:2:2 molar ratio was added. The final volume was 40 ml. After less than 1 h stirring and heating,](https://img.pdfslide.org/doc/110x75/5fca6c5bcf45471d5c4977e1/hexaaquanickelii-tetraaquabismu-pyridine-26-phen-198-mg-1-mmol.jpg)