Embed Size (px)
Citation preview
Untersuchungen zur Produktion und zum mikrobiellen
Umsatz von β-Dimethylsulphoniopropionat
Dissertation
zur Erlangung des Doktorgrades
der Mathematisch-Naturwissenschaftlichen Fakultät
der Christian-Albrechts-Universität
zu Kiel
vorgelegt von
Wilhelm Gaul
Kiel
2004

2

3
Referentin: Professor Dr. Karin Lochte Korreferent: Professor Dr. Gunter O. Kirst Tag der mündlichen Prüfung: 01.02.2005 Zum Druck genehmigt: Kiel, den
Der Dekan

4

5
Hiermit erkläre ich, dass ich die vorliegende Arbeit selbständig und ohne unerlaubte Hilfen
erstellt habe. Ferner habe ich weder diese noch eine ähnliche Arbeit an einer anderen Abteilung
oder Hochschule im Rahmen eines Prüfungsverfahrens vorgelegt, veröffentlicht oder zur
Veröffentlichung vorgelegt.
_________________________ (Wilhelm Gaul )
6
Untersuchungen zur Produktion und zum mikrobiellen Umsatz von
β-Dimethylsulphoniopropionat
Inhaltsverzeichnis
1 EINLEITUNG __________________________________________________________ 8
1.1 Die geochemische Bedeutung des DMSP ______________________________________ 8
1.2 Die biologische Funktion des DMSP _________________________________________ 9
1.3 Ziel der Untersuchungen __________________________________________________ 11
2 NITROGEN-RELATED VERSUS SPECIES-SPECIFIC VARIABILITY OF THE DMSP PRODUCTION IN MARINE PHYTOPLANKTON_______ 13
2.1 Abstract_________________________________________________________________ 13
2.2 Introduction ____________________________________________________________ 14
2.3 Materials and methods ___________________________________________________ 15
2.4 Results _________________________________________________________________ 19
2.5 Discussion ______________________________________________________________ 28
3 SEASONAL DYNAMICS IN PRODUCTION AND TURNOVER OF DMSP IN THE NORTH-SEA _____________________________________________________ 34
3.1 Abstract________________________________________________________________ 34
3.2 Introduction ____________________________________________________________ 35
3.3 Methods________________________________________________________________ 35
3.4 Results _________________________________________________________________ 40
3.5 Discussion ______________________________________________________________ 49
7
4 THE MICROBIAL DECOMPOSITION OF DISSOLVED DMSP AND ITS NUTRIENT DEPENDENT DMS YIELDS IN THE TROPICAL ATLANTIC ______________________________________________________________ 57
4.1 Abstract________________________________________________________________ 57
4.2 Introduction ____________________________________________________________ 57
4.3 Materials and Methods ___________________________________________________ 59
4.4 Results _________________________________________________________________ 63
4.5 Discussion ______________________________________________________________ 69
5 ZUSAMMENFASSUNG UND SCHLUSSBETRACHTUNGEN _________ 73
6 KURZFASSUNG_______________________________________________________ 79
7 SUMMARY ____________________________________________________________ 80
8 LITERATUR __________________________________________________________ 81
9 ANHANG ______________________________________________________________ 86
8
1 Einleitung 1.1 Die geochemische Bedeutung des DMSP
Die Produktion des Zellstoffwechsel-kompatiblen Osmolyten β-Dimethylsulphoniopropionat
(DMSP, (CH3)2S+(CH2)2COO-) durch marine Planktonalgen hat in den vergangenen Jahrzehnten
ein stark zunehmendes Interesse erfahren (Stefels 2000, Kiene et al. 2000, Simó 2001), vor
allem weil eines der enzymatischen Spaltprodukte des DMSP, das Dimethylsulfid (DMS,
CH3)2S) als die häufigste leicht flüchtige Schwefelverbindung des Ozeans identifiziert wurde
(Lovelock et al. 1972, Andreae 1990). DMS ist die wichtigste biogene Schwefelquelle für die
Bildung von Aerosolen und Kondensationskeimen in der Troposphäre und leistet im globalen
Schwefelkreislauf den größten Teil des Schwefeltransportes vom Ozean zum Land (Andreae
1990, Brimblecombe und Lein 1989). Die Dichte der im Laufe der DMS-Oxidation in der
Atmosphäre gebildeten Schwefel-Aerosole ist ein bedeutender Faktor im globalen
Strahlungshaushalt, da sie sowohl die Streuung des kurzwelligen Lichtes in der Troposphäre, als
auch die Kondensation und Strahlungseigenschaften von Wolken beeinflusst (Charlson et al.
1987, Andreae und Crutzen 1997). Auch steht die atmosphärische Oxidation des DMS durch
den Umsatz von Nitrat- und Hydroxyl-Radikalen in engem Zusammenhang mit der Ozon-
Bildung in der marinen Grenzschicht (Platt und Le Bras, 1997).
In diesen Eigenschaften des DMS liegt ein großes Potential für Wechselwirkungen zwischen der
biologischen Produktion im Ozean und Klimaänderungen. Die Ergebnisse paläoklimatischer
Untersuchungen an Eiskernen aus den Polargebieten legen eine generell enge Beziehung
zwischen der DMS-Emission des Ozeans und den starken Temperaturschwankungen im Quartär
nahe (Legrand et al. 1988, 1991, 1997). Ein rezenter Hinweis für die Existenz von
Wechselwirkungen, findet sich in der ausgeprägten Saisonalität und der engen Beziehung von
DMS-Emissionen und den Aerosol-Konzentrationen in der anthropogen wenig beeinflussten
Südhemisphäre (Ayers and Gras 1991, Yvon und Saltzman, 1996).
9
1.2 Die biologische Funktion des DMSP
Das Interesse am DMSP richtet sich jedoch in jüngerer Zeit nicht nur auf die Rolle als Vorläufer
des DMS, sondern auch auf seine zellphysiologische Funktion und seine Bedeutung im
mikrobiellen Nahrungsnetz. Hier gibt es bedeutende Fortschritte im Verständnis der Funktion
des DMSP in der Zelle (Stefels 2000) und im mikrobiellen Nahrungsnetz (Simó 2001). Zu
nennen sind insbesondere die Entdeckung seiner herausragenden Rolle als Kohlenstoff- und
Schwefel-Quelle der bakteriellen Produktion (Kiene et al. 2000) und der Wirkung des DMSP
und einiger seiner Abbauprodukte als intrazellulärer Schutz gegen Sauerstoff- und Hydroxyl-
Radikale (Sunda et al. 2002).
Viele Stoffwechselleistungen der Zelle werden durch die hohen Konzentrationen von
anorganischen Ionen im Meerwasser gehemmt. Unter solchen Bedingungen ersetzen
zellstoffwechsel-kompatible organische Osmolyte im Cytosol einen großen Teil der
anorganischen Ionen und stabilisieren dadurch die Enzymfunktionen (Kirst, 1989; Groene und
Kirst, 1991). Die chemische und die strukturelle Ähnlichkeit zu anderen pflanzlichen Osmolyten
wie Glycin-betain und Prolin legt eine Primärfunktion des DMSP in der Osmoregulation sehr
nahe (Vairavamurthy et al., 1985; Dickson und Kirst, 1987). Die Bedeutung des DMSP für die
Osmoregulation wird besonders deutlich in den hohen sehr veränderlichen DMSP-Gehalten bei
Eisalgen, die in ihrem Lebensraum extremen Salzgehaltsschwankungen ausgesetzt sind (Kirst et
al., 1991; Kasten et al. 1992). Dabei ist die Stabilisierung der Zellfunktionen und Strukturen
durch das DMSP auch nahe dem Gefrierpunkt noch wirksam (Nishiguchi und Somero, 1992 in
Groene, 1995). Von Stefels (2000) wurde eine interessante Hypothese zur Funktion der DMSP-
Produktion als „Überlauf-Mechanismus“ zur Ableitung überschüssiger Mengen an
energiereichen organischen Verbindungen vorgeschlagen. Schließlich wurde bei Gröne (1995)
eine mögliche Funktion des DMSP in der Methyl-Gruppen Übertragung z.B. bei der Methionin
Synthese diskutiert. In diesem Zusammenhang konnten Kiene et al. (1999) das DMSP und eines
seiner mikrobiellen Abbauprodukte, das Methanethiol als Vorläufer in der bakteriellen
Methionin und Protein-Synthese nachweisen.
Darüber hinaus wurde in mehreren Laborstudien für das DMSP eine Wirkung als chemische
Abwehr gegen den Fraß durch herbivores Mikrozooplankton beobachtet (Wolfe et al. 1997,
Strom et al. 2003). So wurde bei einigen Stämmen der Coccolithophoride Emiliania huxleyi mit
hoher DMSP-Lyaseaktivität im Vergleich zu Stämmen mit geringerer Aktivität eine erhebliche
Verringerung des Fraßdruckes durch Protozoen beobachtet (Wolfe et al. 1997). Die vermutete
10
Hemmwirkung wurde dabei der Acrylsäure, die bei der enzymatischen Spaltung von DMSP frei
wird zugeschrieben. Während einer Blüte von E. huxleyi im Nord-Atlantik wurde jedoch
beobachtet, dass diese Alge vom Mikrozooplankton bevorzugt konsumiert wurde (Holligan et
al. 1993). Bei den im Rahmen dieser Studie durchgeführten Experimenten zur Herbivorie des
Mikrozooplankton fanden sich jedoch keine Hinweise auf eine Vermeidung des DMSP-
produzierenden Phytoplankton in natürlichen Planktongemeinschaften.
Außerhalb des produzierenden Organismus kommt dem DMSP und praktisch sämtlichen
Abbauprodukten des DMSP eine Bedeutung als Substrat für den bakteriellen Stoffwechsel zu
(Taylor und Kiene 1989, Kiene und Taylor 1989, Yoch 2002). In mehreren Untersuchungen
konnte gelöstes DMSP als eine bedeutende organische Kohlenstoff und Schwefel Quelle für
Bakterien beschrieben werden, wobei angenommen werden kann, dass der mikrobielle Abbau
des gelösten DMSP bis zu 15% des Bedarfs an organischem Kohlenstoff und den nahezu
gesamten Bedarf an Schwefel deckte (Kiene und Linn 2000, Zubkov et al. 2001, Simó et al.
2002). Damit ist das DMSP angesichts der Menge und Komplexität der Zusammensetzung
gelöster organischer Stoffe im Meerwasser eines der bedeutendsten bisher bekannten Substrate
für das marine Bakterioplankton (Kiene et al. 2000).
Erstaunlicherweise gibt es jedoch trotz der Vielfalt der beschriebenen Funktionen des DMSP
bislang keine befriedigende Erklärung für die hohen Art-spezifischen Unterschiede in der
DMSP-Produktion bei marinen Planktonalgen. Haptophyta und Dinoflagellen wurden häufig als
besonders starke DMSP-Produzenten angesehen, jedoch übertreffen die Art- und Stamm-
spezifischen Unterschiede der intrazellulären DMSP-Konzentrationen bei weitem die Klassen-
spezifischen Unterschiede (Keller et al. 1989). Für Diatomeen wurden bislang mit wenigen
Ausnahmen nur relativ geringe DMSP-Konzentrationen beschrieben (Keller et al. 1989).
Hierbei ist jedoch zu berücksichtigen, dass die tatsächlichen zytosolischen Konzentrationen bei
vakuolisierten Diatomeen um ein vielfaches höher sein könnten, wenn das intrazelluläre DMSP
überwiegend im plasmatischen Teil der Zelle gelöst wäre. Für die Annahme das auch
Cyanobakterien DMSP produzieren (Belviso et al. 1993, Wilson et al. 1998) finden sich jedoch
weder bei Keller et al. (1989) noch in dieser Untersuchung Nachweise. Auf Grund der hohen
Art-spezifischen Variation ist das Verhältnis zwischen den klassischen Indikatoren der
Phytoplankton Biomasse und dem partikulären DMSP in der Regel sehr variabel (Leck et al.
1990, Belviso et al. 2000 und 2001). Ausnahmen bilden Situationen, in denen bedeutende
11
DMSP-produzierende Arten wie Phaeocystis globosa oder Emiliania huxleyi die Bestände
dominieren oder Blüten bilden (Liss et al. 1994, Malin et al. 1993).
1.3 Ziel der Untersuchungen
Das übergeordnete Ziel aller hier durchgeführten Untersuchungen war es, zu einem besseren
Verständnis der Veränderlichkeit der DMS Produktion in natürlichen Planktongemeinschaften
beizutragen.
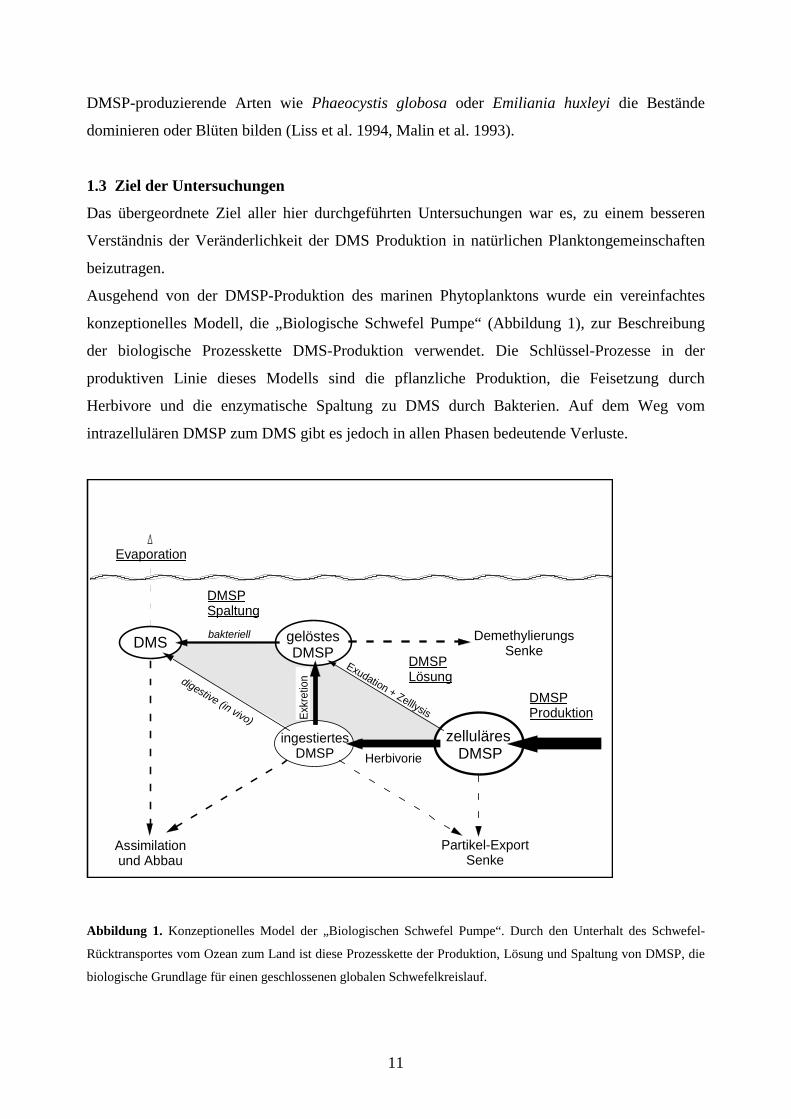
Ausgehend von der DMSP-Produktion des marinen Phytoplanktons wurde ein vereinfachtes
konzeptionelles Modell, die „Biologische Schwefel Pumpe“ (Abbildung 1), zur Beschreibung
der biologische Prozesskette DMS-Produktion verwendet. Die Schlüssel-Prozesse in der
produktiven Linie dieses Modells sind die pflanzliche Produktion, die Feisetzung durch
Herbivore und die enzymatische Spaltung zu DMS durch Bakterien. Auf dem Weg vom
intrazellulären DMSP zum DMS gibt es jedoch in allen Phasen bedeutende Verluste.
DMSPProduktion
gelöstesDMSP
DemethylierungsSenke
Assimilationund Abbau
Exudation + Zelllysis
Partikel-ExportSenke
ingestiertesDMSP
zelluläres DMSP
digestive (in vivo)
bakteriell
Evaporation
DMS
Exk
retio
n
Herbivorie
DMSPSpaltung
DMSPLösung
Abbildung 1. Konzeptionelles Model der „Biologischen Schwefel Pumpe“. Durch den Unterhalt des Schwefel-
Rücktransportes vom Ozean zum Land ist diese Prozesskette der Produktion, Lösung und Spaltung von DMSP, die
biologische Grundlage für einen geschlossenen globalen Schwefelkreislauf.
12
Ein bislang weitgehend unbekannter Teil des partikulären DMSP geht verloren durch sinkende
Zellen, Aggregate und Kotballen des Metazooplanktons (Hatton 2002). Ein ebenfalls kaum
bekannter Anteil des von Herbivoren ingestierten DMSP wird assimiliert und abgebaut, ohne
dass DMS oder gelöstes DMSP dabei frei werden (Wolfe et al. 1994). Und schließlich kann ein
sehr variabler Teil sowohl des freigewordenen DMSP als auch des zu DMS gespaltenen DMSP
von Bakterien assimiliert oder metabolisiert werden (Kiene 1996, Kiene und Linn 2000, Simó
2000). Im Rahmen dieser Studie wurden die drei Prozessstufen der produktiven Linie im
Hinblick auf die vermuteten Schlüsselfaktoren und die Effizienz der Umsätze untersucht. Auf
der 1. Stufe wurde besonders die artspezifische und nährstoffbedingte Veränderlichkeit der
pflanzlichen DMSP Produktion untersucht. Auf der Stufe der Freisetzung des zellulären DMSP
lag der Schwerpunkt auf dem Umsatz durch das herbivore Mikroplankton und auf der 3. Stufe
wurde der Einfluss alternativer organischer Kohlenstoff- und Schwefel-Quellen auf den
mikrobiellen DMSP-Abbau und die Freisetzung von DMS durch Bakterien untersucht.
Die Ergebnisse der Studie werden im Folgenden in drei Manuskripten in englischer Sprache
vorgestellt. Das Kapitel 2 behandelt die Ergebnisse von Laboruntersuchungen zur
stickstoffbedingten Veränderlichkeit der DMSP-Produktion in marinen Planktonalgen. Im
Kapitel 3 werden die Ergebnisse einer saisonalen Feldstudie zur Produktion und zum
mikrobiellen Umsatz von DMSP in natürlichen Planktongemeinschaften der Nordsee vorgestellt
und das Kapitel 4 befast sich mit den Ergebnissen von Feldexperimenten zur nährstoffbedingten
Änderungen des mikrobiellen Umsatzes von gelöstem DMSP zu DMS im tropischen Atlantik.
Die Ergebnisse dieser Studie werden im Kapitel 5 in einer allgemeinen Zusammenfassung und
Schlussbetrachtung dargestellt. Das Kapitel 6 enthält einen kurzen Überblick in deutscher und
englischer Sprache.
*
13
2 Nitrogen-related versus species-specific variability of the DMSP production in marine phytoplankton
Wilhelm Gaul and Avan N. Antia
Leibniz-Institut für Meereswissenschaften an der Universität Kiel, Düsternbrooker Weg 20, 24105 Kiel, Germany
2.1 Abstract
A total of 37 strains of marine phytoplankton algae were investigated in batch culture experiments for
changes of their intracellular concentration of dimethylsulphoniopropionate (DMSP) in response to a
decreasing supply of dissolved inorganic nitrogen (DIN). In nine of these strains the production of
particulate DMSP was examined in relation to cellular contents of particulate organic carbon (POC) and
particulate organic nitrogen (PON) and decreasing concentrations of DIN. In 25 of 32 DMSP-producing
algae the intracellular DMSP concentration increased under N-deficient growth conditions. The increase
of the intracellular DMSP concentration was, on average, three to four times stronger in diatoms (+
235%, n = 10) than in dinoflagellates (+ 76%, n = 14) and coccolithophorids (+ 51% n = 5). When cells
grew under N-limited conditions, the amount of particulate DMSP they produced per unit PON (DMSPP
/ PON ratio) was, on average, 4.5 times higher than under N-replete conditions. The transition from an
N-replete to an N-deficient state of the intracellular DMSP concentration and the DMSPP/PON ratio was
quite sharp, and occurred at about 2.5 µM DIN. The N-specific DMSP production (i.e. the amount of
DMSP produced per micromole PON per day) showed two different responses to decreasing DIN
concentration. In six of nine cases it first increased in response to decreasing DIN concentration until a
pronounced intermediate maximum was reached between about 0.7 and 2.8 µM DIN and then it sharply
decreased. This response was caused by a continuous decline in the growth rate and a relatively stronger
increase of the DMSPP/PON ratio. In the other three cases the decrease in the growth rate was always
stronger than the increase of the DMSPP/PON ratio and resulted in an steady decrease of N-specific
DMSP production. Overall we found an enormous species-specific variability (SSV) in the intracellular
DMSP concentration (0.3 - 1521 mM), of the DMSPP/PON ratio (0.014 - 1.16 µmol S µmol-1 N) and of
the N-specific DMSP production (maxima: 0.007 - 0.603 µmol S µmol-1 N day-1), which was about one
to two orders of magnitude higher than their corresponding nitrogen-related variabilities (NRV).
However, at the community level the impact of the SSV decreases exponentially with increasing species
diversity, and it fully applies only to mono-species blooms. The relatively small NRV, which in general
displayed a systematic unidirectional response, would therefore, on a global scale, clearly dominate over
the high, but almost entirely random, SSV.
14
2.2 Introduction
Dimethylsulphoniopropionate (DMSP) is a virtually omnipresent compound throughout the
euphotic zone of the ocean because it constitutes a major intracellular solute of most
Prymnesiophyceae, Dinophyta and some other marine phytoplankton algae (Keller et al. 1989).
Dimethylsulphoniopropionate has received increasing interdisciplinary interest, because it is the
principal precursor of dimethlysuphide (DMS) (Challenger and Simpson 1948), which
dominates the oceanic emission of volatile organic sulphur to the atmosphere (Andreae 1990)
and therefore contributes the most of the reactive sulphur to the remote unpolluted atmosphere
(Andreae 1990; Ayers et al. 1991). The oceanic emissions of DMS constitute a major
biogeochemical link between surface ocean processes and the chemistry of the marine
atmosphere, due to a high reductive potential of DMS for the sequestration of OH- and NO3
radicals (Platt and Le Bras 1997) and the subsequent generation of sulphate aerosols and cloud
condensation nuclei (Ayers and Gras 1991; Yvon and Saltzman 1996; Andreae and Crutzen
1997).
DMSP has multiple physiological functions; in marine phytoplankton it is one of the major
compatible solutes that stabilises enzymatic processes, and regulates osmotic pressure and also
serves as a methyl donor in cell metabolism (Kirst 1996, Randal et al. 1996, Stefels 2000). It
was also found to have a grazing repellent function (Wolfe et al. 1997, Strom et al. 2003) and
might have an ecological side effect as an info-chemical (Steinke et al. 2002). Furthermore,
DMSP and most of its breakdown products are strong antioxidants that can efficiently scavenge
toxic intra cellular hydroxyl and oxygen radicals (Sunda et al. 2002). Within marine microbial
food webs dissolved DMSP can be a major source of reduced sulphur and carbon for bacterial
production (Kiene et al. 2000, Simo et al. 2002). However, despite progress in the
understanding of the physiological significance of DMSP for marine phytoplankton, there are
considerable uncertainties in predicting both the variability of its production and the oceanic
emissions of DMS to the atmosphere (Kettle et al. 1999). This is partly because there is no
direct relation between DMS and primary production (Leck et al. 1990), chlorophyll-a
concentration (Andreae 1990; Kiene et al. 2000), or taxon-specific marker pigments such as the
19’-hexanoyloxyfucoxanthin of prymnesiophytes (Dacey et al. 1998) but primarily because of
great uncertainties about the response in DMSP production to changing growth conditions.
Nevertheless, ice core records of the past glacial-interglacial cycle show that oceanic DMS
emissions were highly sensitive to climatic variability (Legrand et al. 1991; Saltzman 1995),
although they did not follow the trend proposed in the “planetary thermostat hypothesis” by
15
Charlson et al. (1987). However, only few studies have been addressed to the feedback
potential of the major environmental factors on the DMS(P) production of marine phytoplankton
(Stefels and van Leeuve 1998, Keller et al. 1999 a, b, van Rijssel and Gieskes 2002, Slezak and
Herndl 2003).
The nitrogen concentration was early assumed to affect DMS(P) production, because elevated
DMS concentrations were frequently found under meso- and oligotrophic growth conditions. It
was suggested that under nitrogen-deficient growth conditions DMSP might substitute its
nitrogen-analog osmolytes (e.g. glycine-betaine) (Andreae 1986). However, no clear reciprocal
relation was found between the cellular content of glycine-betaine and DMSP which is also due
to the dominance of DMSP in most investigated algal species (Keller et al. 1999 a, b).
Nevertheless, the synthesis of DMSP is closely related to the cellular nitrogen metabolism, since
the desamination of its amino acid precursor methionine releases reduced nitrogen for other cell
functions (Greene 1962; Gage et al. 1997, Stefels 2000). Increased levels of intracellular DMSP
were frequently reported from cultures of marine phytoplankton under nitrogen-deficient growth
conditions (Turner et al. 1988; Gröne and Kirst 1992; Matrai and Keller 1994; Stefels and van
Boekel 1993). Therefore it appears that the nitrogen supply of phytoplankton growth plays a
significant role in the DMSP production.
In this study, we present data on the responses of the specific production of DMSP to decreasing
nitrogen concentrations in batch culture experiments for nine different species of marine
plankton algae, as well as the nitrogen-related variability (NRV) of the intracellular DMSP
concentration for 37 strains of marine plankton algae including dinophytes, haptophytes,
diatoms, cyanophytes and one strain each of a cryptophyte, raphidophyte and chysophyte.
2.3 Materials and methods
Experimental setup. Prior to the experiments all cultures were pre-conditioned for 2 wk to
moderate light (<100 µE m-² s-1) and nutrient conditions (about 75 µM NO3 and 5 µM PO4). The
experiments were conducted with non-axenic batch cultures in natural seawater; these were
started with inoculates (2.5 % v/v) from the pre-conditioned culture in the exponential growth
phase. The experiments were repeated two to four times by starting a new nutrient-replete batch
with an inoculate from the nutrient-depleted stationary culture (Figure 1). Cells were kept in
suspension by slow rotation of the incubation bottles (2.2 dm³ polycarbonate (Nalgene). As
culture media we used a stock of sterile filtered and autoclaved natural seawater from the North
Sea, with a salinity of 32‰. The medium was moderately enriched with nutrient- and vitamin
supplements (Guillard 1975), adapted to an N/P ratio of 15:1 according to Redfield et al. (1963),
16
i.e. 30 µM NO3 and 2 µM PO4. Cultures of Bacillariophyceae additionally received 28 µM
Si(OH)4. This amount of nutrients was sufficient for virtually nutrient-replete growth during the
early growth phases, while the nitrogen was still exhaustible by the end of the exponential
growth phase. Most algae were grown at 16°C in a 12h:12h light-dark cycle. Strains of
Trichodesmium, Synechococcus and Chromulina were grown at 22°C in the artificial seawater
medium YBCII (Chen et al. 1996), with a salinity of 35 ‰. The light intensity inside a medium
filled incubation bottle was 84 µE m-² s-1, as measured by a quasi scalar 4π sensor (QSL,
Biospherical Instruments Inc.) in the photosynthetically active range. Samples for nutrient
analysis, cell cytometry and particulate DMSP (DMSPp) quantification were taken with syringes
via screw-lock valve connections on the incubation bottles at intervals of 22 to 74 h. For a
subset of 9 algae we additionally monitored the particulate organic carbon (POC) and nitrogen
(PON) through the whole growth cycle and replicated the experiments 2 to 4 times for each
strain. With each sampling the cultures were checked for contamination by means of phase
contrast and epifluorescence microscopy.
0 14 28 42 56 70 84Time [ d ]
0.1
11
01
00
1,0
00
expo
netia
lgr
owth
dece
lera
tion
phas
e
p r
e -
c o
n d
i t i
o n
i n g
p
h a
s e
( >
14
d )
stat
iona
ry p
hase
DMSPp
PON
DIN
total cellvolume
dela
y ph
ase
inoculations
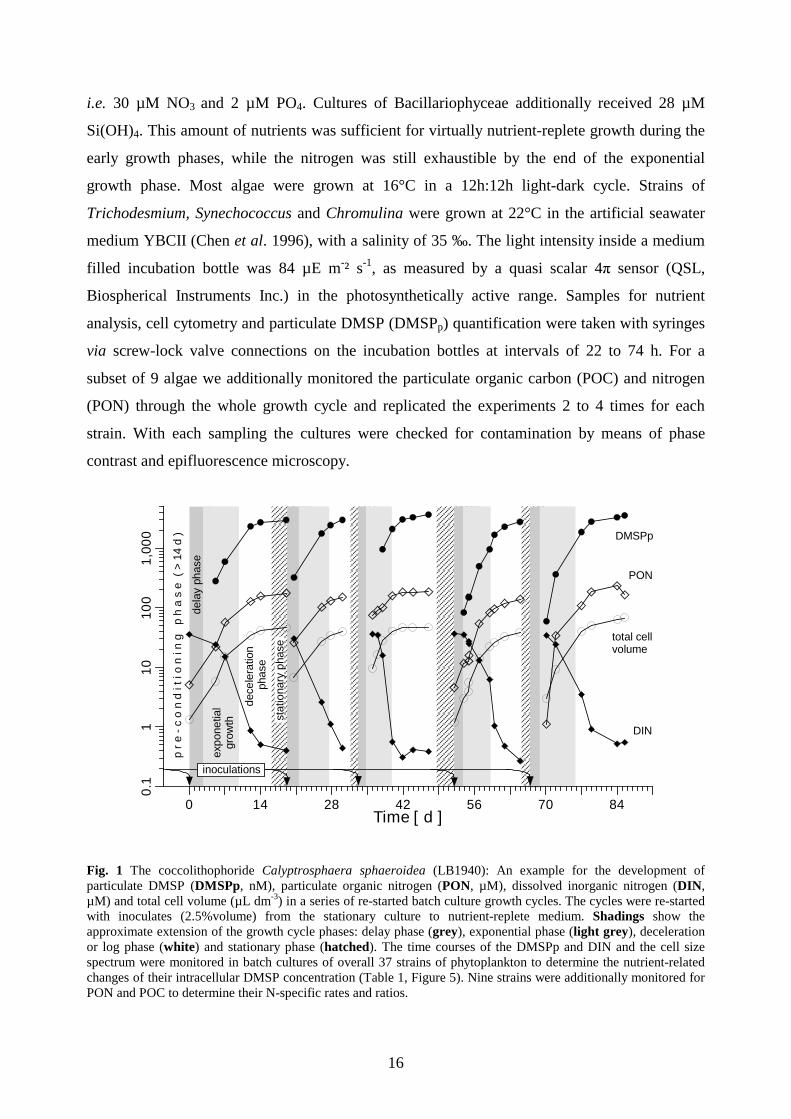
Fig. 1 The coccolithophoride Calyptrosphaera sphaeroidea (LB1940): An example for the development of particulate DMSP (DMSPp, nM), particulate organic nitrogen (PON, µM), dissolved inorganic nitrogen (DIN, µM) and total cell volume (µL dm-3) in a series of re-started batch culture growth cycles. The cycles were re-started with inoculates (2.5%volume) from the stationary culture to nutrient-replete medium. Shadings show the approximate extension of the growth cycle phases: delay phase (grey), exponential phase (light grey), deceleration or log phase (white) and stationary phase (hatched). The time courses of the DMSPp and DIN and the cell size spectrum were monitored in batch cultures of overall 37 strains of phytoplankton to determine the nutrient-related changes of their intracellular DMSP concentration (Table 1, Figure 5). Nine strains were additionally monitored for PON and POC to determine their N-specific rates and ratios.
17
Nutrient analysis, cell size and elemental composition. The concentrations of dissolved
inorganic nitrogen (DIN, i.e. Σ NO3, NO2, NH4 ) and dissolved inorganic phosphate (DIP) were
analysed manually according to Hansen and Kororleff (1999). Nutrient samples were passed
through pre-combusted GF/F filters and were stored frozen in polypropylene bottles at – 25°C
till analysis. PON and POC were analysed according to Erhard and Koeve (1999). Samples of
30 – 180 ml were filtered on pre-combusted glassfiber-filters (Whatman GF/F). Filters were
rinsed for 5 seconds with 10 ml milli-Q water to remove seasalt (without any significant losses
in chlorophyll-a or particulate DMSP); they were then frozen in liquid N2 and stored at –25°C
till analysis. Carbonate-rich samples (coccolithophorids) were exposed to fuming HCl for 24h to
volatilise inorganic carbon. Filters were dried for 24h at 50°C and sealed in tin vials before
analysis on a CHN-analyser (EURO EA 3000, HEKA-tech) calibrated with acetanelid. Cell
number and cell volume were measured by an electronic particle analyser (Beckmann-Coulter
MULTISISER-II) calibrated with spherical latex beads of 10 and 20 µm diameter. Three sub-
samples with a minimum count of 1000 cells were analysed. Some diatoms exceeded the
dimensions of the flow capillary and were counted and measured microscopically according to
Smetacek (1981).
Analysis of (cell) particulate and intracellular DMSP. The DMSPP was measured as DMS
that releases to the gas phase after alkaline hydrolysis, according to Steinke et al. (1998). Sub-
samples of 10 - 60 ml from the cell cultures were filtered onto cellulose-acetate membranes (0.2
µm pore size ST 68, Schleicher & Schuell) and were hydrolysed with 4ml of 2N NaOH for 8 -
24h in Teflon-sealed screw cap vials (25ml). The vials were then incubated in a water bath at
60°C for 30 min and were equilibrated by sonication before replicate gas samples of 25 – 250 µl
were taken from the headspace by gastight microlitre syringes. The gas samples were directly
injected via a Teflon-sealed injection-liner on a gas chromatograph (Varian, GC-6000) equipped
with an isothermally (60°C) operated fused silica capillary (Chrompack, CP-Sil 5 CB, 15m x
0,32mm) and a flame photometric detector (Thermoquest, FPD-800). A dilution series of ultra-
pure DMSP-HCl (CASS, University of Groningen) dissolved in milli-Q water was used for
calibration. The diluted DMSP standards (1 ml aliquots) were hydrolysed together with a blank
filter by 3 ml of 2N NaOH in Teflon-sealed screw cap vials (25ml) and were analysed as
described above. The calibration coefficients were determined according to Uher (1999). The
detection limit for a 250 µl headspace injection was 0.5 pmol DMS. The intracellular DMSP
concentration (DMSPcell) was calculated as femtomoles of particulate DMSP per cubic
micrometer of cell volume, which is equivalent in short to millimolar values of DMSP.
18
Osmolytic contribution of intracellular DMSP (φDMSP). This estimate is based on the ratio of
the partial osmotic pressure of the cellular DMSP (πDMSP) and the total osmotic pressure of the
intracellular solutes (πi) iDMSPDMSP ππϕ /= . Osmotic pressure was calculated based on the van’t
Hoff osmotic equation zTRC ⋅⋅⋅=π where C = concentration of the solutes, R = gas constant, T
= absolute temperature and z = osmotic coefficient of the solute (z = 1 for DMSP and z = 1.9 for
the major solutes of seawater). However, in the following calculation we considered for the true
intracellular concentration of DMSP that about 15 % of the cell volume of microalgae consist of
non-osmotic and water-insoluble lipophilic cell structures (Dickson and Kirst 1987). We
assumed that the total concentration of intracellular solutes is equivalent to the concentration of
the major solutes in the growth medium (i.e. 0.535 mol dm-3 for natural seawater of 32‰
salinity) plus an excess concentration that causes cell turgor and which is about 10% in marine
microalgae (Dickson and Kirst 1987). The estimated osmolytic contribution of intracellular
DMSP for growth in natural seawater of 32‰ salinity is therefore calculated by
CellDMSP DMSPmol ⋅= −1056.1ϕ .
Responses to changing DIN concentration. At times of high production the nutrient
concentration in a batch culture decreases fast and exponentially due to an intense nutrient
uptake (Fig. 1). Growth- and cell parameters were therefore usually more closely related to the
average DIN concentrations of the previous incubation interval (Equation 2, Appendix). For the
cell physiological parameters (intracellular DMSP, C/N ratio, DMSP/PON ratio), this is
because they need time for the adaptation to changing growth conditions and display memory
effects caused by intracellular nutrient reserves. But, in case of the growth rate and DMSP
production, this is simply because their determination is based on a sample interval (in contrast
to instantaneous rates based on a point in time). We tried the regression analysis of growth- and
cell parameters using DIN concentrations averaged over the past 12h, 24h and 48h of
incubation, and received the best fits for DIN concentrations averaged over the preceding 24 h
incubation periods. We therefore applied time averaged DIN concentrations in all regression
analyses of growth- and cell parameters. Only the DIP/DIN ratio was directly related to the
coincident DIN concentration (Fig.2), since both DIN and DIP are instantly and synchronously
affected by changes due to nutrient uptake. Equations used in the regression analysis are
summarised in the Appendix. Regressions were carried out with the statistic program
SigmaPlot© version 5.0 (SPSS Inc.).
19
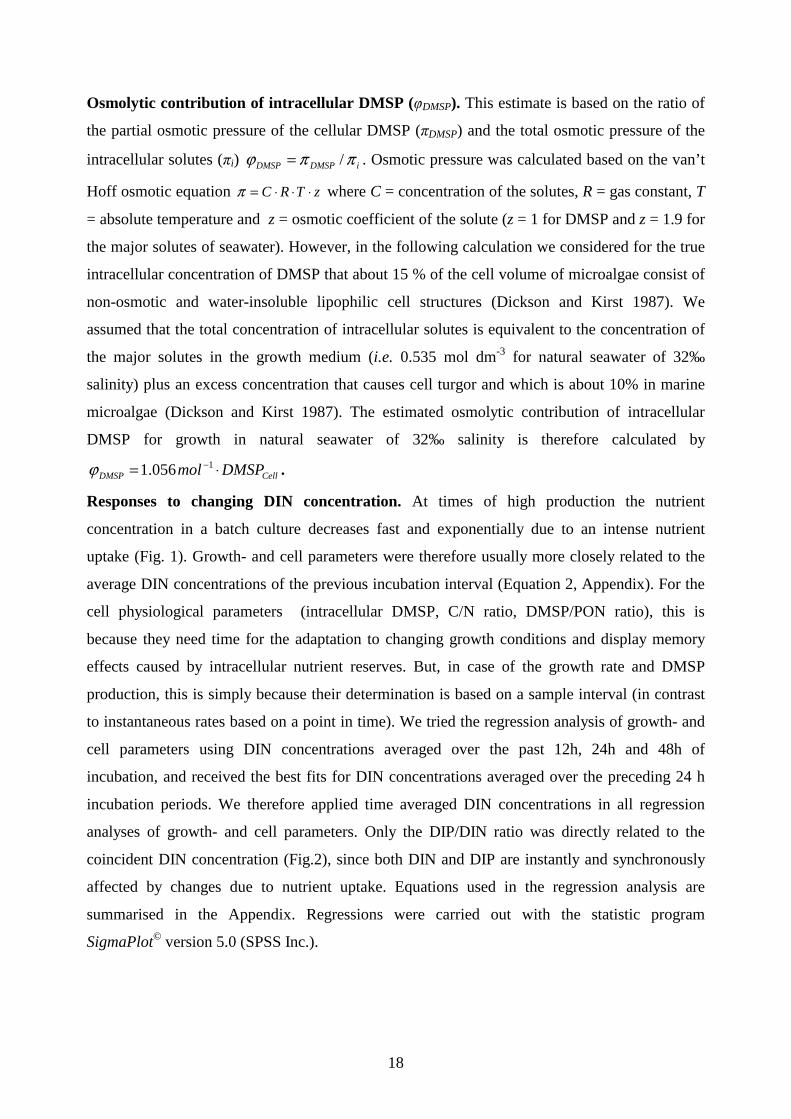
2.4 Results
The batch cultures were all started with moderate nutrient enrichments at near-optimum ratios of
dissolved inorganic nitrogen and phosphorus (Fig. 2). This created virtually nutrient-replete
growth conditions during early exponential growth, while the amount of nutrients was still low
enough to be exhausted and to terminate the exponential growth phase (Fig. 4). Under nitrogen
replete-growth conditions the molar ratio of the particulate organic carbon and nitrogen (C/N
ratio) of the cells was generally close to the Redfield C/N ratio (Redfield et al. 1963). The C/N
ratios show high fluctuations, but started to increase significantly at DIN concentrations <2 µM,
which indicated the transition to nitrogen-limited growth conditions.
0.1 1 10 100
0
10
20
0.1 1 10 100
0
10
200
10
20
0
10
200
10
20
0
10
20
0
10
20
0
10
20
0.1 1 10 100
0
10
20Emiliania huxleyiCCMP 373
Calyptrosphaera sphareoidea
Prymnaesium parvum
Rhodomonas balticaThalassiosira concaviuscula Nitzschia sp.
Prorocentrum redfieldii
Amphidinium carterae
Heterocapsa pygmea
m o
l a
r D
I N
/ D
I P
r
a t
i o s
D i s s o l v e d I n o r g a n i c N i t r o g e n [ µ M ] Fig. 2 Elemental composition of the culture medium: The molar ratio of dissolved inorganic nitrogen and phosphor (DIN/DIP) in batch culture media in relation to the (coincident) DIN concentration. Trend lines are regressions by a power function [y = a xb]. Data from the delay and senescence phase are excluded
20
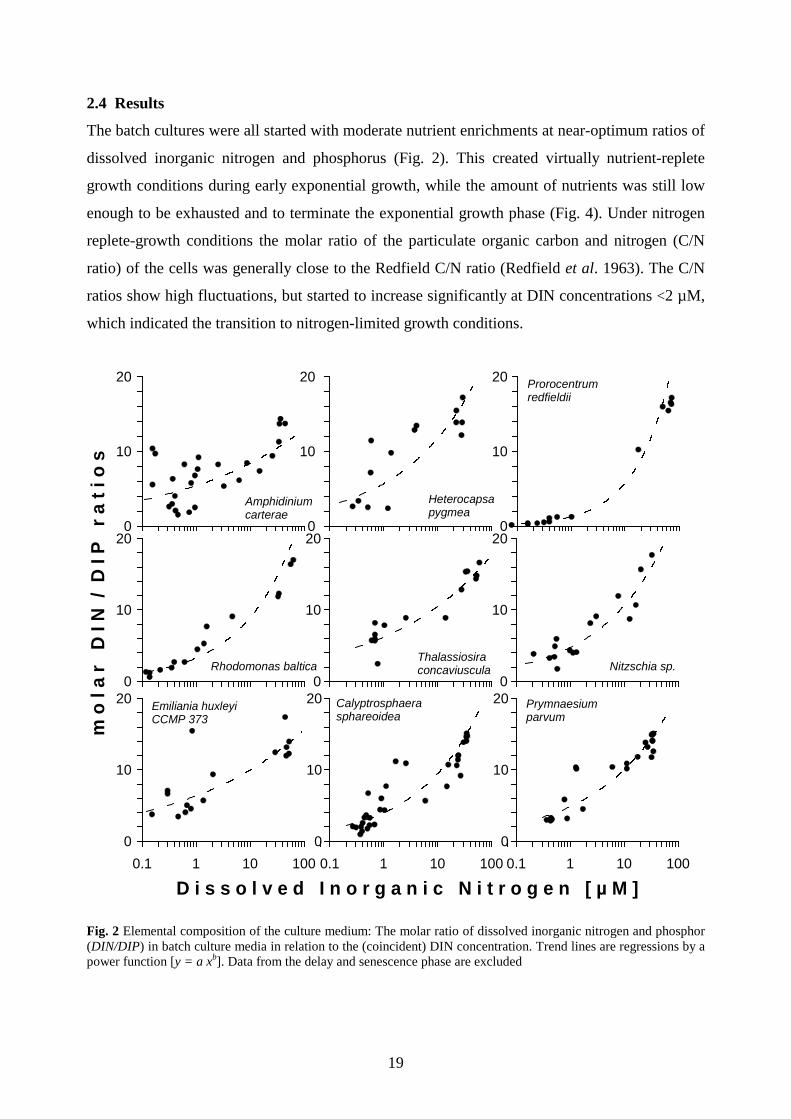
However, the molar ratio of dissolved inorganic nitrogen to phosphorus appeared to decline
immediately without any apparent offset during the depletion of the DIN pool and its
accumulation into biomass (Fig. 2). The intracellular concentration of DMSP (DMSPcell)
showed a high species-specific variability (SSV) and ranged for eukaryotic algae over three
orders of magnitude, from 0.34 mM in Coscinodiscus wailesii to 1521 mM in Prorocentrum
redfieldii (Table 1). The DMSPcell reached almost 100% of the estimated total demand of
osmolytes (about 948 mM) in two Alexandrium strains and significantly exceeded the required
amount of osmolytes in P. redfieldii and in swarmers of a Gyrodinium strain (ME-127).
0.1 1 10 100
0
10
20
0.1 1 10 100
0
10
20
0
10
20
0
10
200
10
20
0
10
20
0
10
20
0
10
20
0.1 1 10 100
0
10
20
Emiliania huxleyi CCMP373 Calyptrosphaera sphareoidea Prymnaesium parvum
Rhodomonas baltica Thalassiosira concaviuscula Nitzschia sp.
Prorocentrum redfieldiiAmphidinium carterae Heterocapsa pygmea
m o
l a
r P
O C
/ P
O N
r
a t
i o s
D i s s o l v e d I n o r g a n i c N i t r o g e n [ µ M ]
Fig. 3 Elemental composition of the microalgae: The molar ratio of particulate organic carbon and nitrogen (POC/PON) in relation to concentrations of dissolved inorganic nitrogen (DIN), which were averaged over 24h preceding sampling (see “Materials and methods” and Appendix). Trend lines are regressions by a power function [y = a·xb]. Data from the delay and senescence phase are excluded.
21
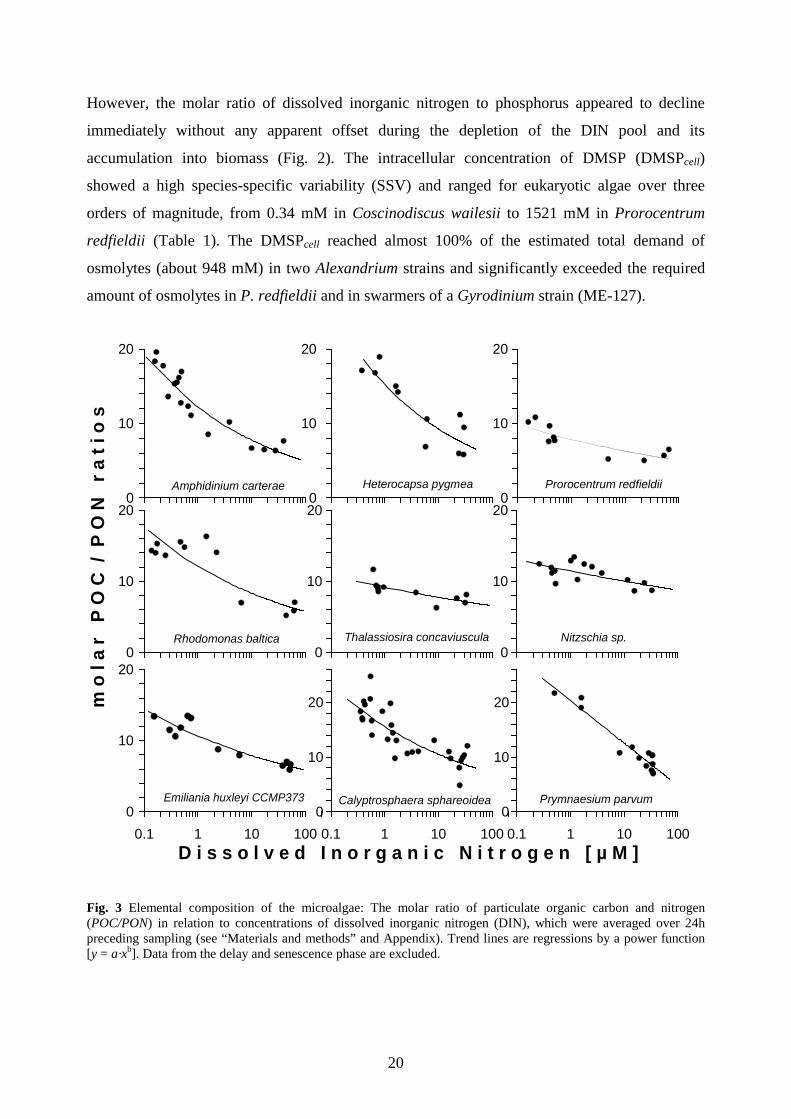
Table 1 Taxon-specific variability of the intracellular DMSP concentration (DMSPcell) at high (20µM) and low (0.2 µM) concentrations of dissolved inorganic nitrogen (DIN) and the estimated contribution of DMSP to total cell requirements of osmolytes at high DIN concentration. For calculations see text. Abbreviations: CCMP = Provasoli-Guillard Center for the Culture of Marine Phytoplankton, Bigelow Laboratory, Main USA, CCAP = Culture Collection of Algae and Protozoa, Scottish Marine Biological Association, Oban, Scotland, UK, CCAC = Culture Collection of Algae at Cologne-University, ME = Dr. Malte Elbrächters dinoflagellate collection at the Alfred-Wegener-Institut für Polar- und Meeresforschung (AWI), Germany, PPC = Plymouth Marine Laboratory, U.K. SAG = Culture Collection of Algae at the University of Göttingen, Germany, UTEX = Culture Collection of Algae at the University of Texas at Austin. n.d. = not detectable. Bold printed strains have been used in the following nitrogen-related experiments. Intracellular concentration
of DMSP
Osmotic contribution of
DMSP strain origin at high DIN at low DIN at high DIN Dinophyta mM DMSP
(fmol DMSP / µm³) % of osmotically required solutes
Alexandrium catenella ME-217, Mediterranean 601 918 63.5 Alexandrium tamarense ME-181, Orkneys 685 901 72.3 Amphidinium cartearae SAG 37.80, English Canal 113 317 11.9 Gymnodinium chlorophorum 61.9 118 6.5 G. chlorophorum “swarmers”
ME-100, North-Sea - 687 (a) 72.5 (a)
Gyrodinium sp. 48.6 44.6 5.1 Gyrodinium sp. “swarmers”
ME-127, North-Sea IX. 1999 - 1215 (a) 128 (a)
Heterocapsa pygmea UTEX LB 2421, Mediterranean 372 782 39.2 Prorocentrum balticum CCMP 1787, S-Pacific 308 369 32.5 Prorocentrum cassubicum ME 134, SE-Pacific 127 481 13.4 Prorocentrum mexicanum ME-268, SE-Indic 28.5 44.5 3.0 Prorocentrum minimum PPC 18 B, English Canal 199 435 21.0 Prorocentrum minimum ME-172, NE-Atlantic 231 394 24.4 Prorocentrum redfieldii ME-138, North-Sea 1521 896 161 Prorocentrum triestinum ME-142, NE-Atlantic 432 633 45.6 Prorocentrum triestinum ME-147, Mediterranean 581 872 61.4
Prymnesiophyceae Calyptrosphaera sphaeroidea UTEX LB1940, NE-Atlantic 39.8 65.2 4.2 Emiliania huxleyi CCMP 373, Sargasso Sea 464 165 49.0 Emiliania huxleyi CCMP 2112, North-Sea 77.6 134 8.2 Micromonas pusilla SAG 39.85, English Channel 59 157 6.2 Prymnesium parvum SAG 127.79, North-Sea 27.4 32.4 2.9
Bacilariophyceae (c) Coscinodiscus granii North-Sea, III 2001 4.97 9.32 0.52 Coscinodiscus wailesii North-Sea, V. 2001 0.34 0.67 0.036 Cylindotheca closterium North-Sea, III 2001 52.7 180 5.6 Nitzschia spec. (b) North-Sea, III 2001 19.9 28.3 2.1 Odontella aurita North-Sea, V 2001 7.36 36.8 0.78 Odontella longicornis North-Sea, III 2001 1.46 3.31 0.15 Thalassiosira angulata North-Sea, XII 2000 23.9 68.2 2.52 Thalassiosira anguste-lineata North-Sea, I 2001 9.12 80.8 0.96 Thalassiosira concaviuscula North-Sea, XII 2000 28.3 120 2.99 Thalassiosira punctigera North-Sea, XII 2000 4.50 7.20 0.48 Thalassiosira cf. minima North-Sea, VIII 2001 2.94 - 0.31 Thalassiosira rotula North-Sea, XII 2000 30.4 - 3.21
Cryptophyta Rhodomonas baltica CCAP 979, English Channel 10.9 45.6 1.2
Raphidophyta Haramonas viridis North-Sea, IX. 2000 (d) 2.76 0.81 0.29
Chrysophyceae Ochromonas cf. bourellyi CCAC 1891, Sargasso Sea (e) 113 91.4 11.9
Cyanphyceae Trichodesmium erytraeum Sargasso Sea, VIII. 2000 n.d. n.d. - Trichodesmium sp. CCMP1985, NW-Atlantic n.d. n.d. - Synechococcus sp. UTEX LB 2626, Gulf of Mex. n.d. n.d. -
(a) Value refers to stationary growth phase (b) Epiphytic diatom isolated form a colony of Phaeocystis globosa (c) Isolated and held by H. Halliger, AWI Germany (d) Isolated, described and maintained by M. Hoppenrath, AWI, Germany (e) Isolated form a rough-culture of a Trichodesmium erytraeum bloom.
22
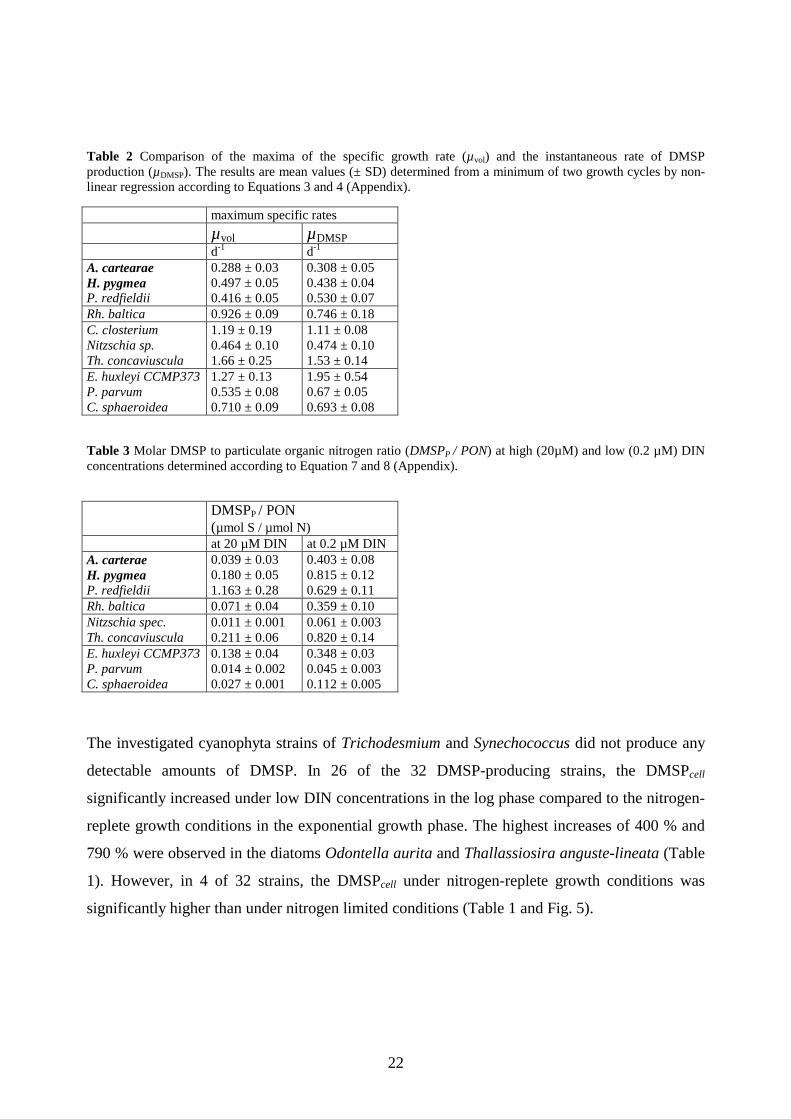
Table 2 Comparison of the maxima of the specific growth rate (µvol) and the instantaneous rate of DMSP production (µDMSP). The results are mean values (± SD) determined from a minimum of two growth cycles by non-linear regression according to Equations 3 and 4 (Appendix).
maximum specific rates µvol µDMSP d-1 d-1
A. cartearae 0.288 ± 0.03 0.308 ± 0.05 H. pygmea 0.497 ± 0.05 0.438 ± 0.04 P. redfieldii 0.416 ± 0.05 0.530 ± 0.07 Rh. baltica 0.926 ± 0.09 0.746 ± 0.18 C. closterium 1.19 ± 0.19 1.11 ± 0.08 Nitzschia sp. 0.464 ± 0.10 0.474 ± 0.10 Th. concaviuscula 1.66 ± 0.25 1.53 ± 0.14 E. huxleyi CCMP373 1.27 ± 0.13 1.95 ± 0.54 P. parvum 0.535 ± 0.08 0.67 ± 0.05 C. sphaeroidea 0.710 ± 0.09 0.693 ± 0.08 Table 3 Molar DMSP to particulate organic nitrogen ratio (DMSPP / PON) at high (20µM) and low (0.2 µM) DIN concentrations determined according to Equation 7 and 8 (Appendix).
DMSPP / PON (µmol S / µmol N)
at 20 µM DIN at 0.2 µM DIN A. carterae 0.039 ± 0.03 0.403 ± 0.08 H. pygmea 0.180 ± 0.05 0.815 ± 0.12 P. redfieldii 1.163 ± 0.28 0.629 ± 0.11 Rh. baltica 0.071 ± 0.04 0.359 ± 0.10 Nitzschia spec. 0.011 ± 0.001 0.061 ± 0.003 Th. concaviuscula 0.211 ± 0.06 0.820 ± 0.14 E. huxleyi CCMP373 0.138 ± 0.04 0.348 ± 0.03 P. parvum 0.014 ± 0.002 0.045 ± 0.003 C. sphaeroidea 0.027 ± 0.001 0.112 ± 0.005
The investigated cyanophyta strains of Trichodesmium and Synechococcus did not produce any
detectable amounts of DMSP. In 26 of the 32 DMSP-producing strains, the DMSPcell
significantly increased under low DIN concentrations in the log phase compared to the nitrogen-
replete growth conditions in the exponential growth phase. The highest increases of 400 % and
790 % were observed in the diatoms Odontella aurita and Thallassiosira anguste-lineata (Table
1). However, in 4 of 32 strains, the DMSPcell under nitrogen-replete growth conditions was
significantly higher than under nitrogen limited conditions (Table 1 and Fig. 5).
23
0.1 1 10 100
0.0
0.6
1.2
1.8
0.1 1 10 100
0.0
0.4
0.8
0.0
1.5
0.0
1.5
0.0
0.2
0.4
0.0
0.5
0.0
0.2
0.4
0.6
0.8
0.0
0.5
0.1 1 10 100
0.0
0.2
0.4
0.6Emiliania huxleyi CCMP373
Calyptrosphaera sphaeroidea
Prymnesium parvum
Rhodomonas baltica
Thalassiosira concaviuscula Nitzschia sp.
Prorocentrum redfieldii
Amphidinium carterae Heterocapsa
pygmea
g r
o w
t h
r
a t e
( )
an
d D
MS
P p
r o
d u
c t
i o
n (
) [
d
]
D i s s o l v e d I n o r g a n i c N i t r o g e n [ µ M ]
-1
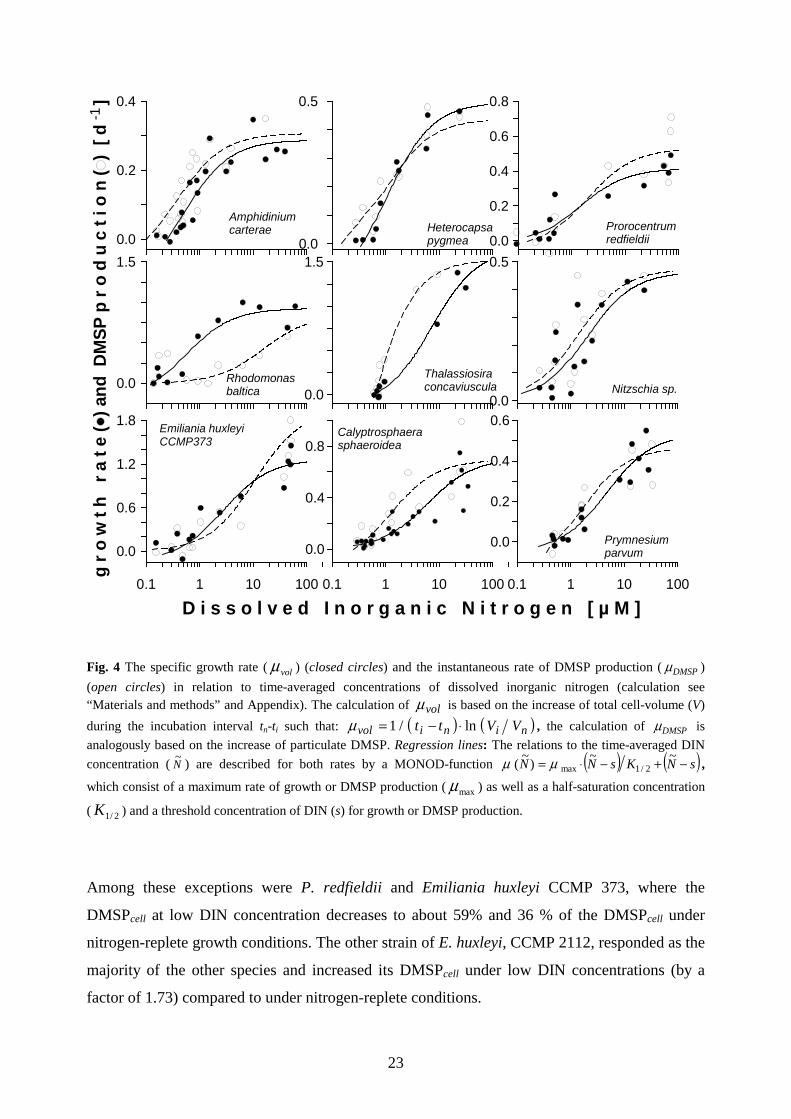
Fig. 4 The specific growth rate ( volµ ) (closed circles) and the instantaneous rate of DMSP production ( DMSPµ )
(open circles) in relation to time-averaged concentrations of dissolved inorganic nitrogen (calculation see “Materials and methods” and Appendix). The calculation of volµ is based on the increase of total cell-volume (V)
during the incubation interval tn-ti such that: ( ) ( )ninivol VVtt ln/1 ⋅−=µ , the calculation of DMSPµ is
analogously based on the increase of particulate DMSP. Regression lines: The relations to the time-averaged DIN
concentration ( N~
) are described for both rates by a MONOD-function ( ) ( )sNKsNN −+−⋅= ~~)
~( 2/1maxµµ ,
which consist of a maximum rate of growth or DMSP production ( maxµ ) as well as a half-saturation concentration
( 2/1K ) and a threshold concentration of DIN (s) for growth or DMSP production.
Among these exceptions were P. redfieldii and Emiliania huxleyi CCMP 373, where the
DMSPcell at low DIN concentration decreases to about 59% and 36 % of the DMSPcell under
nitrogen-replete growth conditions. The other strain of E. huxleyi, CCMP 2112, responded as the
majority of the other species and increased its DMSPcell under low DIN concentrations (by a
factor of 1.73) compared to under nitrogen-replete conditions.
24
0.1 1 10 100
0
600
0.1 1 10 100
100
0
100
0
180
500 800 2000
0
40
0.1 1 10 100
0
50
Emiliania huxleyi CCMP373 Calyptrosphaera sphaeroidea Prymnesium parvum
Rhodomonas baltica Thalassiosira concaviuscula Nitzschia spec.
Prorocentrum redfieldiiAmphidinium carterae Heterocapsa pygmea
i n t
r a
c e
l l u
l a
r D
M S
P
[ m
M ]
D i s s o l v e d I n o r g a n i c N i t r o g e n [ µ M ]
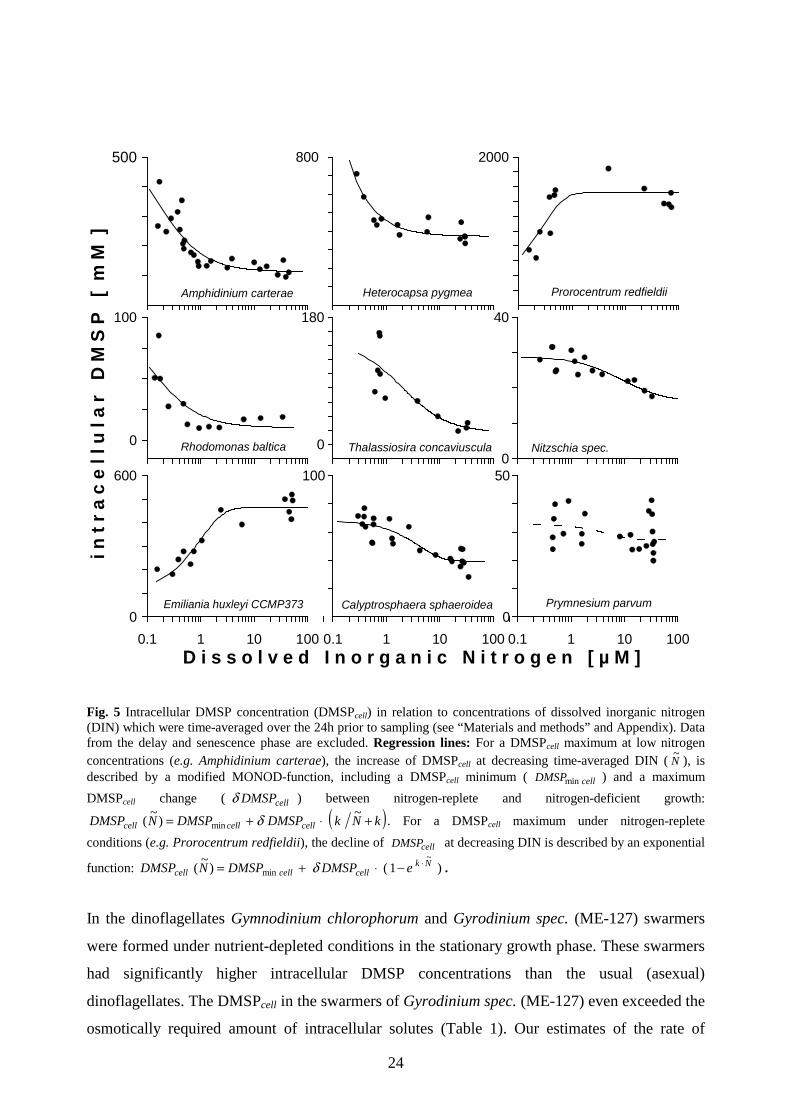
Fig. 5 Intracellular DMSP concentration (DMSPcell) in relation to concentrations of dissolved inorganic nitrogen (DIN) which were time-averaged over the 24h prior to sampling (see “Materials and methods” and Appendix). Data from the delay and senescence phase are excluded. Regression lines: For a DMSPcell maximum at low nitrogen concentrations (e.g. Amphidinium carterae), the increase of DMSPcell at decreasing time-averaged DIN ( N
~), is
described by a modified MONOD-function, including a DMSPcell minimum ( cellDMSPmin ) and a maximum
DMSPcell change ( cellDMSPδ ) between nitrogen-replete and nitrogen-deficient growth:
( )kNkDMSPDMSPNDMSP cellcellcell +⋅+= ~)
~( min δ . For a DMSPcell maximum under nitrogen-replete
conditions (e.g. Prorocentrum redfieldii), the decline of cellDMSP at decreasing DIN is described by an exponential
function: )1()~
(~
minNk
cellcellcell eDMSPDMSPNDMSP ⋅−⋅+= δ .
In the dinoflagellates Gymnodinium chlorophorum and Gyrodinium spec. (ME-127) swarmers
were formed under nutrient-depleted conditions in the stationary growth phase. These swarmers
had significantly higher intracellular DMSP concentrations than the usual (asexual)
dinoflagellates. The DMSPcell in the swarmers of Gyrodinium spec. (ME-127) even exceeded the
osmotically required amount of intracellular solutes (Table 1). Our estimates of the rate of
25
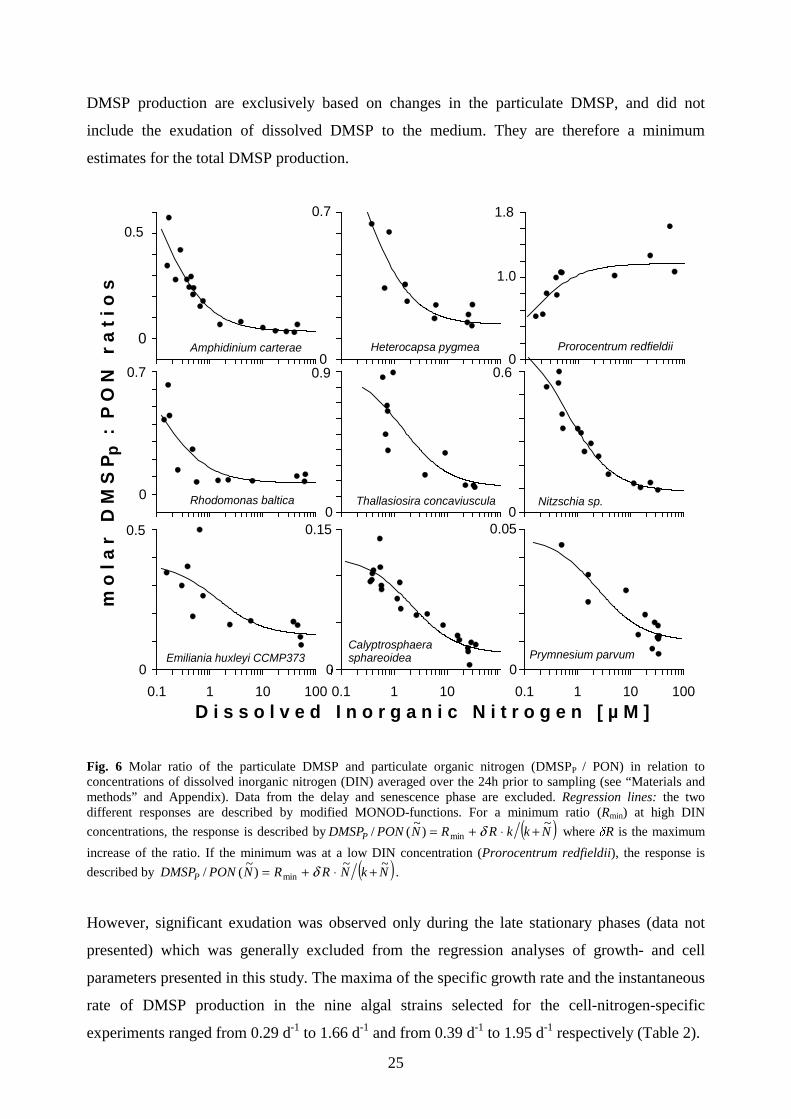
DMSP production are exclusively based on changes in the particulate DMSP, and did not
include the exudation of dissolved DMSP to the medium. They are therefore a minimum
estimates for the total DMSP production.
0.1 1 10 100
0
500
0.1 1 10
0
150
0
700
0
900
0
500
0
700
0
1800
0
60
0.1 1 10 100
0
50
Emiliania huxleyi CCMP373Calyptrosphaera sphareoidea Prymnesium parvum
Rhodomonas baltica Thallasiosira concaviuscula Nitzschia sp.
Prorocentrum redfieldiiAmphidinium carterae Heterocapsa pygmea
m o
l a
r D
M S
P
: P
O N
r
a t i
o s
D i s s o l v e d I n o r g a n i c N i t r o g e n [ µ M ]
p
1.0
0.5
0.7
0.5
0.7 1.8
0.9 0.6
0.15 0.05
Fig. 6 Molar ratio of the particulate DMSP and particulate organic nitrogen (DMSPP / PON) in relation to concentrations of dissolved inorganic nitrogen (DIN) averaged over the 24h prior to sampling (see “Materials and methods” and Appendix). Data from the delay and senescence phase are excluded. Regression lines: the two different responses are described by modified MONOD-functions. For a minimum ratio (Rmin) at high DIN
concentrations, the response is described by ( )NkkRRNPONDMSPP~
)~
(/ min +⋅+= δ where δR is the maximum
increase of the ratio. If the minimum was at a low DIN concentration (Prorocentrum redfieldii), the response is
described by ( )NkNRRNPONDMSPP~~
)~
(/ min +⋅+= δ .
However, significant exudation was observed only during the late stationary phases (data not
presented) which was generally excluded from the regression analyses of growth- and cell
parameters presented in this study. The maxima of the specific growth rate and the instantaneous
rate of DMSP production in the nine algal strains selected for the cell-nitrogen-specific
experiments ranged from 0.29 d-1 to 1.66 d-1 and from 0.39 d-1 to 1.95 d-1 respectively (Table 2).
26
0.1 1 10 100 0.1 1 10 100 0.1 1 10 100
Emiliania huxleyi CCMP373
Calyptrosphaera sphareoidea
Prymnesium parvum
Rhodomonas baltica
Thalassiosira concaviuscula
Nitzschia sp.
Prorocentrum redfieldii
Amphidinium carterae
Heterocapsa pygmea
N-s
peci
fic D
MS
P-p
rod
uctio
n [
m
ol S
/ (
mol
N
d )
]
D i s s o l v e d I n o r g a n i c N i t r o g e n [ µ M ]
0.04
0.1
0.050.5 0.01
0.2
0.04
0.01
0
0
0 0
0 0
0
0
0.5
0
0.02
0.10.02
0.80.15
0.05
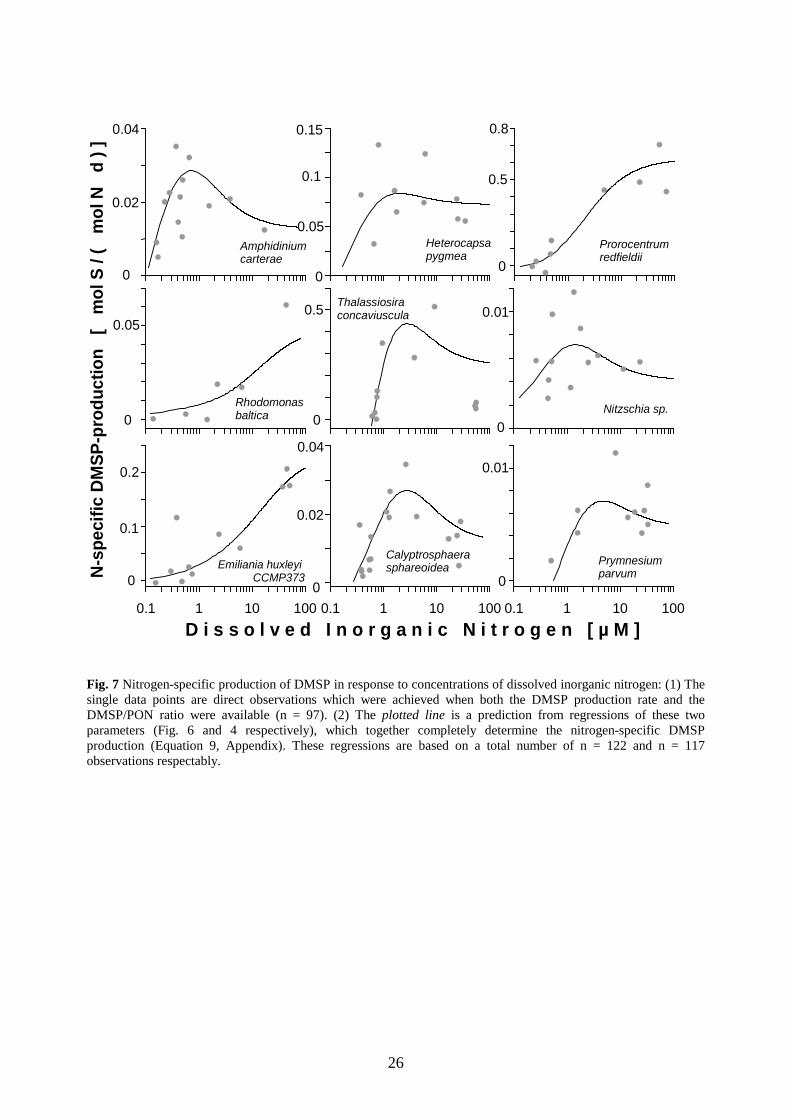
Fig. 7 Nitrogen-specific production of DMSP in response to concentrations of dissolved inorganic nitrogen: (1) The single data points are direct observations which were achieved when both the DMSP production rate and the DMSP/PON ratio were available (n = 97). (2) The plotted line is a prediction from regressions of these two parameters (Fig. 6 and 4 respectively), which together completely determine the nitrogen-specific DMSP production (Equation 9, Appendix). These regressions are based on a total number of n = 122 and n = 117 observations respectably.
27
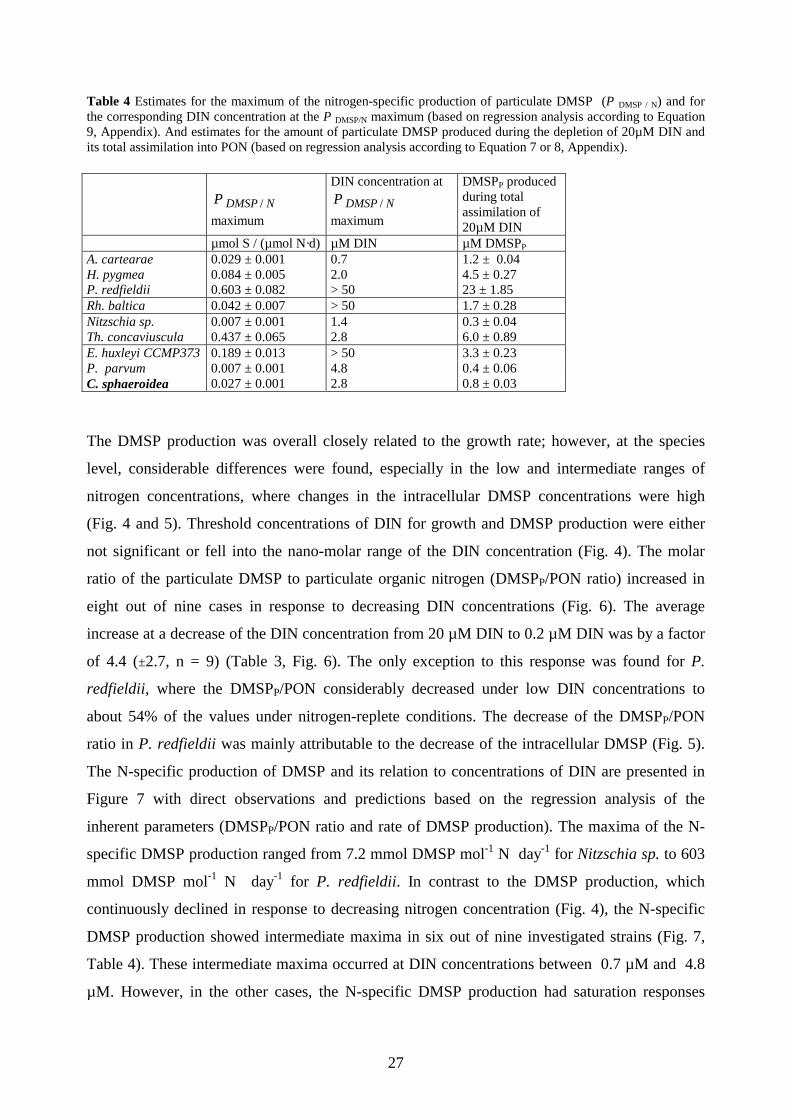
Table 4 Estimates for the maximum of the nitrogen-specific production of particulate DMSP (P DMSP / N) and for the corresponding DIN concentration at the P DMSP/N maximum (based on regression analysis according to Equation 9, Appendix). And estimates for the amount of particulate DMSP produced during the depletion of 20µM DIN and its total assimilation into PON (based on regression analysis according to Equation 7 or 8, Appendix).
NDMSPP /
maximum
DIN concentration at
NDMSPP /
maximum
DMSPP produced during total assimilation of 20µM DIN
µmol S / (µmol N·d) µM DIN µM DMSPP A. cartearae 0.029 ± 0.001 0.7 1.2 ± 0.04 H. pygmea 0.084 ± 0.005 2.0 4.5 ± 0.27 P. redfieldii 0.603 ± 0.082 > 50 23 ± 1.85 Rh. baltica 0.042 ± 0.007 > 50 1.7 ± 0.28 Nitzschia sp. 0.007 ± 0.001 1.4 0.3 ± 0.04 Th. concaviuscula 0.437 ± 0.065 2.8 6.0 ± 0.89 E. huxleyi CCMP373 0.189 ± 0.013 > 50 3.3 ± 0.23 P. parvum 0.007 ± 0.001 4.8 0.4 ± 0.06 C. sphaeroidea 0.027 ± 0.001 2.8 0.8 ± 0.03
The DMSP production was overall closely related to the growth rate; however, at the species
level, considerable differences were found, especially in the low and intermediate ranges of
nitrogen concentrations, where changes in the intracellular DMSP concentrations were high
(Fig. 4 and 5). Threshold concentrations of DIN for growth and DMSP production were either
not significant or fell into the nano-molar range of the DIN concentration (Fig. 4). The molar
ratio of the particulate DMSP to particulate organic nitrogen (DMSPP/PON ratio) increased in
eight out of nine cases in response to decreasing DIN concentrations (Fig. 6). The average
increase at a decrease of the DIN concentration from 20 µM DIN to 0.2 µM DIN was by a factor
of 4.4 (±2.7, n = 9) (Table 3, Fig. 6). The only exception to this response was found for P.
redfieldii, where the DMSPP/PON considerably decreased under low DIN concentrations to
about 54% of the values under nitrogen-replete conditions. The decrease of the DMSPP/PON
ratio in P. redfieldii was mainly attributable to the decrease of the intracellular DMSP (Fig. 5).
The N-specific production of DMSP and its relation to concentrations of DIN are presented in
Figure 7 with direct observations and predictions based on the regression analysis of the
inherent parameters (DMSPP/PON ratio and rate of DMSP production). The maxima of the N-
specific DMSP production ranged from 7.2 mmol DMSP mol-1 N day-1 for Nitzschia sp. to 603
mmol DMSP mol-1 N day-1 for P. redfieldii. In contrast to the DMSP production, which
continuously declined in response to decreasing nitrogen concentration (Fig. 4), the N-specific
DMSP production showed intermediate maxima in six out of nine investigated strains (Fig. 7,
Table 4). These intermediate maxima occurred at DIN concentrations between 0.7 µM and 4.8
µM. However, in the other cases, the N-specific DMSP production had saturation responses
28
with estimated maxima at DIN concentrations above 50 µM DIN and with a continuous decline
in the course of nutrient depletion (Fig. 7).
2.5 Discussion
With regard to nutrient conditions, the conducted batch culture experiments are best comparable
to fast-developing new production systems like a vernal algal bloom or the margin of an
upwelling system, which are both important sources for the emission of DMS to the atmosphere
(Belviso et al. 1993, Malin et al. 1993, Matrai et al. 1996). However, a nutrient-depleted batch
culture is not directly comparable with a natural oligotrophic system, since the nutrient supply
there can be based on intense regeneration. Nevertheless, the growth conditions for most of the
upper ocean are characterised by a fast seasonal or vertical depletion of dissolved inorganic
nitrogen. During this development most of the investigated algae showed a considerable
increase in their intracellular DMSP concentrations (Table 1, Fig. 5). In two of the
dinoflagellates, a substantial increase in the intracellular DMSP concentration was also observed
during the formation of swarmers (Table 1). This compares to the two phase increase of
DMSPCell observed in Tetraselmis subcordiformis during nitrogen-deficient growth and during
cyst formation by Gröne and Kirst (1992). Interestingly the diatoms investigated in our study
showed, on average, a significantly greater increase in the DMSPcell under nitrogen deficiency
(+235%) than both dinoflagellates (+75%) and Prymnesiophyceae (+51%). However, the
observed SSV of intracellular DMSP concentrations was about two orders of magnitude higher
than the NRV. Significant strain-specific differences of the intracellular DMSP concentration
were found for all three strain couples of Prorocentrum minimum, Prorocentrum triestinum and
Emiliania huxleyi investigated in this study (Table 1), as well as for the two strain couples of
Micromonas pusilla and Imantonia rotunda in Keller et al. (1989) and for at least 3 of 6 strains
of E. huxleyi in Steinke et al. (1998). The observed strain-specific range of the intracellular
DMSP concentrations for nutrient-replete conditions in E. huxleyi presently reaches from 50
mM in CCMP 1516 (Steinke et al. 1998) to 428 mM in CCMP 8613C (=CCMP 376) (Matrai
and Keller 1994) and 464 mM in CCMP 373 (this study). There are also considerable inter-
laboratory variations in the nutrient-replete intracellular DMSP concentration of E. huxleyi, e.g.
Strain L: 157 to 250 mM, strain CCMP 370: 113 to 232 mM, strain CCMP 373 (=BT6): 107 to
242 mM and strain CCMP 378: 59 to 145 mM (Keller et al. 1989, Wolfe and Steinke1996,
Steinke et al. 1998, Keller et al. 1999a, b van Rijssel and Buma 2002, van Rijssel and Gieskes
2002, Slezak and Herndl 2003), which apparently relate to relatively small differences in the
growth conditions. Furthermore, we observed opposing strain-specific responses to nitrogen
29
deficiency between two different strains of E. huxleyi (Table 1). In strain CCMP 2112 the
intracellular DMSP concentration increased under nitrogen deficiency, as previously observed
for a different strain by Turner et al. (1988) but strain CCMP 373 responded in just the opposite
manner and decreased its intracellular DMSP concentration at low nitrogen concentrations, as
previously observed for CCMP 8613C by Matrai and Keller (1994) and CCMP 378 by Keller et
al. (1999a). All this points to an amazing intra-specific variability, which, for a species of such
outstanding biogeochemical importance (Holligan et al. 1993, Malin et al. 1993), deserves more
attention in future research, to provide adequate biological information for improved models of
biogeochemical cycles in the upper ocean (Archer et al. 2002, Gabric et al. 2004).
The manifestation of class-specific differences in levels of intracellular DMSP between major
phytoplankton groups is partly obscured by high SSV and is potentially biased by the selection
of several vigorously DMSP-producing dinoflagellate genera. However, the main trends
outlined by Keller et al. (1989) are apparent also in this investigation. But care should to be
taken, especially in the case of diatoms, not to make a direct connection between the level of
intracellular concentration and the productivity of DMSP. The actual concentration in the
diatom cytoplasm may be much higher than that calculated for the whole cell, since there is no
DMSP synthesis in the cell vacuole and membranes are not freely permeable for DMSP.
Furthermore, under stable growth conditions, the instantaneous rate of DMSP production does
not depend on the level of intracellular DMSP, but is directly equivalent to the specific growth
rate.
Interestingly the intracellular DMSP concentration in two of the investigated dinoflagellates
(Prorocentrum redfieldii and the swarmers of a Gyrodinium sp.) significantly exceeded the
estimated amount of osmotically required solutes (Table 1). Likewise Matrai and Keller (1994)
presented intracellular DMSP concentrations for Amphidinium carterae (CCMP AMPHI) of
>1565 mM, and also Keller et al. (1989) found intracellular concentrations as high as 1082 mM
and 2201 mM for an unspecified Prorocentrum strain and A. carterae (CCMP AMPHI)
respectively. If we account for all the other vital intracellular solutes, these concentrations
certainly exceed the required amount of osmolyts. With regard to the osmotic pressure and the
excessive cell turgor that would arise, it seems unlikely that in these cases the total cellular
DMSP is freely dissolved in the cytoplasm. We conclude that the apparent osmotic excess of
cellular DMSP has either a reduced osmotic activity or an extra cellular location. Reduced
osmotic activity of DMSP may result from some sort of aggregation, complex binding, or a
close membrane association, but such forms of DMSP are presently unknown. On the other
hand, some dinoflagellates actually have temporarily protruding cell structures e.g. extensive
30
feeding veils (Schnepf and Elbrächter 1992), non-plasmatic extracellular structures or
exopolymer particles (Passow 2002) that could accumulate DMSP and outwit the cell volume
measurement are unknown. However, we do not presently know what actually causes this
apparent osmotic excess.
Turning back to the NRV of the DMSP production, it appeared that the effect of nitrogen
limitation was most pronounced in the molar ratio of DMSP and particulate organic nitrogen
(DMSPP / PON) and its response to decreasing concentrations of DIN (Fig. 6). In eight out of
nine cases the DMSPP/PON increased under nitrogen-deficient growth conditions. For a
decrease in the DIN concentration from 20 µM to 0.2 µM, the DMSPP/PON increased, on
average, by a factor of 4.4 (±2.7, n = 9) (Table 3, Fig. 6). The only case in which the
DMSPP/PON decreased under nitrogen-limited conditions compared to nitrogen-replete
conditions was P. redfieldii, which had the highest DMSPP/PON and DMSPcell values observed
in this study (Table 3, Fig. 6). Apart from this exceptional case, the observed range of
DMSPP/PON ratios under nitrogen-replete conditions (0.014 to 0.211 µmol S µmol-1 N, n=8)
was comparable to values re-calculated from data presented by Matrai and Keller (1994) (0.036
– 0.263 µmol S / µmol N, n=4) , by Keller et al. (1999b) (0.075 to 0.486 µmol S / µmol N, n=6)
and Steinke et al. (1998) (0.023 to 0.205 µmol S / µmol N, n=6). The transition of the DMSP /
PON ratio from the N-replete to the N-deficient state was quite sharp and occurred at a DIN
concentration of about 2.5 µM (Fig. 6). Such transitions were also apparent in all cell- and
growth parameters at about the same level of DIN. It is notable that comparable nitrogen
concentrations are also critical for the transition in natural plankton communities from the new
production to the regenerating system (Dortch and Packard 1989; Taylor et al. 1993; Longhurst
1995).
The published data on the effect of N limitation on the levels of intracellular DMSP are
conflicting (Stefels 2000). However including this study (n=32) a total of 45 strains of DMSP-
producing phytoplankton have now been investigated as to their response to N limitation
(excluding overlaps and 0-producers); 4 strains responded indifferently, 11 strains decreased-
and 29 strains increased their intracellular DMSP concentrations under-nitrogen deficient
growth conditions (Turner et al. 1988, Gröne and Kirst 1992, Keller and Korjeff-Bellows 1996,
Keller et al. 1999a,b, Bucciarelli and Sunda 2003).
The ultimate physiological cause for the overall increase of the intracellular DMSP
concentration under nitrogen-deficient growth conditions, especially in relation to cellular
nitrogen, is presently not fully understood. Andreae (1986) was the first to suggest a role of
nitrogen supply in the DMSP production and to propose that DMSP, as a nitrogen-free
31
osmolyte, might be preferentially used and substituted for nitrogen-containing osmolytes
(glycine betaine, free amino acids, proline, homarine) under nitrogen-deficient growth
conditions. The observed increase of the DMSPP / PON ratio under nitrogen limitation (Fig. 6)
supports this hypothesis. However, Keller et al. (1999a,b), who addressed a series of elaborate
experiments to the substitution hypothesis, did not find a reciprocal relation between major N-
containing osmolytes and DMSP, and further concluded that the dominance of DMSP makes a
reciprocal relation unlikely in most species. Stefels (2000) suggested that increased DMSP
production may function as an overflow mechanism, allowing continued carbon and sulphate
assimilation and a re-allocation of nitrogen from the DMSP-precursor methionine to other
amino acids under nitrogen limitation and other physiological stress conditions. Consistent with
the overflow hypothesis, Gröne and Kirst (1992) found that additions of methionine caused a
significant increase of DMSP synthesis in Tetraselmis subcordiformis. Furthermore, there seems
to be a link between nutrient limitation, oxidative stress on the cell metabolism and the
antioxidant function of DMSP, its enzymatic cleavage product DMS and acrylate as well as its
oxidation products dimethylsulphoxide and methane sulphinic acid (Sunda et al. 2002).
However, the NRV of the intracellular DMSP had usually only a limited effect on the overall
decrease of the rate of DMSP production at decreasing DIN concentrations. The DMSP
production followed in most cases broadly the decline of the specific growth rate (Fig. 4).
Nevertheless in five of nine cases DMSP production at low DIN concentrations was
significantly higher than the growth rate, and in three of these cases (A. carterae, H. pygmea and
R.baltica) the DMSP production continued at DIN concentrations at which the cell growth had
ceased (Fig. 4). Since a phytoplankton bloom is often dominated by a few or just one species we
considered what would theoretically happen if 99 % of an initial DIN pool of 20 µM would be
assimilated into phytoplankton PON by different mono-species blooms of the investigated
phytoplankton strains. We therefore determined the relation between the DMSPP / PON ratio
and the DIN concentration (Equation 7 and 8, Appendix) and integrated over the range of 0.2 to
20 µM DIN (Table 4). For example, a bloom of A. carterae starts with a production of about
0.015 µmol DMSP µmol-1 PON day-1 and increases its production to 0.028 µmol DMSP µmol-1
PON day-1 by the end of the bloom (Fig. 7); overall it would overall yield about 1.2 µM
particulate DMSP. A bloom of E. huxleyi (CCMP373) would similarly produce about 0.029
µmol DMSP µmol-1 PON day-1 by the end of the bloom but would end up with a yield of about
3.3 µmol DMSP, because it has a much higher N-specific DMSP production at high DIN
concentration than A. carterae. The highest yield of about 23 µM DMSP would be achieved by
P. redfieldii. But interestingly a bloom of Thalassiosira concaviuscula, which has a relatively
32
low intracellular DMSP concentration but a high DMSPP/PON ratio, would even yield about 6.0
µM particulate DMSP. This comparison should clearly point out the potential underevaluation
of diatoms when productivity is inferred just from the levels of intracellular DMSP.
Nevertheless, in view of the enormous SSV of both the intracellular DMSP levels as well as the
N-specific rates and ratios, it seems initially that total whole productivity in natural
phytoplankton is driven primarily by species composition and succession. However the more
diverse a community is, the less relevant individual differences are (SSV) and, hence, the more
relevant the average NRV becomes. Since the community smoothing of individual differences
applies, of course, also to the N-specific DMSP production (Fig. 7) we can expect that the more
diverse and evenly distributed the phytoplankton is, the closer it comes to the average NRV, i.e.
a constant increase of the DMSP production at decreasing DIN up to a critical concentration of
about 2.5 µM DIN (Table 4) and a sharp decline in the nano-molar range. The full magnitude of
SSV only applies to mono-species blooms. Nevertheless, on a global scale, the overall regular
and unidirectional NRV of 1 order of magnitude would clearly dominate over 3 orders of
random SSV. The observed NRV can also explain some of the natural variability of DMS(P)
between different nutrient regimes in the upper ocean (Andreae 1990, Kettle et al. 1999). The
overall predictable NRV of the intracellular DMSP and the DMSPP/PON ratio can be easily
parameterised (Equation 3 and 5, Appendix) and might be useful in nitrogen-based
biogeochemical models of DMS(P) production (Anderson et al. 2001, Gabric et al. 2001, Archer
et al. 2002). However, understanding and predicting the DMSP production of natural
phytoplankton communities clearly requires further investigation of the response to their
physical environment.
Acknowledgments We thank H. Halliger and M. Elbrächter (AWI) for contributing diatom- and dinoflagellate strains and K. Nachtigall and P. Fritsche (IfM) for assistance with particle- and nutrient analysis. This work was supported by the Deutsche Forschungsgemeinschaft Grant AN191-1. These experiments were conducted in compliance with the current law of the Federal Republic of Germany.
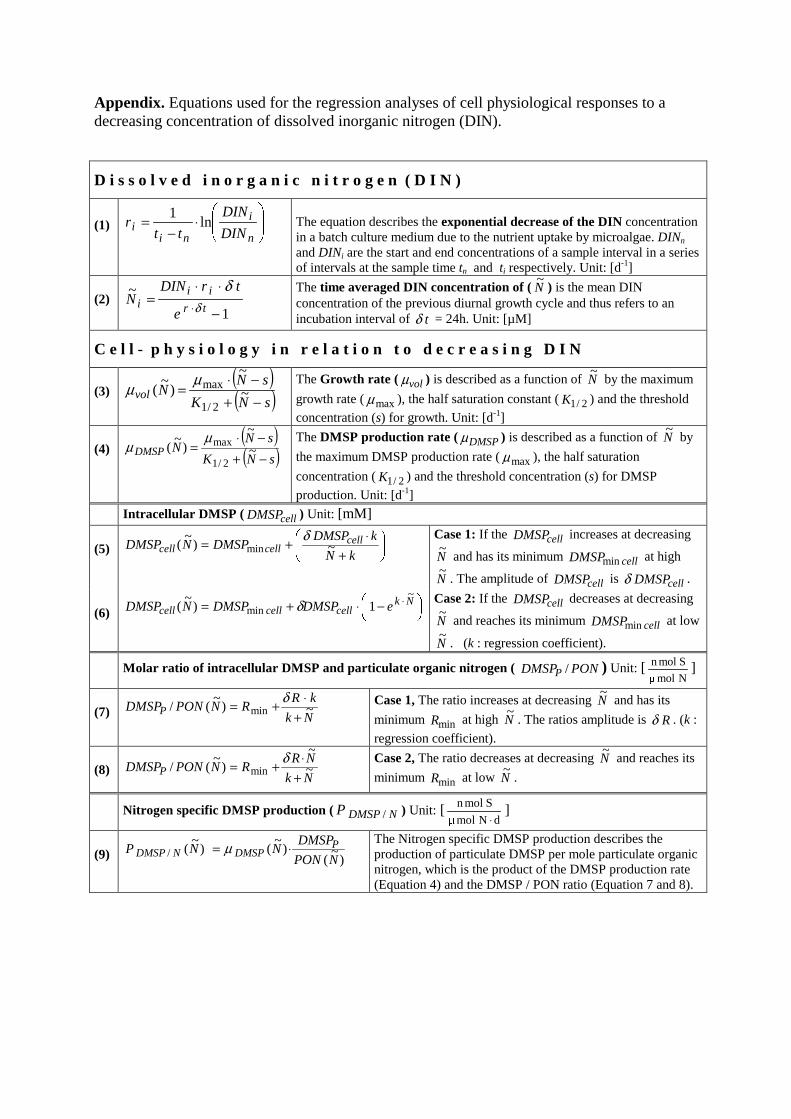
Appendix. Equations used for the regression analyses of cell physiological responses to a decreasing concentration of dissolved inorganic nitrogen (DIN).
D i s s o l v e d i n o r g a n i c n i t r o g e n ( D I N )
(1)
⋅
−=
n
i
nii DIN
DIN
ttr ln
1
The equation describes the exponential decrease of the DIN concentration in a batch culture medium due to the nutrient uptake by microalgae. DINn and DINi are the start and end concentrations of a sample interval in a series of intervals at the sample time tn and ti respectively. Unit: [d-1]
(2) 1
~
−
⋅⋅=
⋅ tr
iii
e
trDINN
δ
δ
The time averaged DIN concentration of ( N~
) is the mean DIN concentration of the previous diurnal growth cycle and thus refers to an incubation interval of tδ = 24h. Unit: [µM]
C e l l - p h y s i o l o g y i n r e l a t i o n t o d e c r e a s i n g D I N
(3)
( )( )sNK
sNNvol −+
−⋅= ~
~)
~(
2/1
maxµµ The Growth rate ( volµ ) is described as a function of N
~ by the maximum
growth rate ( maxµ ), the half saturation constant ( 2/1K ) and the threshold
concentration (s) for growth. Unit: [d-1] (4)
( )( )sNK
sNNDMSP −+
−⋅= ~
~)
~(
2/1
maxµµ
The DMSP production rate ( DMSPµ ) is described as a function of N~
by
the maximum DMSP production rate ( maxµ ), the half saturation
concentration ( 2/1K ) and the threshold concentration (s) for DMSP
production. Unit: [d-1] Intracellular DMSP ( cellDMSP ) Unit: [mM] (5)
+⋅
+=kN
kDMSPDMSPNDMSP cell
cellcell ~)~
( minδ Case 1: If the cellDMSP increases at decreasing
N~
and has its minimum cellDMSPmin at high
N~
. The amplitude of cellDMSP is cellDMSPδ .
(6)
−⋅+= ⋅ Nk
cellcellcell eDMSPDMSPNDMSP~
min 1)~
( δ Case 2: If the cellDMSP decreases at decreasing
N~
and reaches its minimum cellDMSPmin at low
N~
. (k : regression coefficient). Molar ratio of intracellular DMSP and particulate organic nitrogen ( PONDMSPP / ) Unit: [
Nmolµ
Smoln ]
(7)
Nk
kRRNPONDMSPP ~)
~(/ min +
⋅+= δ Case 1, The ratio increases at decreasing N~
and has its
minimum minR at high N~
. The ratios amplitude is Rδ . (k :
regression coefficient). (8) Nk
NRRNPONDMSPP ~
~)
~(/ min +
⋅+= δ Case 2, The ratio decreases at decreasing N~
and reaches its
minimum minR at low N~
.
Nitrogen specific DMSP production ( NDMSPP / ) Unit: [
dNmolµ
Smoln
⋅]
(9)
)~
()
~()
~(/
NPON
DMSPNNP P
DMSPNDMSP ⋅= µ The Nitrogen specific DMSP production describes the production of particulate DMSP per mole particulate organic nitrogen, which is the product of the DMSP production rate (Equation 4) and the DMSP / PON ratio (Equation 7 and 8).
34
3 Seasonal dynamics in production and turnover of DMSP in the North-Sea
Wilhelm Gaul 1 and Justus van Beusekom2.
3.1 Abstract
A series of twelve in situ incubation experiments was conducted between October 2000 and April 2002 at a
coastal time series station in the North Sea. The aim was to assess the seasonality of the production- and turnover
of β-dimethylsulphoniopropionate (DMSP) in relation to the dynamics and growth conditions of phytoplankton.
The seasonal cycle started 2001 with a massive diatom bloom dominated by Odontella aurita
(Bacillariophyceae) which depleted dissolved silicate and phosphate within 2.5 weeks. However, DMSP-
production during this phase (518 nM in 35d ) was of minor importance. A second bloom followed with a mass
development of Phaeocyctis globosa (Haptophyta) which depleted the residual nitrate. The rapid decline of the
Phaeocyctis-bloom was associated with a massive increase of cryptophytes. These mixotrophic flagellates
apparently utilized free single cells of Phaeocyctis as a nutrient source when masses of them left the gelatinous
colonies probably due to phosphate deficiency. The production of particulate DMSP (DMSPP) during
Phaeocyctis- and cryptophyta bloom (4433 nM DMSPP in 45d) accounted for about 73% of the total DMSP
production between March and October. The highest surface concentrations of 14 nM DMS and 67 nM dissolved
DMSP (DMSPD) occurred with an offset of about one week after the DMSPP maximum of 603 nM, which
coincided with the Phaeocystis maximum, a minimum grazing activity and severe nutrient limitation of DMSP-
producing phytoplankton. After the spring bloom the surface concentrations of DMS and DMSP remained
relatively low, except for a short increase mid July which was associated with the occurrence of Emiliania
huxleyi (Haptophyta). A brief autumnal diatom bloom 2001 in contrast to the extended vernal diatom bloom
2002, did not cause any concentration increase of DMS or particulate DMSP. The consumption of DMSPP by
microherbivors was overall closely related to its production by phytoplankton (R²=0.778) and on average
accounted for 94 % of the DMSPP production. Evidence for selective grazing of DMSP-producers by
microherbivores was found in three of ten experiments. However, avoidance was rare compared to
indiscriminate and preferential grazing of DMSP-producers, this investigation does therefore not confirm the
idea that DMSP acts as a chemical defence against herbivores. The consumption of DMSPP was also closely
related (R²=0.991) to the release of DMSPD which on average accounted for 77 % of the consumption of DMSPP
by microherbivores. Most of the observed release of DMSPD is therefore not an additional DMSP production
besides the particulate DMSP production but rather the reoccurrence of the later in the extracellular phase due to
a release mediated by the grazing of microherbivores. Since virtually all of the released DMSP was rapidly
decomposed to DMS or other sulphur compounds by microbial and enzymatic processes, it appears that
microzooplankton herbivory controls the first step in the DMSP conversion from the cell particulate phase to the
sea surface evaporation of DMS.
(1) Leibniz-Institut für Meereswissenschaften an der Universität Kiel, Düsternbrooker Weg 20, 24105 Kiel, Germany
(2) Wadden Sea Station, Alfred-Wegener-Institute for Polar and Marine Research, Hafenstrasse 43, 25992 List, Germany
35
3.2 Introduction
The algal osmolyte β-dimethylsulphoniopropionate (DMSP) is the major precursor of
dimethylsulfide (DMS) (Chalenger and Simpson 1948) which is a climatically important trace
gas and the main natural source of reduced sulphur in the atmosphere (Charlson et al. 1987,
Andreae 1990). The DMSP-production of marine phytoplankton is therefore the basis of the
oceanic DMS production. However, since the DMSP content of marine phytoplankton algae
is highly species-specific (Keller et al. 1989), the concentrations of particulate DMSP in the
sea are only weakly related to bulk parameters of algal biomass (Belviso et al. 2001). A
compilation of over 15000 DMS measurements by Kettle et al. (1999), suggest that hot-spots
of DMS production are located in regions with a seasonal occurrence of phytoplankton
blooms. Some of the highest surface concentrations of DMSP were found associated with
blooms of Emiliania huxleyi in the North Atlantic (Burkill et al., 2002) and Phaeocyctis
blooms in the North Sea (Turner et al., 1996, Kwint and Kramer 1996). The North Sea is an
ideal environment to study the natural production and the microbial turnover of DMSP due to
a strong seasonality of the growth conditions and the associated succession of the plankton
communities from eutrophic coldwater systems to quasi-subtropical oligotrophic nutrient
regenerating systems. The conversion and phase transfer of DMSP from the cell particulate
phase of phytoplankton to extracellular solution and the subsequent volatilisation as
methanethiol (MeSH) and DMS show a strong dependence on microbial food web processes
and in particular to grazing by microherbivors (Wolfe et al. 1994, Christaki et al. 1996) and
bacterial metabolism (Kiene and Linn, 2000). We chose a coastal time series station in the
North Sea as a site to study the production of particulate DMSP and its turnover by
microherbivores in an environment characterized by a strong seasonality of the ambient
nutrient conditions.
3.3 Methods
Sampling
The sampling was carried out at a coastal time series station (55° 02’ N, 008° 27’ E) in the
Northfrisian Wadden Sea (North Sea). Seawater for chemical analysis was collected with
Niskin-bottles (5 dm³) once or twice per week. Samples for the analysis of DMS and
dissolved DMSP were collected from the top inlet of the Niskin-bottles by syringes equipped
with a filter capsule (GF/F, 25mm), a 40cm PTFE tubing and a screw lock valve. This
36
technique excluded particulate DMSP, avoided air contact and allowed a closed sample
transfer to the gas extraction. Samples for nutrients analysis were filtered (nuclepore, 0.45
µm, 47mm ∅) and were analysed within a few hours after sampling or were kept frozen at –
20°C for a later analysis. Samples for the analysis of phytoplankton pigments and particulate
DMSP (DMSPP) were gently filtered on glass fibre filters (Whatman, GF/F) and were
immediately shock frozen in liquid nitrogen and stored at –20°C till analysis (pigment
samples) or enclosed in gastight vials for hydrolysis as described below (DMSPP ). Samples
for the conduction of incubation experiments were collected with a large Niskin-bottle
(25dm³) and were transferred via a wide bore silicone tubing directly into the incubation
bottles (short term inhibition experiments) or into polycarbonate tanks pre-filled with sterile
filtered seawater (serial dilution experiments). All sampling and incubation equipment was
previously cleaned with a dilute detergent (Mucasol) and was rinsed with HCl-solution and
mili-Q water.
Conduction of in situ incubations.
One experiment (DEX-1) was conducted in the centre of an oligotrophic warm water core in
the German bight at 54° 22‘ N, 07° 34‘ E. The other in situ experiments (DEX-2 to DEX-14)
were conducted at a mooring near the coastal time series station. All serial dilution
experiments were carried out in situ by means of a special incubator equipped with a rotation
device for the incubation bottles. The incubator was flexibly linked to a moored surface boy
and set to a floating depth of 5m. Incubations were started at noon and were terminated after
24h incubation. Additional short term inhibition experiments were carried out in parallel and
were terminated after 6h incubation.
Serial dilution experiments
Twelve in situ experiments were carried out (Table1) following the protocol of Landry (1993)
with modifications described in Gaul and Antia (2001) to determine the specific growth rates
and microzooplankton herbivory of total phytoplankton (based on chlorophyll-a) as well as
the production of and consumption of DMSP-producing phytoplankton (based on particulate
DMSP). Five dilution levels (100% to 12% unfiltered seawater) were prepared in
Polyethylene-carboys pre-filled with filtered seawater collected from same depth and location.
Seawater samples were gently pre-screened and transferred to the pre-filled carboys by a
submerged silicon tubing equipped with a meshbag (200µm) on the inlet to exclude
mesozooplankton. The filtered seawater was prepared in three steps: pre-screening through
37
net gauze of 20µm pore size, pre-filtration through glass fibre filter (GF/F, Whatman) and
sterile filtration through a cellulose acetate membrane (0.2µm pore size). Two subsamples of
each dilution were transferred to polycarbonate bottles (2.2 dm3, Nalgene) and received a
full set of nutrient-enrichments (20 µM NaNO3, 0.5 µM NH4Cl2, 2 µM KH2PO4 , 5 µM
Si(OH)4, 1 µM Na2EDTA, 0,1 µM FeSO4 and 0,01 µM MnCl2). To determine the effect of
selective nutrient enrichment, six additional subsamples of undiluted seawater were prepared
of which two received no enrichments, two received a selective nitrate-enrichment and two
received a selective silicate-enrichment. Samples of 0.25 to 1 dm3 for the determination of the
initial concentration of particulate DMSP, chlorophyll-a and accessory marker pigments were
taken immediately after dilution from each carboy and were filtered through GF/F filters (25
mm ∅). DMSPP samples were incubated for hydrolysis in vials with strong base as described
below, pigment samples were immediately frozen in liquid N2 and stored at -25°C until
analysis. Experiments were terminated after about 24 h in situ incubation when samples of
0.25 to 1 dm³ were filtered as above from each incubation bottle. Initial samplings were
generally completed within 1 hour after the collection of seawater and were taken as the start
points of the incubations. The experiment duration was determined individually for each
dilution level as the time interval from the initial (t0) sampling of diluted seawater from
carboys, to the final (t1) sampling of seawater from incubation bottles.
Short term inhibition experiments
Four additional subsamples of the above undiluted seawater (200µm screened) were used to
determine the total release of dissolved DMSP by exudation, cell-lysis and herbivory (R) and
the microbial and enzymatic decomposition of dissolved DMSP (D). Two of these subsamples
were untreated and used to determine the net production of dissolved DMSP. The other two
subsamples were treated with 50 µM glycine betaine (Sigma, B-3501) which is a structural
analogue of DMSP and a potent short-term inhibitor of DMSP decomposition (Kiene and
Gerard, 1995) and with the broad spectrum antibiotics (tetracycline, Fluka 87130 and
chloramphenicole, Fluka 23275) according to Kiene (1990) to inhibit both microbial and
enzymatic decomposition of dissolved DMSP. The total release of dissolved DMSP was
determined from the liberation of dissolved DMSP after 6h incubation with inhibitors. The
microbial and enzymatic decomposition of dissolved DMSP was calculated from the
difference of the total release of dissolved DMSP and its net production in the untreated
incubations.
38
Nutrient analysis
Nutrient samples of the experiments were passed through Whatman GF/F filters and were
analysed according to Hansen and Koroleff (1999). Samples were frozen immediately in
250ml PE-bottles and stored at -25° C until analysis. Ammonia, phosphate and silicate
samples from coastal time series station were analysed within 4h after the collection, samples
for nitrate and nitrite were kept frozen as above until analysis in series by an automated
system after Hansen and Koroleff (1999). Nutrient samples from the time series station were
passed through 0.45 µm Nuclepore filters. All samples were frozen at -20°C until analysis
except for dissolved silicate (kept at 4°C until analysis).
Phytoplankton pigments
High performance liquid chromatography (HPLC) was used to analysis the composition of
phytoplankton pigments following the protocol of Mantoura and Llewellyn (1983) with
modifications according to Barlow et al. (1997). Pigments were extracted in 90% acetone with
glass pearls in a cooled sonicator. Extracts were cleared by ultra-centrifugation and filtration
through a Teflon membrane. A temperature controlled autosampling- and injection system
(WATERS 717 plus) was used to mix the purified extract and ammonium acetate buffer
solution immediately before the injection into the WATERS 996 chromatographic system,
equipped with a C18-NUCLEOSIL column (4.6 x 250mm, MACHERY-NAGEL). Pigments
were detected spectrophotometrically by a photodiode array and peak areas were integrated at
440 nm. Pigments were identified according to retention time and absorption spectra by
comparison with references obtained from highly purified pigment standards (Water Quality
Inst., Hørsholm, DK).
DMS analysis
The measurements basically followed the protocol of Kiene (1993) and were carried out on a
Varian gas-chromatograph (GC-6000) equipped with a flame photometric detector
(Thermoquest FPD-800) and a fused silica capillary column (CP-Sil 5 CB Chrompack: 30m x
0,32mm). Samples were cryofocused in a closed PTFE purge and trap system without internal
glass or metal surfaces. The filtered seawater samples (10 – 50 ml) were purged for 5min with
a flow of finely dispersed He (80 ml · min-1). The gas stream was efficiently dried by
condensation of water vapour in lopes of PTFE tubing which were tightly fitted into an
aluminium block and cooled by Peltier elements to –20°C to condense and freeze water
vapour during the gas extraction. The block was heated to +60°C after extraction to melt and
39
drain of the condensed water. Additionally a PTFE tubing of 15cm length and ¼ in o.d.
packed with K2CO3 was used to extract residual water vapour from the gas stream. A loop of
PTFE tubing of 1/16 in o.d. submerged in liquid nitrogen was used to cryofocus DMS and
was subsequently submerged in a water bath of 60°C to release the extracted gas sample onto
the isothermally (60°C) operated GC column. The system was calibrated according to Turner
et al. (1990) and Uher (1999) with dilutions of DMS standards (Merck No. S28759949)
dissolved in ethylene glycol (Merck No. K27686321017). The detection level was about 0.5
pmol DMS.
Dissolved DMSP (DMSPd)
DMSP was determined as DMS which is released in an equimolar ratio after cold hydrolysis
with a strong base according to Kiene (1993). Seawater samples were filtered (GF/F) and
purged to remove DMS and particulate DMSP prior to hydrolysis and were analysed by the
purge and trap procedure as described above for DMS.
Particulate DMSP (DMSPp)
Gas phase measurements were applied to determine particulate DMSP as DMS which is
released in an equimolar ratio after cold alkaline hydrolysis according to Steinke et al. (1998).
Sub-samples of 10 - 60 ml from the cell cultures were filtered on glass fibre filters (Whatman,
GF/F) and were hydrolysed with 4ml of 2N NaOH for 8 - 24h in Teflon sealed screw cap
vials (25ml). The vials were then incubated in a water bath at 60°C for 30 min and were
equilibrated by sonication before replicate gas samples of 25 – 250 µl were taken from the
headspace by gastight microlitre syringes. The gas samples were directly injected via a
Teflon-sealed injection-liner on a gas chromatograph (Varian, GC-6000) equipped with a
isothermally (60°C) operated fused silica capillary (Chrompack, CP-Sil 5 CB 15m x 0,32mm)
and a flame photometric detector (Thermoquest, FPD-800). A dilution series of ultra pure
DMSP-HCl (CASS, University of Groningen) dissolved in mili-Q water was used for
calibration. The diluted DMSP standards (1 ml aliquots) were hydrolysed together with a
blank filter by 3 ml of 2N NaOH in Teflon sealed screw cap vials (25ml) and were analysed
as described above. The calibration coefficients were determined according to Uher (1999).
The detection limit for a 250 µl headspace injection was 0.5 pmol DMS.
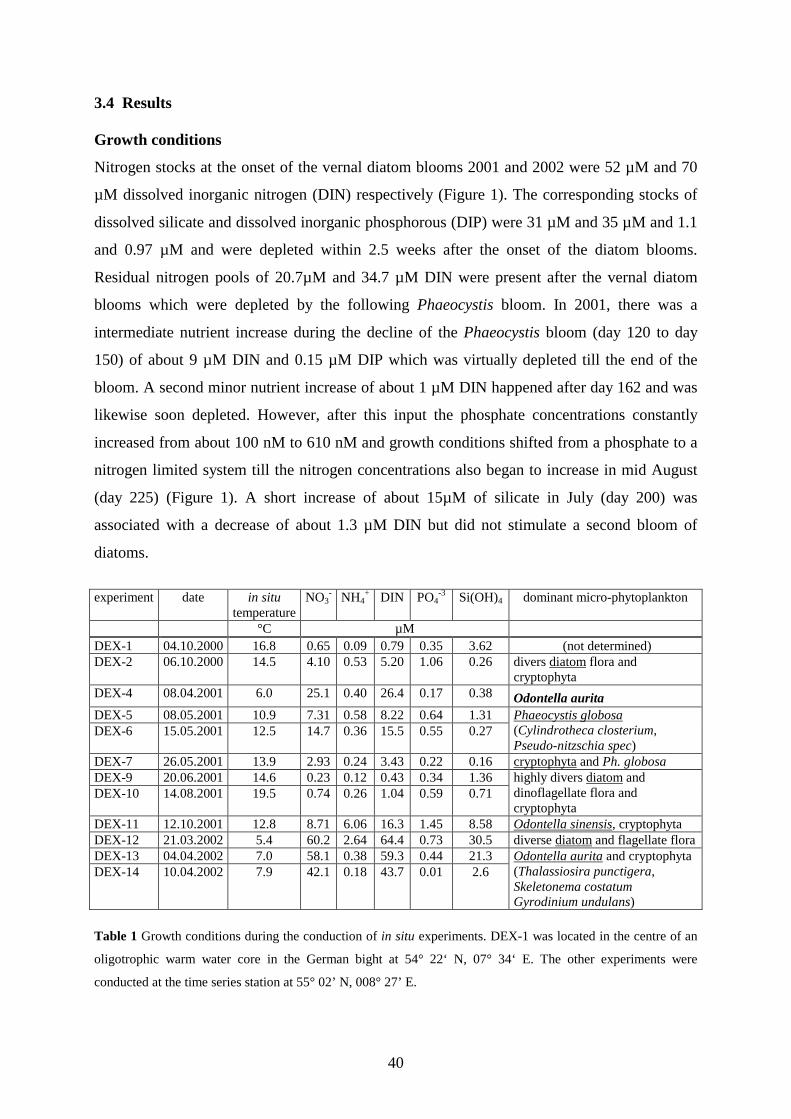
40
3.4 Results Growth conditions
Nitrogen stocks at the onset of the vernal diatom blooms 2001 and 2002 were 52 µM and 70
µM dissolved inorganic nitrogen (DIN) respectively (Figure 1). The corresponding stocks of
dissolved silicate and dissolved inorganic phosphorous (DIP) were 31 µM and 35 µM and 1.1
and 0.97 µM and were depleted within 2.5 weeks after the onset of the diatom blooms.
Residual nitrogen pools of 20.7µM and 34.7 µM DIN were present after the vernal diatom
blooms which were depleted by the following Phaeocystis bloom. In 2001, there was a
intermediate nutrient increase during the decline of the Phaeocystis bloom (day 120 to day
150) of about 9 µM DIN and 0.15 µM DIP which was virtually depleted till the end of the
bloom. A second minor nutrient increase of about 1 µM DIN happened after day 162 and was
likewise soon depleted. However, after this input the phosphate concentrations constantly
increased from about 100 nM to 610 nM and growth conditions shifted from a phosphate to a
nitrogen limited system till the nitrogen concentrations also began to increase in mid August
(day 225) (Figure 1). A short increase of about 15µM of silicate in July (day 200) was
associated with a decrease of about 1.3 µM DIN but did not stimulate a second bloom of
diatoms.
experiment date in situ
temperature NO3
- NH4+ DIN PO4
-3 Si(OH)4 dominant micro-phytoplankton
°C µM DEX-1 04.10.2000 16.8 0.65 0.09 0.79 0.35 3.62 (not determined) DEX-2 06.10.2000 14.5 4.10 0.53 5.20 1.06 0.26 divers diatom flora and
cryptophyta DEX-4 08.04.2001 6.0 25.1 0.40 26.4 0.17 0.38 Odontella aurita DEX-5 08.05.2001 10.9 7.31 0.58 8.22 0.64 1.31 DEX-6 15.05.2001 12.5 14.7 0.36 15.5 0.55 0.27
Phaeocystis globosa (Cylindrotheca closterium, Pseudo-nitzschia spec)
DEX-7 26.05.2001 13.9 2.93 0.24 3.43 0.22 0.16 cryptophyta and Ph. globosa DEX-9 20.06.2001 14.6 0.23 0.12 0.43 0.34 1.36 DEX-10 14.08.2001 19.5 0.74 0.26 1.04 0.59 0.71
highly divers diatom and dinoflagellate flora and cryptophyta
DEX-11 12.10.2001 12.8 8.71 6.06 16.3 1.45 8.58 Odontella sinensis, cryptophyta DEX-12 21.03.2002 5.4 60.2 2.64 64.4 0.73 30.5 diverse diatom and flagellate flora DEX-13 04.04.2002 7.0 58.1 0.38 59.3 0.44 21.3 DEX-14 10.04.2002 7.9 42.1 0.18 43.7 0.01 2.6
Odontella aurita and cryptophyta (Thalassiosira punctigera, Skeletonema costatum Gyrodinium undulans)
Table 1 Growth conditions during the conduction of in situ experiments. DEX-1 was located in the centre of an
oligotrophic warm water core in the German bight at 54° 22‘ N, 07° 34‘ E. The other experiments were
conducted at the time series station at 55° 02’ N, 008° 27’ E.
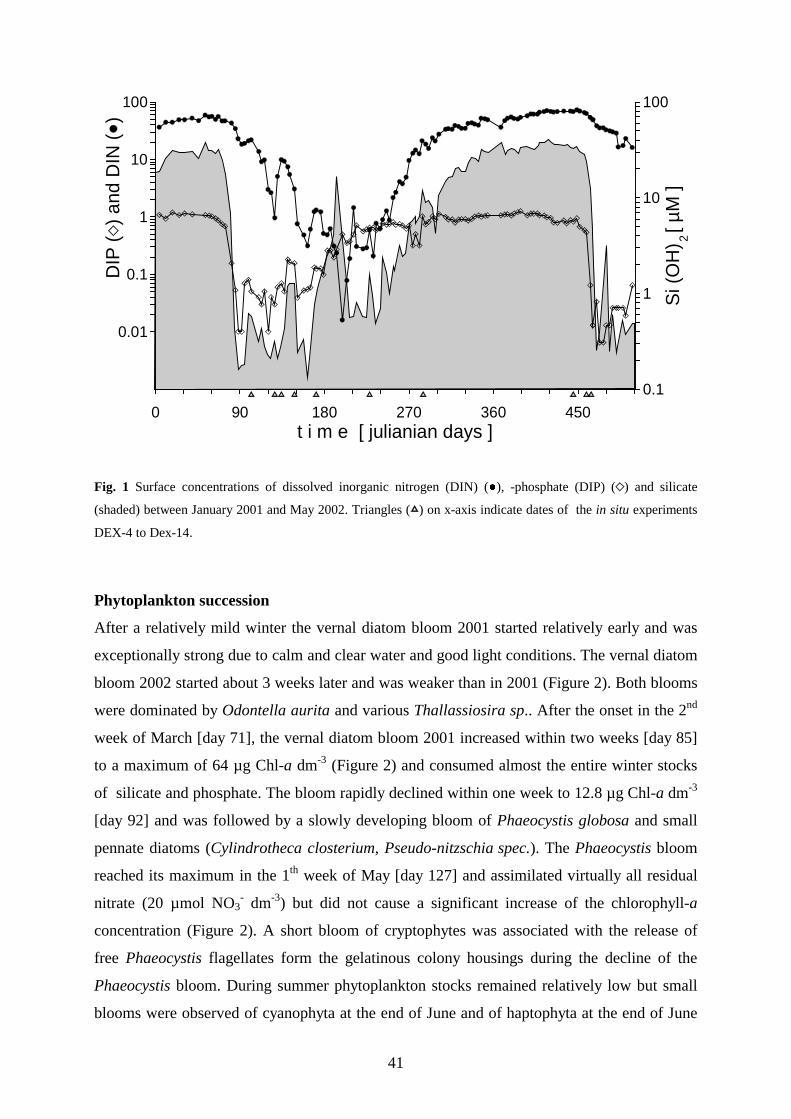
41
0 90 180 270 360 450t i m e [ julianian days ]
0.01
0.1
1
10
100D
IP (
) a
nd D
IN (
)
0.1
1
10
100
Si (
OH
) [
µM ]
2
Fig. 1 Surface concentrations of dissolved inorganic nitrogen (DIN) (●), -phosphate (DIP) ( ) and silicate
(shaded) between January 2001 and May 2002. Triangles ( ) on x-axis indicate dates of the in situ experiments
DEX-4 to Dex-14.
Phytoplankton succession
After a relatively mild winter the vernal diatom bloom 2001 started relatively early and was
exceptionally strong due to calm and clear water and good light conditions. The vernal diatom
bloom 2002 started about 3 weeks later and was weaker than in 2001 (Figure 2). Both blooms
were dominated by Odontella aurita and various Thallassiosira sp.. After the onset in the 2nd
week of March [day 71], the vernal diatom bloom 2001 increased within two weeks [day 85]
to a maximum of 64 µg Chl-a dm-3 (Figure 2) and consumed almost the entire winter stocks
of silicate and phosphate. The bloom rapidly declined within one week to 12.8 µg Chl-a dm-3
[day 92] and was followed by a slowly developing bloom of Phaeocystis globosa and small
pennate diatoms (Cylindrotheca closterium, Pseudo-nitzschia spec.). The Phaeocystis bloom
reached its maximum in the 1th week of May [day 127] and assimilated virtually all residual
nitrate (20 µmol NO3- dm-3) but did not cause a significant increase of the chlorophyll-a
concentration (Figure 2). A short bloom of cryptophytes was associated with the release of
free Phaeocystis flagellates form the gelatinous colony housings during the decline of the
Phaeocystis bloom. During summer phytoplankton stocks remained relatively low but small
blooms were observed of cyanophyta at the end of June and of haptophyta at the end of June
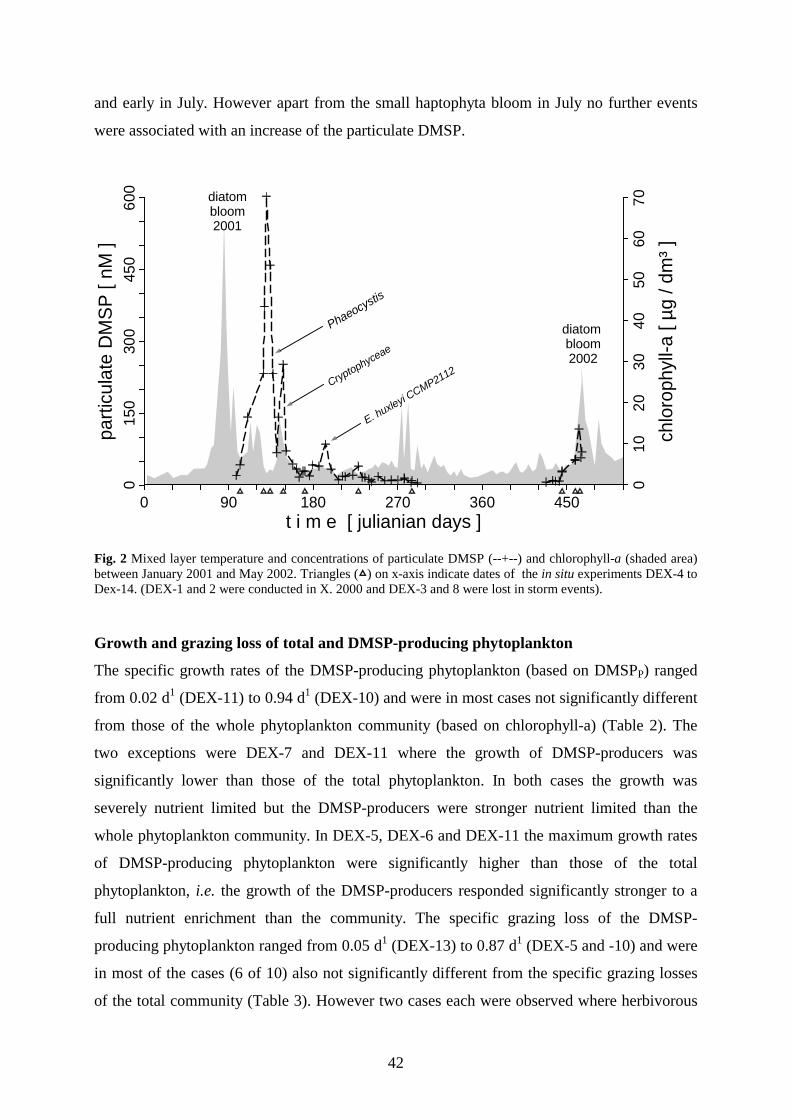
42
and early in July. However apart from the small haptophyta bloom in July no further events
were associated with an increase of the particulate DMSP.
0 90 180 270 360 450t i m e [ julianian days ]
015
030
045
060
0
part
icul
ate
DM
SP
[ nM
]
010
2030
4050
6070
chlo
roph
yll-a
[ µg
/ dm
³ ]
diatombloom2001
diatom bloom2002
Phaeocystis
E. huxleyi CCMP2112
Cryptophyceae
Fig. 2 Mixed layer temperature and concentrations of particulate DMSP (--+--) and chlorophyll-a (shaded area) between January 2001 and May 2002. Triangles ( ) on x-axis indicate dates of the in situ experiments DEX-4 to Dex-14. (DEX-1 and 2 were conducted in X. 2000 and DEX-3 and 8 were lost in storm events). Growth and grazing loss of total and DMSP-producing phytoplankton
The specific growth rates of the DMSP-producing phytoplankton (based on DMSPP) ranged
from 0.02 d1 (DEX-11) to 0.94 d1 (DEX-10) and were in most cases not significantly different
from those of the whole phytoplankton community (based on chlorophyll-a) (Table 2). The
two exceptions were DEX-7 and DEX-11 where the growth of DMSP-producers was
significantly lower than those of the total phytoplankton. In both cases the growth was
severely nutrient limited but the DMSP-producers were stronger nutrient limited than the
whole phytoplankton community. In DEX-5, DEX-6 and DEX-11 the maximum growth rates
of DMSP-producing phytoplankton were significantly higher than those of the total
phytoplankton, i.e. the growth of the DMSP-producers responded significantly stronger to a
full nutrient enrichment than the community. The specific grazing loss of the DMSP-
producing phytoplankton ranged from 0.05 d1 (DEX-13) to 0.87 d1 (DEX-5 and -10) and were
in most of the cases (6 of 10) also not significantly different from the specific grazing losses
of the total community (Table 3). However two cases each were observed where herbivorous
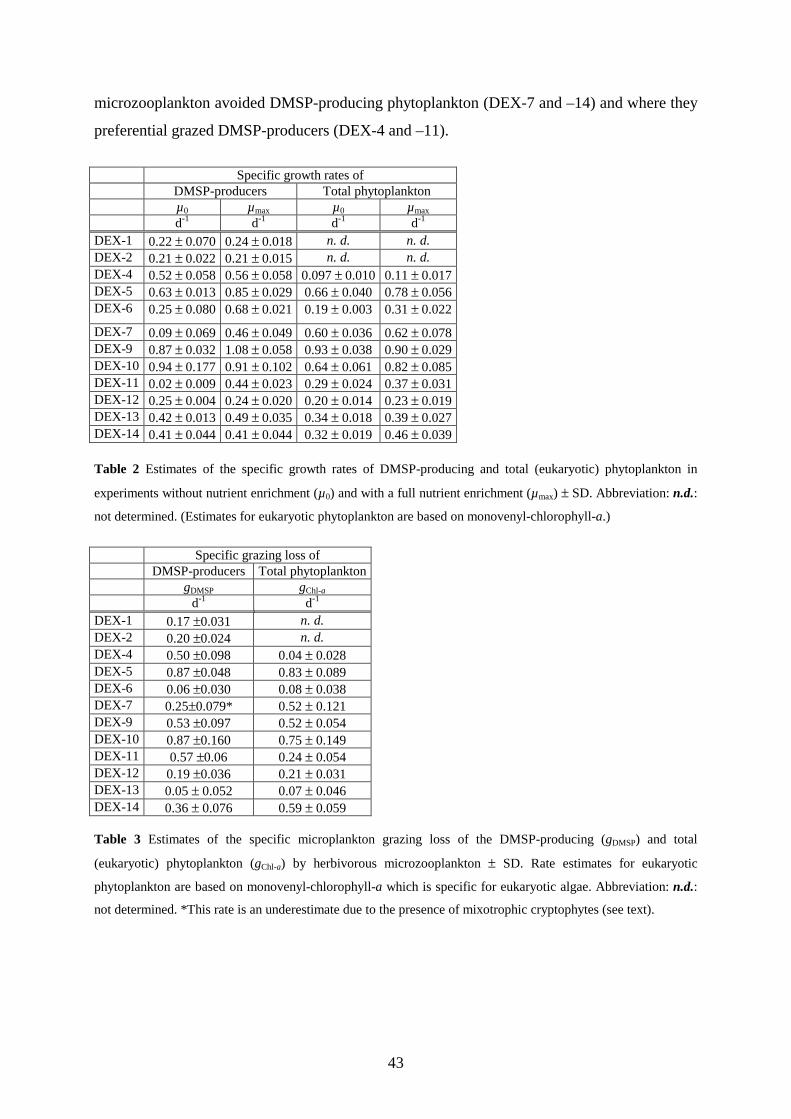
43
microzooplankton avoided DMSP-producing phytoplankton (DEX-7 and –14) and where they
preferential grazed DMSP-producers (DEX-4 and –11).
Specific growth rates of DMSP-producers Total phytoplankton µ0 µmax µ0 µmax d-1 d-1 d-1 d-1 DEX-1 0.22 ± 0.070 0.24 ± 0.018 n. d. n. d. DEX-2 0.21 ± 0.022 0.21 ± 0.015 n. d. n. d. DEX-4 0.52 ± 0.058 0.56 ± 0.058 0.097 ± 0.010 0.11 ± 0.017 DEX-5 0.63 ± 0.013 0.85 ± 0.029 0.66 ± 0.040 0.78 ± 0.056 DEX-6 0.25 ± 0.080 0.68 ± 0.021 0.19 ± 0.003 0.31 ± 0.022
DEX-7 0.09 ± 0.069 0.46 ± 0.049 0.60 ± 0.036 0.62 ± 0.078 DEX-9 0.87 ± 0.032 1.08 ± 0.058 0.93 ± 0.038 0.90 ± 0.029 DEX-10 0.94 ± 0.177 0.91 ± 0.102 0.64 ± 0.061 0.82 ± 0.085 DEX-11 0.02 ± 0.009 0.44 ± 0.023 0.29 ± 0.024 0.37 ± 0.031 DEX-12 0.25 ± 0.004 0.24 ± 0.020 0.20 ± 0.014 0.23 ± 0.019 DEX-13 0.42 ± 0.013 0.49 ± 0.035 0.34 ± 0.018 0.39 ± 0.027 DEX-14 0.41 ± 0.044 0.41 ± 0.044 0.32 ± 0.019 0.46 ± 0.039 Table 2 Estimates of the specific growth rates of DMSP-producing and total (eukaryotic) phytoplankton in
experiments without nutrient enrichment (µ0) and with a full nutrient enrichment (µmax) ± SD. Abbreviation: n.d.:
not determined. (Estimates for eukaryotic phytoplankton are based on monovenyl-chlorophyll-a.)
Specific grazing loss of DMSP-producers Total phytoplankton gDMSP gChl-a d-1 d-1 DEX-1 0.17 ±0.031 n. d. DEX-2 0.20 ±0.024 n. d. DEX-4 0.50 ±0.098 0.04 ± 0.028 DEX-5 0.87 ±0.048 0.83 ± 0.089 DEX-6 0.06 ±0.030 0.08 ± 0.038 DEX-7 0.25±0.079* 0.52 ± 0.121 DEX-9 0.53 ±0.097 0.52 ± 0.054 DEX-10 0.87 ±0.160 0.75 ± 0.149 DEX-11 0.57 ±0.06 0.24 ± 0.054 DEX-12 0.19 ±0.036 0.21 ± 0.031 DEX-13 0.05 ± 0.052 0.07 ± 0.046 DEX-14 0.36 ± 0.076 0.59 ± 0.059 Table 3 Estimates of the specific microplankton grazing loss of the DMSP-producing (gDMSP) and total
(eukaryotic) phytoplankton (gChl-a) by herbivorous microzooplankton ± SD. Rate estimates for eukaryotic
phytoplankton are based on monovenyl-chlorophyll-a which is specific for eukaryotic algae. Abbreviation: n.d.:
not determined. *This rate is an underestimate due to the presence of mixotrophic cryptophytes (see text).
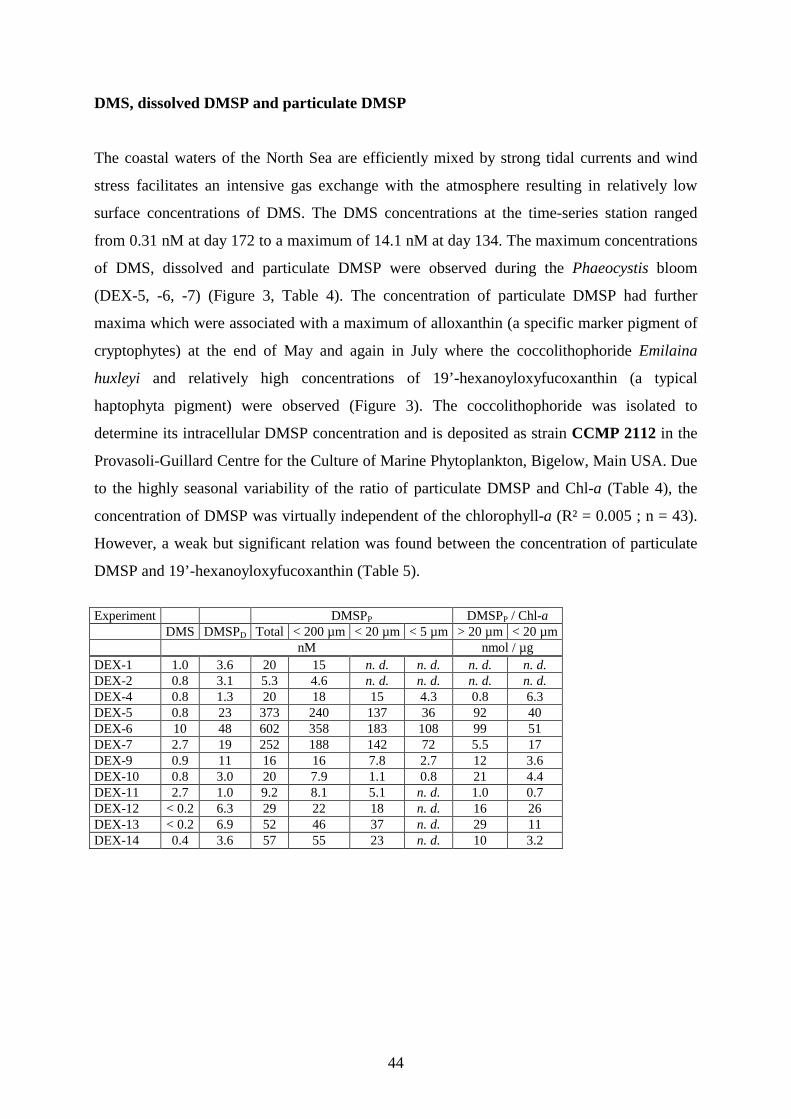
44
DMS, dissolved DMSP and particulate DMSP
The coastal waters of the North Sea are efficiently mixed by strong tidal currents and wind
stress facilitates an intensive gas exchange with the atmosphere resulting in relatively low
surface concentrations of DMS. The DMS concentrations at the time-series station ranged
from 0.31 nM at day 172 to a maximum of 14.1 nM at day 134. The maximum concentrations
of DMS, dissolved and particulate DMSP were observed during the Phaeocystis bloom
(DEX-5, -6, -7) (Figure 3, Table 4). The concentration of particulate DMSP had further
maxima which were associated with a maximum of alloxanthin (a specific marker pigment of
cryptophytes) at the end of May and again in July where the coccolithophoride Emilaina
huxleyi and relatively high concentrations of 19’-hexanoyloxyfucoxanthin (a typical
haptophyta pigment) were observed (Figure 3). The coccolithophoride was isolated to
determine its intracellular DMSP concentration and is deposited as strain CCMP 2112 in the
Provasoli-Guillard Centre for the Culture of Marine Phytoplankton, Bigelow, Main USA. Due
to the highly seasonal variability of the ratio of particulate DMSP and Chl-a (Table 4), the
concentration of DMSP was virtually independent of the chlorophyll-a (R² = 0.005 ; n = 43).
However, a weak but significant relation was found between the concentration of particulate
DMSP and 19’-hexanoyloxyfucoxanthin (Table 5).
Experiment DMSPP DMSPP / Chl-a DMS DMSPD Total < 200 µm < 20 µm < 5 µm > 20 µm < 20 µm nM nmol / µg DEX-1 1.0 3.6 20 15 n. d. n. d. n. d. n. d. DEX-2 0.8 3.1 5.3 4.6 n. d. n. d. n. d. n. d. DEX-4 0.8 1.3 20 18 15 4.3 0.8 6.3 DEX-5 0.8 23 373 240 137 36 92 40 DEX-6 10 48 602 358 183 108 99 51 DEX-7 2.7 19 252 188 142 72 5.5 17 DEX-9 0.9 11 16 16 7.8 2.7 12 3.6 DEX-10 0.8 3.0 20 7.9 1.1 0.8 21 4.4 DEX-11 2.7 1.0 9.2 8.1 5.1 n. d. 1.0 0.7 DEX-12 < 0.2 6.3 29 22 18 n. d. 16 26 DEX-13 < 0.2 6.9 52 46 37 n. d. 29 11 DEX-14 0.4 3.6 57 55 23 n. d. 10 3.2
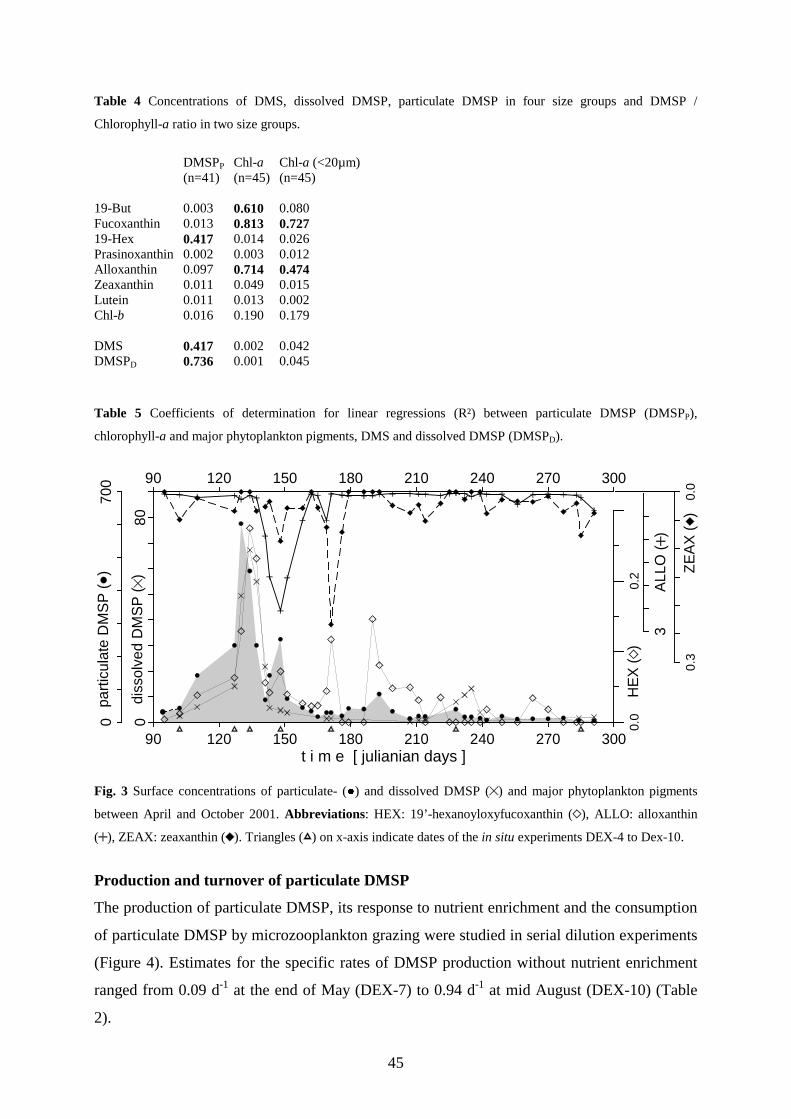
45
Table 4 Concentrations of DMS, dissolved DMSP, particulate DMSP in four size groups and DMSP /
Chlorophyll-a ratio in two size groups.
DMSPP Chl-a Chl-a (<20µm) (n=41) (n=45) (n=45) 19-But 0.003 0.610 0.080 Fucoxanthin 0.013 0.813 0.727 19-Hex 0.417 0.014 0.026 Prasinoxanthin 0.002 0.003 0.012 Alloxanthin 0.097 0.714 0.474 Zeaxanthin 0.011 0.049 0.015 Lutein 0.011 0.013 0.002 Chl-b 0.016 0.190 0.179 DMS 0.417 0.002 0.042 DMSPD 0.736 0.001 0.045 Table 5 Coefficients of determination for linear regressions (R²) between particulate DMSP (DMSPP),
chlorophyll-a and major phytoplankton pigments, DMS and dissolved DMSP (DMSPD).
90 120 150 180 210 240 270 300t i m e [ julianian days ]
080
diss
olve
d D
MS
P (
)
3A
LLO
( )
0.0
0.2
HE
X (
)
90 120 150 180 210 240 270 300
0.0
0.3
ZE
AX
( )
070
0pa
rtic
ulat
e D
MS
P (
)
Fig. 3 Surface concentrations of particulate- (●) and dissolved DMSP ( ) and major phytoplankton pigments
between April and October 2001. Abbreviations: HEX: 19’-hexanoyloxyfucoxanthin ( ), ALLO: alloxanthin
( ), ZEAX: zeaxanthin ( ). Triangles ( ) on x-axis indicate dates of the in situ experiments DEX-4 to Dex-10.
Production and turnover of particulate DMSP
The production of particulate DMSP, its response to nutrient enrichment and the consumption
of particulate DMSP by microzooplankton grazing were studied in serial dilution experiments
(Figure 4). Estimates for the specific rates of DMSP production without nutrient enrichment
ranged from 0.09 d-1 at the end of May (DEX-7) to 0.94 d-1 at mid August (DEX-10) (Table
2).
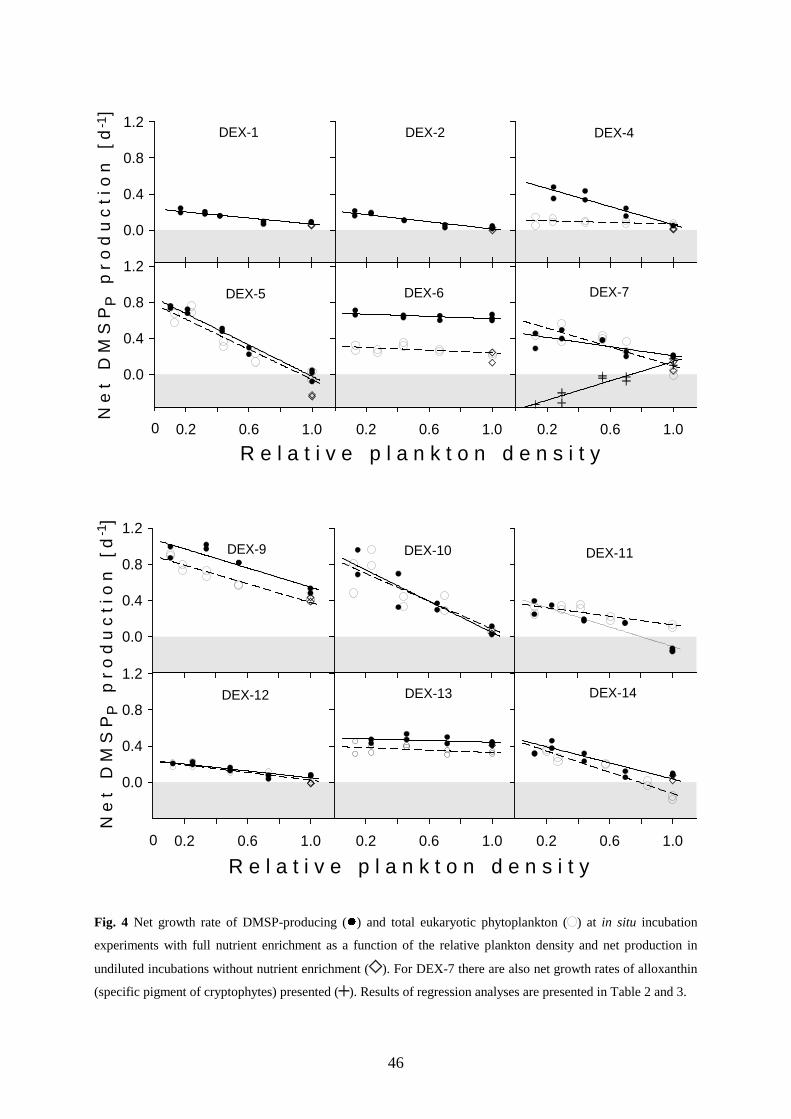
46
0.2 0.6 1.0
0.0
0.4
0.8
1.2
0.2 0.6 1.0
N e
t D
M S
P
p r
o d
u c
t i o
n
[ d
] -
1
R e l a t i v e p l a n k t o n d e n s i t y
0.0
0.4
0.8
1.2
0.2 0.6 1.0
DEX-5 DEX-6 DEX-7
DEX-4DEX-2DEX-1
P
0
0.0
0.4
0.8
1.2
N e
t D
M S
P
p r
o d
u c
t i o
n
[ d
] -
1
R e l a t i v e p l a n k t o n d e n s i t y
DEX-9 DEX-10 DEX-11
P
0.2 0.6 1.0
0.0
0.4
0.8
1.2
0.2 0.6 1.0 0.2 0.6 1.0
DEX-12 DEX-13 DEX-14
0
Fig. 4 Net growth rate of DMSP-producing (�) and total eukaryotic phytoplankton ( ) at in situ incubation
experiments with full nutrient enrichment as a function of the relative plankton density and net production in
undiluted incubations without nutrient enrichment ( ). For DEX-7 there are also net growth rates of alloxanthin
(specific pigment of cryptophytes) presented ( ). Results of regression analyses are presented in Table 2 and 3.
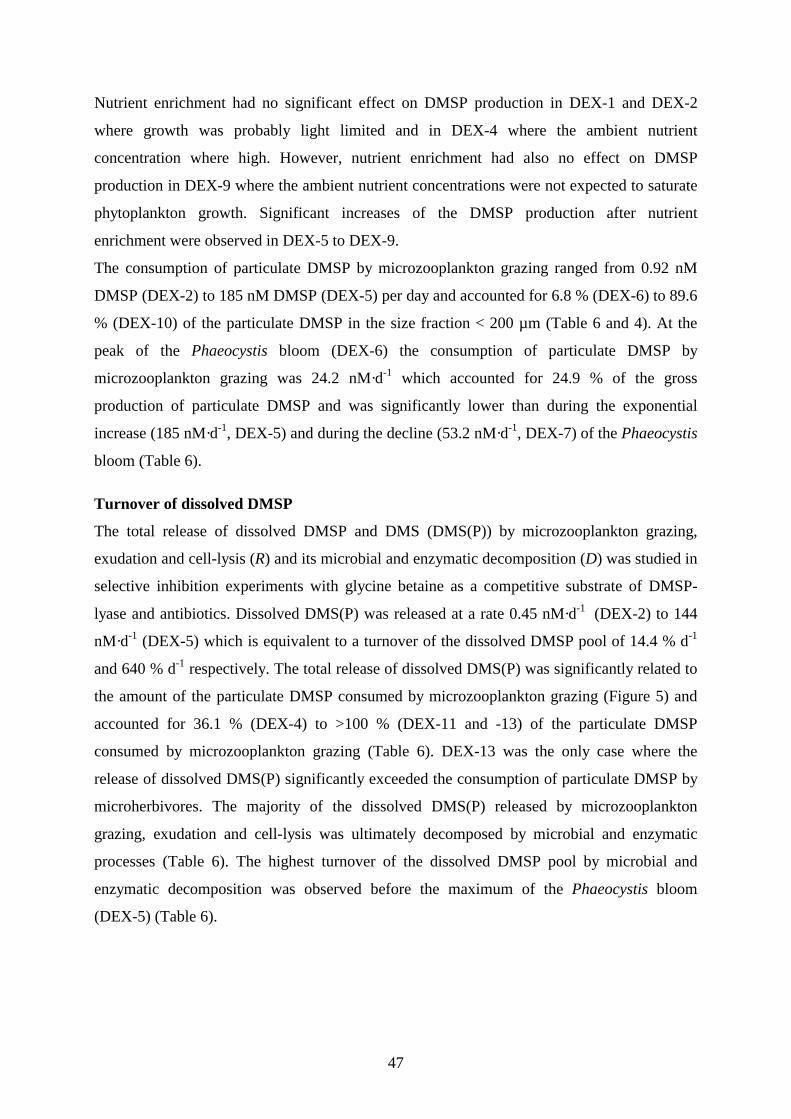
47
Nutrient enrichment had no significant effect on DMSP production in DEX-1 and DEX-2
where growth was probably light limited and in DEX-4 where the ambient nutrient
concentration where high. However, nutrient enrichment had also no effect on DMSP
production in DEX-9 where the ambient nutrient concentrations were not expected to saturate
phytoplankton growth. Significant increases of the DMSP production after nutrient
enrichment were observed in DEX-5 to DEX-9.
The consumption of particulate DMSP by microzooplankton grazing ranged from 0.92 nM
DMSP (DEX-2) to 185 nM DMSP (DEX-5) per day and accounted for 6.8 % (DEX-6) to 89.6
% (DEX-10) of the particulate DMSP in the size fraction < 200 µm (Table 6 and 4). At the
peak of the Phaeocystis bloom (DEX-6) the consumption of particulate DMSP by
microzooplankton grazing was 24.2 nM·d-1 which accounted for 24.9 % of the gross
production of particulate DMSP and was significantly lower than during the exponential
increase (185 nM·d-1, DEX-5) and during the decline (53.2 nM·d-1, DEX-7) of the Phaeocystis
bloom (Table 6).
Turnover of dissolved DMSP
The total release of dissolved DMSP and DMS (DMS(P)) by microzooplankton grazing,
exudation and cell-lysis (R) and its microbial and enzymatic decomposition (D) was studied in
selective inhibition experiments with glycine betaine as a competitive substrate of DMSP-
lyase and antibiotics. Dissolved DMS(P) was released at a rate 0.45 nM·d-1 (DEX-2) to 144
nM·d-1 (DEX-5) which is equivalent to a turnover of the dissolved DMSP pool of 14.4 % d-1
and 640 % d-1 respectively. The total release of dissolved DMS(P) was significantly related to
the amount of the particulate DMSP consumed by microzooplankton grazing (Figure 5) and
accounted for 36.1 % (DEX-4) to >100 % (DEX-11 and -13) of the particulate DMSP
consumed by microzooplankton grazing (Table 6). DEX-13 was the only case where the
release of dissolved DMS(P) significantly exceeded the consumption of particulate DMSP by
microherbivores. The majority of the dissolved DMS(P) released by microzooplankton
grazing, exudation and cell-lysis was ultimately decomposed by microbial and enzymatic
processes (Table 6). The highest turnover of the dissolved DMSP pool by microbial and
enzymatic decomposition was observed before the maximum of the Phaeocystis bloom
(DEX-5) (Table 6).
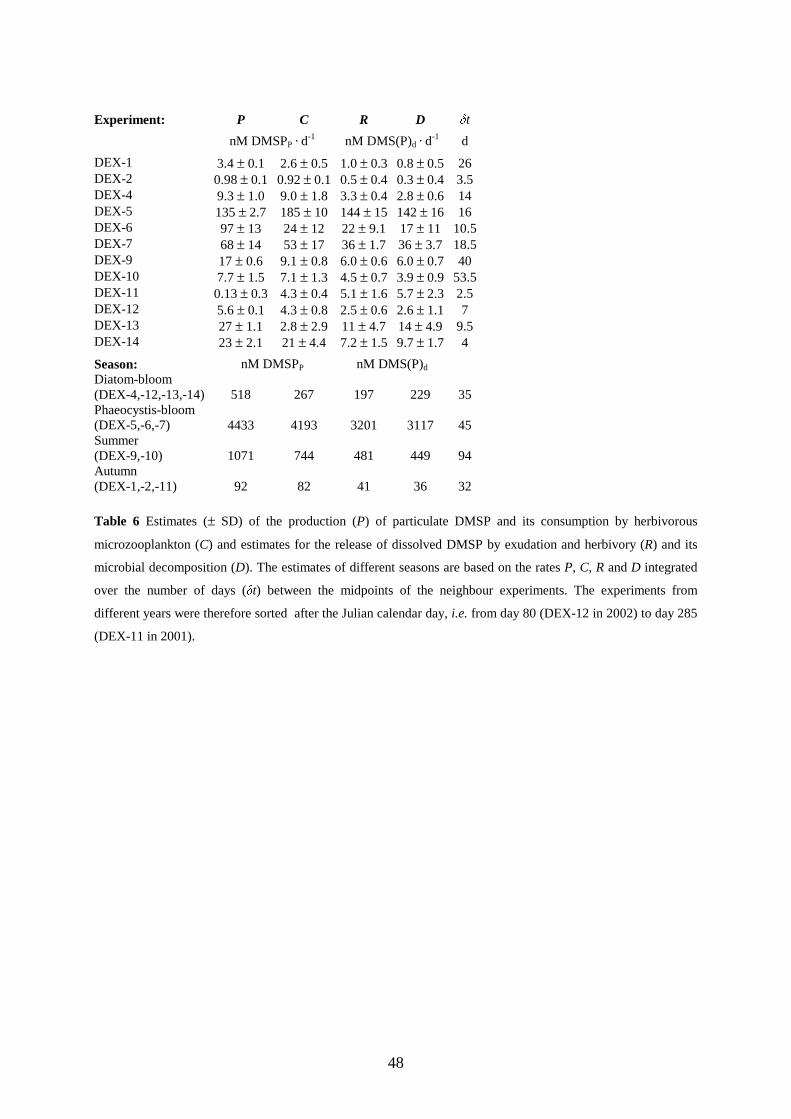
48
Experiment: P C R D δt
nM DMSPP · d-1 nM DMS(P)d · d
-1 d
DEX-1 3.4 ± 0.1 2.6 ± 0.5 1.0 ± 0.3 0.8 ± 0.5 26 DEX-2 0.98 ± 0.1 0.92 ± 0.1 0.5 ± 0.4 0.3 ± 0.4 3.5 DEX-4 9.3 ± 1.0 9.0 ± 1.8 3.3 ± 0.4 2.8 ± 0.6 14 DEX-5 135 ± 2.7 185 ± 10 144 ± 15 142 ± 16 16 DEX-6 97 ± 13 24 ± 12 22 ± 9.1 17 ± 11 10.5 DEX-7 68 ± 14 53 ± 17 36 ± 1.7 36 ± 3.7 18.5 DEX-9 17 ± 0.6 9.1 ± 0.8 6.0 ± 0.6 6.0 ± 0.7 40 DEX-10 7.7 ± 1.5 7.1 ± 1.3 4.5 ± 0.7 3.9 ± 0.9 53.5 DEX-11 0.13 ± 0.3 4.3 ± 0.4 5.1 ± 1.6 5.7 ± 2.3 2.5 DEX-12 5.6 ± 0.1 4.3 ± 0.8 2.5 ± 0.6 2.6 ± 1.1 7 DEX-13 27 ± 1.1 2.8 ± 2.9 11 ± 4.7 14 ± 4.9 9.5 DEX-14 23 ± 2.1 21 ± 4.4 7.2 ± 1.5 9.7 ± 1.7 4
Season: nM DMSPP nM DMS(P)d Diatom-bloom (DEX-4,-12,-13,-14) 518 267 197 229 35 Phaeocystis-bloom (DEX-5,-6,-7) 4433 4193 3201 3117 45 Summer (DEX-9,-10) 1071 744 481 449 94 Autumn (DEX-1,-2,-11) 92 82 41 36 32 Table 6 Estimates (± SD) of the production (P) of particulate DMSP and its consumption by herbivorous
microzooplankton (C) and estimates for the release of dissolved DMSP by exudation and herbivory (R) and its
microbial decomposition (D). The estimates of different seasons are based on the rates P, C, R and D integrated
over the number of days (δt) between the midpoints of the neighbour experiments. The experiments from
different years were therefore sorted after the Julian calendar day, i.e. from day 80 (DEX-12 in 2002) to day 285
(DEX-11 in 2001).
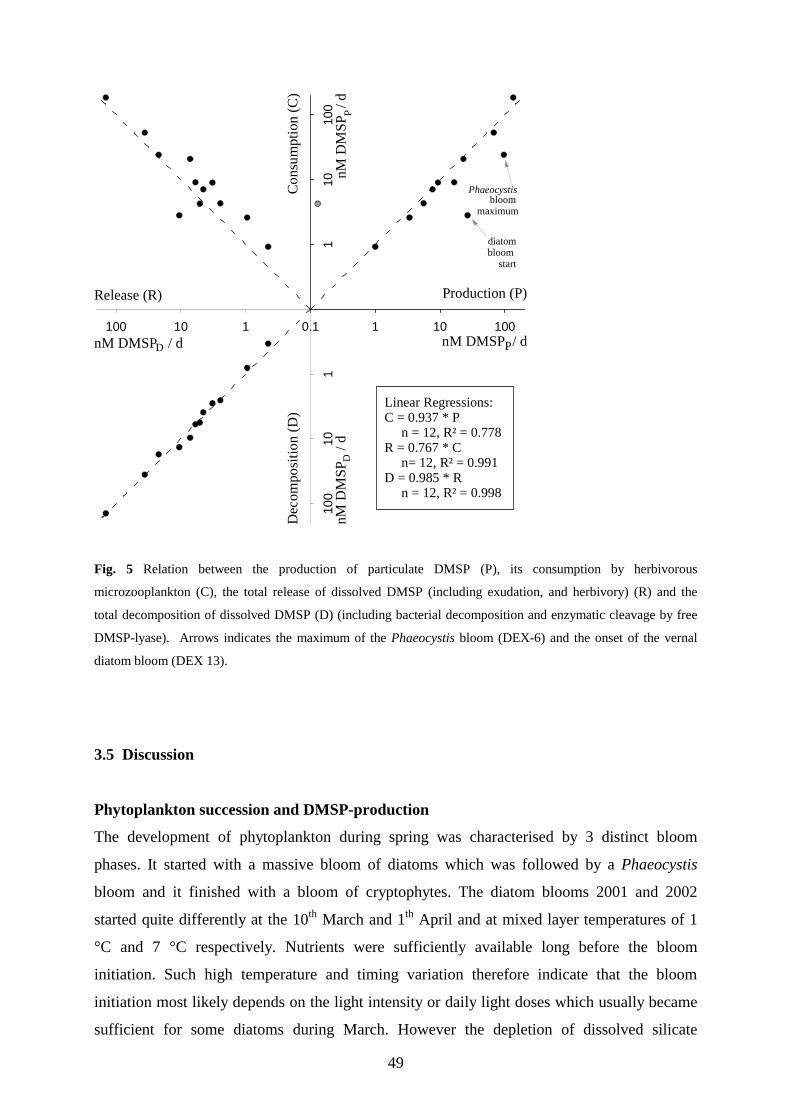
49
0.1 1 10 1001
1010
0
P
bloom maximum
diatombloom
start
110100
P
110
100
Release (R)
nM DMSP / d
Production (P)
nM DMSP / d
Con
sum
ptio
n (C
)
nM D
MSP
/ d
Dec
ompo
sitio
n (D
)
nM D
MSP
/ d
D
Linear Regressions:C = 0.937 * P n = 12, R² = 0.778R = 0.767 * C n= 12, R² = 0.991D = 0.985 * R n = 12, R² = 0.998
D
Phaeocystis
Fig. 5 Relation between the production of particulate DMSP (P), its consumption by herbivorous
microzooplankton (C), the total release of dissolved DMSP (including exudation, and herbivory) (R) and the
total decomposition of dissolved DMSP (D) (including bacterial decomposition and enzymatic cleavage by free
DMSP-lyase). Arrows indicates the maximum of the Phaeocystis bloom (DEX-6) and the onset of the vernal
diatom bloom (DEX 13).
3.5 Discussion
Phytoplankton succession and DMSP-production
The development of phytoplankton during spring was characterised by 3 distinct bloom
phases. It started with a massive bloom of diatoms which was followed by a Phaeocystis
bloom and it finished with a bloom of cryptophytes. The diatom blooms 2001 and 2002
started quite differently at the 10th March and 1th April and at mixed layer temperatures of 1
°C and 7 °C respectively. Nutrients were sufficiently available long before the bloom
initiation. Such high temperature and timing variation therefore indicate that the bloom
initiation most likely depends on the light intensity or daily light doses which usually became
sufficient for some diatoms during March. However the depletion of dissolved silicate
50
terminated the diatom blooms in both years after about 2.5 weeks. Phosphate was likewise
depleted by the end of the bloom but it seemed that its regeneration had already started
because the N:P-ratios between the amount of DIN and DIP consumed during the blooms
were relatively high (2001: 31.3 µM DIN / 1.1 µM DIP and 2002: 35.3µM DIN / 0.97µM
DIP). The decrease of DIN could therefore continue after silicate and DIP were depleted
(Figure 1).
Interestingly according to the constant molar ratio between the silicate- and nitrogen
consumption, the silicate requirements of the vernal diatom blooms 2001 and 2002 were the
same (2001: 31.0 µmol Si / 31.3 µmol DIN and 2002: 34.6 µmol Si / 35.3 µmol DIN). The
silicate concentration at the onset of the diatom bloom therefore largely determined the
residual nitrogen after the diatom bloom and hence constrains the magnitude of the
Phaeocystis bloom which subsequently depleted all winter nitrogen. Such silicate defined
partitioning of new nitrogen between diatom and flagellate dominated communities
potentially applies - except for polar regions and subtropical gyres - to all seasonally affected
ocean regions and upwelling systems. In our study both blooms were temporally clearly
separated, however the partitioning would also apply to cases with a partial or total overlap of
the diatom- and flagellate bloom as long as only silicate depletes before nitrogen.
The partitioning has far reaching consequences for the ocean biogeochemistry in general (e.g.
elemental composition of exported particles) and for the DMSP production in particular since
diatom dominated communities have usually much lower DMSP/Chl-a ratios than flagellate
dominated communities. In our study the Phaeocystis dominated communities (DEX-5 and -
6) had up to 29 times higher DMSP/Chl-a ratios than diatom dominated communities (DEX 4
and –14) (Table 4) and a similar ratio can be assumed for the DMSP-production per unit
nitrogen. Nevertheless the DMSP-production rates during the onset (DEX 13) and near the
maximum of the diatom bloom 2002 (DEX 14) were the second highest after the Phaeocystis
bloom (Table 2 and 6). Furthermore an estimate for the DMSPP concentration at the maxima
of the diatom blooms 2001 and 2002 (based on their Chlorophyll-a concentrations and the
DMSP/Chl-a ratio near the maximum of the diatom bloom 2002 (DEX 14)) gave
concentrations of 348 nM and 157 nM respectively which were exceeded only during the
Phaeocystis bloom. Surface concentrations and production rates during summer and autumn
were insignificant compared to these events. The spring is therefore overall the most
important season for DMSP-production and the diatom bloom considerably contributes to the
vernal DMSP-production.
51
Nutrient saturation of growth and DMSP-production
Although silicate and phosphate were depleted after the diatom bloom (DEX-4) and again
after the Phaeocystis bloom (DEX-7) nutrient enrichment could not stimulate phytoplankton
growth in these cases (Table 2). Nutrient additions did also not increase phytoplankton growth
in an early summer experiment (DEX-9) although the main nutrients were virtually depleted.
An efficient nutrient regeneration could explain nutrient saturated growth in DEX-7 and
DEX-9 but growth in DEX-4 appeared to be suppressed (µ = 0.097) rather than nutrient
saturated also because the DMSP-producing subgroup grew faster (µ = 0.52) and almost
nutrient saturated (µmax = 0.56). The other two cases of nutrient saturated growth and DMSP-
production (DEX-12 and DEX-13) are in accordance with high ambient nutrient
concentrations. Significant nutrient limitation at the community level was found before and
during the Phaeocystis bloom (DEX-5 and DEX-6 respectively), in late summer (DEX-10)
and autumn (DEX-11) 2001 and at the end of the diatom bloom 2002 (DEX-14). Growth of
DMSP-producing phytoplankton was also nutrient limited at DEX-5, 6 and –11 and
additionally in the early summer experiments (DEX-7 and –9) but not in DEX-10 and –14.
The restoration of DIP began in June and was finished in August while DIN and silicate only
began in September and approached winter maxima in December (Figure 2). After the diatom
bloom (DEX-5 to DEX-7 and DEX-14) the limiting nutrient elements were therefore
phosphor and silicate whereas during summer (DEX-9 and –10) nutrient limitation most
likely shifted to nitrogen. In autumn (DEX-11) a trace metal (Fe or Mn) limited growth since
the main nutrients were sufficiently present but growth and even more DMSP-production was
stimulated by nutrient enrichments which included FeSO4, MnCl2 and Na2EDTA (Table 2).
However, light limitation is probably the major factor determining the end of the growth
season which mostly occurs between September and October.
Microzooplankton herbivory and DMSP-consumption
The intensity of microzooplankton grazing seemed to play an important role in the vernal
bloom dynamics. A relatively intense microzooplankton grazing during the diatom bloom
2002 (DEX-14) is most likely the reason for the lower phytoplankton biomass of the bloom
maximum compared to 2001 (64.2 µg Chl-a·dm-3 and 28.9µg Chl-a·dm-3 respectively). This
explains also why the DIN consumption from the start to the maximum of the bloom was
higher in 2002 (20.6 µM) than in 2001 (17.7 µM) especially in relation to the increase of
phytoplankton biomass (2002: 20.6 / 24.1 = 0.86 µmol N / µg Chl-a) (2001: 17.7 / 61.7 = 0.29
µmol N / µg Chl-a) which indicates stronger transfer of nitrogen into heterotrophic biomass
52
and hence higher herbivorous grazing intensity. Unfortunately we have no estimates of
grazing intensity during the diatom bloom 2001, however right after the bloom (DEX-4)
herbivorous microzooplankton grazing was insignificant except for DMSP-producing
phytoplankton which formed only a minor part of the phytoplankton by this time.
The subsequent Phaeocystis bloom encountered intensive herbivorous grazing at the onset
(DEX-5) both at the community level and for DMSP-producing phytoplankton. However a
relatively large fraction of DMSP-producers could probably escape consumption since about
36% was found in the size fraction > 200µm primarily including Phaeocystis colonies. The
Phaeocystis bloom reached its maximum (in terms of the particulate DMSP and 19-hexanoyl-
oxo-fucoxantin concentration; DEX-6) at a time where grazing by herbivorous microplankton
had almost completely ceased and growth of phytoplankton and DMSP-producers was
severely nutrient limited but nevertheless persisted at a low level. The breakdown of the
Phaeocystis bloom was associated with a massive development of cryptophytes which could
have profited from the degradation of the Phaeocystis bloom because these protists typically
include herbi- and bacterivorous mixotrophs. The assumption, that the cryptophytes in DEX-7
were mixotrophes, is supported by the negative dilution response of the net growth rate of the
taxon-specific pigment alloxanthin. The negative dilution response is expected for
mixotrophic protists because their growth depends on the density of food particles which
decreases linearly with dilution (while the common positive response of autotrophic
organisms is caused by the synchronous relieve from grazing pressure. Due to these inverse
dilution responses of the growth of mixo- and autotrophic protists the occurrence of
mixotrophes caused an underestimation of the growth- and grazing estimates at the level of
the phytoplankton community. If these mixotrophs also produced DMSP, the estimates for the
community of DMSP-producers will likewise have been underestimated. According to the
phytoplankton pigment composition (and microscopic observations), cryptophytes were
present in low quantities throughout the whole growth period but formed a sizeable fraction of
phytoplankton only right after the Phaeocystis bloom (DEX-7). Some cryptophytes are fairly
strong DMSP-producers (Keller et al. 1989) and they formed a major DMSP-producing group
in DEX-7, but they contributed only relatively little to the total stock of phytoplankton. The
expected suppression of the dilution response by inverse dilution response of the mixotrophic
cryptophytes in DEX-7 is therefore stronger for the DMSP-producing phytoplankton than for
the whole phytoplankton and might partly explain the differences in the growth and grazing
estimates.
53
In the following we briefly consider possible causes for the remarkably fast decline of the
Phaeocystis bloom. Sinking of cells and colonies is a mechanism that can not be ruled out but
the water column in the Wadden Sea is generally completely mixed. Fast advection of the
water masses by the residual coastal boundary stream in the German Bight cannot be ruled out
for the outer part of the Sylt Rømø Bight, but in general the exchange rates are low: about
10% per tide (Gätje and Reise, 1998). Viral infection was frequently documented in
association with algal blooms in the North Sea although its significance for the collapse of
Phaeocystis blooms is presently unknown (Larsen et al. 2004). However the following
observations may provide an alternative nutrient and grazing related explanation for the rapid
bloom decline. First observation: phosphate was virtually depleted during the decline of the
Phaeocystis bloom. Second observation: masses of gelatinous colony housings of Phaeocystis
globosa were found partly or completely evacuated during the decline of the Phaeocystis
bloom (direct microscopic observations on fresh, unpreserved bottle samples). And finally,
the associated blooming of cryptophytes was apparently not effected by the DIP depletion and
must therefore be based on the utilization of recycled phosphate.
If the Phaeocystis flagellates had escaped due to severe phosphate starvation from their
gelatinous colony housings, which so far gave them shelter against micro-herbivore grazers
but which now certainly hindered a sufficient nutrient transport, they might have become a
direct phosphate source for the mixotrophic cryptophytes.
This hypothesis is supported by (I.) the associated shift in the size distribution of the
particulate DMSP, i.e. the fraction with predominantly single cells (< 5µm) had increased
from 9.7% (DEX-5) to 29% (DEX-7) while the fraction of colony sized DMSP (>200µm)
decreased from 41% (DEX-6) to 25% (DEX-7) (II.) by the inverse changes of the 19-
Hexanoyl-oxo-fucoxanthine (from 0.27 to <0.01 µg·dm³) and alloxanthin concentration (from
0.11 to 1.82 µg·dm³) during the decline of the bloom (between day 137 and day 143
respectively), (III.) by the decrease of the growth of DMSP-producing phytoplankton in the
course from the initiation to the decline of the Phaeocystis bloom, (VI.) by the severe nutrient
limitation of the DMSP-producing phytoplankton during the decline of the bloom and (V.) by
a significant increase of microplankton grazing of DMSP-producing phytoplankton after the
bloom maximum which is actually higher than it appears from the data in Table 3 due to the
above discussed underestimate of grazing during DEX-7 caused by the interference of mixo-
with autotrophic microplankton.
A chemical defence effect of DMSP-producing against herbivorous protists was reported from
various laboratory experiments (Wolfe and Steinke 1996, Strom et al. 2003) and during a
54
coccolithophoride bloom in the North Sea when grazing loss of DMSP producers was
significantly lower than at the community level (Archer et al. 2001). The grazer repellent
effect of DMSP is assumed to be indirectly due to a suggested function as a warning
messenger for the presence of a toxic compound (Strom et al. 2003). The cleavage of DMSP
could theoretically have a negative effect on the digestion process due to the release of DMS,
acrylate and H+. Nevertheless, in the gut of mammals DMSP was found to have a protective
effect under acid stressed digestion (Ishida et al. 1990). Acrylate has only a moderate
antibiotic effect and can be easily metabolised by marine bacteria (Kiene 1990). The existence
of a toxic co-product of the DMSP-synthesis in marine phytoplankton is presently unknown.
The existence of most toxins of marine protista are clearly restricted to a single class or genus
(Hallegraeff 1993) while DMSP is produced in all classes of eukaryotic protists but has an
almost completely random strain- and species-specific variability of the intracellular DMSP-
concentration (Keller et al. 1989, Gaul and Antia 2004). Therefore, a function of DMSP as
warning messenger for a specific toxic compound seems to be unlikely. Furthermore, the
chemical defence hypothesis seems to be in contradiction with recent findings that DMSP as
well as most of its derivates and cleavage products are efficient antioxidants which function
as scavengers of intracellular oxygen radicals (Sunda et al. 2002). A possible detection of the
level of toxic oxygen radicals by the level of intracellular or cell-peripheral DMSP would
certainly be lost in the extremely high taxon-specific variability of intracellular DMSP (Keller
et al. 1989).
Nevertheless, apart from the challenging question how the observed chemical defence of
DMSP against micro-herbivorous may work, it is worthwile to examine its effect on grazing
in natural plankton communities. If DMSP-producing phytoplankton is avoided or less
intensively grazed by microherbivores compared to other eukaryotic phytoplankton, the
specific grazing rates should be lower than for the total eukaryotic community. In two series
of experiments, the one presented here which is conducted in the North Sea and another series
which we conducted in different regions of the tropical Atlantic (data presented elsewhere),
the rate of microplankton grazing on DMSP-producing phytoplankton was on average 2.3
times higher than at the community level. In 4 of 16 cases (here: 2 of 10 cases) the
herbivorous microplankton preferentially grazed DMSP-producing phytoplankton and in
further 4 cases they avoided DMSP-producers. Therefore grazing rates for DMSP-producing
phytoplankton were not significantly related to grazing rates of total phytoplankton (R2 =
0.039 ; n = 16). The observed ambivalence in the selectivity of herbivorous microplankton for
DMSP-producing phytoplankton could be due to an ambivalence of DMSP as a selection
55
factor itself. The cases of preference might be due to an attraction of grazers in the plumes of
dissolved DMSP which can most likely be easily tracked by protists and small metazoa
(Steinke et al. 2002).
Conversion of particulate DMSP to dissolved DMSP and DMS.
The conversion efficiency of the processes which release DMSP from the cell-particulate pool
to solution is an inherently limiting factor for the production of DMS and its ultimate release
to the atmosphere. Cell-lysis and exudation of DMSP are processes which have per se a
conversion efficiency of 1. In contrast the fraction of the ingested cell-particulate DMSP that
is released by microherbivors as DMS or dissolved DMSP is variable (Wolf et al., 1994). The
intensity and the conversion efficiency of herbivorous grazing are therefore important
determinants for the transition of DMSP from the cell-particulate to the dissolved phase and
its further conversion to DMS. Considering that healthy phytoplankton cells exudate only a
minor fraction of their intracellular DMSP (Laroche et al., 1999) and that their most likely
fate in natural plankton communities is not auto-lysis but consumption by microherbivors,
most of the observed increase of dissolved DMSP in the inhibition experiments can be
attributed to a release which is mediated by herbivory and excretion. The ratio of the release
of dissolved DMSP (R) and the consumption of particulate DMSP (C) by microherbivores (R
/ C ratio) may therefore be a first estimate for the conversion efficiency of particulate DMSP
by microherbivores. The release of dissolved DMSP significantly exceeded the consumption
only during DEX-13 and accounted on average for 77 % of the DMSP consumed by
microherbivores. This is comparable to conversion ratios previously observed in laboratory
experiments for Oxyrrhis marina at low food density (Wolfe et al. 1994) and indicates that
microherbivors do not assimilate or decompose significant amounts of the ingested DMSP
into biomass or other sulphur compounds but rather efficiently release DMSP from the
particulate phase into solution.
Conclusions
Phytoplankton development followed a seasonal cycle of light-, silicate-, phosphate- and
nitrogen-limited growth conditions. The spring bloom had three distinct succession phases
characterized by a predominance of centric diatoms, Phaeocyctis globosa and cryptophytes.
The seasonally highest surface concentration of dissolved (48 nM) and particulate DMSP
(602 nM) coincided with the maximum of the Phaeocyctis bloom. But the highest rates for the
production of particulate DMSP (135 nM·d-1) and the release of dissolved DMSP (144 nM·d-
56
1) were observed about 1 week before the Phaeocystis maximum was reached. The maximum
coincided with the lowest grazing loss (0.06 d-1) and the strongest nutrient limitation of
DMSP-producing phytoplankton observed during spring and summer. The release of
dissolved DMSP was closely related to the amount of particulate DMSP consumed by
microzooplankton grazing. No evidence for a general avoidance of DMSP-producing
phytoplankton by herbivorous microzooplankton was found, but a selective grazing was
observed in 4 of 10 experiments including both avoidance as well as preference of DMSP-
producers.
Acknowledgments We thank captain Kruse and captain Ohl and the crews of FK Mya and FK Littorina for excellent handling of oversized equipment under challenging working conditions. We also thank H. Halliger (AWI) and M. Elbrächter (AWI) for contributing taxonomic information and T. Romanova (AWI) and P. Fritsche (IFM-GEOMAR) for assistance with particle- and nutrient analysis. The work was supported by the Deutsche Forschungsgemeinschaft Grant AN193.
57
4 The microbial decomposition of dissolved DMSP and its nutrient dependent DMS yields in the tropical Atlantic
Wilhelm Gaul and Karin Lochte
4.1 Abstract
A series of nutrient enrichment experiments was conducted with natural size-fractionated bacterial
communities collected in the Amazon influenced western Atlantic, the central and the eastern
subequatorial region of the Atlantic. The aim was to study the nutrient related changes of the DMS
yield of the microbial decomposition of dissolved DMSP (conversion efficiency) in the tropical
Atlantic Ocean. The growth conditions in the upper mixed layer were extremely oligotrophic at all
stations where samples for experiments were collected. Ambient concentrations of dissolved inorganic
nitrogen (DIN) were ≤ 0.3 µmol N·dm-3 and the rates of bacterial carbon production without nutrient
enrichments were ≤ 0.4 µgC·dm-3·d-1. However after several hours of growth under exclusion of
grazer control, the bacterial carbon production, the microbial degradation of dissolved DMSP and the
production of DMS was much higher in most samples with organic as well as inorganic nutrient
amendments compared to controls. The overall strongest stimulation was achieved by the combined
enrichment of dissolved organic nitrogen and sulphur (DONS). The DONS enrichment caused a
maximal short term increase of consumption of dissolved DMSP and production of DMS by a factor
of 4.1 and 44.7 respectively compared to controls without nutrient enrichments. The DMS yield in the
controls was on average 21% of the microbial DMSP degradation but significantly increased due to
organic and inorganic nutrient enrichments. The overall highest DMS yields were observed in DONS
enriched incubations where on average 72% of the microbially consumed DMSP was converted to
DMS. We conclude that the availability of dissolved organic sulphur and carbon controls the bacterial
utilization of DMSP as a sulphur and carbon source and the amount of DMSP-sulphur which can be
released via enzymatic cleavage as DMS.
4.2 Introduction
The production of the algal osmolyte DMSP has received considerable attention in the past
decade of research (Stefels 2000, Kiene et al. 2000, Simó 2001), primarily because it is the
principal precursor of the volatile sulphur species DMS in the ocean (Challenger and Simpson
1948, Gage et al. 1997) which was identified as an important player in the global S-cycle
(Lovelock et al. 1972), in the Earth’s backscatter of solar radiation (Charlson et al. 1987) and
atmospheric chemistry (Platt and Le Bras 1997). But the DMSP production receives
58
increasing attention also because of the discovery of new cell- and eco-physiological
functions (Wolfe et al. 1997, Stefels 2000, Sunda et al. 2002) and its importance as a bacterial
C- and S-source (Kiene et al. 2000). However, even though there is only little information
available about the in situ production of particulate DMSP by phytoplankton (Archer et al.
2002), it appears that actually just a small fraction of the algal DMSP is converted to DMS
(Kiene and Linn 2000). This is because two biological transformations are required before the
cellular DMSP-sulphur can escape as DMS to the atmosphere, i.e. the release from the
intracellular phase to the ambient aquatic environment and the conversion of the dissolved
non-volatile precursor to DMS. The release is mediated by four different biological processes:
exudation (cell leakage), cell autolysis (of senescent cells), viral lysis and herbivory (Laroche
et al. 1999, Stefels 2000, Wilson et al. 2002, Wolfe et al. 1994 Christaki et al. 1996).
However since dissolved DMSP is chemically fairly stable in sterile seawater (Dacey and
Blough 1987) and not liable to photochemical cleavage (Slezak et al. 2001), the conversion to
the volatile sulphur species DMS is obviously exclusively mediated by enzymatic cleavage
with DMSP-lyases of either algal (Stefels and Dijkhuizen 1996, Steinke et al. 1998) or
bacterial origin (Yoch 2002). Among the releasing processes significant losses in the
transformation from cellular DMSP to DMS are caused by herbivory, since not all of the
ingested cellular DMSP is excreted as dissolved DMSP or DMS (Wolfe et al. 1994), whereas
exudation and cell lysis are processes which release DMSP directly from the intracellular
pool. However, the greatest losses occur after the cellular release due to bacterial degradation
of dissolved DMSP via the demethylation pathway and by bacterial consumption of DMS
(Yoch et al. 1997, Kiene and Linn 2000,Yoch 2002). The net yield of DMS from the
biological DMSP production is therefore significantly affected by the bacterial utilization of
DMS and dissolved DMSP. The demethylation pathway is a major link for the bacterial
sulphur assimilation from DMSP (Kiene et al. 1999) and it acts as a major sink of the DMS
production. Therefore it was suggested that the DMS yield might be closely linked to the
bacterial sulphur demand (Kiene and Linn 2000).
Our experiments focussed on the nutrient related changes of the DMS yields of the DMSP
decomposition in oligotrophic microbial communities in the tropical Atlantic. We applied
incubation experiments with natural size-fractionated bacterial communities which were
selectively enriched with organic and inorganic nutrients, to test the hypothesis that the
utilization of DMSP as a sulphur- and carbon-source decreases and the DMS yield increases if
alternative organic sulphur- or carbon-sources are abundantly available.
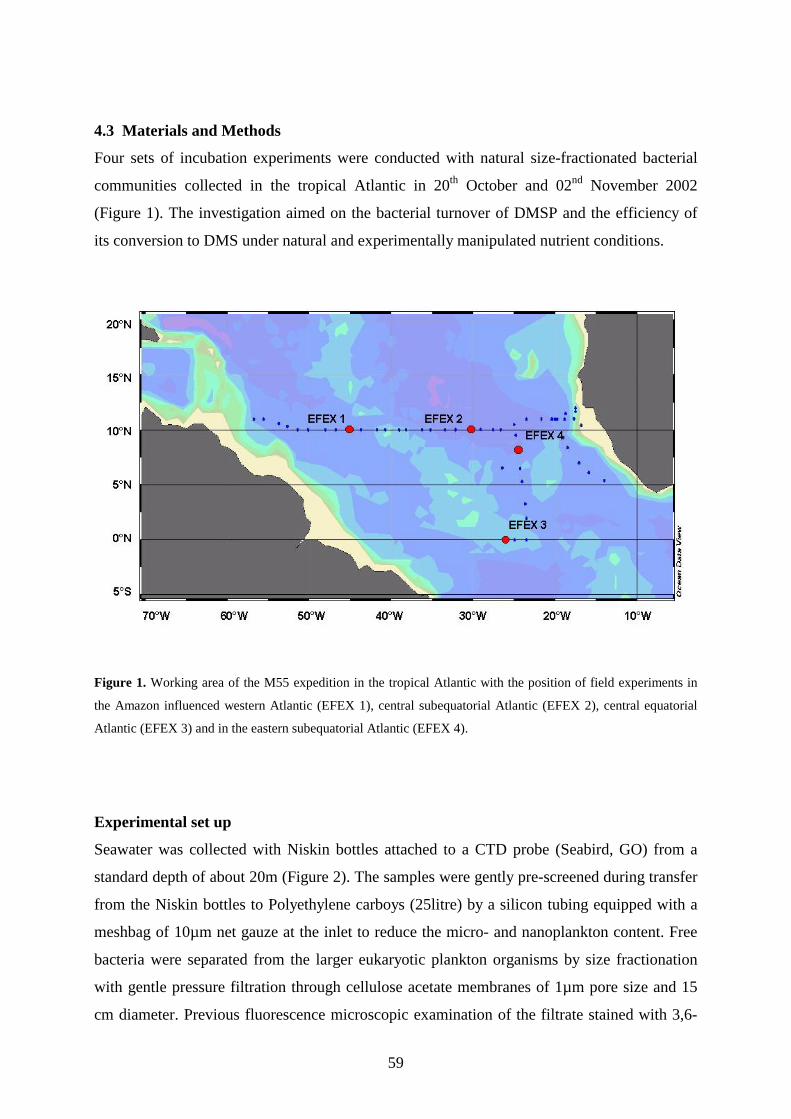
59
4.3 Materials and Methods
Four sets of incubation experiments were conducted with natural size-fractionated bacterial
communities collected in the tropical Atlantic in 20th October and 02nd November 2002
(Figure 1). The investigation aimed on the bacterial turnover of DMSP and the efficiency of
its conversion to DMS under natural and experimentally manipulated nutrient conditions.
Figure 1. Working area of the M55 expedition in the tropical Atlantic with the position of field experiments in
the Amazon influenced western Atlantic (EFEX 1), central subequatorial Atlantic (EFEX 2), central equatorial
Atlantic (EFEX 3) and in the eastern subequatorial Atlantic (EFEX 4).
Experimental set up
Seawater was collected with Niskin bottles attached to a CTD probe (Seabird, GO) from a
standard depth of about 20m (Figure 2). The samples were gently pre-screened during transfer
from the Niskin bottles to Polyethylene carboys (25litre) by a silicon tubing equipped with a
meshbag of 10µm net gauze at the inlet to reduce the micro- and nanoplankton content. Free
bacteria were separated from the larger eukaryotic plankton organisms by size fractionation
with gentle pressure filtration through cellulose acetate membranes of 1µm pore size and 15
cm diameter. Previous fluorescence microscopic examination of the filtrate stained with 3,6-
60
Diamidino-acridin-hemisulfate (Proflavin/SIGMA) and sampled on black nucleopore
membranes of 0.2µm pore size revealed that cells > 2.5µm were efficiently retained by
fractionation, i.e. small single-celled cyanobacteria and the smallest eukaryotic algae with cell
diameters less than 2.5µm passed the filter. The filtrate therefore basically contained free
suspended natural picoplankton sensu Sieburth et al. (1978). The amount of particulate DMSP
in the 1µm size-fractionated filtrate which could be sampled on cellulose acetate membranes
of 0.2µm pore size was < 0.25nM (i.e. not detectable).
Twelve subsamples of the size-fractionated filtrate were distributed to two sets of six
incubation bottles each (2.15dm3, high density polyethylene (HDPE)) which received five
different experimental treatments including antibiotics, dissolved DMSP and organic or
inorganic nutrients. 10 subsamples were spiked with 100nM DMSP-HCl (CASS, University
of Groningen), two subsamples additionally received dissolved inorganic nitrogen and
phosphor (DINP) (10µM NaNO3, 1µM NH4-Cl and 1.5 µM KH2PO4), two were amended
with dissolved organic carbon (DOC) (100µM Amylopectin), two were additionally enriched
with dissolved organic sulphur nitrogen and carbon (DONS) (100µM methionine), two were
additionally treated with antibiotics (AB) (1.25 mg·ml-1 tetracycline, Fluka 87130 and 2.5
mg·ml-1 chloramphenicol, Fluka 23275) and two subsamples served as controls. The
remaining two bottles were used to take samples for the start concentrations of DMS,
dissolved DMSP and bacterial production.
The whole sample preparation (size fractionation, transfers and nutrient addition) was
generally completed and incubations started within 1 hour after the collection of seawater.
The samples were incubated for 6h to 28h at a constant temperature of 28°C which was in all
cases close to the in situ temperature (Table 1). During incubation the bottles were constantly
rotated in a roller incubator to keep the cells in suspension. To facilitate a gastight sample
extraction from the incubation bottles, the screw caps were equipped with screw lock valves
with a syringe connection and an internal prolongation of polytetrafluorethylen (PTFE) tubing
.
Sampling
Subsamples were taken with gastight syringes via the screw lock valve of the incubation
bottles. At the start of the experiment (i.e. at the addition of the nutrient supplements) samples
were taken to determine the initial concentration of dissolved inorganic nitrogen and
phosphate, DMS and dissolved DMSP as well as the bacterial production. The first bottle of
each treatment was sampled after 6 to 19h and the duplicate bottle after 25 to 28h of
61
incubation. The experiment duration was defined as the time interval from the initial sampling
at the time point of nutrient addition (t0) to the intermediate (t1) or final sampling (t2). For
bacterial production the time points were defined by the incubation start with H3Thymidine.
Nutrients and chlorophyll-a
All nutrient concentrations were determined according to Hansen and Koroleff (1999).
Nitrate, nitrite and phosphate were measured by an autoanalyser whereas the concentration of
ammonia was determined manually to lower the detection level. Total chlorophyll was
determined by acetone extraction and fluorescence measurement in a turner design
fluorometer before and after acidification according to Herbland et al. (1985).
DMS analysis
The measurements basically followed the protocol of Kiene (1993) and were carried out on a
Varian gas-chromatograph (GC-6000) equipped with a flame photometric detector
(Thermoquest FPD-800) and a fused silica capillary column (CP-Sil 5 CB Chrompack: 30m x
0,32mm). Samples were cryofocused in a closed PTFE purge and trap system without internal
glass or metal surfaces. Filtered (GF/F) seawater samples (10 – 50 ml) were purged for 5min
with a flow of finely dispersed He (80 ml · min-1). The gas stream was dried by condensation
of water vapour in lopes of PTFE tubing which were tightly fitted into an aluminium block
and cooled by Peltier elements to –20°C to condense and freeze water vapour during the gas
extraction. The block was heated to +60°C after extraction to melt and drain of the condensed
water. Additionally a PTFE tubing of 15cm length and ¼ in o.d. packed with K2CO3 was used
to extract residual water vapour from the gas stream. A loop of PTFE tubing of 1/16 in o.d.
submerged in liquid nitrogen was used to cryofocus DMS and was subsequently submerged in
a water bath of 60°C to release the extracted gas sample onto the isothermally (60°C)
operated GC column. The system was calibrated according to Turner et al. (1990) and Uher
(1999) with a dilution series of DMS (Merck No. S28759949) dissolved in ethylene glycol
(Merck No. K27686321017). The detection level was about 0.5 pmol DMS.
Dissolved DMSP (DMSPd)
DMSP was determined as DMS which is released in an equimolar ratio after cold hydrolysis
with a strong base according to Kiene (1993). Seawater samples were filtered (GF/F) and
purged to remove DMS and particulate DMSP prior to hydrolysis and were analysed by the
purge and trap procedure as described above for DMS.
62
Particulate DMSP (DMSPp)
Gas phase measurements were applied to determine particulate DMSP as DMS which is
released after hydrolysis with strong base according to Steinke et al. (1998). Sub-samples of
10 - 60 ml were filtered on cellulose-acetate membranes (0.2 µm pore size ST 68, Schleicher
& Schuell) and were hydrolysed with 4ml of 2N NaOH for 8 - 24h in Teflon sealed screw cap
vials (25ml). The vials were then incubated in a water bath at 60°C for 30 min and were
equilibrated by sonication before replicate gas samples of 25 – 250 µl were taken from the
headspace by gastight microlitre syringes. The gas samples were directly injected via a
Teflon-sealed injection-liner on a gas chromatograph (Varian, GC-6000) equipped with a
isothermally (60°C) operated fused silica capillary (Chrompack, CP-Sil 5 CB 15m x 0,32mm)
and a flame photometric detector (Thermoquest, FPD-800). A dilution series of ultra pure
DMSP-HCl (CASS, University of Groningen) dissolved in mili-Q water was used for
calibration. The diluted DMSP standards (1 ml aliquots) were hydrolysed together with a
blank filter by 3 ml of 2N NaOH in Teflon sealed screw cap vials (25ml) and were analysed
as described above. The calibration coefficients were determined according to Uher (1999).
The detection limit for a 250 µl headspace injection was 0.5 pmol DMS.
Bacterial production
Bacterial production was determined by incorporation of [3H]-labeled thymidine into
macromolecules precipitated by cold trichloroacetic acid (TCA) according to Bjørnsen and
Kuparinen (1991). Four 10ml aliquots of water sample were dispensed into plastic vials. One
of these subsamples was fixed by addition of 100 µl 39% formalin amended with non-
radioactive thymidine and served as a blank. All samples received methyl-[3H]-thymidine,
specific activity 3.11 TBq mmol-1 (Amersham), to a final concentration of 2 nM. The samples
were incubated for 2-3 h at 28ºC, and the incubation was stopped by addition of 100µl 39%
formalin amended with thymidine. The samples were filtered through 0.22 µm poresize
cellulose acetate filters (pre-soaked in a non-radioactive thymidine solution) and rinsed 10
times with 2 ml 5 % ice cold TCA. The filters were placed in scintillation cocktail (Lumagel
SB, Baker Chemicals), and the radioactivity incorporated in the cold TCA precipitable
material was measured onboard by a Packard Tricarb 1900TR Liquid Scintillation Analyzer.
Corrections for quench were made by transformed spectral indices of external standards and
stored quench curves.
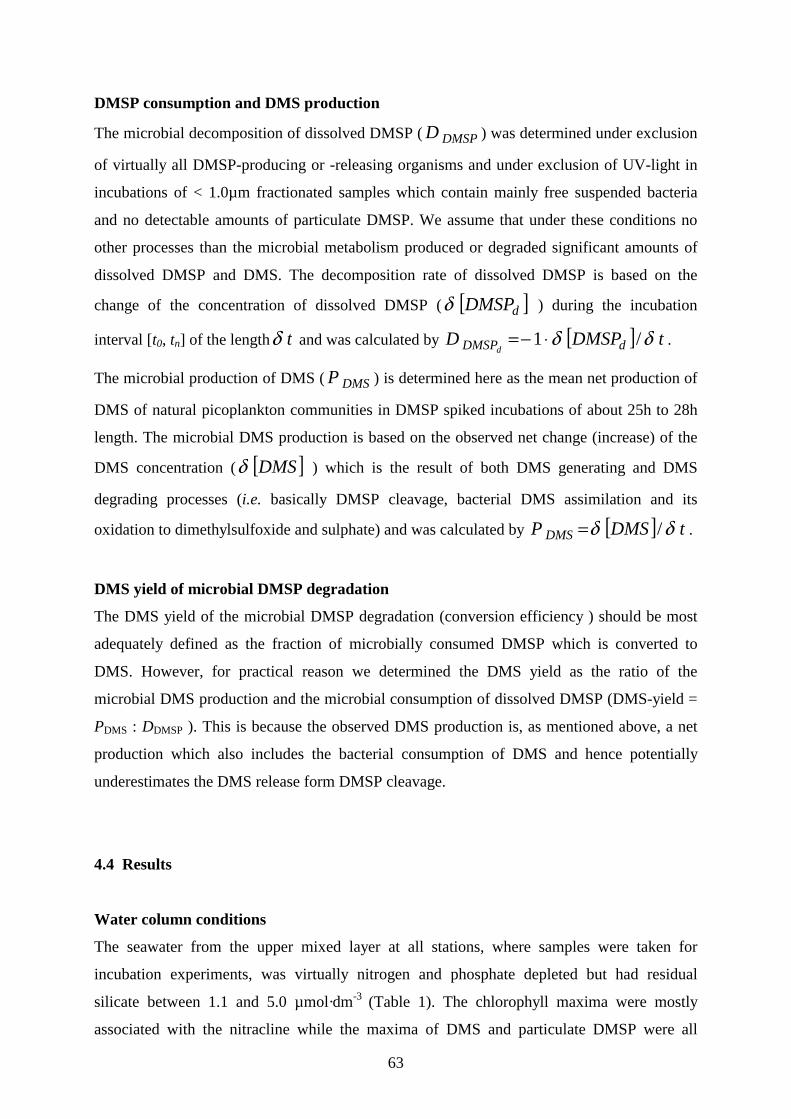
63
DMSP consumption and DMS production
The microbial decomposition of dissolved DMSP ( DMSPD ) was determined under exclusion
of virtually all DMSP-producing or -releasing organisms and under exclusion of UV-light in
incubations of < 1.0µm fractionated samples which contain mainly free suspended bacteria
and no detectable amounts of particulate DMSP. We assume that under these conditions no
other processes than the microbial metabolism produced or degraded significant amounts of
dissolved DMSP and DMS. The decomposition rate of dissolved DMSP is based on the
change of the concentration of dissolved DMSP ( [ ]dDMSPδ ) during the incubation
interval [t0, tn] of the length tδ and was calculated by [ ] tDMSPD dDMSPdδδ /1 ⋅−= .
The microbial production of DMS ( DMSP ) is determined here as the mean net production of
DMS of natural picoplankton communities in DMSP spiked incubations of about 25h to 28h
length. The microbial DMS production is based on the observed net change (increase) of the
DMS concentration ( [ ]DMSδ ) which is the result of both DMS generating and DMS
degrading processes (i.e. basically DMSP cleavage, bacterial DMS assimilation and its
oxidation to dimethylsulfoxide and sulphate) and was calculated by [ ] tDMSP DMS δδ /= .
DMS yield of microbial DMSP degradation
The DMS yield of the microbial DMSP degradation (conversion efficiency ) should be most
adequately defined as the fraction of microbially consumed DMSP which is converted to
DMS. However, for practical reason we determined the DMS yield as the ratio of the
microbial DMS production and the microbial consumption of dissolved DMSP (DMS-yield =
PDMS : DDMSP ). This is because the observed DMS production is, as mentioned above, a net
production which also includes the bacterial consumption of DMS and hence potentially
underestimates the DMS release form DMSP cleavage.
4.4 Results
Water column conditions
The seawater from the upper mixed layer at all stations, where samples were taken for
incubation experiments, was virtually nitrogen and phosphate depleted but had residual
silicate between 1.1 and 5.0 µmol·dm-3 (Table 1). The chlorophyll maxima were mostly
associated with the nitracline while the maxima of DMS and particulate DMSP were all
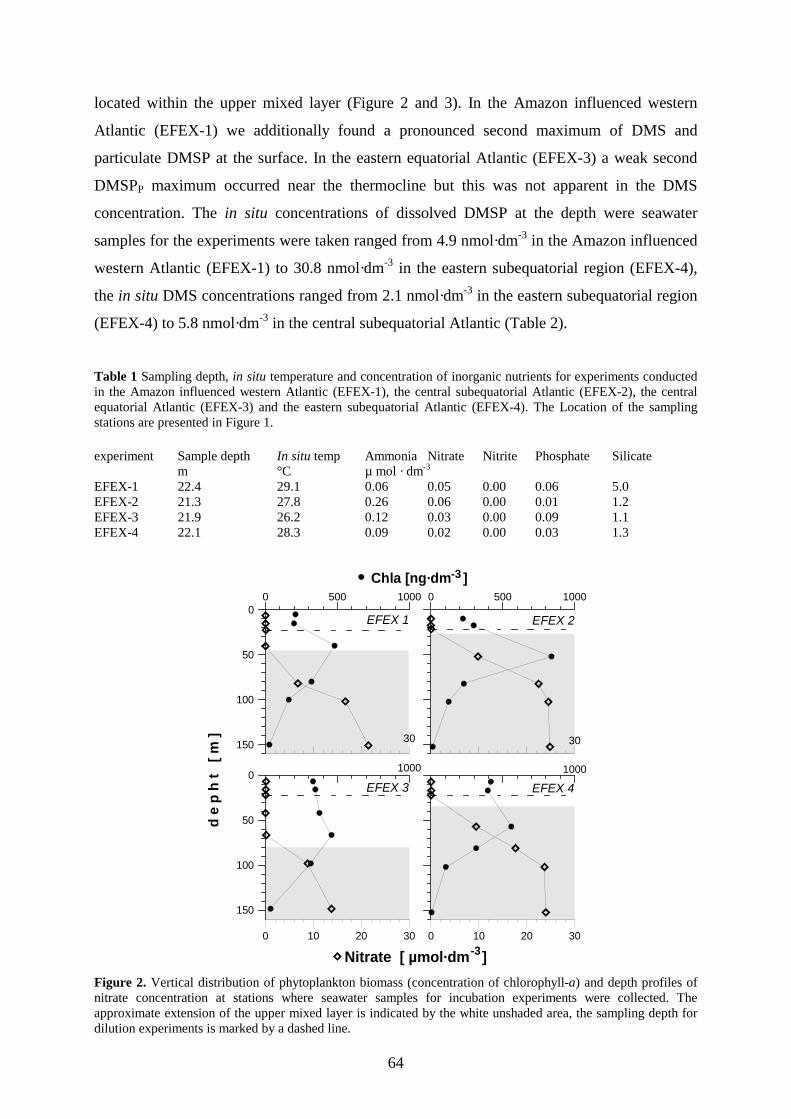
64
located within the upper mixed layer (Figure 2 and 3). In the Amazon influenced western
Atlantic (EFEX-1) we additionally found a pronounced second maximum of DMS and
particulate DMSP at the surface. In the eastern equatorial Atlantic (EFEX-3) a weak second
DMSPP maximum occurred near the thermocline but this was not apparent in the DMS
concentration. The in situ concentrations of dissolved DMSP at the depth were seawater
samples for the experiments were taken ranged from 4.9 nmol·dm-3 in the Amazon influenced
western Atlantic (EFEX-1) to 30.8 nmol·dm-3 in the eastern subequatorial region (EFEX-4),
the in situ DMS concentrations ranged from 2.1 nmol·dm-3 in the eastern subequatorial region
(EFEX-4) to 5.8 nmol·dm-3 in the central subequatorial Atlantic (Table 2).
Table 1 Sampling depth, in situ temperature and concentration of inorganic nutrients for experiments conducted in the Amazon influenced western Atlantic (EFEX-1), the central subequatorial Atlantic (EFEX-2), the central equatorial Atlantic (EFEX-3) and the eastern subequatorial Atlantic (EFEX-4). The Location of the sampling stations are presented in Figure 1. experiment Sample depth In situ temp Ammonia Nitrate Nitrite Phosphate Silicate m °C µ mol · dm-3 EFEX-1 22.4 29.1 0.06 0.05 0.00 0.06 5.0 EFEX-2 21.3 27.8 0.26 0.06 0.00 0.01 1.2 EFEX-3 21.9 26.2 0.12 0.03 0.00 0.09 1.1 EFEX-4 22.1 28.3 0.09 0.02 0.00 0.03 1.3
10000
50
100
150
1000
0 500 10000
50
100
150
0 500 1000
EFEX 1 EFEX 2
d e
p h
t [
m ]
Nitrate [ µmol·dm ]
30 30
EFEX 3 EFEX 4
0 10 20 30 0 10 20 30
Chla [ng·dm ]-3
-3
Figure 2. Vertical distribution of phytoplankton biomass (concentration of chlorophyll-a) and depth profiles of nitrate concentration at stations where seawater samples for incubation experiments were collected. The approximate extension of the upper mixed layer is indicated by the white unshaded area, the sampling depth for dilution experiments is marked by a dashed line.
65
Table 2 In situ concentrations of DMS, dissolved and particulate DMSP (DMSPd and DMSPP) as well as the initial bacterial production (BP) at the depth were seawater was collected for the incubation experiments. The location of the sampling stations are presented in Figure 1. experiment DMS DMSPd DMSPP BP n mol · dm-3 µgC·dm-3·d-1 EFEX-1 2.7 4.9 45.1 0.33 ± 0.05 EFEX-2 5.8 7.3 54.6 0.37 ± 0.05 EFEX-3 4.5 16.6 70.1 0.37 ± 0.05 EFEX-4 2.1 30.8 36.2 0.12 ± 0.02
100
50
100
150
10
0 5 100
50
100
150
0 5 10
EFEX 1 EFEX 2
d e
p h
t [
m ]
DMSPp [ nmol·dm ]
30 60 30 60
EFEX 3 EFEX 4
0 30 60 90 0 30 60
DMS [nmol·dm ]-3
-3
Figure 3. Vertical distribution of particulate DMSP and depth profiles of the DMS concentration at stations where seawater samples for incubation experiments were collected. The approximate extension of the mixed layer is indicated by the white unshaded area, the sampling depth for dilution experiments is marked by a dashed line. Dissolved DMSP was not determined in the vertical profiles.
Bacterial carbon production
The ambient rates of the bacterial carbon production in the whole plankton as well as the
initial experimental rates in the fractionated samples were extremely low (Table 2 and Figure
4 respectively). The bacterial production in incubation experiments with natural size-
fractionated bacterial communities increased significantly in all nutrient amended treatments,
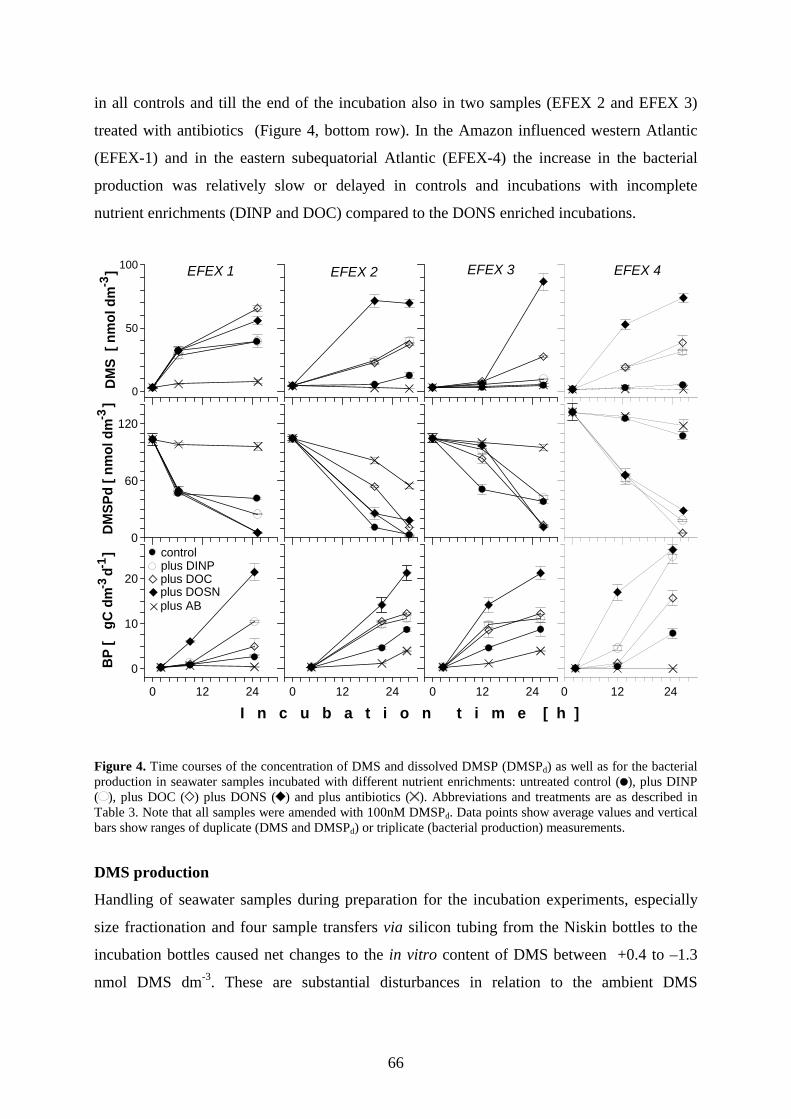
66
in all controls and till the end of the incubation also in two samples (EFEX 2 and EFEX 3)
treated with antibiotics (Figure 4, bottom row). In the Amazon influenced western Atlantic
(EFEX-1) and in the eastern subequatorial Atlantic (EFEX-4) the increase in the bacterial
production was relatively slow or delayed in controls and incubations with incomplete
nutrient enrichments (DINP and DOC) compared to the DONS enriched incubations.
0 12 24
0
10
20
0 12 24
0
60
120
0
50
100
0 12 24
EFEX 3EFEX 1 EFEX 2
DM
S [
nm
old
m
]
I n c u b a t i o n t i m e [ h ]
DM
SP
d [
nm
old
m
]B
P [
g
Cdm
d
]
0 12 24
EFEX 4
-1-3
-3-3
controlplus DINP
plus ABplus DOSNplus DOC
Figure 4. Time courses of the concentration of DMS and dissolved DMSP (DMSPd) as well as for the bacterial production in seawater samples incubated with different nutrient enrichments: untreated control ( ), plus DINP ( ), plus DOC ( ) plus DONS ( ) and plus antibiotics ( ). Abbreviations and treatments are as described in Table 3. Note that all samples were amended with 100nM DMSPd. Data points show average values and vertical bars show ranges of duplicate (DMS and DMSPd) or triplicate (bacterial production) measurements.
DMS production
Handling of seawater samples during preparation for the incubation experiments, especially
size fractionation and four sample transfers via silicon tubing from the Niskin bottles to the
incubation bottles caused net changes to the in vitro content of DMS between +0.4 to –1.3
nmol DMS dm-3. These are substantial disturbances in relation to the ambient DMS
67
concentration but they are of minor importance compared to most of the observed changes
during incubation.
The DMS concentration strongly increased in all incubation experiments with natural
picoplankton which were enriched with DOC and DONS and except for samples collected in
the central equatorial Atlantic (EFEX-3) it also increased in DINP enriched incubations
(Figure 4). A strong increase of the DMS concentration was observed also in unenriched
picoplankton samples from the Amazon influenced western Atlantic (EFEX-1) and the central
subequatorial Atlantic (EFEX-2). The antibiotic treatment completely inhibited the production
of DMS in all experiments and it depressed or significantly reduced (central subequatorial
Atlantic (EFEX-2)) the consumption of dissolved DMSP. The bacterial production was
efficiently depressed for at least 12h but greatly increased till the end in incubations of
unenriched picoplankton from the Amazon influenced western Atlantic (EFEX-1) and the
central equatorial Atlantic region (EFEX-3) (Figure 4).
The microbial DMS production in incubations without nutrient additions ranged from 0.07 to
1.45 nmol·dm-3·h-1 but increased (up to 3.13 nmol·dm-3·h-1) in most experiments due to
various nutrient enrichments. The only case where the microbial production of DMS did not
significantly increase in relation to the control was DINP enriched picoplankton from the
Amazon influenced western Atlantic (EFEX-1) (Table 3). The overall strongest increase of
the microbial DMS production was caused by DONS enrichments, followed by enrichments
of DOC and DINP. Likewise the consumption of dissolved DMSP increased in most
experiments due to organic and inorganic nutrient enrichments but differences between
DONS, DOC and DINP enrichments had no clear trends and were not similar to the responses
of the microbial DMS production (Table 4). However, the microbial DMSP consumption in
DINP enriched incubations of picoplankton from the central equatorial region (EFEX-3) and
in DINP or DOC enriched incubations from the central subequatorial region (EFEX-2) were
not significantly different from the controls. The DONS enrichment in the central
subequatorial region (EFEX-2) was the only case were the microbial DMSP consumption in
a nutrient enriched picoplankton sample was significantly lower than in the control (Table 4).
Overall, the microbial consumption of DMSP always exceeded the production of DMS.
68
Tab. 3 DMS production (±SD of analytical replicates) in seawater samples incubated with selective nutrient enrichments: Dissolved inorganic nitrogen and phosphor (DINP. i.e. +10µM NO3. 1µM NH4 and 1.5 µM PO4). dissolved organic carbon (DOC. i.e. +100µM Amylopectin). dissolved organic sulphur and nitrogen (DONS. i.e. +100µM Methionin) or antibiotics (AB. i.e. +1.25 mg·ml-1 tetracycline and 2.5 mg·ml-1 chloramphenicol). All treatments were additionally enriched with 100nM DMSPd. Estimates are based on 25h to 28h. The Location of the sampling stations are presented in Figure 1.
experiment Control +DINP +DOC +DONS +AB nmol · dm-3 · h-1 EFEX-1 1.45 ± 0.02 1.46 ± 0.21 2.49 ± 0.11 2.09 ± 0.14 0.19 ± 0.08 EFEX-2 0.29 ± 0.09 1.28 ± 0.07 1.17 ± 0.04 2.33 ± 0.12 -0.08 ± 0.01 EFEX-3 0.07 ± 0.05 0.25 ± 0.03 0.91 ± 0.03 3.13 ± 0.26 0.08 ± 0.05 EFEX-4 0.13 ± 0.02 1.11 ± 0.07 1.39 ± 0.23 2.71 ± 0.13 0.00 ± 0.01
Table 4 DMSP consumption (±SD of analytical replicates) in incubations with selective nutrient additions. Abbreviations of treatments are as described in Tab. 3. The Location of the sampling stations are presented in Figure 1. experiment Control +DINP +DOC +DONS +AB nmol · dm-3 · h-1
EFEX-1 2.48 ± 0.30 3.13 ± 0.26 3.89 ± 0.28 3.90 ± 0.28 0.29 ± 0.42 EFEX-2 3.62 ± 0.09 3.68 ± 0.09 3.33 ± 0.08 3.07 ± 0.09 1.77 ± 0.12 EFEX-3 2.49 ± 0.26 2.33 ± 0.27 3.42 ± 0.21 3.50 ± 0.21 0.36 ± 0.29 EFEX-4 0.95 ± 0.32 4.29 ± 0.36 4.81 ± 0.35 3.90 ± 0.34 0.55 ± 0.56
DMS yield of the microbial DMSP decomposition
The DMS yield describes the fraction of the dissolved DMSP which was microbially
degraded and converted to DMS. The DMS yield varied over a wide range from a minimum
of 2.7 % in nutrient unamended samples from the central equatorial region (EFEX 3) to
89.5% in DONS enriched samples at the same station (Table 5). The average DMS yield in
unenriched samples was 20.8%. Apart from samples collected at the Amazon influenced
region (EFEX-1) where the microbially conversion of dissolved DMSP to DMS was
relatively stable regardless of the kind of nutrient addition, the DMS yields in unenriched
samples were overall significantly lower than in the DINP, DOC or DONS enriched samples.
The DMS yields in DOC and DONS enriched incubations was equal (EFEX 2) or higher
(EFEX 1, 3 and 4) than in DINP enriched samples. And except for the experiment in the
Amazon influenced region (EFEX-1) DONS enrichments achieved higher DMS yields than
DOC enrichments.
69
Table 5 DMS yield of the microbial DMSP decomposition. i.e. the fraction of the microbially consumed DMSP which is converted to DMS. Abbreviation of treatments is as described above (Tab. 3). The location of the sampling stations are presented in Figure 1. experiment Control +DINP +DOC +DONS DMS production / DMSP consumption [ % ] EFEX-1 58.7 46.6 63.9 53.5 EFEX-2 8.0 34.7 35.0 75.6 EFEX-3 2.7 10.6 26.7 89.5 EFEX-4 13.8 25.9 28.9 69.5 Average: 20.8 29.4 38.6 72.0
4.5 Discussion
Even though there are several alternative pathways for the microbial degradation of DMSP,
all DMSP-sulphur will be ultimately oxidised to sulphate. But it makes a difference if the
final oxidation happens in the ocean or after the emission of volatile sulphur species in the
atmosphere (Charlson et al. 1987). Our investigation therefore focused on the channelling of
the DMSP-sulphur to the atmospheric oxidation and hence to that part of the microbial DMSP
degradation that yields the volatile sulphur species DMS which seems to be the major link of
the reduced sulphur to the atmosphere (Andreae 1999).
Considering that the algal production of DMSP in the euphotic zone of the ocean (Archer et
al. 2001, Simo et al. 2002) is on average about two to three orders of magnitude higher than
the emission of DMS to the atmosphere (Andreae et al. 1994, Kiene and Bates 1990, Simó
and Pedrós-Alio 1999, Archer et al. 2002), it becomes clear that the losses in the productive
line from the cellular DMSP to the volatile DMS are as important as the production itself.
The overall greatest sink for the DMSP after its release from the phytoplankton cells which is
caused by herbivory, cell lysis or exudation (Wolfe et al. 1994, Christaki et al. 1996 - Stefels
2000, Wilson et al. 2002 - Laroche et al. 1999) seems to be the bacterial decomposition
through the demethylation / demethiolation pathway and the uptake and assimilation into
bacterial biomass (Kiene and Linn 2000). But even the fraction which is converted to DMS is
subsequently liable to further oxidation or assimilation by bacteria (Wolfe and Kiene 1993,
Kiene and Linn 2000). The partitioning of the microbial degradation between the DMS
producing pathway and the demethylation-, assimilation or oxidation of the DMSP-sulphur is
therefore a major factor in the biological DMS production of the ocean. The observed DMS
yields of the microbial DMSP degradation in natural plankton communities range from
virtually 0% to 100% (Table 6).
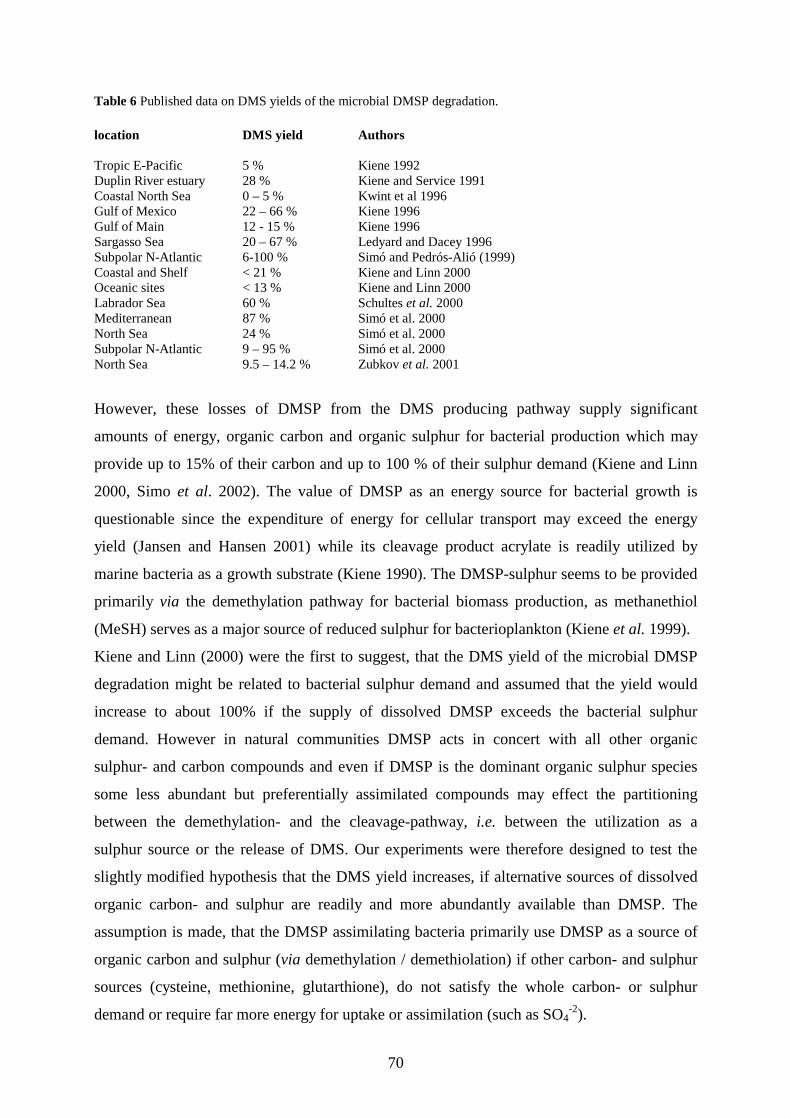
70
Table 6 Published data on DMS yields of the microbial DMSP degradation. location DMS yield
Authors
Tropic E-Pacific 5 % Kiene 1992 Duplin River estuary 28 % Kiene and Service 1991 Coastal North Sea 0 – 5 % Kwint et al 1996 Gulf of Mexico 22 – 66 % Kiene 1996 Gulf of Main 12 - 15 % Kiene 1996 Sargasso Sea 20 – 67 % Ledyard and Dacey 1996 Subpolar N-Atlantic 6-100 % Simó and Pedrós-Alió (1999) Coastal and Shelf < 21 % Kiene and Linn 2000 Oceanic sites < 13 % Kiene and Linn 2000 Labrador Sea 60 % Schultes et al. 2000 Mediterranean 87 % Simó et al. 2000 North Sea 24 % Simó et al. 2000 Subpolar N-Atlantic 9 – 95 % Simó et al. 2000 North Sea 9.5 – 14.2 % Zubkov et al. 2001
However, these losses of DMSP from the DMS producing pathway supply significant
amounts of energy, organic carbon and organic sulphur for bacterial production which may
provide up to 15% of their carbon and up to 100 % of their sulphur demand (Kiene and Linn
2000, Simo et al. 2002). The value of DMSP as an energy source for bacterial growth is
questionable since the expenditure of energy for cellular transport may exceed the energy
yield (Jansen and Hansen 2001) while its cleavage product acrylate is readily utilized by
marine bacteria as a growth substrate (Kiene 1990). The DMSP-sulphur seems to be provided
primarily via the demethylation pathway for bacterial biomass production, as methanethiol
(MeSH) serves as a major source of reduced sulphur for bacterioplankton (Kiene et al. 1999).
Kiene and Linn (2000) were the first to suggest, that the DMS yield of the microbial DMSP
degradation might be related to bacterial sulphur demand and assumed that the yield would
increase to about 100% if the supply of dissolved DMSP exceeds the bacterial sulphur
demand. However in natural communities DMSP acts in concert with all other organic
sulphur- and carbon compounds and even if DMSP is the dominant organic sulphur species
some less abundant but preferentially assimilated compounds may effect the partitioning
between the demethylation- and the cleavage-pathway, i.e. between the utilization as a
sulphur source or the release of DMS. Our experiments were therefore designed to test the
slightly modified hypothesis that the DMS yield increases, if alternative sources of dissolved
organic carbon- and sulphur are readily and more abundantly available than DMSP. The
assumption is made, that the DMSP assimilating bacteria primarily use DMSP as a source of
organic carbon and sulphur (via demethylation / demethiolation) if other carbon- and sulphur
sources (cysteine, methionine, glutarthione), do not satisfy the whole carbon- or sulphur
demand or require far more energy for uptake or assimilation (such as SO4-2).
71
The investigation required to uncouple the production and release of dissolved DMSP from
the bacterial consumption which was achieved by the isolation of free bacteria from both
bacterivorous grazers and DMSP-producing algae. The exclusion of bacterivorous grazers
favoured in all experiments a rapid increase of the bacterial production (Figure 4), which
indicated a severe grazer control within the whole microbial community. The observed rates
for the microbial consumption of DMSP and the production of DMS are therefore
overestimates compared to in situ conditions.
However the grazer exclusion revealed the differences between the communities and
magnified the responses due to selective nutrient enrichments which indicated that the
bacterial production was after 6h to18h limited by the availability of organic sulphur.
Sulphur is always abundantly available in the form of sulphate whereas its uptake and
assimilation is energetically quite costly (Stefels 2000). Apparently the bacterial sulphur
assimilation is a thermodynamic rather than an availability problem. The demethylation /
demethiolation of DMSP provides reduced sulphur in the form of methanethiol which can be
readily assimilated into protein via methionine (Kiene et al. 1999), while the cleavage
pathway provides DMS which is rather of minor importance as a bacterial sulphur source
(Kiene and Linn 2000).
Therefore, we expected in the above hypothesis that bacteria which grow under sulphur
limited conditions would degrade relatively more DMSP via the demethylation pathway and
less via the cleavage pathway than under sulphur replete conditions. Consequently high DMS
yields would only be achieved if the DMSP utilizing bacteria either predominantly use other
sulphur sources than DMSP or if the supply of DMSP greatly exceeds the bacterial sulphur
demand.
This assumption is consistent with the observation that the overall highest increases of the
bacterial production as well as the highest DMS yields were achieved in incubations which
were enriched with an alternative source of dissolved organic sulphur and nitrogen (Figure 4,
table 5). Except for EFEX 4 in the eastern tropical Atlantic the changes of the microbial
DMSP-consumption in response to nutrient enrichment appeared to be relatively small
compared to increases of the BP. This indicates that the DMSP-degrading bacteria did either
not profit from the enrichments to the same degree as the major producers or that the
significance of DMSP as a carbon- and sulphur source decreased due to the greater
availability of alternative substrates. The relatively strong synchronous increase of the DMS
production in response to the nutrient enrichments, especially organic carbon and sulphur,
72
rather points to a reduced utilization of DMSP as a sulphur and carbon source than to a weak
or no response of the DMSP-degrading bacteria to nutrient additions.
However the conversion efficiencies all remained far below 100% although the enrichments
were several times in excess of the estimated sulphur demand of the bacterial production. This
might be due to bacteria which used DMSP as the preferred or additional source of organic
sulphur or by a relatively high uptake and retention e.g. as compatible solute. Interestingly the
DMS yields increased to a lower degree also in response to an excess supply of DINP or
readily digestible DOC. A possible explanation for the effect of DOC enrichments on the
DMS yield is that the availability of extra energy might increase the availability and
utilization of alternative sulphur compounds which otherwise require to much energy for
uptake and assimilation.
We conclude, that the nutrient availability, especially readily degradable organic carbon and
sulphur, has a strong impact on the DMS yield of the microbial DMSP degradation and
therefore constitutes major limiting factor for the DMS production in the ocean.
Acknowledgments
We are thankful to the crew and scientists aboard FS-METEOR during cruise M-55 which
was excellently organised by Herman Bange and chief scientist Douglas W. R. Wallace. We
whish to thank Frank Malin and Peter Fritsche who assisted in the field work and provided
online data of nutrient and phytoplankton biomass. This cruise and research was funded by
the DFG / Deutsche Forschungsgemeinschaft grant AN193.
73
5 Zusammenfassung und Schlussbetrachtungen
Diese Studie war darauf ausgerichtet, zu einer besseren Vorhersagbarkeit von Veränderungen
der DMS Produktion im Ozean beizutragen.
Die Komplexität mariner Planktongemeinschaften, die Vielzahl der beteiligten Prozesse und
ihrer Beeinflussbarkeit durch eine Reihe abiotischer Faktoren, setzt der Vorhersagbarkeit
jedoch natürliche, technische und ökonomische Grenzen. Andereseits, begründet die
Regelmäßigkeit der saisonalen Zyklen in den DMS-Emissionen (Yvon und Saltzman, 1996,
Ayers and Gillett 2000), der enge Zusammenhang der DMS-Emissionen mit
Klimaänderungen im Tertiär (Legrand et al. 1988, 1991, 1997), die relativ klaren
Verteilungsmuster des DMS im Ozean (Kettle et al. 1999) und vor allem eine anhaltend
lebhafte und innovative Forschungsaktivität die Hoffnung, dass man diesem Ziel aus
unterschiedlichen Richtungen näher kommt.
Charlson et al. (1987) nahmen an, dass, wenn Licht und Temperatur die DMS Produktion
positiv beeinflussen, durch die vermehrte Produktion von Schwefel-Aerosolen, eine negative
Rückwirkung auf die Einstrahlung entstünde, die als Antagonist zum CO2 möglicherweise
wie eine „Globale Thermostat Regelung“ wirke. Mit dieser Hypothese regten Charlson et al.
(1987) eine der kontroversesten und fruchtbarsten Diskussionen in den Naturwissenschaften
der vergangen Jahrzehnte an.
Die biologische DMS-Produktion, PDMS ist im Prinzip sehr einfach beschreibbar durch die
pflanzliche DMSP-Produktion, PDMSP und den dimensionslosen Ertragskoeffizienten, k, der
den Anteil beschreibt, der von PDMSP zu DMS abgebaut wird. Dabei wird PDMSP vollständig
bestimmt durch den intrazellulären DMSP-Gehalt der Planktonalgen (a) und deren
Wachstumsrate (b) und Abundanz (c), so dass gilt,
PDMS = PDMSP · k = a · b · c · k (Gleichung 1).
Der Einfluss des Lichtes und des Nährstoffangebotes auf PDMSP.
Im photosynthetisch aktiven Wellenlängenbereich (PAR) hat die Lichtintensität, im Einklang
mit der Thermostat-Hypothese von Charlson et al. (1987), innerhalb gewisser
Schwellenwerte, einen positiven Einfluss auf das Wachstum und den intrazellulären DMSP-
Gehalt der Planktonalgen (das Produkt a·b) (Vetter und Sharp 1993, Matrai et al. 1995,
74
Stefels und van Leeuve 1998, Slezak und Herndl 2003). Die Temperatur und überschwellige
Lichtintensitäten haben jedoch einen entgegengesetzten Effekt, weil bei steigender
Temperatur und bei hohen UV-Strahlungsintensitäten die Konzentration von intrazellulärem
DMSP (Faktor a) abnimmt, und bei hohen Strahlungsintensitäten im PAR das Wachstum und
die DMSP-Produktion gehemmt werden (Produkt a·b) (Hefu und Kirst 1997, van Rijssel und
Buma 2002). Das Licht begrenzt in erster Linie die Zeit und den Raum (euphotische Zone), in
der die pflanzliche Produktion einschlieslich der DMSP-Synthese überhaupt möglich ist.
Letztlich wird die Größe der Produktion jedoch bestimmt durch die Menge der Nährstoffe, die
in diesem Licht-Zeit-Raum verfügbar ist. So weit diese Nährstoffmenge erschöpfbar ist,
bestimmen Temperatur und Lichtintensität zunächst nur die Geschwindigkeit mit der dies
geschieht. Bei der pflanzlichen DMSP-Produktion wurde daher in dieser Studie das
Augenmerk vor allem auf den Einfluss des Nährstoff- bzw Stickstoffangebotes gelegt. Zum
einen, weil der Stickstoff der am häufigsten limitierende Nährstoff im Ozean ist (Dugdale und
Wilkerson 1992, Graziano et at. 1996). Zum anderen weil in einer Reihe von Untersuchungen
bei Stickstoffmangel erhöhte zelluläre DMPS-Gehalte beobachtet wurden (Turner et al. 1988;
Gröne und Kirst 1992; Matrai und Keller 1994). Da Wachstumsraten in der Regel positiv mit
dem Nährstoffangebot korreliert sind, wurde in dieser Studie für die Faktoren a und b
gegenläufige Reaktionen auf Änderungen im Stickstoffangebot vermutet, deren Gesamteffekt
auf die spezifische DMSP Produktionsrate (dem Produkt a · b) bislang unbekannt waren. In
den hierzu durchgeführten Labormessungen an einer Auswahl von Algenstämmen aus den
wichtigsten eukarionten Klassen des marinen Phytoplanktons (Kapitel 2), dominierte bei
abnehmenden Konzentrationen von gelöstem anorganischen Stickstoff (DIN) in allen Fällen
die Abnahme der Wachstumsrate (b) über die Zunahme der intrazellulären DMSP-
Konzentration (a). Die spezifische DMSP Produktionsrate (a · b) nahm also bei sinkender
DIN-Konzentration ab. Wurde jedoch die DMSP-Produktion auf den partikulären organischen
Zellstickstoff (PON) bezogen, d.h. auf die hier so genannte N-spezifische DMSP-Produktion,
die beschreibt wie viel partikuläres DMSP pro partikulärem Zellstickstoff und pro Tag
produziert wird, so zeigten sich zwei unterschiedliche Reaktionen auf abnehmende DIN-
Konzentrationen.
In 6 von 9 Fällen nahm die N-spezifische DMSP-Produktion bei Abnahme der DIN
Konzentration zunächst zu, steigerte sich bis zu einem intermediärem Maximum zwischen 0.7
und 2.8 µM DIN und sank darunter rasch auf null ab. Dieser Verlauf ergabt sich aus einer
kontinuierlichen Abnahme der Wachstumsrate bei einer gleichzeitig relativ stärkeren
Zunahme des DMSPP / PON Verhältnisses. In den anderen Fällen überwog bei hohen wie bei
75
niedrigen DIN Konzentration die Abnahme der Wachstumsrate, und bewirkte eine
kontinuierliche Abnahme der N-spezifischen DMSP-Produktion bei abnehmender der DIN
Konzentration. Die hier beobachteten artspezifischen Unterschiede in den intrazellulären
DMSP-Konzentrationen (0.3 bis 1521 mM), den DMSPP / PON Verhältnissen (0.014 – 1.16
µmol S / µmol N) und den Maxima der N-spezifischen DMSP-Produktion (0.007 bis 0.603
µmol S · µmol-1 N · d-1), lagen um 1 bis 2 Größenordnungen über ihren stickstoffbedingten
Veränderlichkeiten.
Auf den ersten Blick könnte man daher annehmen, dass PDMSP vollkommen von den
artspezifischen Unterschieden bestimmt würde. Auf dem Niveau einer natürlichen
Planktongemeinschaft nimmt jedoch der Einfluss der artspezifischen Unterschiede mit
steigender Diversität exponentiell ab und kommt in vollem Umfang erst in Algenblüten zur
Geltung, die von nur einer Art dominiert werden.
Auf globaler Ebene wird daher der Trend in der stickstoffbedingten Veränderlichkeit der
DMSP-Produktion über die weitgehend unvorhersagbare artspezifische Veränderlichkeit der
DMSP-Produktion dominieren.
Im Kapitel 3 konnte darüberhinaus am Beispiel der Haptophycee Phaeocystis globosa auch
das Auftreten einer blütenbildenden Schlüssel-Art der DMS-Produktion in Beziehung gesetzt
werden zu Änderungen im Nährstoffangebot, in diesem Falle die Erschöpfung des gelösten
Silikates durch die vorangehende Diatomeenblüte. Auch die ausgedehnten Blüten der
Haptophycee Emiliania huxleyi, die wahrscheinlich die bedeutenste Schlüssel-Art der DMS-
Produktion im borealen und gemäßigten Nord Atlantik ist, entwickeln sich in der Regel aus
dem Rest-Nitrat, das nach der Erschöpfung des Silikat durch Diatomeen übrig bleibt
(Holligan et al. 1993). Das Nährstoffangebot beeinflusst daher potentiell alle Einzelfaktoren
der DMSP-Produktion; d.h. auf der Ebene der Zellphysiologie die Faktoren a und b, auf der
Ebene der Artzusammensetzung vor allem den Faktor a und schließlich in Situationen mit
relativ geringen Fraß- und Sinkverlusten, auch die Bestandsgröße der pflanzlichen
Produzenten (Faktor c).
Bedeutung der Herbivorie
Im Gegensatz zur Wachstumsrate wird der Faktor c jedoch häufig nicht allein von den
abiotischen Wachstumsbedingungen (Licht, Temperatur und Nährstoffe) bestimmt, sondern
eher von den dichteregulierenden Verlustprozessen, insbesondere von der Fraßaktivität des
herbivoren Mikrozooplanktons (filtrierende Metazoen, Protozooen und mixotrophe Algen).
Wichtige Ausnahmen von dieser sogenannten Top-down-Kontrolle durch die Herbivoren
76
bilden die Anfangsphasen von Frühjahrsblüten, wenn die Fraßaktivität der Herbivoren im
Vergleich zum Wachstum des Phytoplanktons noch gering ist, und möglicherweise auch
Virusepidemien im Phytoplankton (Bratbak et al. 1993, Wilson et al. 2002).
Da die Planktonalgen einerseits, wie oben beschrieben, mit sehr unterschiedlicher Intensität
DMSP produzieren und da andererseits die meisten Herbivoren, einschließlich des
Mikrozooplanktons eine zum Teil hochselektive Nahrungsauswahl betreiben (Gaul und Antia
2001), kann die Bestandsgröße des DMSP-produzierenden Phytoplanktons auch durch einen
selektiven Fraßdruck stark beeinflusst werden, insbesondere dann, wenn die DMSP-
Produktion selbst ein Kriterium der Nahrungsauswahl wäre. Unter kontrollierten
Laborbedingungen konnte für einige wichtige Vertreter des Mikrozooplanktons ein
verringerter Fraßdruck auf DMSP-produzierende Algen nachgewiesen werden (Wolfe et al.
1997). Dabei kam auch der Aktivität der beim Fraß freiwerdenden pflanzeneigenen DMSP-
spaltenden Enzyme (DMSP-Lyasen) eine wichtige Rolle zu. In den Feldexperimenten, die im
Rahmen dieser Studie in sehr unterschiedlichen Planktongemeinschaften der Nordsee (Kapitel
3) und des Tropischen Atlantik (hier nicht dokumentiert) durchgeführt wurden, konnte jedoch
nur in drei von sechzehn Experimenten ein im Vergleich zum Chlorophyll-a verminderter
Fraßdruck auf DMSP-produzierendes Phytoplankton festgestellt werden. Da andererseits in
vier Fällen auch eine Bevorzugung des DMSP-produzierenden Phytoplanktons nachgewiesen
werden konnte, wie sie zuvor bereits während einer Blüte von E. huxleyi für eben diese Alge
beobachtet wurde (Holligan et al. 1993), stützt diese Untersuchung nicht die, aus den
Laborexperimenten abgeleitete Annahme einer allgemeinen chemischen Fraßschutzfunktion
des DMSP (Strom et al. 2003).
Dies schmälert jedoch keineswegs die Bedeutung der Herbivorie für die DMS-Produktion im
allgemeinen, denn sie beeinflusst diese sowohl auf der Produktionsebene (PDMSP) als auch auf
der Ertragsebene (Faktor k);
Zum einen kann sie bei entsprechender Intensität und Selektivität die Bestandsgröße und die
Zusammensetzung des Phytoplanktons stark beeinflussen (Faktor a und c, Gleichung 1) und
zum anderen ist sie einer der wichtigsten Prozesse, die zellpartikuläres DMSP freisetzen,
wobei durch eine teilweise enzymatische Spaltung zu DMS während der Verdauung auch der
DMS-Ertrag (Faktor k, Gleichung 1) mit beinflußt wird (Wolfe et al. 1994). In den hier
vorgestellten experimentellen Untersuchungen von natürlichen Planktongemeinschaften in der
Nordsee (Kapitel 3) betrug der Konsum von partikulärem DMSP durch das herbivore
Mikrozooplankton im Durchschnitt etwa 94% der pflanzlichen Produktion, wovon im Mittel
77% wieder als gelöstes DMSP freigesetzt wurde.
77
Der Faktor k
Der DMS-Ertrag ist einer der komplexesten Größen in der oben aufgestellten Gleichung der
DMS-Produktion. Er kann bereits bei der Freisetzung des zellpartikulären DMSP aus der
Pflanzenzelle durch die Herbivoren erheblich gemindert werden (Wolfe et al. 1994), und er
wird nach der Freisetzung weiter gemindert durch den bakteriellen Abbau von gelöstem
DMSP und DMS, sowie durch Photolyse unter dem Einfluß von UV(B)-Licht. Licht hat zwar
keinen direkten Einfluss auf den DMS-Ertrag, weil DMSP unter den Lichtbedingungen in der
euphotischen Zone des Ozeans nicht photolysiert wird (Slezak et al. 2001). Jedoch ist das
DMS bei hohen Intensitäten im UV(B)-Bereich einer bedeutenden Photooxidation ausgesetzt
(Brimblecombe und Shooter 1986, Brugger et al. 1998, Toole et al. 2003), wobei dies an das
Vorhandensein von Photosensitizern gebunden ist (Brugger et al. 1998, Toole et al. 2003),
weil DMS das Licht in diesem Wellenlängenbereich nicht absorbieren kann (Brimblecombe
und Shooter 1986). Indirekt könnten hohe Lichtintensitäten auch den DMS-Ertrag durch die
Photoinhibition des mikrobiellen Abbaus von DMSP zu DMS veringern (Slezak et al. 2001).
Im Rahmen dieser Studie war vor allem der DMS-Ertrag des bakteriellen DMSP-Umsatz von
Interesse. Dieser hat einen so großen Einfluß auf die DMS-Produktion, dass in den
Extermfällen gelöstes DMSP einerseits beinahe vollständig zu DMS umgesetzt, oder
andererseits nahezu ohne DMS-Ertrag abgebaut wird (Kapitel 4, Tabelle 6). Für den DMS-
Ertrag des bakteriellen DMSP-Umsatzes ist enscheidend, in welcher Weise das gelöste DMSP
als Substrat des bakteriellen Wachstums genutzt wird. Wenn das gelöste DMSP vollständig
über den Weg der Demethylierung und Demethiolierung abgebaut und dabei als Quelle für
reduzierten Schwefel und Kohlenstoff genutzt wird, entsteht kein DMS. Wird das DMSP
hingegen vollständig enzymatisch gespalten, so wird zwar mit der Acrylsäure organischer
Kohlenstoff verfügbar, der DMSP-Schwefel der dabei als DMS frei wird, ist jedoch nicht
mehr direkt als organische Schwefelquelle nutzbar. Auf diesem Umstand basiert die hier
gemachte Annahme, dass der mikrobielle DMS-Ertrag abhängig ist von der Verfügbarkeit
und dem Bedarf an gelösten organischen Schwefelverbindungen, und dass bei einem
Überangebot an alternativen organischen Schwefelquellen der DMS-Ertrag steigt durch die
Bevorzugung der enzymatischen Spaltung gegenüber dem Schwefel-assimilierenden
Abbauweg. In den zur Prüfung dieser Hypothese durchgeführten Experimenten (Kapitel 4)
betrug der DMS-Ertrag ohne zusätzliche Nährstoffe im Mittel 21% des mikrobiellen Abbaus
an gelöstem DMSP. Die Erträge konnten sowohl durch Anreicherung mit organischen als
auch anorganischen Nährstoffen gesteigert werden. Die DMS-Erträge konnten dabei, durch
78
kombinierte Anreicherung von organischem Schwefel und Sickstoff in Form von Methionin,
bis auf maximal 90% gesteigert werden. Die Anreicherung mit organischem Schwefel
übertraf in allen Fällen die Effekte der Anreichung mit gelöstem anorganischem Stickstoff
und Phosphor, oder mit gelöstem organischem Kohlenstoff. Hieraus wurde geschlossen, dass
die Bedeutung des DMSP als Substart für bakterielles Wachstum in erster Linie in seiner
Funktion als Schwefelquelle liegt, und dass der Umfang dieser Nutzung einen entscheidenden
Einfluß auf den DMS-Ertrag hat.
Hieraus kann zusammenfassend geschlossen werden, dass praktisch alle Einzellfaktoren der
DMS-Produktion durch die Nährstoffversorgung des Phyto- und Bakterioplanktons
beeinflusst werden, wobei gelöster anorganischer Stickstoff auf der Produktionsseite und
gelöster organischer Schwefel auf der Ertragsseite im allgemeinen die DMS-Produktion
positiv beeinflussen. Das schließt nicht aus, dass bei einer Änderung in der
Artenzusammensetzung der Faktor a durch das dominante Auftreten einer besonders
produktiven Form seine Macht zurückerlangt. Da am Umsatz des DMSP im Grunde die
gesamte Planktongemeinschaft beteiligt ist, erfordert eine echte Vorhersagbarkeit der DMS-
Produktion noch eine wesentliche Verbesserung des Verständnisses der Schlüssel-Prozesse
und des Auftretens der Schlüssel-Arten in Zeit und Raum.
79
6 Kurzfassung Die Studie umfast drei experimentelle Untersuchungen; Labormessungen zur DMSP-
Produktion in Kulturen mariner Planktonalgen, eine Serie von In situ Experimenten zur
Produktion und Umsatz von partikulärem DMSP in Nordsee, und eine Serie von selektiven
Nährstoffanreicherungs-Experimenten zum mikrobiellen Umsatz von gelöstem DMSP im
tropischen Atlantik.
In den Kulturexperimenten wurde schwerpunktmäßig der Einfluss der artspezifischen
Unterschiede und des Stickstoffangebotes auf die DMSP-Produktion untersucht. Die
beobachteten artspezifischen Unterschiede überwogen dabei um ein bis zwei
Größenordnungen über die stickstoffbedingten Änderungen in der intrazellulären DMSP-
Konzentrationen und der DMSP-Produktion.
Die überragende Bedeutung von Schlüssel-Arten und der Einfluss des Nährstoffangebotes auf
die DMSP-Produktion geht auch aus den In situ Experimenten in der Nordsee deutlich hervor.
Etwa ¾ der gesamten DMSP-Produktion zwischen März und Oktober ereignete sich nach der
vernalen Diatomeenblüte in einer 45 Tage dauernden Blütephase von Phaeocystis globosa
(Haptophyta) und einer nachfolgenden Massenentwicklung von mixotrophen Flagellaten
(Cryptophyceen). Die Maxima der Phaeocystis-Blüte und der Oberflächenkonzentration von
partikulärem DMSP trafen zusammen mit einem lokalen Minimum der Fraßaktivität des
Mikrozooplanktons und ihres Konsums von partikulärem DMSP. Ansonsten war der Konsum
von partikulärem DMSP durch herbivores Mikrozooplankton eng mit der pflanzlichen DMSP
Produktion korreliert, und entsprach im Mittel 94 % eben dieser Produktion. Im Durchschnitt
wurde etwa 77% des vom Mikrozooplankton konsumierten partikulären DMSP wieder als
gelöstes DMSP freigesetzt und in den meisten Fällen schon in weniger als 24 Stunden
vollständig mikrobiell abgebaut.
Die selektiven Nährstoffanreicherungs-Experimente mit natürlichen Bakterien-
Gemeinschaften aus dem tropischen Atlantik galten vor allem der nährstoffbedingten
Veränderlichkeit des DMS-Ertrages beim mikrobiellen DMSP-Abbau. Ohne
Nährstoffanreicherungen betrug der DMS-Ertrag durchschnittlich 21 % des Abbaus von
gelöstem DMSP. Durch anorganische und organische Nährstoffanreicherungen konnte der
Ertrag bis auf maximal 90 % gesteigert werden. Die höchsten Erträge wurden erzielt mit
kombinierten Anreicherungen von gelöstem organischen Schwefel und Stickstoff in Form von
Methionin.
80
7 Summary The study contains three experimental investigations; laboratory experiments about the
DMSP-Produktion in cultures of marine planktonalgae, a series of field experiments about the
production and turnover of particulate DMSP in the North-Sea and a series of nutrient
enrichment experiments about the microbial turnover of dissolved DMSP in the tropical
Atlantic.
The culture experiments focused on the species-specific and the nitrogen-related variability of
the DMSP-production. The observed species-specific variability of the intracellular DMSP
concentration and the DMSP-production were one to two orders of magnitude higher than the
range of their nitrogen-related changes and highlighted the role of key species.
The importance of key species and the effect of the nutrient supply on the DMSP-production
was also apparent in the series of in situ experiments in the North-Sea. About ¾ of the total
DMSP-production between March and October happened during a phase of 45 days after the
vernal diatom bloom during a bloom of Phaeocystis globosa (Haptophyta) and a subsequent
development of mixotrophic flagellates (cryptophyta). The maxima of the Phaeocystis bloom
and of the surface concentrations of particulate DMSP coincided with a temporal minimum of
the consumption of particulate DMSP by microzooplankton grazing. Apart from the
Phaeocystis bloom, the consumption of particulate DMSP by microzooplankton was closely
related with its production by phytoplankton and accounted on average for about 94 % of the
production. About 77% of the consumed DMSP was on average released as dissolved DMSP
and was in most cases microbially degraded within less than 24h.
The nutrient enrichment experiments with natural size-fractionated bacteria communities in
the tropical Atlantic aimed at the nutrient related variability of the DMS-yield of the
decomposition of dissolved DMSP. In experiments without nutrient enrichments the DMS
yield was on average 21 %. The DMS yield increased in most experiments due to organic or
inorganic nutrient enrichments. The highest DMS-yields were achieved by the combined
enrichments of dissolved organic sulphur and nitrogen by methionine.
81
8 Literatur Anderson T R, Spall S A, Yool A, Cipollini P, Challenor P G, Fasham M J R (2001) Global fields of sea surface
dimethysulfide predicted from chlorophyll, nutrients and light. J Mar Syst 30: 1-20 Andreae M O (1986) The ocean as a source of atmosphaeric sulfur compounds. In: Buat-Menard P (ed) The role
of air-sea exchange in geochemical cycling. Reidel, New York, pp 331-362 Andreae T W, Andreae M O, Schebeske G (1994) Biogenic sulfur emissions and aerosols over the Tropical
South Atlantic 1. Dimethylsulfide in seawater and in the atmospheric boundary layer. J Geophys. Res. 99(D11) 22819-22
Andreae M O (1990) Ocean-atmosphere interaction in the global biogeochemical sulphur cycle. Mar Chem 30: 1-29
Andreae M O, Crutzen P J (1997) Atmospheric aerosols: biogeochemical sources and role in atmospheric chemistry. Science 276: 1052-1058
Antia A N, von Bodungen B, Peinert R (1999) Particle flux across the mid-European continental margin. DSR I 46:1999-2004
Archer S D, Widdicombe C E, Tarran G A, Rees A P, Burkill P H (2001) Production and turnover of particulate dimethylsulphoniopropionate during a coccolithophore bloom in the northern North Sea. Aquat. Microb. Ecol 24 (3): 225-241
Archer S D, Gilbert F J, Nightingale Ph D, Zubkov M V, Taylor A H, Smith G C, Burkill P H (2002) Transformation of dimethylsulphoniopropionate to dimethyl sulphide during summer in the North Sea with an examination of key processes via a modelling approach. Deep-Sea Research II 49: 3067-3101
Archer S D, Smith G C, Nightingale P D, Widdicombe C E, Tarran G A, Rees A P, Burkill P H (2002) Dynamics of particulate dimethylsulphoniopropionate during a Lagrangian experiment in the northern North Sea. Deep-Sea Res.II 49(15): 2979-2999
Ayers G P, Ivey J P, Gillet R W (1991) Coherence between seasonal cycles of dimethylsulphide, methanesulphonate and sulphate in marine air. Nature 349: 404-406
Ayers G P, Gras J L (1991) Seasonal relationship between cloud condensation nuclei and aerosol methanesulphonate in marine air. Nature 353: 834 – 835
Ayers G P and Gillett R W (2000) DMS and ist oxidation in the remote marine atmosphere: implications for climate and atmospheric chemistry. J. Sea Res. 43: 275-286
Barlow R G, Cummings D G, Gibb S W (1997) Improved resolution of mono- and divinyl-chlorophylls a and b and zeaxanthin and lutein in phytoplankton extracts using reverse phase C-8 HPLC. Mar Ecol Prog Ser 161: 303-307
Bates T S, Cline J D, Gammon R H, Kelly-Hansen St R (1987) Regional and seasonal variations in the flux of oceanic dimethylsilfid to the atmosphere. J Geophys Res 92 (C3): 2930 - 2938
Belviso S, Buat-Ménard P, Pitaud J Ph, Nguyen B C, claustre H, Neveux J (1993) Size distribution of dimethylsulfoniopropionate (DMSP) in areas of the tropical northeastern Atlantic Ocean and the Mediterranean Sea. Mar Chem 44: 55 - 71
Belviso S, Corn M, Buat-Menard P (1993) DMS emissions from contrasting trophic regimes in the tropical northeastern Atlantic Ocean. Ann Geophys 11 [Suppl II]: 218-232
Belviso S, Christaki U, Vidussi F, Matry J C, Vila M, Delgado M (2000) Diel variations of DMSP-to-chlorophyll a ratio in Northwestern Mediterranean waters. J Mar Syst
Belviso S, Claustre H, Marty J C (2001) Evaluation of the utility of chemotaxonomic pigments as a surrogate for particulate DMSP. Limnol Oceanogr 46 (4) 989-995
Bjørnsen P K, Kuparinen J (1991) Determination of bacterioplankton biomass, net production and growth efficiency in the Southern Ocean. Mar Ecol Progr Ser 71: 185-194.
Booth C B (1993) Estimating cell concentration and biomass of autotrophic plankton using microscopy. In Kemp P F (Hrsg.) Handbook of methods in aquatic microbial ecology. Lewis publisher, Boca Raton, S:199-205
Bratkak G, Egge J K & Heldal M (1993) Viral mortality of the marine alga Emiliania huxleyi (Haptophyceae) and termination of algal blooms. 93: 39 - 48
Brimblecombe P and Lein A Y (Edt.) (1989) Evolution of the Global Biogeochemical Sulphur Cycle. Wiley , Chichester
Brugger A, Slezak D, Obernosterer I, Herndl G J (1998) Photolysis of dimethylsulfide in the northern Adriatic Sea: Dependence on substrate concentration, irradiance and DOC concentration. Mar Chem 59 (3-4): 321-331
Bucciarelli E, Sunda W G (2003) Influence of CO2, nitrate, phosphate, and silicate limitation on intracellular dimethylsulfoniopropionate in batch cultures of the coastal diatome Thalassiosira pseudonana. Limnol Oceanogr 48: 2256-2265
82
Burkill P H, Archer St D, Robinson C, Nightingale Ph D, Groom St B, Tarran G A, Zubkov M V (2002) Dimethyl sulphide biogeochemistry within a coccolithophore bloom (DISCO): an overview Deep Sea Res II 49: 2863-2885
Challenger F, Simpson M I (1948) Studies on biological methylation, part XII. A precursor of dimethylsulfide evolved by Polysiphonia fastigata. Dimethyl-2-carboxyethyl-sulphonium hydroxid and its salts. J Chem. Soc. 3: 1591-1597
Charlson R J, Lovelock J E, Andreae M O, Warren St G (1987) Oceanic phytoplankton, atmospheric sulphur, cloud albedo and climate. Nature 326: 655 - 661
Chen Y B, Zehr J P, Mellon M (1996) Growth and nitrogen fixation of the diazotrophic filametous cyanobacterium Trichodesmium sp. IMS-101 in defined media: evidence for a circadian rhythm. J Phycol 32: 916-923
Christaki U, Belviso S, Dolan J R, Corn M (1996) Assessment of the role of copepods and ciliates in the release to solution of particulate DMSP. Mar Ecol Prog Ser 141: 119-127
Colmer T D, Fan T W Läuchli A, Higashi R M (1996) Interactive effects of salinity, nitrogen, and sulphur on the organic solutes in Spartina alterniflora leaf blades. J Exp Bot 47: 369-375
Dacey J W H, Blough N V (1987) Hydroxide decomposition of Dimethylsulfoniopropionate to form dimethylsulfide. Geophys Res Lett 14(12): 1246-1249
Dacey J W H, Howse F A, Michaels A F, Wakeham S G (1998) Temporal variability of dimethylsulfide and dimethylsulfoniopropionate in the Sargasso Sea. Deep-Sea Res I 45: 2085-2104
Dickson D M, Kirst G O (1987) Osmotic adjustment in marine eukaryotic algae: the role of inorganic ions, quaternery ammonium, tertiary sulfonoium and carbohydrate solutes. New Phytol 106: 645-655
Dortch Q, Packard T T (1989) Differences in biomass structure between oligotrophic and eutrophic marine ecosystems. Deep-Sea Res II 36: 223-240
Dugdale R and Wilkerson F (1992) Nutrient Limitation of new production in the sea. In: Falkowski P G and Woodhead A D (ed) Primary productivity and biogeochemical cycles in the sea. New York, Plenum p193-202
Erhardt M, Koeve W (1999) Determination of particulate organic carbon and nitrogen. In: Grasshoff K, Ehrhardt M, Kremling K (eds) Methods of seawater analysis. Wiley/VCH, New York/Weinheim pp 437–442
Gabric A, Watson G, Njjaar R, Erickson D, Matrai P (2001) Modeling the biogeochemical cycle of dimethylsulfide in the upper ocean: a review. Chemosphere - Global Change Science 3: 377-392
Gabric A J, Simó R, Cropp R A, Hirst A C, Dachs J (2004), Modeling estimates of the global emission of dimethylsulfide under enhanced greenhouse conditions. Global Biogeochem. Cycles 18
Gage DA, Rhodes D, Nolte K D, Hicks W A, Leustek T, Cooper A J L and Hanson A D (1997) A new route for synthesis of dimethylsulphoniopropionate in marine algae. Nature 387: 891 - 894
Gaul W, Antia, A N (2001) Taxon-specific growth and selective microzooplankton grazing of phytoplankton in the Northeast Atlantic. J Mar Syst , 30: 241-261
Graziano L M, Geider R J, Li W K W, Olaizola M (1996) Nitrogen limitation of North Atlantic phytoplankton: analysis of physiological condition in nutrient enrichment experiments. Aquat Microb Ecol 11: 53-64
Greene R C (1962) Biosynthesis of dimethyl-ß-propriothetin. J Biol Chem 237: 2251-2254 Gröne T, Kirst G O (1992) The effect of nitrogen deficiency, methionine and inhibitors of methionine
metabolism on the DMSP contents of Tetraselmis subcordiformis (Stein). Mar Biol 112: 497 – 503 Groene T (1995) Biogenic production and consumption of dimethylsulfide (DMS) and
dimethylsulfoniopropionate (DMSP) in the marine epipelagic zone: a review. J Mar syst 6: 191 - 209 Guillard R R L (1975) Culture of phytoplankton for feeding marine invertebrates. In: Smith WL and Chanley
MH (eds) Culture of marine invertebrate animals. Plenum, New York, pp 26-60 Hallegraeff G M (1993) A review of harmful algal blooms and theier apparent global increse. Phycologia 32 (2) :
79-99 Hansen H P Kororleff F (1999) Determination of nutrients. In: Grasshoff K, Ehrhardt M, Kremling K (eds)
Methods of seawater analysis. Wiley/VCH, New York/Weinheim, pp 159-228 Hatton A D (2002) DMSP removal and DMSO production in sedimenting particulate matter in the northern
North Sea. Deep Sea Res 49: 3039-3052 Hefu Y, Kirst G O (1997) Effect of UV-radiation on DMSP content and DMS formation of Phaeocystis
antarctica. Polar Biology 18: 402-409 Herbland A, LeBouteiller A, Raimbault P (1985) Size structure of phytoplankton biomass in the equatorial
Atlantic Ocean. Deep-Sea Res 32: 819-836 Holligan P M, Fernández E, Aiken J, Balch W M, Boyd P, Burkill P H, Finch M, Groom S B, Malin G, Muller
K, Trees C C, Turner S M, van der Wal P (1993) A biogeochemical study of the coccolithophore, Emiliania huxleyi, in the North Atlantic. Global Biogeochemical Cycles 7(4): 879–900
Ishida Y, Ogihara Y, und Okabe S (1990) Effects of a crude extract of a marine dinofalgellate, containing DMSP, on HCl-ethanol-induced gastric lesions and gastric secretion in rats. Japan J Pharmacol. 54 :333-338
Jansen M, Hansen T A (2001) Non-growth-associated demethylation of dimethylsulfoniopropionate by (homo)acetogenic bacteria. Applied and Environmental Microbiology. 67: 300-306
83
Keller M D, Bellows W K, Guillard R L (1989) Dimethylsulfide production in marine phytoplankton, In: Saltzman E S, Cooper W J (eds) Biogenic sulfur in the environment. ACS Series, Washington DC, pp 167-200
Keller M D, Korjeff-Bellows W (1996) Physiological aspects of the production of dimethylsulfoniopropionate (DMSP) by marine phytoplankton. In: Kiene R P et al. (eds) Biological and environmental chemistry of DMSP and related sulfonium compounds. In Plenum Press New York 1996
Keller M D, Kiene R P, Matrai P A, Bellows W K (1999 a) Production of glycine betaine and dimethylsulfoniopropionate in marine phytoplankton. 1. Batch cultures. Mar Biol 135: 237-248
Keller M D, Kiene R P, Matrai P A, Bellows W K (1999 b) Production of glycine betaine and dimethylsulfoniopropionate in marine phytoplankton. 2. N-limited chemostat cultures. Mar Biol 135: 249-257
Kettle A J, Andreae M O, Amouroux D, Andreae T W, Bates T S, Berresheim H, Bingemer H, Boniforti R, Curran M A J, DiTullio G R, Helas G, Jones G B, Keller M D, et al. (1999) A global database of sea surface dimethylsulfide (DMS) measurements and a procedure to predict sea surface DMS as a funktion of latitude, longitude and month. Global Biogeochemical Cycles 13: 399-444
Kiene R P and Taylor B F (1989) Metabolism of Acrylate and 3-Mercaptopropionate. Saltzman E S und Cooper W J (Hrsg) Biogenic sulfur in the environment, ACS symposium series, Washington DC
Kiene R P (1990) Dimethyl Sulfide Production from Dimethysulfoniumpropionate in Coastal Seawater Samples and Bacterial Cultures. Appl Envirom Microbiol 56 (11): 3292 – 3297
Kiene R P, Bates T S (1990) Biological removal of dimethyl sulphide from sea water. Nature 345: 702 - 705 Kiene R P, Service S K (1991) Decomposition of dissolved DMSP and DMS in estuarine waters; dependence on
temperature and substrate concentration. Mar Ecol. Prog Ser 76: 1-11 Kiene R P (1992) Dynamics of dimethy sulfide and dimethysulfoniopropionate in oceanic water samples. 37: 29-
52 Kiene R P (1993) Measurement of dimethylsulfid (DMS) and dimethylsulfoniopropionate (DMSP) in seawater
and estimation of DMS Turnover Rates. In: Handbook of methods in aquatic microbial ecology. Kemp P F (ed) Lewis publisher, Boca Raton, pp 601-609
Kiene R P und Gerard G (1995) Evaluation of glycine betaine as a inhibitor of dissolved dimethylsulfoniopropionate degradation in coastal waters. Mar Ecol Prog Ser 128: 121 – 131
Kiene R P (1996) Production of methanethiol from dimethylsulfoniopropionate in marine surface waters. Mar Chem 54(1): 69-83
Kiene R P, Linn L J, González J, Moran M A, Bruton J A. (1999) Dimethylsulfoniopropionate and Methanethiol Are Important Precursors of Methionine and Protein-Sulfur in Marine Bacterioplankton Appl. Envir. Microbiol. 65: 4549-4558
Kiene R P and Linn L J (2000) Distribution and turnover of dissolved DMSP and ist relationship with bacterial production and dimethylsulfide in the Gulf of Mexico. Limnol Oceanogr 45(5): 849-861
Kiene R P, Linn L J, Bruton J A (2000) New and important roles of DMSP in marine microbial communities. J Sea Res 43: 209-224
Kirst G O (1996) Osmotic adjustment in phytoplankton and macroalgae. In: Kiene RP, Visscher PT, Keller MD and Kirst GO (eds) Biological and environmental chemistry of DMSP and related sulfonium compounds., Plenum, New York, pp 121-130
Kwint R L J, Kramer K J M (1996) Annual cycle of the production and fate of DMS and DMSP in a marine coastal system. Mar Ecol Progr Ser 134: 217-224
Landry M R (1993) Estimating Rates of Growth and Grazing Mortality of Phytoplankton by Dilution Method. In Hadbook of Methods in Aquatic Microbial Ecology Chap 82
Laroche D , Vezina A F, Levasseur M, Gosselin M, Stefels J, Keller M D, Matrai P A, Kwint R L J (1999) DMSP synthesis and exudation in phytoplankton: a modeling approach. Mar Ecol Progr Ser 180: 37 – 49
Larsen A, Flaten G A, Sandaa R A, Castberg T, Thyrhaug R, Erga S R, Jacquet St, Bratbak G (2004) Spring phytoplankton bloom dynamics in Norwegian coastal waters: Microbial community succession and diversity. Limnol Oceanogr 49(1): 180-190
Ledyard K M, Dacey J W H (1996) Microbial cycling of DMSP and DMS in coastal and oligotrophic seawater. Limnol Oceanogr 41(1) 33 - 40
Legrand M, Feniet-Saigne C, Saltzman E S, Germain C, Barkov N I, Petrov V N (1991) Ice-core record of oceanic emissions of dimethylsulphide during the last climate cycle. Nature 350: 144-146
Leck C, Larsson U, Bågander L E, Johansson S, Hajdu S (1990) Dimethylsulfide in the Baltic Sea: annual variability in relation to biological activity. J Geophys Res 95: 3353-3363
Liss P S, Malin G, Turner S M, Holligan P M (1994) Dimethyl sulphide and Phaeocystis: a review. J Mar Syst 5: 41 - 53
Longhurst A (1995) Seasonal cycles of pelagic production and consumption. Progr. Oceanogr. 36: 77-167 Lovelock J E, Maggs R J, Rasmussen R A (1972) Atmosphaeric dimethylsulfide and the natural sulfursycle.
Nature 237: 452-453
84
Malin G , Turner S M, Liss P S, Holligan P, Harbour D (1993) Dimethylsulfide and dimethylsulfoniopropionate in the Northeast Atlantic during summer coccolithophore bloom. Deep Sea Res I 40(7): 1487-1508
Mantoura R F C und Llewellyn C A (1983) The rapid determination of alagal chlorophyll and carotinoid pigments and their breakdown products in natural waters by reverse-phase high-performance liquid chromatography. Analyt. Chim. Acta. 151:297-314
Matrai P A, Keller M D (1994) Total organic sulfur and dimethylsulfoniopropionate in marine phytoplankton: intracellular variations. Mar Biol 119: 61-68
Matrai P A, Vernet M, Hood R, Jennings A, Brody E, Saemundsdóttir S (1995) Light-dependence of carbon and sulfur production by polar clones of the genus Phaeocystis. Mar Biol 124: 157 – 167
Matrai P A, Cooper D J, Saltzman E S (1996) Frontal enhancement of dimethylsulfide across a Gulf Stream meander. J Mar Syst 7: 1 - 8
Mulholland M M, Otte M L (2000) Effects of varying sulphate and nitrogen supply on DMSP and glycine betaine levels in Spartina anglica. J Sea Res 43: 199-207
Nishiguchi M K and Somero G N (1992) Temperature and concentration dependence of compatiblity of the organic osmolyte beta-dimetylsulfoniopropionate. Cryobiology 29: 118-124
Passow U (2002) Transparent exopolymer particles (TEP) in aquatic environments. Progr. Oceanogr. 55: 287-333
Platt U , Le Bras G (1997) Influence of DMS on Ox-NOy partitioning and the NOx distribution in the marine background atmosphere. Geophys Res Lett 24: 1935 – 1938
Randal K, Lever M, Peddie B A, Chambers St T (1996) Natural and synthetic betaines counter the effects of high NaCl and urea concentration. Biochem Biophys Acta 1291: 189-194
Redfield A C, Ketchum B H, Richards F A (1963) The influence of organisms on the composition of sea water. In: Hill MN (ed) The sea. Wiley Interscience, New York, pp 26-77
Riegman R, Rowe A, Noordeloos A, Cadée G C (1993) Evidence for eutrophiction induced Phaeocystis sp. blooms in the Marsdiep Area (the Netherlands). in : T J Smayda and Shimizu Y : Toxic phytoplankton blooms in the sea.
Saltzman E S (1995) Ocean-atmosphere cycling of dimethylsulfide. In: Delmas R (ed) Ice core studies of global biogeochemical cycles. NATO ASI Ser. 30, Springer, New York, pp 65-89
Schnepf E, Elbrächter M (1992) Nutritional strategies in dinoflagellates. Eur J Protistol 28: 3-24 Sieburth J Mc N, Smetacek V, Lenz J (1978) Pelagic ecosystem structure : Heterotrphic compartments of the
plankton and their relationship to plankton size fractions. Limnol. Oceanogr.23(6):1256-1263 Simó R, Pedrós-Alió C (1999) Short term variability in the open ocean cycle of dimethylsulfide. Glob
Biogeochem Cycles 13 (4): 1173-1181 Simó R, Pedrós-Alio C, Malin G, Grimalt J O (2000) Biological turnover of DMS, DMSP and DMSO in
contrasting open-sea waters. 203: 1-11 Simó R (2001) Production of atmospheric sulfur bi oceanic plankton: biogeochemical, ecological and
evolutionary links. Trends in Ecology and Evolution 16(6): 287-294 Simó R, Archer St D, Pedrós-Alio C, Gilpin L, Stelfox-Widdicombe C E (2002) Coupled dynamics of
dimethylsulfoniopropionate and dimethylsulfide cycling and the microbial food web in surface waters of the North Atlantic. Limnol Oceanogr 47: 53-61
Slezak D, Burgger A, Herndl G J (2001) Impact of solar radiation on the biological removal of dimethylsulfoniopropionate and dimethylsulfide in marine surface waters. Aquat Microb Ecol 25:87-97
Slezak D, Herndl G J (2003) Effects of ultraviolet and visible radiation on the cellular concentrations of dimethylsulfonio-propionate (DMSP) in Emiliania huxleyi (strain L). Mar Ecol Progr Ser 246: 61-71
Smetacek, V (1981) The annual cycle of protozooplankton in the Kiel Bight. Mar Biol 63:1-11 Stefels J, van Boekel W H M (1993) Production of DMS from dissolved DMSP in axenic cultures of the marine
phytoplankton species Phaeocystis sp. Mar Ecol Prog Ser 97: 11 –18 Stefels J and Dijkhuizen L (1996) Characteristics of DMSP-lyase in Phaeocystis sp. (Prymnesiophyceae). Mar
Ecol Prog Ser 131: 307-313 Stefels J, van Leeuve MA (1998) Effects of iron and light stress on the biochemical composition of antarctic
Phaeocystis sp. (Prymnesiophzceae). I. Intracellular DMSP concentrations. J Phycol 34: 486-495 Stefels J (2000) Physiological aspects of the production and conversion of DMSP in marine algae and higher
plants. J Sea Res 43: 183-197 Steinke M, Wolf G V, Kirst G O (1998) Partial characterisation of dimethylsulfoniopropionate (DMSP) lyase
isozymes in 6 strains of Emiliania huxleyi. Mar Ecol Prog Ser 175: 215-235 Steinke M, Malin G, Liss P (2002) Trophic interactions in the sea: an ecological role for climate relevant
volatiles? J Phycol 38: 630-638 Strom S, Wolfe G, Slajer A, Lambert S, Clough J (2003) Chemical defense in the microplankton II: Inhibition of
protist feeding by ß-dimethylsulfoniopropionate (DMSP) Limnol. Oceanogr., 48(1), 2003, 230–237 Sunda W, Kieber D J, Kiene R P, Huntsman S (2002) An antioxidant function for DMSP and DMS in marine
algae. Nature 418 (6895): 317-320
85
Taylor B F and Kiene R P (1989) Microbial metabolism of Dimethyl Sulfide. In Saltzman E S und Cooper W J (Hrsg) Biogenic sulfur in the environment, ACS symposium series, Washington DC
Taylor A H, Harbour D S, Harris R P Burkill P H, Edwards E S (1993) Seasonal succession in the pelagic ecosystem of the North Atlantic and the utilization of nitrogen. J Plankton Res 15 (8): 875-891
Turner S M, Malin G, Liss P S (1988) The seasonal variation of dimethyl sulfide and dimethylsulfoniopropionate concentrations in nearshore waters. Limnol Oceanogr 33: 364 – 375
Turner S, Malin G, Leck C, Bågander L E, Leck C (1990) Interlaboratory Calibration and Sample Analysis of Dimethyl Sulphide in Water. Mar. Chem. 29: 47-62
Turner S M, Malin G, Nightingale P D, Liss P S (1996) Seasonal variation of dimethyl sulfide in the North Sea and an assessment of fluxes to the atmosphere. Mar Chem 54: 245-262
Turner S M, Nightingale Ph D, Spokes L J, Liddicoat M I, Liss P S (1996) Increased dimethyl sulphide concentrations in sea water from in situ iron enrichment. Nature 383: 513-516
Uher G (1999) Determination of dimethylsulfid in seawater. In: Grasshoff K, Ehrhardt M, Kremling K (eds) Methods of seawater analysis. Wiley/VCH, New York/Weinheim, pp 521-532
van Rijssel M, Gieskes W W C (2002) Temperature, light and the dimethylsulfoniopropionate (DMSP) content of Emiliania huxleyi (Prymnesiophyceae). J Sea Res 48: 17-27
van Rijssel, Buma A G J (2002) UV radiation induced stress does not affect DMSP synthesis in the marine prymnesiophyte Emiliania huxleyi. Aquat Microb Ecol 28: 167-174
Vetter Y A, Sharp J H (1993) The influence of light intensity on dimethylsulfide production bi a marine diatome. Limnol. Oceanogr. 38(2): 419-425
Wilson W H, Turner S, Mann N H (1998) Population Dynamics of Phytoplankton and Viruses in a Phosphate-limited Mesocosm and their Effect on DMSP and DMS Production. Est Coast Shelf Sci 46: 49 – 59
Wilson W H, Tarran G, Zubkov M V (2002) Virus dynamics in a coccolithophore-dominated bloom in the North Sea. Deep-Sea Res. II 49 (15): 2951-2963
Wolfe G V, Keine R P (1993) Radioisotope and chemical inhibitor measurements of dimethyl sulfide consumption rates and kinetics in estuarine waters. Mar. Ecol. Prog. Ser. 99: 261-269
Wolfe G V, Sherr E B, Sherr B F (1994) Releases and consumption of DMSP from Emiliania huxleyi during grazingby Oxyrrhis marina. Mar Ecol Prog Ser 111:111-119
Wolfe G V, Steinke M (1996) Grazing-activated production of dimethyl sulfide (DMS) by two clones of Emiliania huxleyi. Limnol Oceanogr 41 (6) 1151 - 1160
Wolfe G V, Steinke M, Kirst G O (1997) Grazing-activated chemical defence in a unicellular marine alga. Nature 387: 894-897
Yoch D C, Ansede J H, Rabinowitz K S (1997) Evidence for intracellular and extracellular dimethylsulfoniopropionate (DMSP) lyases and DMSP uptake sites in two species of marine bacteria. Appl. Environ. Microbiol. 63 (8):3182-3188
Yoch D C (2002) Dimethylsulfoniopropionate: Its Sources, Role in the Marine Food Web, and Biological Degradation to Dimethylsulfide Appl. Envir. Microbiol. 2002 68: 5804-5815
Yvon S A, Saltzman E S (1996) Atmospheric sulfur cycling in the tropical Pacific marine boundary layer (12°S; 135°W): a comparison of field data and model results. J Geophys Res 101: 6911-6918
Zubkov M V, Fuchs B M, Archer St D, Keine R P, Amann R, Burkill H (2001) Linking the composition of bacterioplankton to rapid turnover of dissolved dimethylsulphoniopropionate in an algal bloom in the North Sea. Environmental Microbilogy 3(5): 304-311
86
9 Anhang Veröffentlichungen Gaul W, Antia A N, Koeve W (1999) Microzooplankton grazing and nitrogen supply of phytoplankton growth in the temperate and subtropical North East Atlantic. Marine Ecology Progress Series 189: 93-104 Gaul W und Antia A N (2001) Taxon-specific growth and selective microzooplankton grazing of phytoplankton in the Northeast Atlantic, Journal of Marine Systems 30: 241-261 Gaul W und Antia A N (…) Nitrogen-related versus species-specific variability of the DMSP production in marine phytoplankton. Marine Biology (accepted Nov. 2004) Gaul W und van Beusekom J (…) Seasonal dynamics in production and turnover of DMSP in the North-Sea. Zur Begutachtung eingereicht bei Journal of Sea Reseach Gaul W und Lochte K (…) The microbial decomposition of dissolved DMSP and its nutrient dependent DMS yields in the tropical Atlantic. In Vorbereitung
87
Curriculum vitae
Name Wilhelm Gaul geboren am 6. November 1963 in Bocholt in Westfalen Anschrift Richard With Gate 22 8450 Stokmarknes Norwegen
Schule und Berufsausbildung 1969 – 1979 Grund- und Hauptschule 1979 – 1983 Facharbeiterausbildung zum Maschinenschlosser 1984 - 1988 Abendrealschule und Abendgymnasium 1990 – 1991 Zivildienst
Studium WS 1991 Christian-Albrechts-Universität zu Kiel – SS 1998 Diplom im Hauptfach Biologische Meereskunde, Thema der Diplomarbeit:
Untersuchungen zur Struktur und Dynamik von mikrobiellen Planktongemeinschaften im Nordost Atlantik
Forschungstätigkeit WS 1998 Institut für Meereskunde an der Universität Kiel – WS 1999 Studentische Hilfskraft und Wissenschaftlicher Angestellter in verschiedenen
Projekten der Biologischen Ozeanographie (JGOFS-NA, BASIC, OMEX) I. 2000 – Institut für Meereskunde(1) an der Universität Kiel
VIII. 2003 Doktorand und Wissenschaftlicher Mitarbeiter im Rahmen des DFG-Projektes (AN 193): Natürliche und experimentelle Veränderlichkeit der Produktion von DMSP und seines mikrobiellen Umsatzes zu DMS.
(1) heute Teil des Leibniz-Institutes für Meereswissenschaften
88
Danksagungen
Mein besonderer Dank gilt Prof. Karin Lochte und Avan N. Antia für die Betreuung der
Doktorarbeit, für Ihre Diskussionsbereitschaft und vielfältige Förderungen des Projektes.
Die Themenrichtung der Arbeit wurde angeregt von Prof. Bernt Zeitzschel mit Blick auf den
raschen Wandel im Fachbereich 2 des Institutes für Meereskunde. Für seine Hilfe bei der
Überbrückung in der Antragsphase des Projektes bin ich Prof. Bernd Zeitzschel sehr dankbar.
Die Reifung der Projekt-Idee und wertvolle Entwicklungshilfe für den späteren Aufbau der
Analytik verdanke ich vor allem der Möglichkeit zu einem Besuch bei Prof. Peter Liss an der
University of East Anglia (UEA) und den anregenden Diskussionen mit den dortigen
Wissenschaftlern Michael Steincke, Gilian Malin und Susan Turner.
Für die großzügige Bereitstellung eines Laborplatzes an der Wattenmeerstation in List danke
ich Justus von Beusekom vom Alfred-Wegner-Institut für Polar und Meeresforschung (AWI).
Die praktische Unterstützung von Hannelore Halliger (AWI) bei den Arbeiten mit
Algenkulturen war von unschätzbarem Wert für den Erfolg der Arbeiten. Auch Malte
Elbrächters (AWI) Beiträge von Dinoflagellaten-Stämme haben die Untersuchungen sehr
bereichert.
Für die stetige Erweiterung der Grenzen des Machbaren auf See danke ich den Kapitänen
Niels Kruse (FK-MYA), Volker Ohl (FK-LITTORINA) und ihren Mannschaften.
Ohne den Online-Support und die unermüdliche Hilfsbereitschaft von Kerstin Nachtigall und
Peter Fritsche wäre wohl vieles unmöglich geblieben.
Die technische Hilfe von Uwe Lentz und Martin Steen war unersetzlich bei der Entwicklung
und beim Bau des rotierenden In situ Inkubators.
Dem Engagement von Hermann Bange und Douglas W. R. Wallace verdanken wir die
Teilnahme an einer professionell vorbereiteten, durchgeführten und nachbereiteten METEOR-
Expedition M55 in den tropischen Atlantik.
Das Forschungsvorhaben wurde finanziell gefördert von der Deutschen
Forschungsgemeinschaft DFG (Geschäftszeichen AN193 / 1-3).