Embed Size (px)
Citation preview
W I R T S C H A F T S L A G E
U N D P R O G N O S E
März 2019
INHALTSÜBERSICHT
Seite
Tabellenteil
Wirtschaftswachstum, Bruttoinlandsprodukt 1
Internationale Wachstumsaussichten 2
Konsumausgaben 3
Investitionstätigkeit 4
Sachgütererzeugung 5
Außenhandel 6
Zahlungsbilanz 7
Staatshaushalt 8
Zinsen, Wechselkurse 9
Beschäftigung 10
Arbeitslosigkeit 11
Einkommen 12
Inflation 13
Die präsentierten Prognosedaten basieren auf der jüngsten Konjunkturprognose
des Österreichischen Institutes für Wirtschaftsforschung (WIFO).
Stand: März 2019
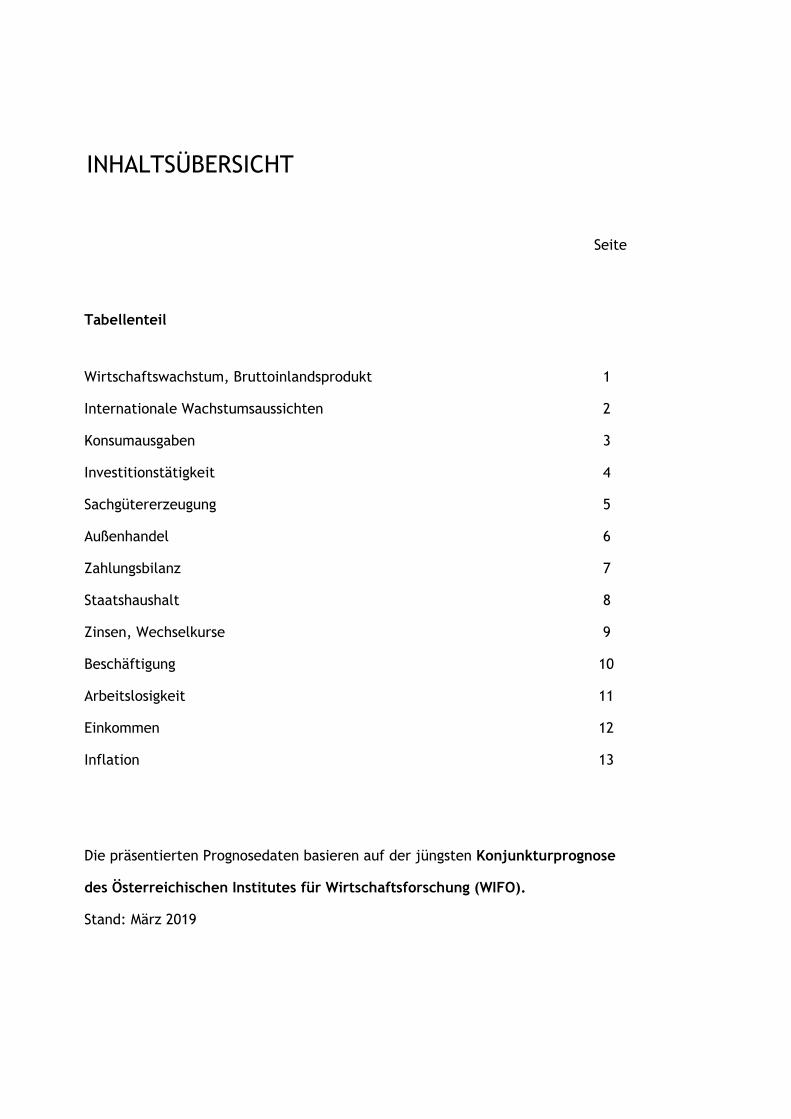
Wirtschaftswachstumreale Veränderung
des BIP¹in %
BIP real¹Index
1995=100
BIPnominellMrd. EUR
BIPnominelle
Veränderungin %
1995 . 100,0 176,18 .
2000 + 3,4 115,8 213,61 + 4,8
2001 + 1,3 117,3 220,53 + 3,2
2002 + 1,7 119,2 226,74 + 2,8
2003 + 0,9 120,4 231,86 + 2,3
2004 + 2,7 123,7 242,35 + 4,5
2005 + 2,2 126,4 254,08 + 4,8
2006 + 3,5 130,8 267,82 + 5,4
2007 + 3,7 135,7 283,98 + 6,0
2008 + 1,5 137,7 293,76 + 3,4
2009 - 3,8 132,5 288,04 - 1,9
2010 + 1,8 134,9 295,90 + 2,7
2011 + 2,9 138,8 310,13 + 4,8
2012 + 0,7 139,8 318,65 + 2,7
2013 + 0,0 139,8 323,91 + 1,6
2014 + 0,7 140,7 333,15 + 2,9
2015 + 1,1 142,4 344,26 + 3,3
2016 + 2,0 145,3 356,24 + 3,5
2017 + 2,6 149,0 369,90 + 3,8
2018 + 2,7 153,0 386,09 + 4,4
2019 + 1,7 155,6 400,66 + 3,8
2020 + 1,8 158,4 415,47 + 3,71 Vorjahrespreisbasis; nach ESVG 2010
Quelle: STATISTIK AUSTRIA, WIFO Stand: Dezember 2018
WIRTSCHAFTSLAGE UND PROGNOSEWirtschaftswachstum, Bruttoinlandsprodukt
2,42,1
3,6 3,6 3,4
1,31,7
0,9
2,72,2
3,53,7
1,5
-3,8
1,8
2,9
0,7
0,0
0,71,1
2,02,6 2,7
1,7 1,8
1996
1997
1998
1999
2000
2001
2002
2003
2004
2005
2006
2007
2008
2009
2010
2011
2012
2013
2014
2015
2016
2017
2018
2019
2020
Wirtschaftswachstum 1996 - 2020Veränderung des realen BIP (in %)
1
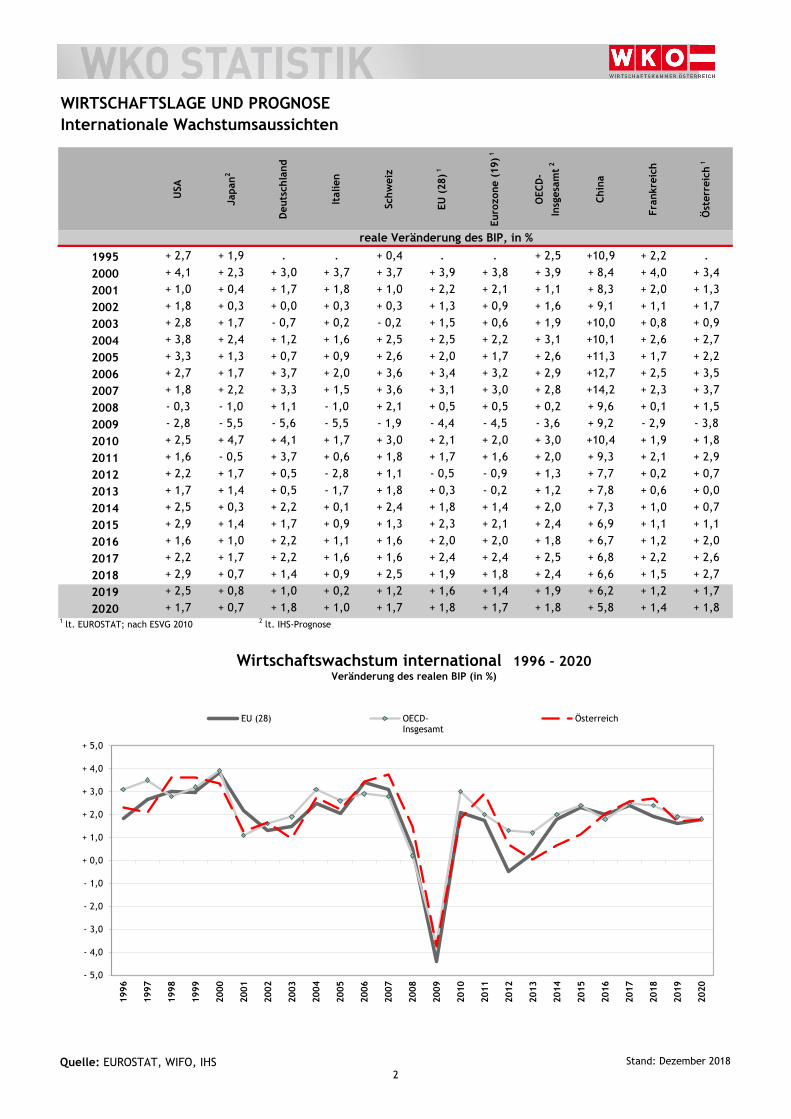
USA
Japa
n2
Deu
tsch
land
Ital
ien
Schw
eiz
EU (
28) 1
Euro
zone
(19
) 1
OEC
D-
Insg
esam
t 2
Chin
a
Fran
krei
ch
Öst
erre
ich 1
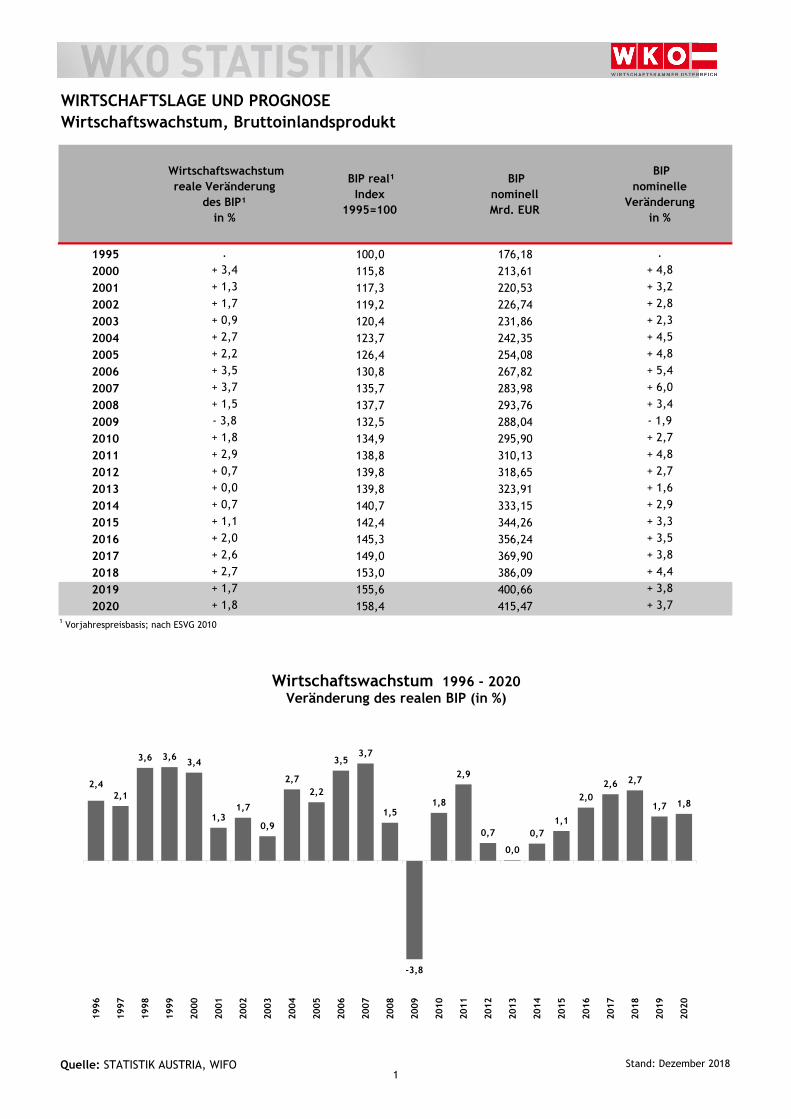
1995 + 2,7 + 1,9 . . + 0,4 . . + 2,5 +10,9 + 2,2 .
2000 + 4,1 + 2,3 + 3,0 + 3,7 + 3,7 + 3,9 + 3,8 + 3,9 + 8,4 + 4,0 + 3,4
2001 + 1,0 + 0,4 + 1,7 + 1,8 + 1,0 + 2,2 + 2,1 + 1,1 + 8,3 + 2,0 + 1,3
2002 + 1,8 + 0,3 + 0,0 + 0,3 + 0,3 + 1,3 + 0,9 + 1,6 + 9,1 + 1,1 + 1,7
2003 + 2,8 + 1,7 - 0,7 + 0,2 - 0,2 + 1,5 + 0,6 + 1,9 +10,0 + 0,8 + 0,9
2004 + 3,8 + 2,4 + 1,2 + 1,6 + 2,5 + 2,5 + 2,2 + 3,1 +10,1 + 2,6 + 2,7
2005 + 3,3 + 1,3 + 0,7 + 0,9 + 2,6 + 2,0 + 1,7 + 2,6 +11,3 + 1,7 + 2,2
2006 + 2,7 + 1,7 + 3,7 + 2,0 + 3,6 + 3,4 + 3,2 + 2,9 +12,7 + 2,5 + 3,5
2007 + 1,8 + 2,2 + 3,3 + 1,5 + 3,6 + 3,1 + 3,0 + 2,8 +14,2 + 2,3 + 3,7
2008 - 0,3 - 1,0 + 1,1 - 1,0 + 2,1 + 0,5 + 0,5 + 0,2 + 9,6 + 0,1 + 1,5
2009 - 2,8 - 5,5 - 5,6 - 5,5 - 1,9 - 4,4 - 4,5 - 3,6 + 9,2 - 2,9 - 3,8
2010 + 2,5 + 4,7 + 4,1 + 1,7 + 3,0 + 2,1 + 2,0 + 3,0 +10,4 + 1,9 + 1,8
2011 + 1,6 - 0,5 + 3,7 + 0,6 + 1,8 + 1,7 + 1,6 + 2,0 + 9,3 + 2,1 + 2,9
2012 + 2,2 + 1,7 + 0,5 - 2,8 + 1,1 - 0,5 - 0,9 + 1,3 + 7,7 + 0,2 + 0,7
2013 + 1,7 + 1,4 + 0,5 - 1,7 + 1,8 + 0,3 - 0,2 + 1,2 + 7,8 + 0,6 + 0,0
2014 + 2,5 + 0,3 + 2,2 + 0,1 + 2,4 + 1,8 + 1,4 + 2,0 + 7,3 + 1,0 + 0,7
2015 + 2,9 + 1,4 + 1,7 + 0,9 + 1,3 + 2,3 + 2,1 + 2,4 + 6,9 + 1,1 + 1,1
2016 + 1,6 + 1,0 + 2,2 + 1,1 + 1,6 + 2,0 + 2,0 + 1,8 + 6,7 + 1,2 + 2,0
2017 + 2,2 + 1,7 + 2,2 + 1,6 + 1,6 + 2,4 + 2,4 + 2,5 + 6,8 + 2,2 + 2,6
2018 + 2,9 + 0,7 + 1,4 + 0,9 + 2,5 + 1,9 + 1,8 + 2,4 + 6,6 + 1,5 + 2,7
2019 + 2,5 + 0,8 + 1,0 + 0,2 + 1,2 + 1,6 + 1,4 + 1,9 + 6,2 + 1,2 + 1,7
2020 + 1,7 + 0,7 + 1,8 + 1,0 + 1,7 + 1,8 + 1,7 + 1,8 + 5,8 + 1,4 + 1,81 lt. EUROSTAT; nach ESVG 2010 2 lt. IHS-Prognose
Quelle: EUROSTAT, WIFO, IHS Stand: Dezember 2018
WIRTSCHAFTSLAGE UND PROGNOSE Internationale Wachstumsaussichten
reale Veränderung des BIP, in %
- 5,0
- 4,0
- 3,0
- 2,0
- 1,0
+ 0,0
+ 1,0
+ 2,0
+ 3,0
+ 4,0
+ 5,0
1996
1997
1998
1999
2000
2001
2002
2003
2004
2005
2006
2007
2008
2009
2010
2011
2012
2013
2014
2015
2016
2017
2018
2019
2020
EU (28) OECD-Insgesamt
Österreich
Wirtschaftswachstum international 1996 - 2020Veränderung des realen BIP (in %)
2
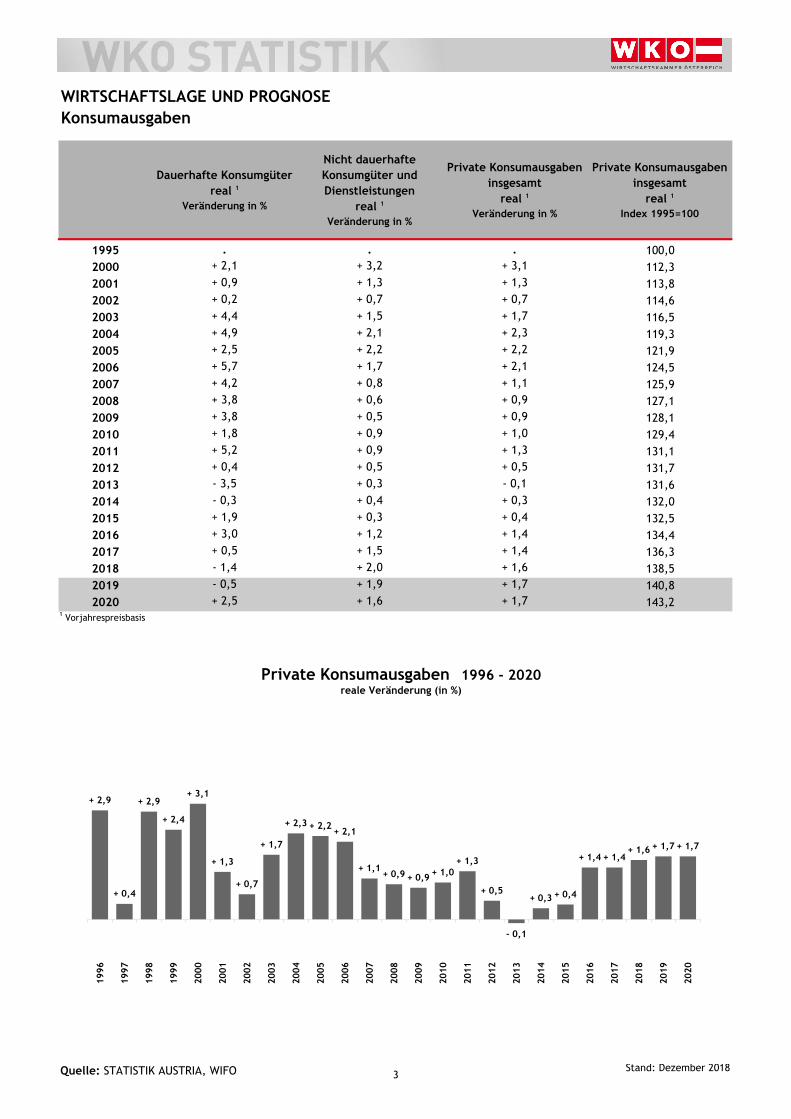
Dauerhafte Konsumgüterreal 1
Veränderung in %
Nicht dauerhafte Konsumgüter undDienstleistungen
real 1
Veränderung in %
Private Konsumausgaben insgesamt
real 1
Veränderung in %
Private Konsumausgaben insgesamt
real 1
Index 1995=100
1995 . . . 100,02000 + 2,1 + 3,2 + 3,1 112,32001 + 0,9 + 1,3 + 1,3 113,82002 + 0,2 + 0,7 + 0,7 114,62003 + 4,4 + 1,5 + 1,7 116,52004 + 4,9 + 2,1 + 2,3 119,32005 + 2,5 + 2,2 + 2,2 121,92006 + 5,7 + 1,7 + 2,1 124,52007 + 4,2 + 0,8 + 1,1 125,92008 + 3,8 + 0,6 + 0,9 127,12009 + 3,8 + 0,5 + 0,9 128,12010 + 1,8 + 0,9 + 1,0 129,42011 + 5,2 + 0,9 + 1,3 131,12012 + 0,4 + 0,5 + 0,5 131,72013 - 3,5 + 0,3 - 0,1 131,62014 - 0,3 + 0,4 + 0,3 132,02015 + 1,9 + 0,3 + 0,4 132,52016 + 3,0 + 1,2 + 1,4 134,42017 + 0,5 + 1,5 + 1,4 136,32018 - 1,4 + 2,0 + 1,6 138,52019 - 0,5 + 1,9 + 1,7 140,82020 + 2,5 + 1,6 + 1,7 143,2
1 Vorjahrespreisbasis
Quelle: STATISTIK AUSTRIA, WIFO Stand: Dezember 2018
WIRTSCHAFTSLAGE UND PROGNOSE Konsumausgaben
+ 2,9
+ 0,4
+ 2,9
+ 2,4
+ 3,1
+ 1,3
+ 0,7
+ 1,7
+ 2,3 + 2,2 + 2,1
+ 1,1+ 0,9 + 0,9 + 1,0
+ 1,3
+ 0,5
- 0,1
+ 0,3 + 0,4
+ 1,4 + 1,4+ 1,6 + 1,7 + 1,7
1996
1997
1998
1999
2000
2001
2002
2003
2004
2005
2006
2007
2008
2009
2010
2011
2012
2013
2014
2015
2016
2017
2018
2019
2020
Private Konsumausgaben 1996 - 2020reale Veränderung (in %)
3
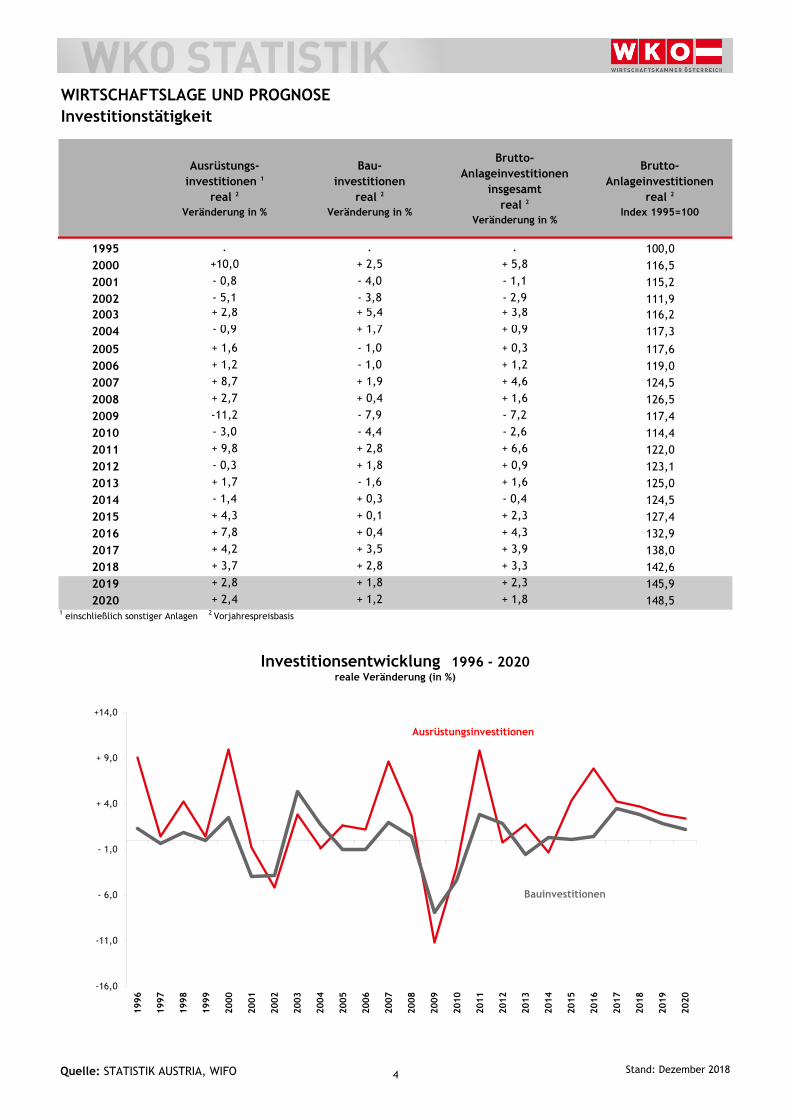
Ausrüstungs-investitionen 1
real 2
Veränderung in %
Bau-investitionen
real 2
Veränderung in %
Brutto-Anlageinvestitionen
insgesamtreal 2
Veränderung in %
Brutto-Anlageinvestitionen
real 2
Index 1995=100
1995 . . . 100,02000 +10,0 + 2,5 + 5,8 116,52001 - 0,8 - 4,0 - 1,1 115,22002 - 5,1 - 3,8 - 2,9 111,92003 + 2,8 + 5,4 + 3,8 116,22004 - 0,9 + 1,7 + 0,9 117,32005 + 1,6 - 1,0 + 0,3 117,62006 + 1,2 - 1,0 + 1,2 119,02007 + 8,7 + 1,9 + 4,6 124,52008 + 2,7 + 0,4 + 1,6 126,52009 -11,2 - 7,9 - 7,2 117,42010 - 3,0 - 4,4 - 2,6 114,42011 + 9,8 + 2,8 + 6,6 122,02012 - 0,3 + 1,8 + 0,9 123,12013 + 1,7 - 1,6 + 1,6 125,02014 - 1,4 + 0,3 - 0,4 124,52015 + 4,3 + 0,1 + 2,3 127,42016 + 7,8 + 0,4 + 4,3 132,92017 + 4,2 + 3,5 + 3,9 138,02018 + 3,7 + 2,8 + 3,3 142,62019 + 2,8 + 1,8 + 2,3 145,92020 + 2,4 + 1,2 + 1,8 148,5
1 einschließlich sonstiger Anlagen 2 Vorjahrespreisbasis
Quelle: STATISTIK AUSTRIA, WIFO Stand: Dezember 2018
WIRTSCHAFTSLAGE UND PROGNOSE Investitionstätigkeit
-16,0
-11,0
- 6,0
- 1,0
+ 4,0
+ 9,0
+14,0
1996
1997
1998
1999
2000
2001
2002
2003
2004
2005
2006
2007
2008
2009
2010
2011
2012
2013
2014
2015
2016
2017
2018
2019
2020
Investitionsentwicklung 1996 - 2020reale Veränderung (in %)
Ausrüstungsinvestitionen
Bauinvestitionen
4
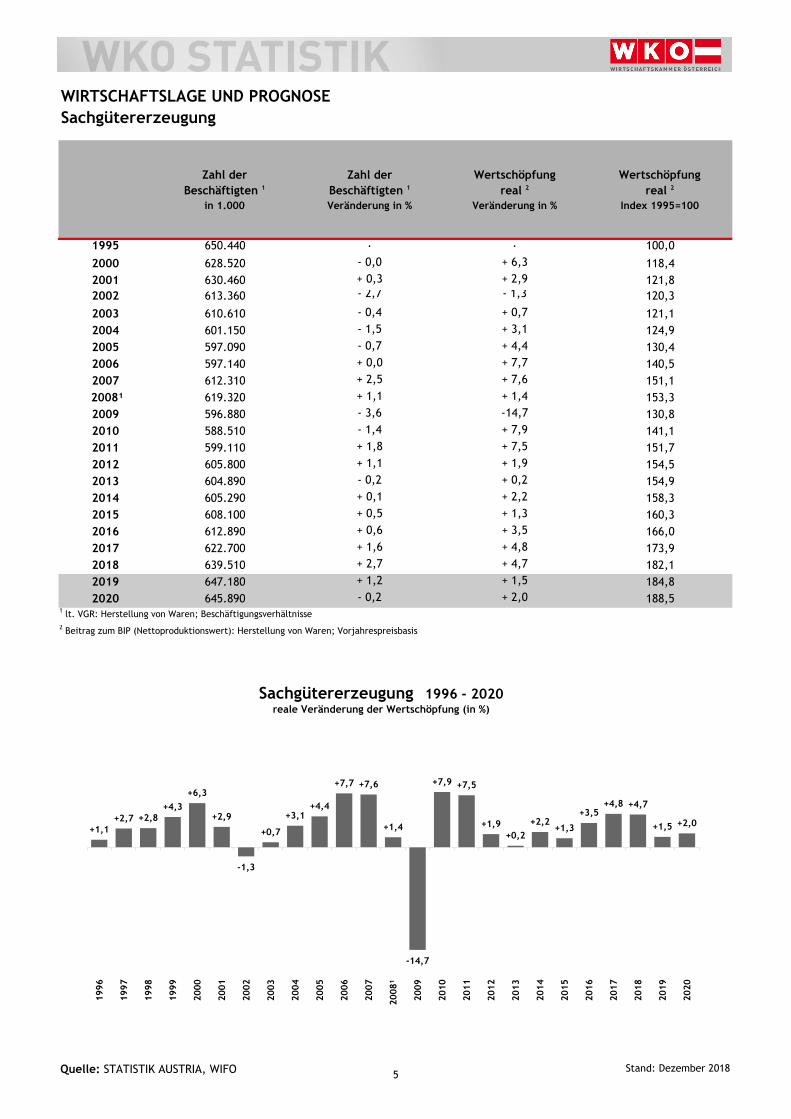
Zahl derBeschäftigten 1
in 1.000
Zahl derBeschäftigten 1
Veränderung in %
Wertschöpfungreal 2
Veränderung in %
Wertschöpfungreal 2
Index 1995=100
1995 650.440 . . 100,02000 628.520 - 0,0 + 6,3 118,42001 630.460 + 0,3 + 2,9 121,82002 613.360 - 2,7 - 1,3 120,32003 610.610 - 0,4 + 0,7 121,12004 601.150 - 1,5 + 3,1 124,92005 597.090 - 0,7 + 4,4 130,42006 597.140 + 0,0 + 7,7 140,52007 612.310 + 2,5 + 7,6 151,1
2008¹ 619.320 + 1,1 + 1,4 153,32009 596.880 - 3,6 -14,7 130,82010 588.510 - 1,4 + 7,9 141,12011 599.110 + 1,8 + 7,5 151,72012 605.800 + 1,1 + 1,9 154,52013 604.890 - 0,2 + 0,2 154,92014 605.290 + 0,1 + 2,2 158,32015 608.100 + 0,5 + 1,3 160,32016 612.890 + 0,6 + 3,5 166,02017 622.700 + 1,6 + 4,8 173,92018 639.510 + 2,7 + 4,7 182,12019 647.180 + 1,2 + 1,5 184,82020 645.890 - 0,2 + 2,0 188,5
1 lt. VGR: Herstellung von Waren; Beschäftigungsverhältnisse2 Beitrag zum BIP (Nettoproduktionswert): Herstellung von Waren; Vorjahrespreisbasis
Quelle: STATISTIK AUSTRIA, WIFO Stand: Dezember 2018
WIRTSCHAFTSLAGE UND PROGNOSE Sachgütererzeugung
+1,1+2,7 +2,8
+4,3+6,3
+2,9
-1,3
+0,7
+3,1+4,4
+7,7 +7,6
+1,4
-14,7
+7,9 +7,5
+1,9+0,2
+2,2+1,3
+3,5+4,8 +4,7
+1,5 +2,0
1996
1997
1998
1999
2000
2001
2002
2003
2004
2005
2006
2007
200
8¹
2009
2010
2011
2012
2013
2014
2015
2016
2017
2018
2019
2020
Sachgütererzeugung 1996 - 2020reale Veränderung der Wertschöpfung (in %)
5
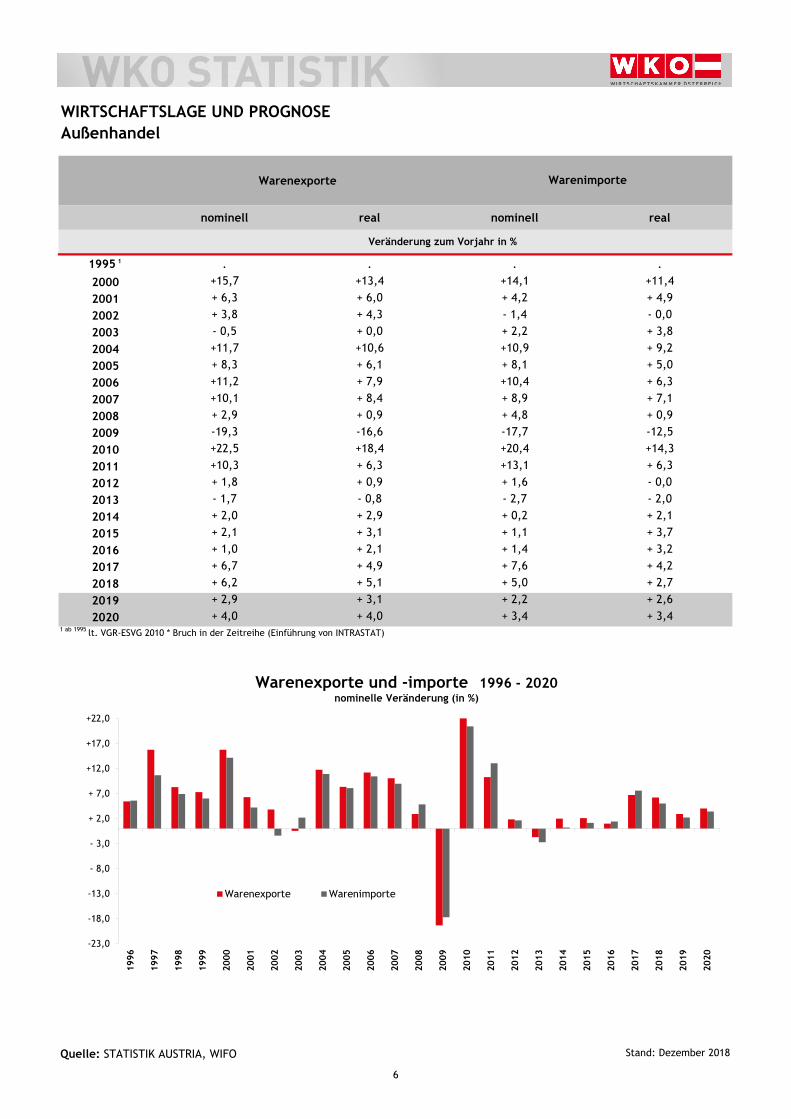
Warenexporte
nominell real nominell real
1995 1 . . . .
2000 +15,7 +13,4 +14,1 +11,4
2001 + 6,3 + 6,0 + 4,2 + 4,9
2002 + 3,8 + 4,3 - 1,4 - 0,0
2003 - 0,5 + 0,0 + 2,2 + 3,8
2004 +11,7 +10,6 +10,9 + 9,2
2005 + 8,3 + 6,1 + 8,1 + 5,0
2006 +11,2 + 7,9 +10,4 + 6,3
2007 +10,1 + 8,4 + 8,9 + 7,1
2008 + 2,9 + 0,9 + 4,8 + 0,9
2009 -19,3 -16,6 -17,7 -12,5
2010 +22,5 +18,4 +20,4 +14,3
2011 +10,3 + 6,3 +13,1 + 6,3
2012 + 1,8 + 0,9 + 1,6 - 0,0
2013 - 1,7 - 0,8 - 2,7 - 2,0
2014 + 2,0 + 2,9 + 0,2 + 2,1
2015 + 2,1 + 3,1 + 1,1 + 3,7
2016 + 1,0 + 2,1 + 1,4 + 3,2
2017 + 6,7 + 4,9 + 7,6 + 4,2
2018 + 6,2 + 5,1 + 5,0 + 2,7
2019 + 2,9 + 3,1 + 2,2 + 2,6
2020 + 4,0 + 4,0 + 3,4 + 3,41 ab 1995 lt. VGR-ESVG 2010 * Bruch in der Zeitreihe (Einführung von INTRASTAT)
Quelle: STATISTIK AUSTRIA, WIFO Stand: Dezember 2018
WIRTSCHAFTSLAGE UND PROGNOSE Außenhandel
Warenimporte
Veränderung zum Vorjahr in %
-23,0
-18,0
-13,0
- 8,0
- 3,0
+ 2,0
+ 7,0
+12,0
+17,0
+22,0
1996
1997
1998
1999
2000
2001
2002
2003
2004
2005
2006
2007
2008
2009
2010
2011
2012
2013
2014
2015
2016
2017
2018
2019
2020
Warenexporte Warenimporte
Warenexporte und -importe 1996 - 2020nominelle Veränderung (in %)
6
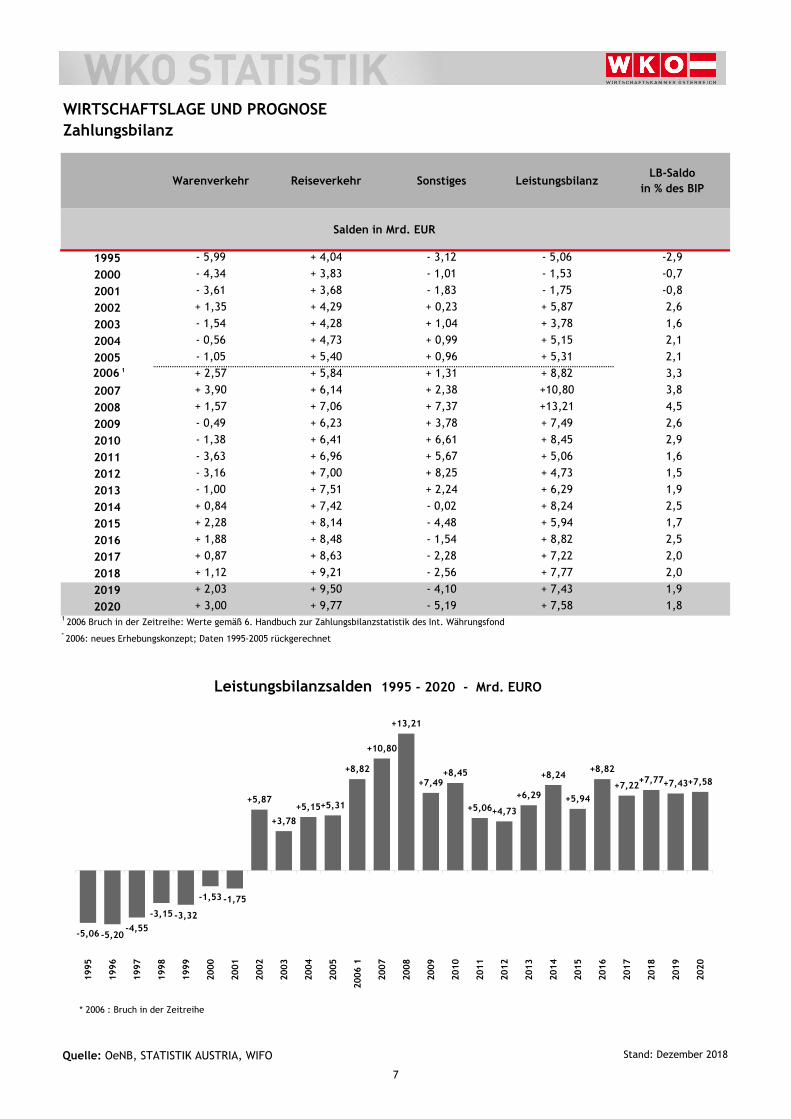
Warenverkehr Reiseverkehr Sonstiges LeistungsbilanzLB-Saldo
in % des BIP
Salden in Mrd. EUR
1995 - 5,99 + 4,04 - 3,12 - 5,06 -2,92000 - 4,34 + 3,83 - 1,01 - 1,53 -0,72001 - 3,61 + 3,68 - 1,83 - 1,75 -0,82002 + 1,35 + 4,29 + 0,23 + 5,87 2,62003 - 1,54 + 4,28 + 1,04 + 3,78 1,62004 - 0,56 + 4,73 + 0,99 + 5,15 2,12005 - 1,05 + 5,40 + 0,96 + 5,31 2,1
2006 1 + 2,57 + 5,84 + 1,31 + 8,82 3,32007 + 3,90 + 6,14 + 2,38 +10,80 3,82008 + 1,57 + 7,06 + 7,37 +13,21 4,52009 - 0,49 + 6,23 + 3,78 + 7,49 2,62010 - 1,38 + 6,41 + 6,61 + 8,45 2,92011 - 3,63 + 6,96 + 5,67 + 5,06 1,62012 - 3,16 + 7,00 + 8,25 + 4,73 1,52013 - 1,00 + 7,51 + 2,24 + 6,29 1,92014 + 0,84 + 7,42 - 0,02 + 8,24 2,52015 + 2,28 + 8,14 - 4,48 + 5,94 1,72016 + 1,88 + 8,48 - 1,54 + 8,82 2,52017 + 0,87 + 8,63 - 2,28 + 7,22 2,02018 + 1,12 + 9,21 - 2,56 + 7,77 2,02019 + 2,03 + 9,50 - 4,10 + 7,43 1,92020 + 3,00 + 9,77 - 5,19 + 7,58 1,8
1 2006 Bruch in der Zeitreihe: Werte gemäß 6. Handbuch zur Zahlungsbilanzstatistik des Int. Währungsfond* 2006: neues Erhebungskonzept; Daten 1995-2005 rückgerechnet
Quelle: OeNB, STATISTIK AUSTRIA, WIFO Stand: Dezember 2018
WIRTSCHAFTSLAGE UND PROGNOSE Zahlungsbilanz
-5,06 -5,20-4,55
-3,15 -3,32
-1,53 -1,75
+5,87
+3,78+5,15+5,31
+8,82
+10,80
+13,21
+7,49+8,45
+5,06+4,73
+6,29
+8,24
+5,94
+8,82
+7,22+7,77+7,43+7,58
1995
1996
1997
1998
1999
2000
2001
2002
2003
2004
2005
200
6 1
2007
2008
2009
2010
2011
2012
2013
2014
2015
2016
2017
2018
2019
2020
Leistungsbilanzsalden 1995 - 2020 - Mrd. EURO
* 2006 : Bruch in der Zeitreihe
7
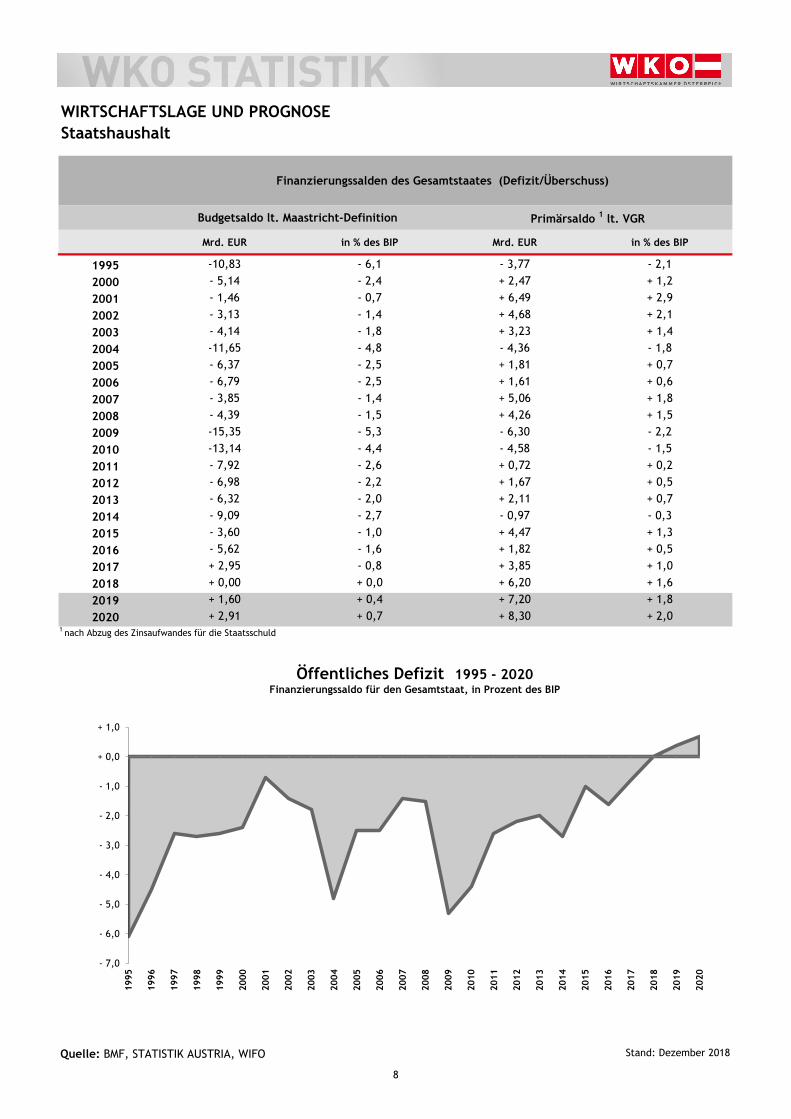
Finanzierungssalden des Gesamtstaates (Defizit/Überschuss)
Budgetsaldo lt. Maastricht-Definition Primärsaldo 1 lt. VGR
Mrd. EUR in % des BIP Mrd. EUR in % des BIP
1995 -10,83 - 6,1 - 3,77 - 2,1
2000 - 5,14 - 2,4 + 2,47 + 1,2
2001 - 1,46 - 0,7 + 6,49 + 2,9
2002 - 3,13 - 1,4 + 4,68 + 2,1
2003 - 4,14 - 1,8 + 3,23 + 1,4
2004 -11,65 - 4,8 - 4,36 - 1,8
2005 - 6,37 - 2,5 + 1,81 + 0,7
2006 - 6,79 - 2,5 + 1,61 + 0,6
2007 - 3,85 - 1,4 + 5,06 + 1,8
2008 - 4,39 - 1,5 + 4,26 + 1,5
2009 -15,35 - 5,3 - 6,30 - 2,2
2010 -13,14 - 4,4 - 4,58 - 1,5
2011 - 7,92 - 2,6 + 0,72 + 0,2
2012 - 6,98 - 2,2 + 1,67 + 0,5
2013 - 6,32 - 2,0 + 2,11 + 0,7
2014 - 9,09 - 2,7 - 0,97 - 0,3
2015 - 3,60 - 1,0 + 4,47 + 1,3
2016 - 5,62 - 1,6 + 1,82 + 0,5
2017 + 2,95 - 0,8 + 3,85 + 1,0
2018 + 0,00 + 0,0 + 6,20 + 1,6
2019 + 1,60 + 0,4 + 7,20 + 1,8
2020 + 2,91 + 0,7 + 8,30 + 2,01 nach Abzug des Zinsaufwandes für die Staatsschuld
Quelle: BMF, STATISTIK AUSTRIA, WIFO Stand: Dezember 2018
WIRTSCHAFTSLAGE UND PROGNOSE Staatshaushalt
- 7,0
- 6,0
- 5,0
- 4,0
- 3,0
- 2,0
- 1,0
+ 0,0
+ 1,0
1995
1996
1997
1998
1999
2000
2001
2002
2003
2004
2005
2006
2007
2008
2009
2010
2011
2012
2013
2014
2015
2016
2017
2018
2019
2020
Öffentliches Defizit 1995 - 2020Finanzierungssaldo für den Gesamtstaat, in Prozent des BIP
8
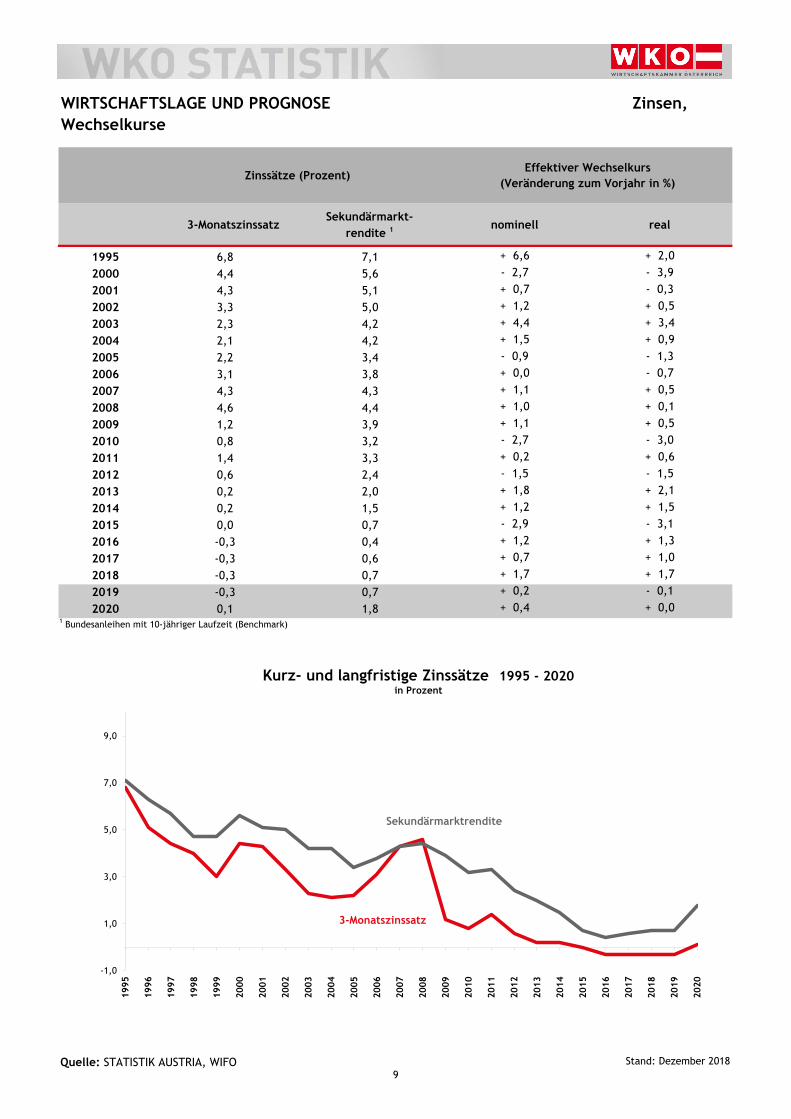
Zinssätze (Prozent)Effektiver Wechselkurs
(Veränderung zum Vorjahr in %)
3-MonatszinssatzSekundärmarkt-
rendite 1 nominell real
1995 6,8 7,1 + 6,6 + 2,0
2000 4,4 5,6 - 2,7 - 3,9
2001 4,3 5,1 + 0,7 - 0,3
2002 3,3 5,0 + 1,2 + 0,5
2003 2,3 4,2 + 4,4 + 3,4
2004 2,1 4,2 + 1,5 + 0,9
2005 2,2 3,4 - 0,9 - 1,3
2006 3,1 3,8 + 0,0 - 0,7
2007 4,3 4,3 + 1,1 + 0,5
2008 4,6 4,4 + 1,0 + 0,1
2009 1,2 3,9 + 1,1 + 0,5
2010 0,8 3,2 - 2,7 - 3,0
2011 1,4 3,3 + 0,2 + 0,6
2012 0,6 2,4 - 1,5 - 1,5
2013 0,2 2,0 + 1,8 + 2,1
2014 0,2 1,5 + 1,2 + 1,5
2015 0,0 0,7 - 2,9 - 3,1
2016 -0,3 0,4 + 1,2 + 1,3
2017 -0,3 0,6 + 0,7 + 1,0
2018 -0,3 0,7 + 1,7 + 1,7
2019 -0,3 0,7 + 0,2 - 0,1
2020 0,1 1,8 + 0,4 + 0,01 Bundesanleihen mit 10-jähriger Laufzeit (Benchmark)
Quelle: STATISTIK AUSTRIA, WIFO Stand: Dezember 2018
WIRTSCHAFTSLAGE UND PROGNOSE Zinsen, Wechselkurse
-1,0
1,0
3,0
5,0
7,0
9,0
1995
1996
1997
1998
1999
2000
2001
2002
2003
2004
2005
2006
2007
2008
2009
2010
2011
2012
2013
2014
2015
2016
2017
2018
2019
2020
Kurz- und langfristige Zinssätze 1995 - 2020in Prozent
Sekundärmarktrendite
3-Monatszinssatz
9
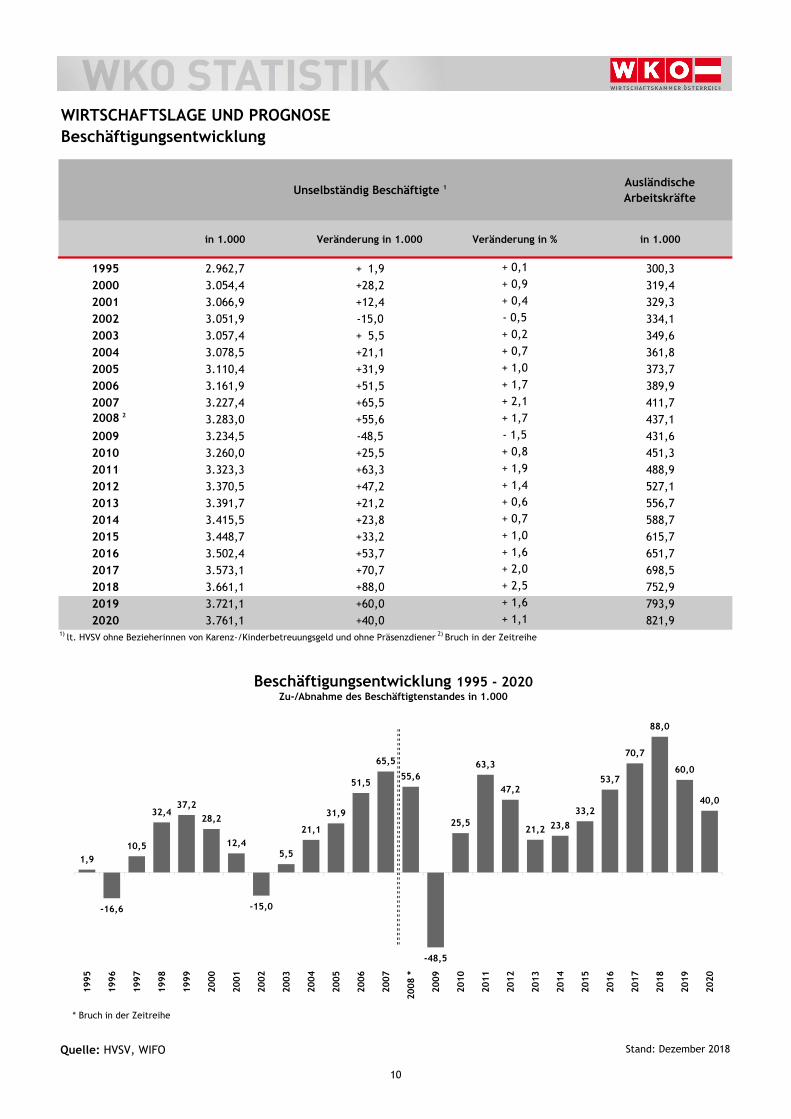
Unselbständig Beschäftigte 1 AusländischeArbeitskräfte
in 1.000 Veränderung in 1.000 Veränderung in % in 1.000
1995 2.962,7 + 1,9 + 0,1 300,32000 3.054,4 +28,2 + 0,9 319,42001 3.066,9 +12,4 + 0,4 329,32002 3.051,9 -15,0 - 0,5 334,12003 3.057,4 + 5,5 + 0,2 349,62004 3.078,5 +21,1 + 0,7 361,82005 3.110,4 +31,9 + 1,0 373,72006 3.161,9 +51,5 + 1,7 389,92007 3.227,4 +65,5 + 2,1 411,7
2008 2 3.283,0 +55,6 + 1,7 437,12009 3.234,5 -48,5 - 1,5 431,62010 3.260,0 +25,5 + 0,8 451,32011 3.323,3 +63,3 + 1,9 488,92012 3.370,5 +47,2 + 1,4 527,12013 3.391,7 +21,2 + 0,6 556,72014 3.415,5 +23,8 + 0,7 588,72015 3.448,7 +33,2 + 1,0 615,72016 3.502,4 +53,7 + 1,6 651,72017 3.573,1 +70,7 + 2,0 698,52018 3.661,1 +88,0 + 2,5 752,92019 3.721,1 +60,0 + 1,6 793,92020 3.761,1 +40,0 + 1,1 821,9
Quelle: HVSV, WIFO Stand: Dezember 2018
1) lt. HVSV ohne Bezieherinnen von Karenz-/Kinderbetreuungsgeld und ohne Präsenzdiener 2) Bruch in der Zeitreihe
WIRTSCHAFTSLAGE UND PROGNOSE Beschäftigungsentwicklung
1,9
-16,6
10,5
32,437,2
28,2
12,4
-15,0
5,5
21,1
31,9
51,5
65,5
55,6
-48,5
25,5
63,3
47,2
21,2 23,833,2
53,7
70,7
88,0
60,0
40,0
1995
1996
1997
1998
1999
2000
2001
2002
2003
2004
2005
2006
2007
200
8 *
2009
2010
2011
2012
2013
2014
2015
2016
2017
2018
2019
2020
Beschäftigungsentwicklung 1990 - 2013Zu-/Abnahme des Beschäftigtenstandes in Tsd.
Beschäftigungsentwicklung 1995 - 2020Zu-/Abnahme des Beschäftigtenstandes in 1.000
* Bruch in der Zeitreihe
10
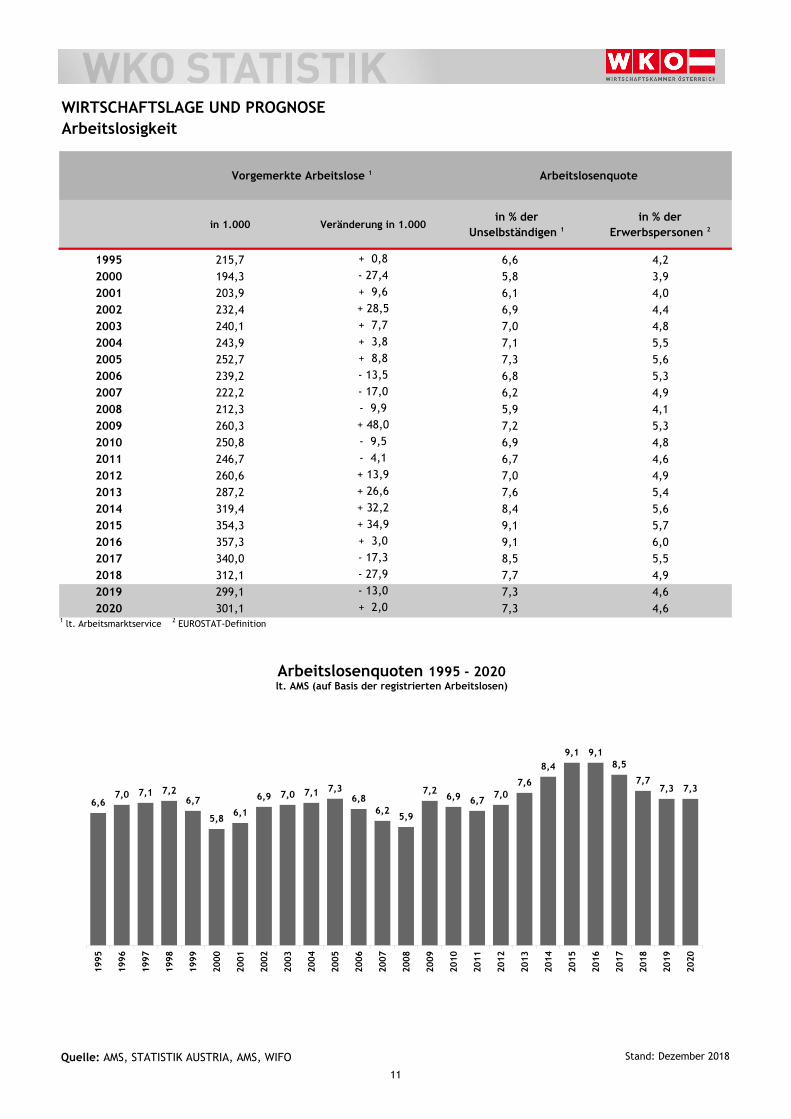
Vorgemerkte Arbeitslose 1 Arbeitslosenquote
in 1.000 Veränderung in 1.000in % der
Unselbständigen 1
in % der Erwerbspersonen 2
1995 215,7 + 0,8 6,6 4,22000 194,3 - 27,4 5,8 3,92001 203,9 + 9,6 6,1 4,02002 232,4 + 28,5 6,9 4,42003 240,1 + 7,7 7,0 4,82004 243,9 + 3,8 7,1 5,52005 252,7 + 8,8 7,3 5,62006 239,2 - 13,5 6,8 5,32007 222,2 - 17,0 6,2 4,92008 212,3 - 9,9 5,9 4,12009 260,3 + 48,0 7,2 5,32010 250,8 - 9,5 6,9 4,82011 246,7 - 4,1 6,7 4,62012 260,6 + 13,9 7,0 4,92013 287,2 + 26,6 7,6 5,42014 319,4 + 32,2 8,4 5,62015 354,3 + 34,9 9,1 5,72016 357,3 + 3,0 9,1 6,02017 340,0 - 17,3 8,5 5,52018 312,1 - 27,9 7,7 4,92019 299,1 - 13,0 7,3 4,62020 301,1 + 2,0 7,3 4,6
1 lt. Arbeitsmarktservice 2 EUROSTAT-Definition
Quelle: AMS, STATISTIK AUSTRIA, AMS, WIFO Stand: Dezember 2018
WIRTSCHAFTSLAGE UND PROGNOSE Arbeitslosigkeit
6,6 7,0 7,1 7,2
6,7
5,8 6,1
6,9 7,0 7,1 7,3 6,8
6,2 5,9
7,2 6,9 6,7
7,0 7,6
8,4 9,1 9,1
8,5
7,7 7,3 7,3
1995
1996
1997
1998
1999
2000
2001
2002
2003
2004
2005
2006
2007
2008
2009
2010
2011
2012
2013
2014
2015
2016
2017
2018
2019
2020
Arbeitslosenquoten 1995 - 2020lt. AMS (auf Basis der registrierten Arbeitslosen)
11
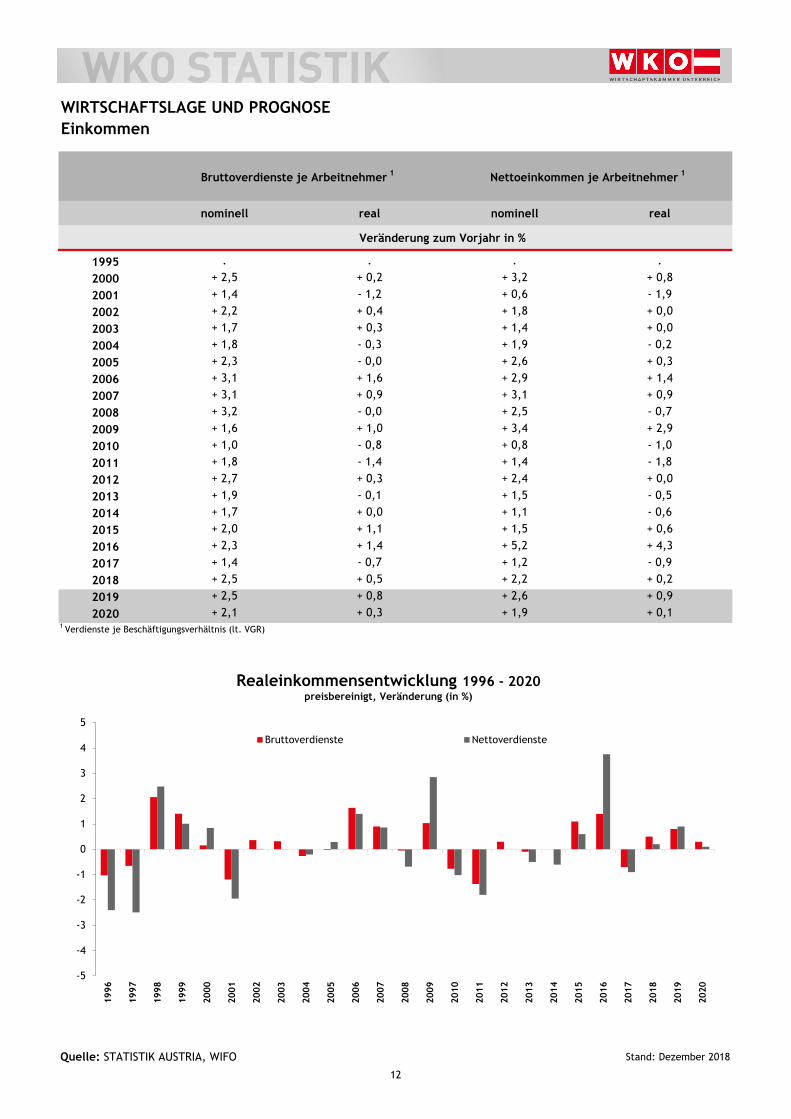
Bruttoverdienste je Arbeitnehmer 1 Nettoeinkommen je Arbeitnehmer 1
nominell real nominell real
Veränderung zum Vorjahr in %
1995 . . . .
2000 + 2,5 + 0,2 + 3,2 + 0,8
2001 + 1,4 - 1,2 + 0,6 - 1,9
2002 + 2,2 + 0,4 + 1,8 + 0,0
2003 + 1,7 + 0,3 + 1,4 + 0,0
2004 + 1,8 - 0,3 + 1,9 - 0,2
2005 + 2,3 - 0,0 + 2,6 + 0,3
2006 + 3,1 + 1,6 + 2,9 + 1,4
2007 + 3,1 + 0,9 + 3,1 + 0,9
2008 + 3,2 - 0,0 + 2,5 - 0,7
2009 + 1,6 + 1,0 + 3,4 + 2,9
2010 + 1,0 - 0,8 + 0,8 - 1,0
2011 + 1,8 - 1,4 + 1,4 - 1,8
2012 + 2,7 + 0,3 + 2,4 + 0,0
2013 + 1,9 - 0,1 + 1,5 - 0,5
2014 + 1,7 + 0,0 + 1,1 - 0,6
2015 + 2,0 + 1,1 + 1,5 + 0,6
2016 + 2,3 + 1,4 + 5,2 + 4,3
2017 + 1,4 - 0,7 + 1,2 - 0,9
2018 + 2,5 + 0,5 + 2,2 + 0,2
2019 + 2,5 + 0,8 + 2,6 + 0,9
2020 + 2,1 + 0,3 + 1,9 + 0,11 Verdienste je Beschäftigungsverhältnis (lt. VGR)
Quelle: STATISTIK AUSTRIA, WIFO Stand: Dezember 2018
WIRTSCHAFTSLAGE UND PROGNOSE Einkommen
-5
-4
-3
-2
-1
0
1
2
3
4
5
1996
1997
1998
1999
2000
2001
2002
2003
2004
2005
2006
2007
2008
2009
2010
2011
2012
2013
2014
2015
2016
2017
2018
2019
2020
Bruttoverdienste Nettoverdienste
Realeinkommensentwicklung 1996 - 2020preisbereinigt, Veränderung (in %)
12
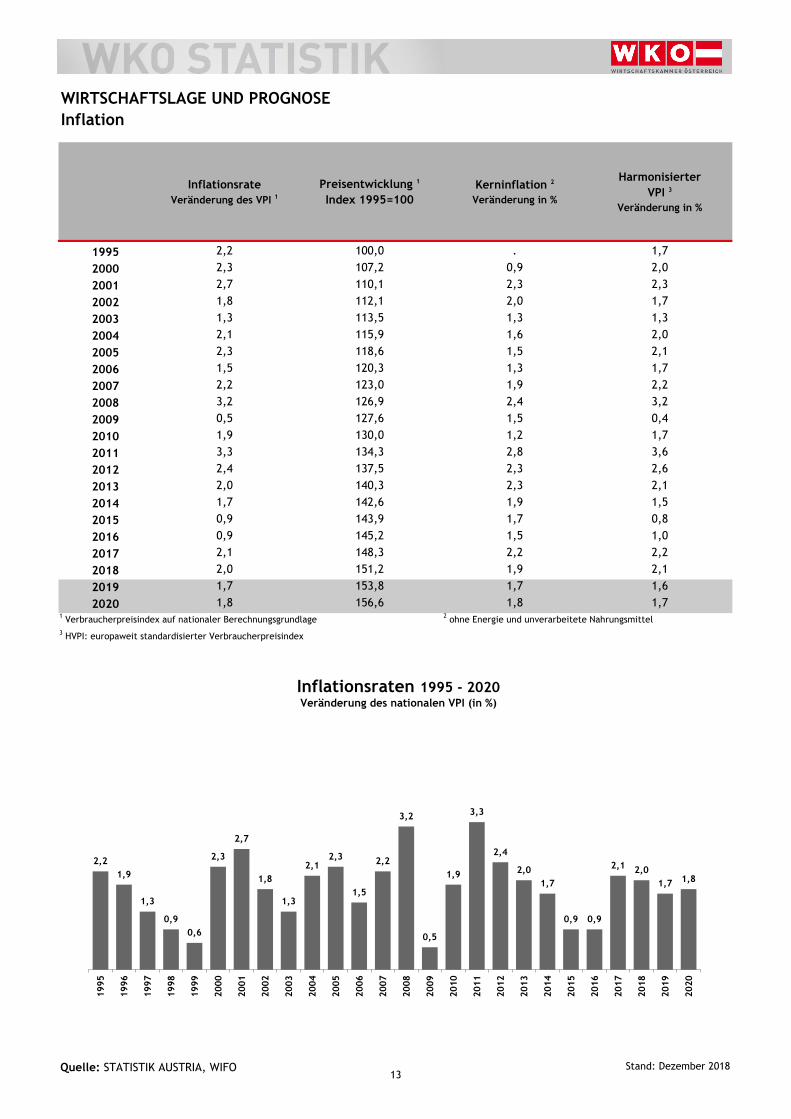
InflationsrateVeränderung des VPI 1
Preisentwicklung 1
Index 1995=100Kerninflation 2
Veränderung in %
Harmonisierter VPI 3
Veränderung in %
1995 2,2 100,0 . 1,7
2000 2,3 107,2 0,9 2,0
2001 2,7 110,1 2,3 2,3
2002 1,8 112,1 2,0 1,7
2003 1,3 113,5 1,3 1,3
2004 2,1 115,9 1,6 2,0
2005 2,3 118,6 1,5 2,1
2006 1,5 120,3 1,3 1,7
2007 2,2 123,0 1,9 2,2
2008 3,2 126,9 2,4 3,2
2009 0,5 127,6 1,5 0,4
2010 1,9 130,0 1,2 1,7
2011 3,3 134,3 2,8 3,6
2012 2,4 137,5 2,3 2,6
2013 2,0 140,3 2,3 2,1
2014 1,7 142,6 1,9 1,5
2015 0,9 143,9 1,7 0,8
2016 0,9 145,2 1,5 1,0
2017 2,1 148,3 2,2 2,2
2018 2,0 151,2 1,9 2,1
2019 1,7 153,8 1,7 1,6
2020 1,8 156,6 1,8 1,71 Verbraucherpreisindex auf nationaler Berechnungsgrundlage 2 ohne Energie und unverarbeitete Nahrungsmittel 3 HVPI: europaweit standardisierter Verbraucherpreisindex
Quelle: STATISTIK AUSTRIA, WIFO Stand: Dezember 2018
WIRTSCHAFTSLAGE UND PROGNOSE Inflation
2,21,9
1,3
0,90,6
2,3
2,7
1,8
1,3
2,12,3
1,5
2,2
3,2
0,5
1,9
3,3
2,4
2,01,7
0,9 0,9
2,1 2,01,7 1,8
1995
1996
1997
1998
1999
2000
2001
2002
2003
2004
2005
2006
2007
2008
2009
2010
2011
2012
2013
2014
2015
2016
2017
2018
2019
2020
Inflationsraten 1995 - 2020Veränderung des nationalen VPI (in %)
13