Embed Size (px)
Citation preview
�
���������� ��5�������������������������������������� �!��
City of Hollywood
ANALYSIS OF INVESTMENT PERFORMANCE
"#�������$�%�����#����&��!�September ��5�����John DeMairo Keith�Reynolds� ��������������� President & CEO Vice President �����������
�
�������,��#������������-.%�����./��������!��������,��#�������������!���������%����������-.�%�./�,��#����!���������� ���0����%��!���������1�������������������������������,��#��������������!�����%���������� �!������������������%��������� ���,����������������������������� ���!�����,�������,��#���������������,��#�����,����#���������0���������,��#������0����������!������������,����������,�����!�������������#��0����!���!���#�������������2�!������#�������������������#�!�,��!�'���3�#���!��*������ ������������!����������������������!�����!�����������#������������������������������!���������������������,��#���������!������!�4����� ���#����#��������������������0�#������%����������!��� ��������%������-.������./���������!���2��0��!�����������%���������������������!��������,����������,����,����������%��!������#��������!�������������������#�����������������������0���������5����� �������-0��������������������!��������%�/��,��������%������-���0��������������/�����������!���������������,��������������!���2��0��!��������%�������� ����������������0����� �������������,��#�����0���������������������������������#�����������,�������,��#�������������!�,��#����!�������������������!������!������������������,��#������,������ ���#������!�4����� ���#����#���������������!����� ���,������� ���#����$����!4����� ���#����#�����$��,���������,��#����������%������!�����������������������,,����������������������,�����,,���,�����������������������,�����������������������������!����#�����,����������!�������� ���#������!4����� ���#����#������
��
Ta b l e o f C o n t e n t s ANALYSIS OF INVESTMENT PERFORMANCE
�Section
&���������*��2������!����������������������������������������������������������������������������������������������������������������������������������������������������������������������
������&��!����������������������������������������������������������������������������������������������������������������������������������������������������������������������������������������� �
�� ���#����*������6��,��#��������������������������������������������������������������������������������������������������������������������������������������������������������(
�
���
��
1
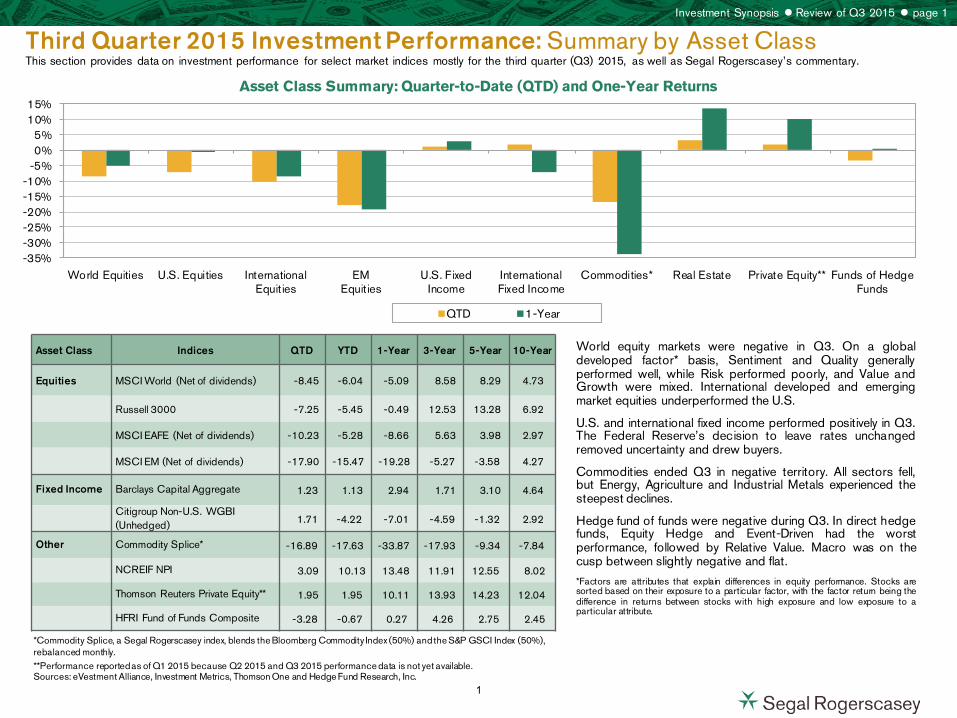
Third Quarter 2015 Investment Performance: Summary by Asset Class This section provides data on investment performance for select market indices mostly for the third quarter (Q3) 2015, as well as Segal Rogerscasey’s commentary.
World equity markets were negative in Q3. On a global developed factor* basis, Sentiment and Quality generally performed well, while Risk performed poorly, and Value and Growth were mixed. International developed and emerging market equities underperformed the U.S.
U.S. and international fixed income performed positively in Q3. The Federal Reserve’s decision to leave rates unchanged removed uncertainty and drew buyers.
Commodities ended Q3 in negative territory. All sectors fell, but Energy, Agriculture and Industrial Metals experienced the steepest declines.
Hedge fund of funds were negative during Q3. In direct hedge funds, Equity Hedge and Event-Driven had the worst performance, followed by Relative Value. Macro was on the cusp between slightly negative and flat.
*Factors are attributes that explain differences in equity performance. Stocks are sorted based on their exposure to a particular factor, with the factor return being the difference in returns between stocks with high exposure and low exposure to a particular attribute.
-35%-30%-25%-20%-15%-10%
-5%0%5%
10%15%
World Equities U.S. Equities InternationalEquities
EMEquities
U.S. FixedIncome
InternationalFixed Income
Commodities* Real Estate Private Equity** Funds of HedgeFunds
QTD 1-Year
Asset Class Summary: Quarter-to-Date (QTD) and One-Year Returns
Asset Class Indices QTD YTD 1-Year 3-Year 5-Year 10-Year
Equities MSCI World (Net of dividends) -8.45 -6.04 -5.09 8.58 8.29 4.73
Russell 3000 -7.25 -5.45 -0.49 12.53 13.28 6.92
MSCI EAFE (Net of dividends) -10.23 -5.28 -8.66 5.63 3.98 2.97
MSCI EM (Net of dividends) -17.90 -15.47 -19.28 -5.27 -3.58 4.27
Fixed Income Barclays Capital Aggregate 1.23 1.13 2.94 1.71 3.10 4.64
Citigroup Non-U.S. WGBI (Unhedged) 1.71 -4.22 -7.01 -4.59 -1.32 2.92
Other Commodity Splice* -16.89 -17.63 -33.87 -17.93 -9.34 -7.84
NCREIF NPI 3.09 10.13 13.48 11.91 12.55 8.02
Thomson Reuters Private Equity** 1.95 1.95 10.11 13.93 14.23 12.04
HFRI Fund of Funds Composite -3.28 -0.67 0.27 4.26 2.75 2.45
*Commodity Splice, a Segal Rogerscasey index, blends the Bloomberg Commodity Index (50%) and the S&P GSCI Index (50%), rebalanced monthly. **Performance reported as of Q1 2015 because Q2 2015 and Q3 2015 performance data is not yet available. Sources: eVestment Alliance, Investment Metrics, Thomson One and Hedge Fund Research, Inc.
Investment Synopsis Review of Q3 2015 page 1
1
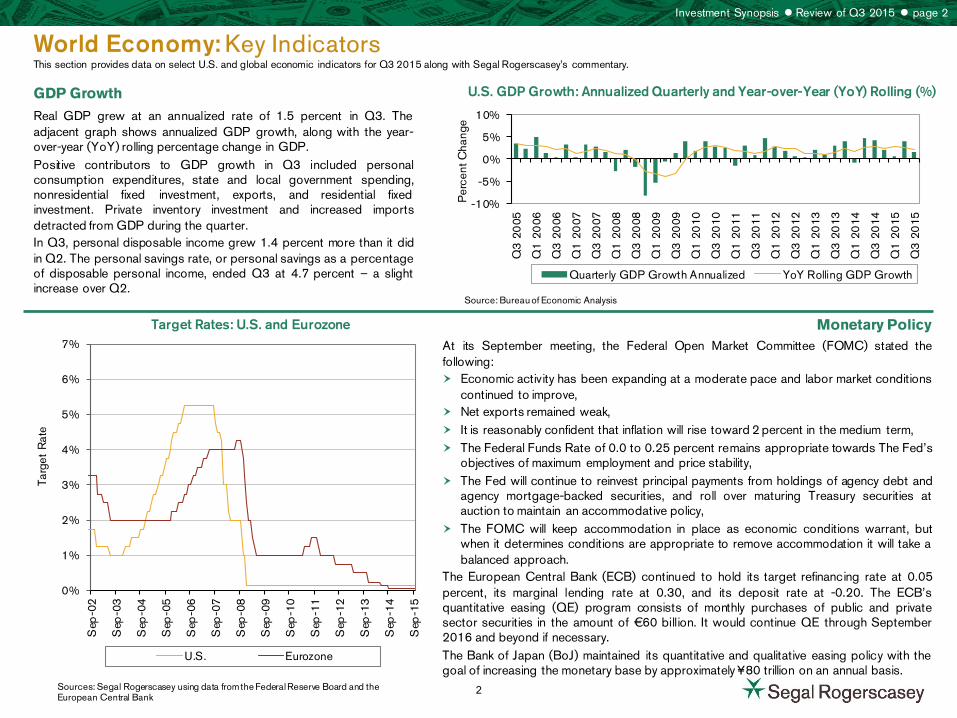
World Economy: Key Indicators This section provides data on select U.S. and global economic indicators for Q3 2015 along with Segal Rogerscasey’s commentary.
U.S. GDP Growth: Annualized Quarterly and Year-over-Year (YoY) Rolling (%)
Target Rates: U.S. and Eurozone
GDP Growth
Real GDP grew at an annualized rate of 1.5 percent in Q3. The adjacent graph shows annualized GDP growth, along with the year-over-year (YoY) rolling percentage change in GDP. Positive contributors to GDP growth in Q3 included personal consumption expenditures, state and local government spending, nonresidential fixed investment, exports, and residential fixed investment. Private inventory investment and increased imports detracted from GDP during the quarter. In Q3, personal disposable income grew 1.4 percent more than it did in Q2. The personal savings rate, or personal savings as a percentage of disposable personal income, ended Q3 at 4.7 percent – a slight increase over Q2.
0%
1%
2%
3%
4%
5%
6%
7%
Sep
-02
Sep
-03
Sep
-04
Sep
-05
Sep
-06
Sep
-07
Sep
-08
Sep
-09
Sep
-10
Sep
-11
Sep
-12
Sep
-13
Sep
-14
Sep
-15
Targ
et R
ate
U.S. Eurozone
Monetary Policy At its September meeting, the Federal Open Market Committee (FOMC) stated the following: Economic activity has been expanding at a moderate pace and labor market conditions
continued to improve, Net exports remained weak, It is reasonably confident that inflation will rise toward 2 percent in the medium term, The Federal Funds Rate of 0.0 to 0.25 percent remains appropriate towards The Fed’s
objectives of maximum employment and price stability, The Fed will continue to reinvest principal payments from holdings of agency debt and
agency mortgage-backed securities, and roll over maturing Treasury securities at auction to maintain an accommodative policy,
The FOMC will keep accommodation in place as economic conditions warrant, but when it determines conditions are appropriate to remove accommodation it will take a balanced approach.
The European Central Bank (ECB) continued to hold its target refinancing rate at 0.05 percent, its marginal lending rate at 0.30, and its deposit rate at -0.20. The ECB’s quantitative easing (QE) program consists of monthly purchases of public and private sector securities in the amount of €60 billion. It would continue QE through September 2016 and beyond if necessary. The Bank of Japan (BoJ) maintained its quantitative and qualitative easing policy with the goal of increasing the monetary base by approximately ¥80 trillion on an annual basis.
Sources: Segal Rogerscasey using data from the Federal Reserve Board and the European Central Bank
Investment Synopsis Review of Q3 2015 page 2
-10%
-5%
0%
5%
10%
Q3
20
05
Q1
20
06
Q3
20
06
Q1
20
07
Q3
20
07
Q1
20
08
Q3
20
08
Q1
20
09
Q3
20
09
Q1
20
10
Q3
20
10
Q1
20
11
Q3
20
11
Q1
20
12
Q3
20
12
Q1
20
13
Q3
20
13
Q1
20
14
Q3
20
14
Q1
20
15
Q3
20
15
Per
cent
Cha
nge
Quarterly GDP Growth Annualized YoY Rolling GDP Growth
Source: Bureau of Economic Analysis
2
World Economy: Key Indicators This section provides data on select U.S. and global economic indicators for Q3 2015 along with Segal Rogerscasey’s commentary.
Headline CPI and Core CPI: Percentage Change YoY
10-Year Break-Even Inflation Rate
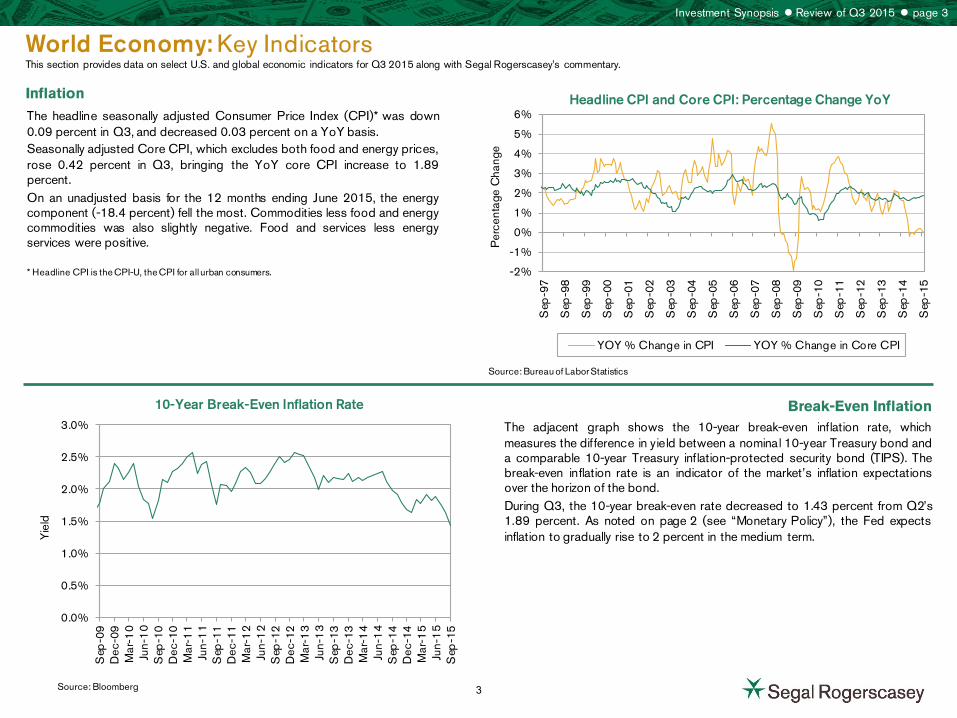
Inflation
Break-Even Inflation The adjacent graph shows the 10-year break-even inflation rate, which measures the difference in yield between a nominal 10-year Treasury bond and a comparable 10-year Treasury inflation-protected security bond (TIPS). The break-even inflation rate is an indicator of the market’s inflation expectations over the horizon of the bond. During Q3, the 10-year break-even rate decreased to 1.43 percent from Q2’s 1.89 percent. As noted on page 2 (see “Monetary Policy”), the Fed expects inflation to gradually rise to 2 percent in the medium term.
Source: Bureau of Labor Statistics
Source: Bloomberg
Investment Synopsis Review of Q3 2015 page 3
0.0%
0.5%
1.0%
1.5%
2.0%
2.5%
3.0%
Sep
-09
Dec
-09
Mar
-10
Jun-
10
Sep
-10
Dec
-10
Mar
-11
Jun-
11
Sep
-11
Dec
-11
Mar
-12
Jun-
12
Sep
-12
Dec
-12
Mar
-13
Jun-
13
Sep
-13
Dec
-13
Mar
-14
Jun-
14
Sep
-14
Dec
-14
Mar
-15
Jun-
15
Sep
-15
Yie
ld
The headline seasonally adjusted Consumer Price Index (CPI)* was down 0.09 percent in Q3, and decreased 0.03 percent on a YoY basis. Seasonally adjusted Core CPI, which excludes both food and energy prices, rose 0.42 percent in Q3, bringing the YoY core CPI increase to 1.89 percent. On an unadjusted basis for the 12 months ending June 2015, the energy component (-18.4 percent) fell the most. Commodities less food and energy commodities was also slightly negative. Food and services less energy services were positive. * Headline CPI is the CPI-U, the CPI for all urban consumers. -2%
-1%
0%
1%
2%
3%
4%
5%
6%
Sep
-97
Sep
-98
Sep
-99
Sep
-00
Sep
-01
Sep
-02
Sep
-03
Sep
-04
Sep
-05
Sep
-06
Sep
-07
Sep
-08
Sep
-09
Sep
-10
Sep
-11
Sep
-12
Sep
-13
Sep
-14
Sep
-15
Per
cent
age
Cha
nge
YOY % Change in CPI YOY % Change in Core CPI
3
World Economy: Key Indicators This section provides data on select U.S. and global economic indicators for Q3 2015 along with Segal Rogerscasey’s commentary.
Unemployment and Nonfarm Payrolls
U.S. Consumer Sentiment
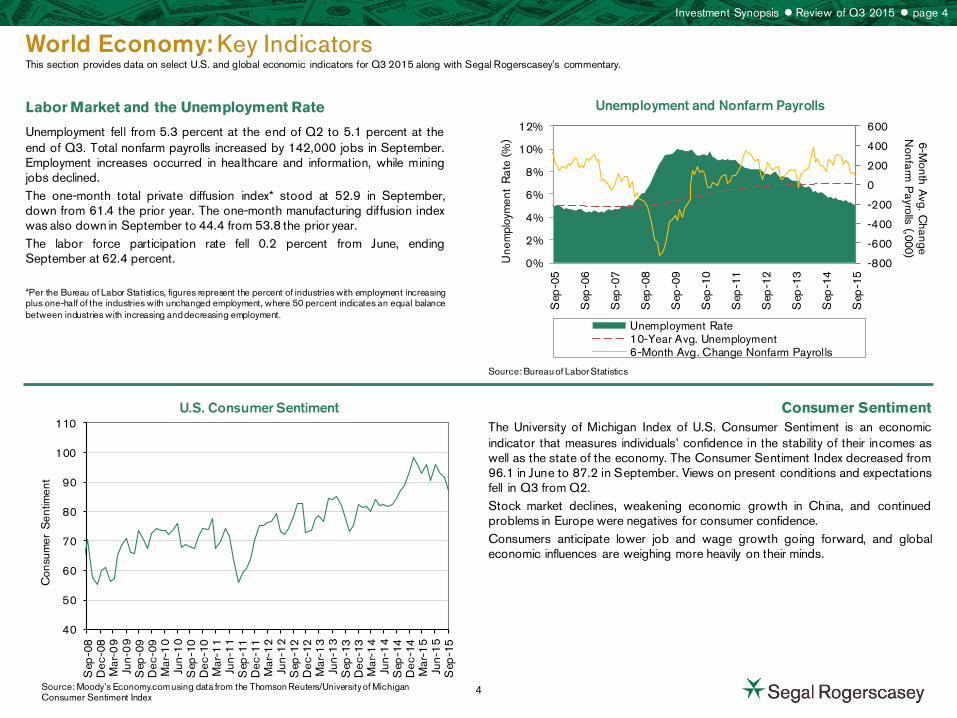
Labor Market and the Unemployment Rate
Unemployment fell from 5.3 percent at the end of Q2 to 5.1 percent at the end of Q3. Total nonfarm payrolls increased by 142,000 jobs in September. Employment increases occurred in healthcare and information, while mining jobs declined. The one-month total private diffusion index* stood at 52.9 in September, down from 61.4 the prior year. The one-month manufacturing diffusion index was also down in September to 44.4 from 53.8 the prior year. The labor force participation rate fell 0.2 percent from June, ending September at 62.4 percent. *Per the Bureau of Labor Statistics, figures represent the percent of industries with employment increasing plus one-half of the industries with unchanged employment, where 50 percent indicates an equal balance between industries with increasing and decreasing employment.
Consumer Sentiment The University of Michigan Index of U.S. Consumer Sentiment is an economic indicator that measures individuals’ confidence in the stability of their incomes as well as the state of the economy. The Consumer Sentiment Index decreased from 96.1 in June to 87.2 in September. Views on present conditions and expectations fell in Q3 from Q2. Stock market declines, weakening economic growth in China, and continued problems in Europe were negatives for consumer confidence. Consumers anticipate lower job and wage growth going forward, and global economic influences are weighing more heavily on their minds.
Source: Bureau of Labor Statistics
Source: Moody’s Economy.com using data from the Thomson Reuters/University of Michigan Consumer Sentiment Index
Investment Synopsis Review of Q3 2015 page 4
-800
-600
-400
-200
0
200
400
600
0%
2%
4%
6%
8%
10%
12%
Sep
-05
Sep
-06
Sep
-07
Sep
-08
Sep
-09
Sep
-10
Sep
-11
Sep
-12
Sep
-13
Sep
-14
Sep
-15
6-Month A
vg. Change
Nonfarm
Payrolls (,000) U
nem
ploy
men
t R
ate
(%)
Unemployment Rate10-Year Avg. Unemployment6-Month Avg. Change Nonfarm Payrolls
40
50
60
70
80
90
100
110
Sep
-08
Dec
-08
Mar
-09
Jun-
09
Sep
-09
Dec
-09
Mar
-10
Jun-
10
Sep
-10
Dec
-10
Mar
-11
Jun-
11
Sep
-11
Dec
-11
Mar
-12
Jun-
12
Sep
-12
Dec
-12
Mar
-13
Jun-
13
Sep
-13
Dec
-13
Mar
-14
Jun-
14
Sep
-14
Dec
-14
Mar
-15
Jun-
15
Sep
-15
Con
sum
er S
entim
ent
4
Investor Sentiment: Mutual Fund Flows This page presents mutual fund flows across equity and fixed-income funds. Flow estimates are derived from data collected covering more than 95 percent of industry assets and are adjusted to represent industry totals.
Monthly Mutual Fund Net Flows ($ Millions) Q3 2015
Mutual Fund Flows vs. ETFs ($ Millions): New Net Cash Flows
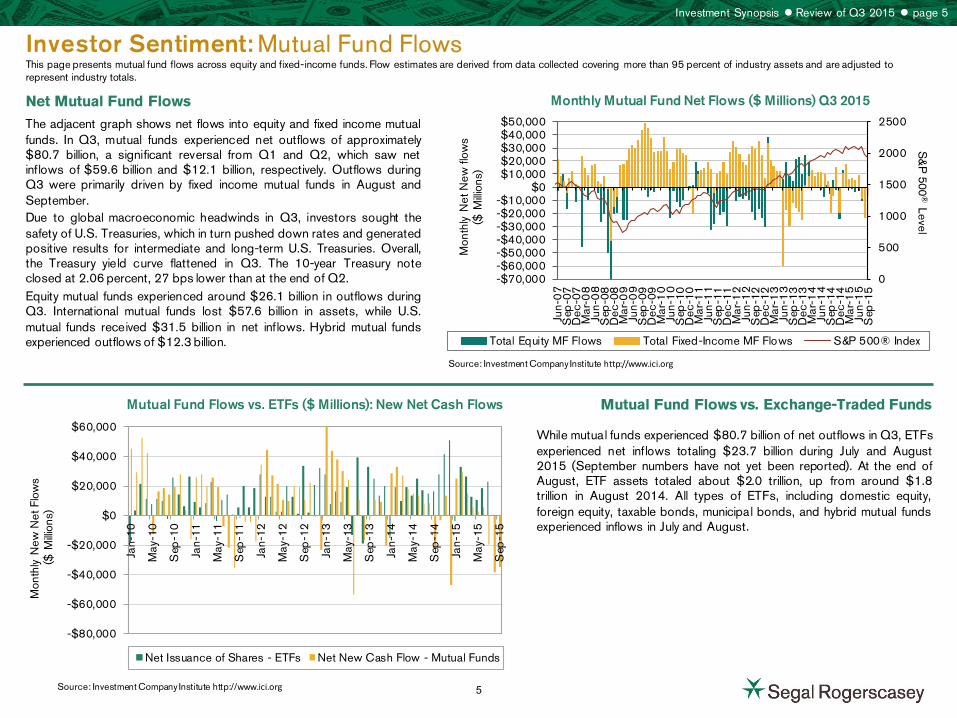
Net Mutual Fund Flows
The adjacent graph shows net flows into equity and fixed income mutual funds. In Q3, mutual funds experienced net outflows of approximately $80.7 billion, a significant reversal from Q1 and Q2, which saw net inflows of $59.6 billion and $12.1 billion, respectively. Outflows during Q3 were primarily driven by fixed income mutual funds in August and September. Due to global macroeconomic headwinds in Q3, investors sought the safety of U.S. Treasuries, which in turn pushed down rates and generated positive results for intermediate and long-term U.S. Treasuries. Overall, the Treasury yield curve flattened in Q3. The 10-year Treasury note closed at 2.06 percent, 27 bps lower than at the end of Q2. Equity mutual funds experienced around $26.1 billion in outflows during Q3. International mutual funds lost $57.6 billion in assets, while U.S. mutual funds received $31.5 billion in net inflows. Hybrid mutual funds experienced outflows of $12.3 billion.
Mutual Fund Flows vs. Exchange-Traded Funds
While mutual funds experienced $80.7 billion of net outflows in Q3, ETFs experienced net inflows totaling $23.7 billion during July and August 2015 (September numbers have not yet been reported). At the end of August, ETF assets totaled about $2.0 trillion, up from around $1.8 trillion in August 2014. All types of ETFs, including domestic equity, foreign equity, taxable bonds, municipal bonds, and hybrid mutual funds experienced inflows in July and August.
Source: Investment Company Institute http://www.ici.org
Source: Investment Company Institute http://www.ici.org
Investment Synopsis Review of Q3 2015 page 5
0
500
1000
1500
2000
2500
-$70,000-$60,000-$50,000-$40,000-$30,000-$20,000-$10,000
$0$10,000$20,000$30,000$40,000$50,000
Jun-
07
Sep
-07
Dec
-07
Mar
-08
Jun-
08
Sep
-08
Dec
-08
Mar
-09
Jun-
09
Sep
-09
Dec
-09
Mar
-10
Jun-
10
Sep
-10
Dec
-10
Mar
-11
Jun-
11
Sep
-11
Dec
-11
Mar
-12
Jun-
12
Sep
-12
Dec
-12
Mar
-13
Jun-
13
Sep
-13
Dec
-13
Mar
-14
Jun-
14
Sep
-14
Dec
-14
Mar
-15
Jun-
15
Sep
-15
S&
P 500
® Level
Mon
thly
Net
New
flow
s
($ M
illion
s)
Total Equity MF Flows Total Fixed-Income MF Flows S&P 500® Index
-$80,000
-$60,000
-$40,000
-$20,000
$0
$20,000
$40,000
$60,000
Jan-
10
May
-10
Sep
-10
Jan-
11
May
-11
Sep
-11
Jan-
12
May
-12
Sep
-12
Jan-
13
May
-13
Sep
-13
Jan-
14
May
-14
Sep
-14
Jan-
15
May
-15
Sep
-15
Mon
thly
New
Net
Flo
ws
($ M
illion
s)
Net Issuance of Shares - ETFs Net New Cash Flow - Mutual Funds
5
Investment Performance: U.S. Equities This section presents data and Segal Rogerscasey’s commentary on U.S. equity index returns and sector performance for Q3 2015.
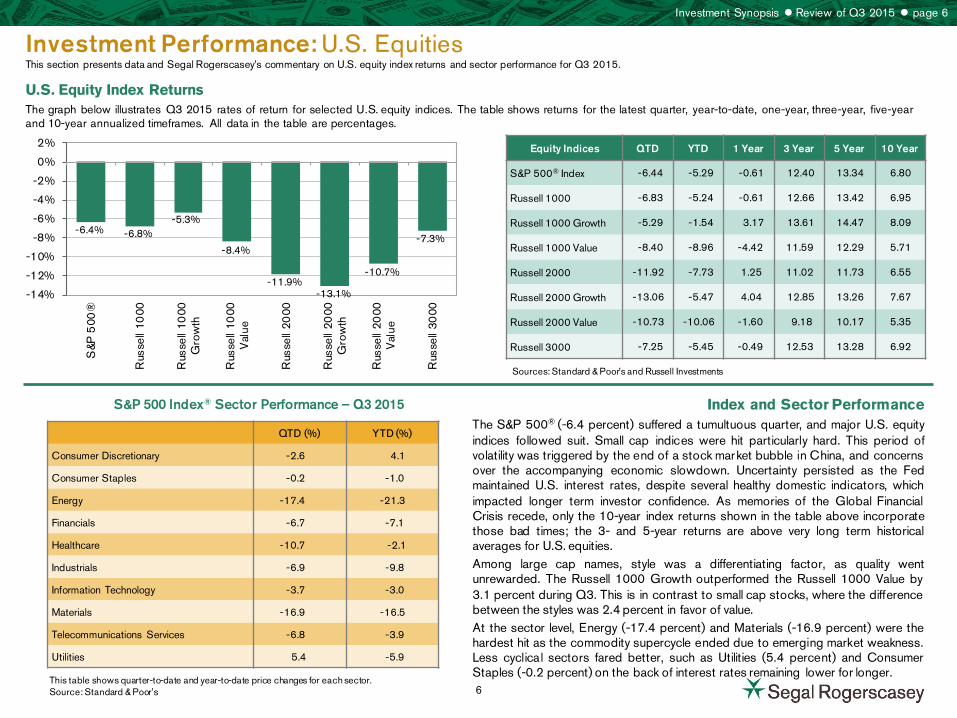
The graph below illustrates Q3 2015 rates of return for selected U.S. equity indices. The table shows returns for the latest quarter, year-to-date, one-year, three-year, five-year and 10-year annualized timeframes. All data in the table are percentages.
S&P 500 Index® Sector Performance – Q3 2015
U.S. Equity Index Returns
Index and Sector Performance The S&P 500® (-6.4 percent) suffered a tumultuous quarter, and major U.S. equity indices followed suit. Small cap indices were hit particularly hard. This period of volatility was triggered by the end of a stock market bubble in China, and concerns over the accompanying economic slowdown. Uncertainty persisted as the Fed maintained U.S. interest rates, despite several healthy domestic indicators, which impacted longer term investor confidence. As memories of the Global Financial Crisis recede, only the 10-year index returns shown in the table above incorporate those bad times; the 3- and 5-year returns are above very long term historical averages for U.S. equities. Among large cap names, style was a differentiating factor, as quality went unrewarded. The Russell 1000 Growth outperformed the Russell 1000 Value by 3.1 percent during Q3. This is in contrast to small cap stocks, where the difference between the styles was 2.4 percent in favor of value. At the sector level, Energy (-17.4 percent) and Materials (-16.9 percent) were the hardest hit as the commodity supercycle ended due to emerging market weakness. Less cyclical sectors fared better, such as Utilities (5.4 percent) and Consumer Staples (-0.2 percent) on the back of interest rates remaining lower for longer.
Sources: Standard & Poor’s and Russell Investments
This table shows quarter-to-date and year-to-date price changes for each sector. Source: Standard & Poor's
Investment Synopsis Review of Q3 2015 page 6
Equity Indices QTD YTD 1 Year 3 Year 5 Year 10 Year
S&P 500® Index -6.44 -5.29 -0.61 12.40 13.34 6.80
Russell 1000 -6.83 -5.24 -0.61 12.66 13.42 6.95
Russell 1000 Growth -5.29 -1.54 3.17 13.61 14.47 8.09
Russell 1000 Value -8.40 -8.96 -4.42 11.59 12.29 5.71
Russell 2000 -11.92 -7.73 1.25 11.02 11.73 6.55
Russell 2000 Growth -13.06 -5.47 4.04 12.85 13.26 7.67
Russell 2000 Value -10.73 -10.06 -1.60 9.18 10.17 5.35
Russell 3000 -7.25 -5.45 -0.49 12.53 13.28 6.92
QTD (%) YTD (%)
Consumer Discretionary -2.6 4.1
Consumer Staples -0.2 -1.0
Energy -17.4 -21.3
Financials -6.7 -7.1
Healthcare -10.7 -2.1
Industrials -6.9 -9.8
Information Technology -3.7 -3.0
Materials -16.9 -16.5
Telecommunications Services -6.8 -3.9
Utilities 5.4 -5.9
-6.4% -6.8% -5.3%
-8.4%
-11.9% -13.1%
-10.7%
-7.3%
-14%
-12%
-10%
-8%
-6%
-4%
-2%
0%
2%
S&P
500
®
Rus
sell
1000
Rus
sell
1000
Gro
wth
Rus
sell
1000
Val
ue
Rus
sell
2000
Rus
sell
2000
Gro
wth
Rus
sell
2000
Val
ue
Rus
sell
3000
6
Investment Performance: U.S. Equities This section presents Segal Rogerscasey’s commentary on U.S. equity earnings and growth- vs. value-stock performance for Q3 2015.
Growth Stocks vs. Value Stocks (Rolling 3-Year)
U.S. Equity Market Earnings and Volatility
Growth vs. Value
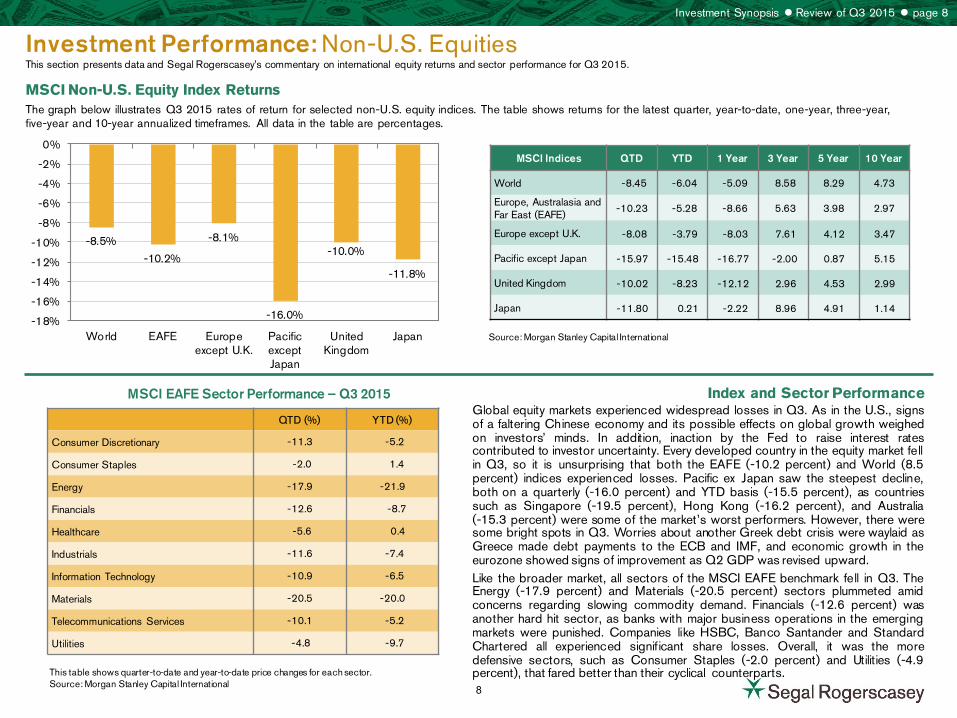
The adjacent graph depicts the growth versus value differential for both large- and small-cap stocks over rolling three-year intervals. The large-cap calculation uses the Russell 1000 Growth (R1000G) versus the Russell 1000 Value (R1000V) and the small-cap differential is composed of the Russell 2000 Growth (R2000G) versus the Russell 2000 Value (R2000V). An interesting dynamic in recent years has been the fact that growth and value have largely been irrelevant in driving large cap equity returns, as the spread between the growth and value benchmarks has been quite narrow. Markets have shown a preference for growth stocks since the end of 2014, this bias been more exaggerated in small cap stocks than large cap stocks.
Source: Standard & Poor’s
Source: Russell Investments
Investment Synopsis Review of Q3 2015 page 7
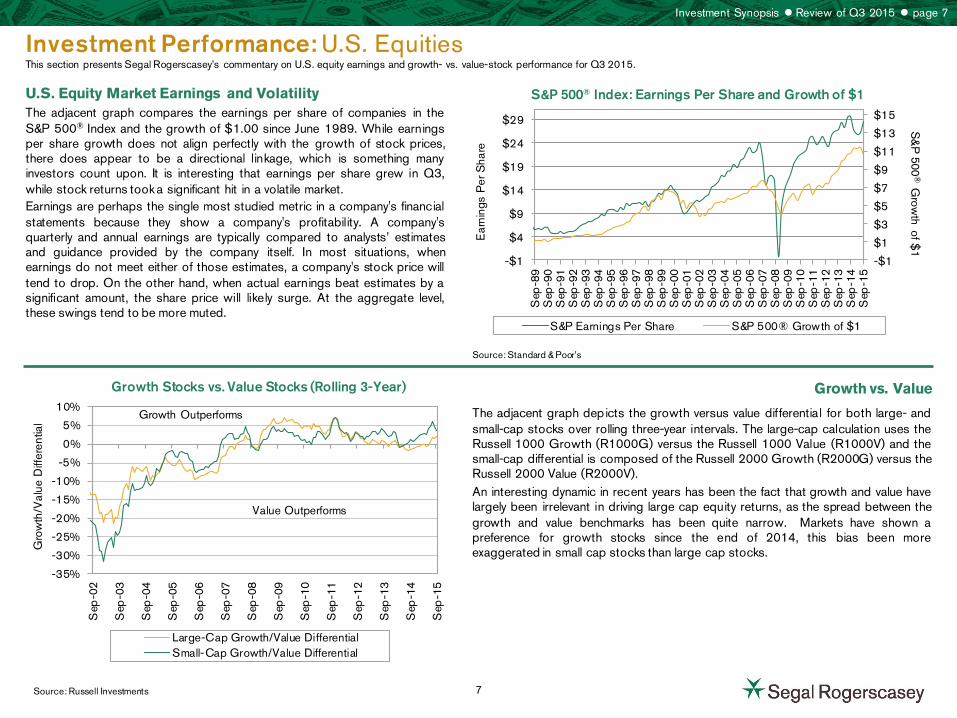
The adjacent graph compares the earnings per share of companies in the S&P 500® Index and the growth of $1.00 since June 1989. While earnings per share growth does not align perfectly with the growth of stock prices, there does appear to be a directional linkage, which is something many investors count upon. It is interesting that earnings per share grew in Q3, while stock returns took a significant hit in a volatile market. Earnings are perhaps the single most studied metric in a company's financial statements because they show a company's profitability. A company's quarterly and annual earnings are typically compared to analysts’ estimates and guidance provided by the company itself. In most situations, when earnings do not meet either of those estimates, a company's stock price will tend to drop. On the other hand, when actual earnings beat estimates by a significant amount, the share price will likely surge. At the aggregate level, these swings tend to be more muted.
S&P 500® Index: Earnings Per Share and Growth of $1
-$1
$1
$3
$5
$7
$9
$11
$13
$15
-$1
$4
$9
$14
$19
$24
$29
Sep
-89
Sep
-90
Sep
-91
Sep
-92
Sep
-93
Sep
-94
Sep
-95
Sep
-96
Sep
-97
Sep
-98
Sep
-99
Sep
-00
Sep
-01
Sep
-02
Sep
-03
Sep
-04
Sep
-05
Sep
-06
Sep
-07
Sep
-08
Sep
-09
Sep
-10
Sep
-11
Sep
-12
Sep
-13
Sep
-14
Sep
-15
S&
P 500
® G
rowth of $
1
Ear
ning
s P
er S
hare
S&P Earnings Per Share S&P 500® Growth of $1
-35%
-30%
-25%
-20%
-15%
-10%
-5%
0%
5%
10%
Sep
-02
Sep
-03
Sep
-04
Sep
-05
Sep
-06
Sep
-07
Sep
-08
Sep
-09
Sep
-10
Sep
-11
Sep
-12
Sep
-13
Sep
-14
Sep
-15
Gro
wth
/Val
ue D
iffer
entia
l
Large-Cap Growth/Value DifferentialSmall-Cap Growth/Value Differential
Growth Outperforms
Value Outperforms
7
Investment Performance: Non-U.S. Equities This section presents data and Segal Rogerscasey’s commentary on international equity returns and sector performance for Q3 2015.
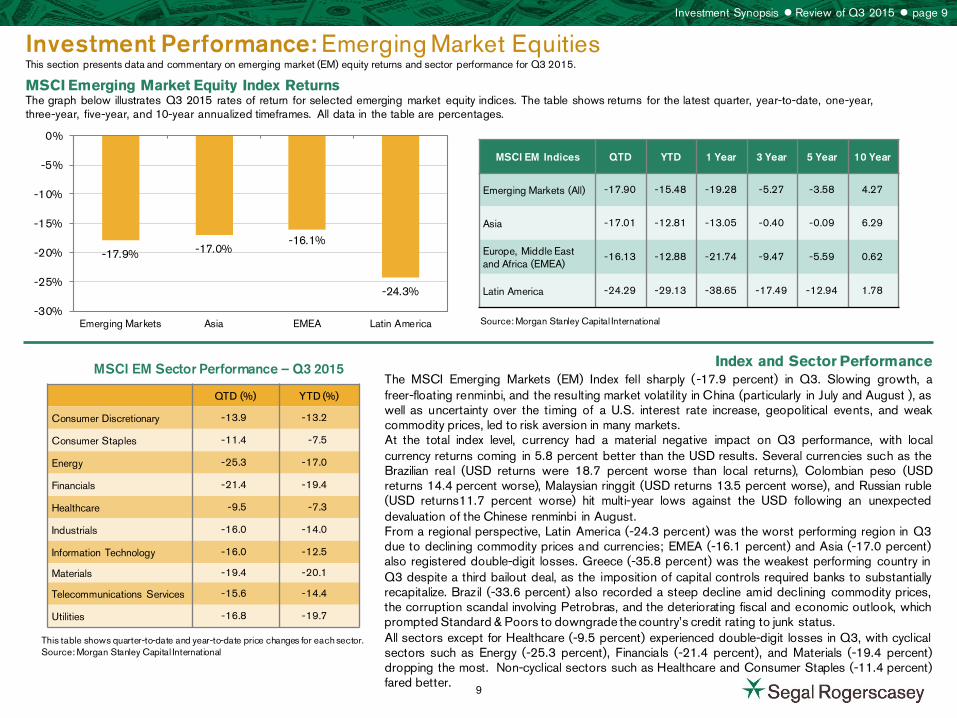
The graph below illustrates Q3 2015 rates of return for selected non-U.S. equity indices. The table shows returns for the latest quarter, year-to-date, one-year, three-year, five-year and 10-year annualized timeframes. All data in the table are percentages.
MSCI EAFE Sector Performance – Q3 2015
MSCI Non-U.S. Equity Index Returns
Index and Sector Performance
Source: Morgan Stanley Capital International
This table shows quarter-to-date and year-to-date price changes for each sector. Source: Morgan Stanley Capital International
Investment Synopsis Review of Q3 2015 page 8
MSCI Indices QTD YTD 1 Year 3 Year 5 Year 10 Year
World -8.45 -6.04 -5.09 8.58 8.29 4.73
Europe, Australasia and Far East (EAFE)
-10.23 -5.28 -8.66 5.63 3.98 2.97
Europe except U.K. -8.08 -3.79 -8.03 7.61 4.12 3.47
Pacific except Japan -15.97 -15.48 -16.77 -2.00 0.87 5.15
United Kingdom -10.02 -8.23 -12.12 2.96 4.53 2.99
Japan -11.80 0.21 -2.22 8.96 4.91 1.14
QTD (%) YTD (%)
Consumer Discretionary -11.3 -5.2
Consumer Staples -2.0 1.4
Energy -17.9 -21.9
Financials -12.6 -8.7
Healthcare -5.6 0.4
Industrials -11.6 -7.4
Information Technology -10.9 -6.5
Materials -20.5 -20.0
Telecommunications Services -10.1 -5.2
Utilities -4.8 -9.7
-8.5%
-10.2%
-8.1%
-16.0%
-10.0%
-11.8%
-18%
-16%
-14%
-12%
-10%
-8%
-6%
-4%
-2%
0%
World EAFE Europeexcept U.K.
PacificexceptJapan
UnitedKingdom
Japan
Global equity markets experienced widespread losses in Q3. As in the U.S., signs of a faltering Chinese economy and its possible effects on global growth weighed on investors’ minds. In addition, inaction by the Fed to raise interest rates contributed to investor uncertainty. Every developed country in the equity market fell in Q3, so it is unsurprising that both the EAFE (-10.2 percent) and World (8.5 percent) indices experienced losses. Pacific ex Japan saw the steepest decline, both on a quarterly (-16.0 percent) and YTD basis (-15.5 percent), as countries such as Singapore (-19.5 percent), Hong Kong (-16.2 percent), and Australia (-15.3 percent) were some of the market’s worst performers. However, there were some bright spots in Q3. Worries about another Greek debt crisis were waylaid as Greece made debt payments to the ECB and IMF, and economic growth in the eurozone showed signs of improvement as Q2 GDP was revised upward. Like the broader market, all sectors of the MSCI EAFE benchmark fell in Q3. The Energy (-17.9 percent) and Materials (-20.5 percent) sectors plummeted amid concerns regarding slowing commodity demand. Financials (-12.6 percent) was another hard hit sector, as banks with major business operations in the emerging markets were punished. Companies like HSBC, Banco Santander and Standard Chartered all experienced significant share losses. Overall, it was the more defensive sectors, such as Consumer Staples (-2.0 percent) and Utilities (-4.9 percent), that fared better than their cyclical counterparts. 8
Investment Performance: Emerging Market Equities This section presents data and commentary on emerging market (EM) equity returns and sector performance for Q3 2015.
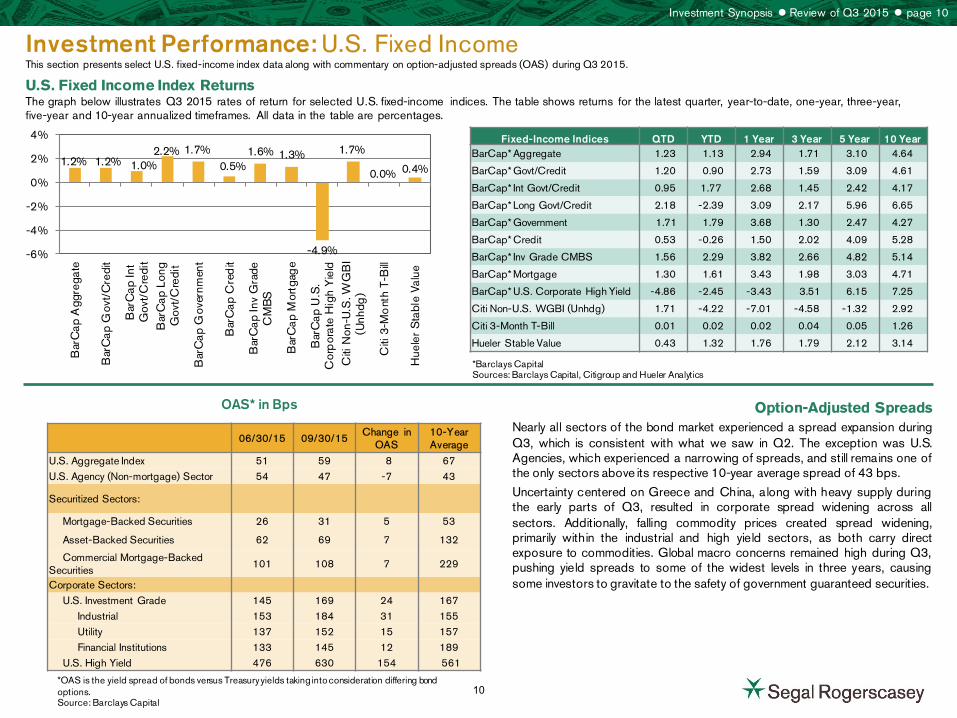
The graph below illustrates Q3 2015 rates of return for selected emerging market equity indices. The table shows returns for the latest quarter, year-to-date, one-year, three-year, five-year, and 10-year annualized timeframes. All data in the table are percentages.
MSCI EM Sector Performance – Q3 2015
MSCI Emerging Market Equity Index Returns
Index and Sector Performance The MSCI Emerging Markets (EM) Index fell sharply (-17.9 percent) in Q3. Slowing growth, a freer-floating renminbi, and the resulting market volatility in China (particularly in July and August ), as well as uncertainty over the timing of a U.S. interest rate increase, geopolitical events, and weak commodity prices, led to risk aversion in many markets. At the total index level, currency had a material negative impact on Q3 performance, with local currency returns coming in 5.8 percent better than the USD results. Several currencies such as the Brazilian real (USD returns were 18.7 percent worse than local returns), Colombian peso (USD returns 14.4 percent worse), Malaysian ringgit (USD returns 13.5 percent worse), and Russian ruble (USD returns11.7 percent worse) hit multi-year lows against the USD following an unexpected devaluation of the Chinese renminbi in August. From a regional perspective, Latin America (-24.3 percent) was the worst performing region in Q3 due to declining commodity prices and currencies; EMEA (-16.1 percent) and Asia (-17.0 percent) also registered double-digit losses. Greece (-35.8 percent) was the weakest performing country in Q3 despite a third bailout deal, as the imposition of capital controls required banks to substantially recapitalize. Brazil (-33.6 percent) also recorded a steep decline amid declining commodity prices, the corruption scandal involving Petrobras, and the deteriorating fiscal and economic outlook, which prompted Standard & Poors to downgrade the country’s credit rating to junk status. All sectors except for Healthcare (-9.5 percent) experienced double-digit losses in Q3, with cyclical sectors such as Energy (-25.3 percent), Financials (-21.4 percent), and Materials (-19.4 percent) dropping the most. Non-cyclical sectors such as Healthcare and Consumer Staples (-11.4 percent) fared better.
Source: Morgan Stanley Capital International
This table shows quarter-to-date and year-to-date price changes for each sector. Source: Morgan Stanley Capital International
Investment Synopsis Review of Q3 2015 page 9
MSCI EM Indices QTD YTD 1 Year 3 Year 5 Year 10 Year
Emerging Markets (All) -17.90 -15.48 -19.28 -5.27 -3.58 4.27
Asia -17.01 -12.81 -13.05 -0.40 -0.09 6.29
Europe, Middle East and Africa (EMEA)
-16.13 -12.88 -21.74 -9.47 -5.59 0.62
Latin America -24.29 -29.13 -38.65 -17.49 -12.94 1.78
QTD (%) YTD (%)
Consumer Discretionary -13.9 -13.2
Consumer Staples -11.4 -7.5
Energy -25.3 -17.0
Financials -21.4 -19.4
Healthcare -9.5 -7.3
Industrials -16.0 -14.0
Information Technology -16.0 -12.5
Materials -19.4 -20.1
Telecommunications Services -15.6 -14.4
Utilities -16.8 -19.7
-17.9% -17.0% -16.1%
-24.3%
-30%
-25%
-20%
-15%
-10%
-5%
0%
Emerging Markets Asia EMEA Latin America
9
Investment Performance: U.S. Fixed Income This section presents select U.S. fixed-income index data along with commentary on option-adjusted spreads (OAS) during Q3 2015.
The graph below illustrates Q3 2015 rates of return for selected U.S. fixed-income indices. The table shows returns for the latest quarter, year-to-date, one-year, three-year, five-year and 10-year annualized timeframes. All data in the table are percentages.
OAS* in Bps
U.S. Fixed Income Index Returns
Option-Adjusted Spreads Nearly all sectors of the bond market experienced a spread expansion during Q3, which is consistent with what we saw in Q2. The exception was U.S. Agencies, which experienced a narrowing of spreads, and still remains one of the only sectors above its respective 10-year average spread of 43 bps.
Uncertainty centered on Greece and China, along with heavy supply during the early parts of Q3, resulted in corporate spread widening across all sectors. Additionally, falling commodity prices created spread widening, primarily within the industrial and high yield sectors, as both carry direct exposure to commodities. Global macro concerns remained high during Q3, pushing yield spreads to some of the widest levels in three years, causing some investors to gravitate to the safety of government guaranteed securities.
*Barclays Capital Sources: Barclays Capital, Citigroup and Hueler Analytics
*OAS is the yield spread of bonds versus Treasury yields taking into consideration differing bond options. Source: Barclays Capital
Investment Synopsis Review of Q3 2015 page 10
1.2% 1.2% 1.0% 2.2% 1.7%
0.5% 1.6% 1.3%
-4.9%
1.7%
0.0% 0.4%
-6%
-4%
-2%
0%
2%
4%
Bar
Cap
Agg
rega
te
Bar
Cap
Gov
t/C
redi
t
Bar
Cap
Int
Gov
t/C
redi
tB
arC
ap L
ong
Gov
t/C
redi
t
Bar
Cap
Gov
ernm
ent
Bar
Cap
Cre
dit
Bar
Cap
Inv
Gra
deC
MB
S
Bar
Cap
Mor
tgag
e
Bar
Cap
U.S
.C
orp
orat
e H
igh
Yie
ldC
iti N
on-U
.S. W
GB
I(U
nhdg
)
Citi
3-M
ont
h T-
Bill
Hue
ler
Sta
ble
Valu
e
Fixed-Income Indices QTD YTD 1 Year 3 Year 5 Year 10 Year BarCap* Aggregate 1.23 1.13 2.94 1.71 3.10 4.64
BarCap* Govt/Credit 1.20 0.90 2.73 1.59 3.09 4.61
BarCap* Int Govt/Credit 0.95 1.77 2.68 1.45 2.42 4.17
BarCap* Long Govt/Credit 2.18 -2.39 3.09 2.17 5.96 6.65
BarCap* Government 1.71 1.79 3.68 1.30 2.47 4.27
BarCap* Credit 0.53 -0.26 1.50 2.02 4.09 5.28
BarCap* Inv Grade CMBS 1.56 2.29 3.82 2.66 4.82 5.14
BarCap* Mortgage 1.30 1.61 3.43 1.98 3.03 4.71
BarCap* U.S. Corporate High Yield -4.86 -2.45 -3.43 3.51 6.15 7.25
Citi Non-U.S. WGBI (Unhdg) 1.71 -4.22 -7.01 -4.58 -1.32 2.92
Citi 3-Month T-Bill 0.01 0.02 0.02 0.04 0.05 1.26
Hueler Stable Value 0.43 1.32 1.76 1.79 2.12 3.14
06/30/15 09/30/15 Change in
OAS 10-Year Average
U.S. Aggregate Index 51 59 8 67 U.S. Agency (Non-mortgage) Sector 54 47 -7 43
Securitized Sectors:
Mortgage-Backed Securities 26 31 5 53
Asset-Backed Securities 62 69 7 132
Commercial Mortgage-Backed Securities
101 108 7 229
Corporate Sectors: U.S. Investment Grade 145 169 24 167 Industrial 153 184 31 155 Utility 137 152 15 157 Financial Institutions 133 145 12 189 U.S. High Yield 476 630 154 561
10
Investment Performance: U.S. Fixed Income This section presents commentary on the U.S. Treasury yield curve and credit spreads during Q3 2015.
Barclays Capital Corporate Bond Spreads
Yield Curve
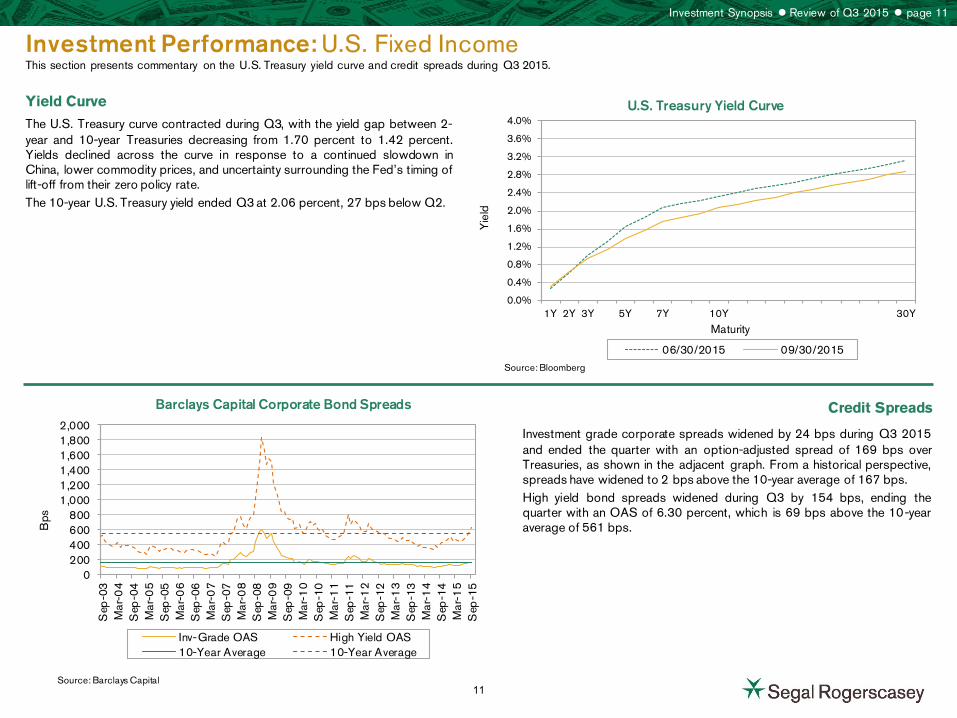
Credit Spreads
Investment grade corporate spreads widened by 24 bps during Q3 2015 and ended the quarter with an option-adjusted spread of 169 bps over Treasuries, as shown in the adjacent graph. From a historical perspective, spreads have widened to 2 bps above the 10-year average of 167 bps. High yield bond spreads widened during Q3 by 154 bps, ending the quarter with an OAS of 6.30 percent, which is 69 bps above the 10-year average of 561 bps.
Source: Bloomberg
Source: Barclays Capital
Investment Synopsis Review of Q3 2015 page 11
The U.S. Treasury curve contracted during Q3, with the yield gap between 2-year and 10-year Treasuries decreasing from 1.70 percent to 1.42 percent. Yields declined across the curve in response to a continued slowdown in China, lower commodity prices, and uncertainty surrounding the Fed’s timing of lift-off from their zero policy rate. The 10-year U.S. Treasury yield ended Q3 at 2.06 percent, 27 bps below Q2.
U.S. Treasury Yield Curve
0200400600800
1,0001,2001,4001,6001,8002,000
Sep
-03
Mar
-04
Sep
-04
Mar
-05
Sep
-05
Mar
-06
Sep
-06
Mar
-07
Sep
-07
Mar
-08
Sep
-08
Mar
-09
Sep
-09
Mar
-10
Sep
-10
Mar
-11
Sep
-11
Mar
-12
Sep
-12
Mar
-13
Sep
-13
Mar
-14
Sep
-14
Mar
-15
Sep
-15
Bps
Inv-Grade OAS High Yield OAS10-Year Average 10-Year Average
0.0%
0.4%
0.8%
1.2%
1.6%
2.0%
2.4%
2.8%
3.2%
3.6%
4.0%
1Y 2Y 3Y 5Y 7Y 10Y 30Y
Yie
ld
Maturity
06/30/2015 09/30/2015
11
Investment Performance: Non-U.S. Fixed Income This page focuses on international fixed-income asset class data and information on EM debt (EMD) for Q3 2015.
J.P. Morgan EMBI Global Index Best and Worst-Performing Markets
International Fixed Income
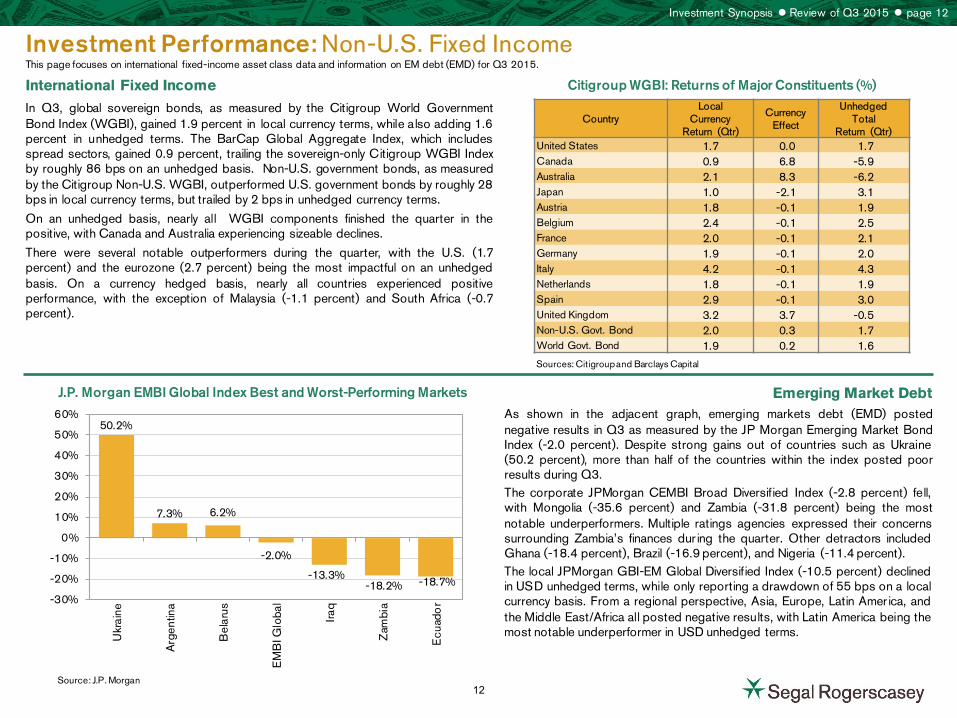
Emerging Market Debt As shown in the adjacent graph, emerging markets debt (EMD) posted negative results in Q3 as measured by the JP Morgan Emerging Market Bond Index (-2.0 percent). Despite strong gains out of countries such as Ukraine (50.2 percent), more than half of the countries within the index posted poor results during Q3. The corporate JPMorgan CEMBI Broad Diversified Index (-2.8 percent) fell, with Mongolia (-35.6 percent) and Zambia (-31.8 percent) being the most notable underperformers. Multiple ratings agencies expressed their concerns surrounding Zambia’s finances dur ing the quarter. Other detractors included Ghana (-18.4 percent), Brazil (-16.9 percent), and Nigeria (-11.4 percent). The local JPMorgan GBI-EM Global Diversified Index (-10.5 percent) declined in USD unhedged terms, while only reporting a drawdown of 55 bps on a local currency basis. From a regional perspective, Asia, Europe, Latin Amer ica, and the Middle East/Africa all posted negative results, with Latin America being the most notable underperformer in USD unhedged terms.
Sources: Citigroup and Barclays Capital
Source: J.P. Morgan
Investment Synopsis Review of Q3 2015 page 12
In Q3, global sovereign bonds, as measured by the Citigroup World Government Bond Index (WGBI), gained 1.9 percent in local currency terms, while also adding 1.6 percent in unhedged terms. The BarCap Global Aggregate Index, which includes spread sectors, gained 0.9 percent, trailing the sovereign-only Citigroup WGBI Index by roughly 86 bps on an unhedged basis. Non-U.S. government bonds, as measured by the Citigroup Non-U.S. WGBI, outperformed U.S. government bonds by roughly 28 bps in local currency terms, but trailed by 2 bps in unhedged currency terms.
On an unhedged basis, nearly all WGBI components finished the quarter in the positive, with Canada and Australia experiencing sizeable declines.
There were several notable outperformers during the quarter, with the U.S. (1.7 percent) and the eurozone (2.7 percent) being the most impactful on an unhedged basis. On a currency hedged basis, nearly all countries experienced positive performance, with the exception of Malaysia (-1.1 percent) and South Africa (-0.7 percent).
Citigroup WGBI: Returns of Major Constituents (%)
Country Local
Currency Return (Qtr)
Currency Effect
Unhedged Total
Return (Qtr) United States 1.7 0.0 1.7 Canada 0.9 6.8 -5.9 Australia 2.1 8.3 -6.2 Japan 1.0 -2.1 3.1 Austria 1.8 -0.1 1.9 Belgium 2.4 -0.1 2.5 France 2.0 -0.1 2.1 Germany 1.9 -0.1 2.0 Italy 4.2 -0.1 4.3 Netherlands 1.8 -0.1 1.9 Spain 2.9 -0.1 3.0 United Kingdom 3.2 3.7 -0.5 Non-U.S. Govt. Bond 2.0 0.3 1.7 World Govt. Bond 1.9 0.2 1.6
50.2%
7.3% 6.2%
-2.0%
-13.3% -18.2% -18.7%
-30%
-20%
-10%
0%
10%
20%
30%
40%
50%
60%
Ukr
aine
Arg
entin
a
Bel
arus
EM
BI G
loba
l
Iraq
Zam
bia
Ecu
ado
r
12
Investment Performance: Commodities and Currencies This section presents performance information about commodities and major world currencies as of Q3 2015.
Commodities
Currencies
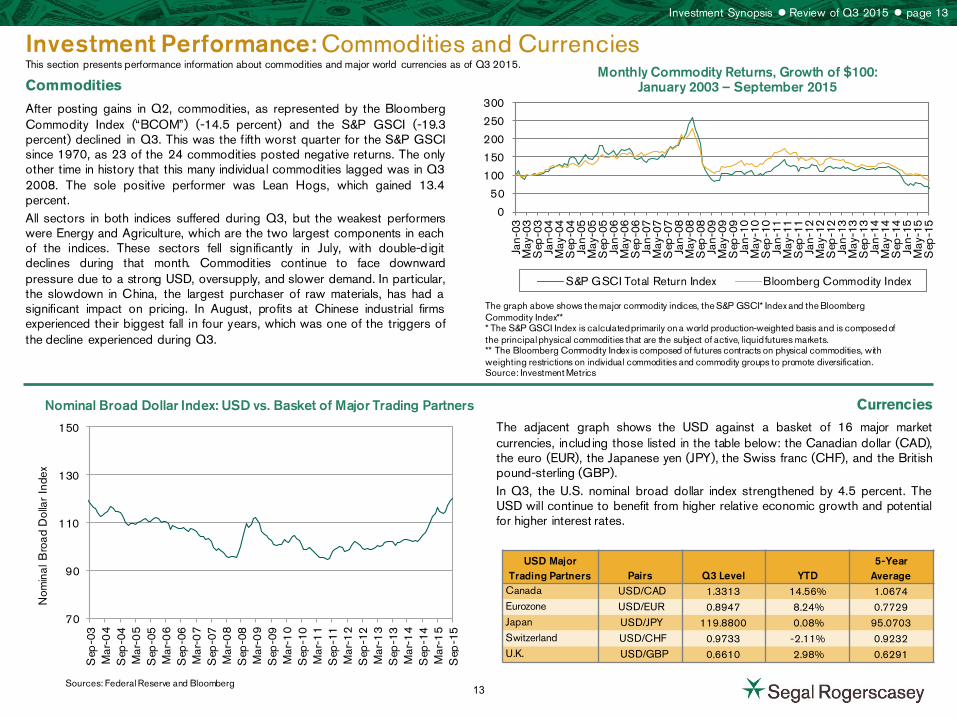
The graph above shows the major commodity indices, the S&P GSCI* Index and the Bloomberg Commodity Index** * The S&P GSCI Index is calculated primarily on a world production-weighted basis and is composed of the principal physical commodities that are the subject of active, liquid futures markets. ** The Bloomberg Commodity Index is composed of futures contracts on physical commodities, with weighting restrictions on individual commodities and commodity groups to promote diversification. Source: Investment Metrics
Investment Synopsis Review of Q3 2015 page 13
After posting gains in Q2, commodities, as represented by the Bloomberg Commodity Index (“BCOM”) (-14.5 percent) and the S&P GSCI (-19.3 percent) declined in Q3. This was the fifth worst quarter for the S&P GSCI since 1970, as 23 of the 24 commodities posted negative returns. The only other time in history that this many individual commodities lagged was in Q3 2008. The sole positive performer was Lean Hogs, which gained 13.4 percent. All sectors in both indices suffered during Q3, but the weakest performers were Energy and Agriculture, which are the two largest components in each of the indices. These sectors fell significantly in July, with double-d igit declines during that month. Commodities continue to face downward pressure due to a strong USD, oversupply, and slower demand. In particular, the slowdown in China, the largest purchaser of raw materials, has had a significant impact on pricing. In August, profits at Chinese industrial firms experienced their biggest fall in four years, which was one of the triggers of the decline experienced during Q3.
Monthly Commodity Returns, Growth of $100: January 2003 – September 2015
0
50
100
150
200
250
300
Jan-
03M
ay-0
3S
ep-0
3Ja
n-04
May
-04
Sep
-04
Jan-
05M
ay-0
5S
ep-0
5Ja
n-06
May
-06
Sep
-06
Jan-
07M
ay-0
7S
ep-0
7Ja
n-08
May
-08
Sep
-08
Jan-
09M
ay-0
9S
ep-0
9Ja
n-10
May
-10
Sep
-10
Jan-
11M
ay-1
1S
ep-1
1Ja
n-12
May
-12
Sep
-12
Jan-
13M
ay-1
3S
ep-1
3Ja
n-14
May
-14
Sep
-14
Jan-
15M
ay-1
5S
ep-1
5
S&P GSCI Total Return Index Bloomberg Commodity Index
Nominal Broad Dollar Index: USD vs. Basket of Major Trading Partners
70
90
110
130
150
Sep
-03
Mar
-04
Sep
-04
Mar
-05
Sep
-05
Mar
-06
Sep
-06
Mar
-07
Sep
-07
Mar
-08
Sep
-08
Mar
-09
Sep
-09
Mar
-10
Sep
-10
Mar
-11
Sep
-11
Mar
-12
Sep
-12
Mar
-13
Sep
-13
Mar
-14
Sep
-14
Mar
-15
Sep
-15
Nom
inal
Bro
ad D
olla
r In
dex
The adjacent graph shows the USD against a basket of 16 major market currencies, including those listed in the table below: the Canadian dollar (CAD), the euro (EUR), the Japanese yen (JPY), the Swiss franc (CHF), and the British pound-sterling (GBP). In Q3, the U.S. nominal broad dollar index strengthened by 4.5 percent. The USD will continue to benefit from higher relative economic growth and potential for higher interest rates.
USD Major Trading Partners Pairs Q3 Level YTD
5-Year Average
Canada USD/CAD 1.3313 14.56% 1.0674 Eurozone USD/EUR 0.8947 8.24% 0.7729 Japan USD/JPY 119.8800 0.08% 95.0703 Switzerland USD/CHF 0.9733 -2.11% 0.9232 U.K. USD/GBP 0.6610 2.98% 0.6291
Sources: Federal Reserve and Bloomberg 13
Investment Performance: Hedge Funds This section provides an overview of hedge fund results along with an analysis of strategy performance during Q3 2015.
Hedge Fund Industry Performance
HFRI Index Returns – Q3 2015 (%)
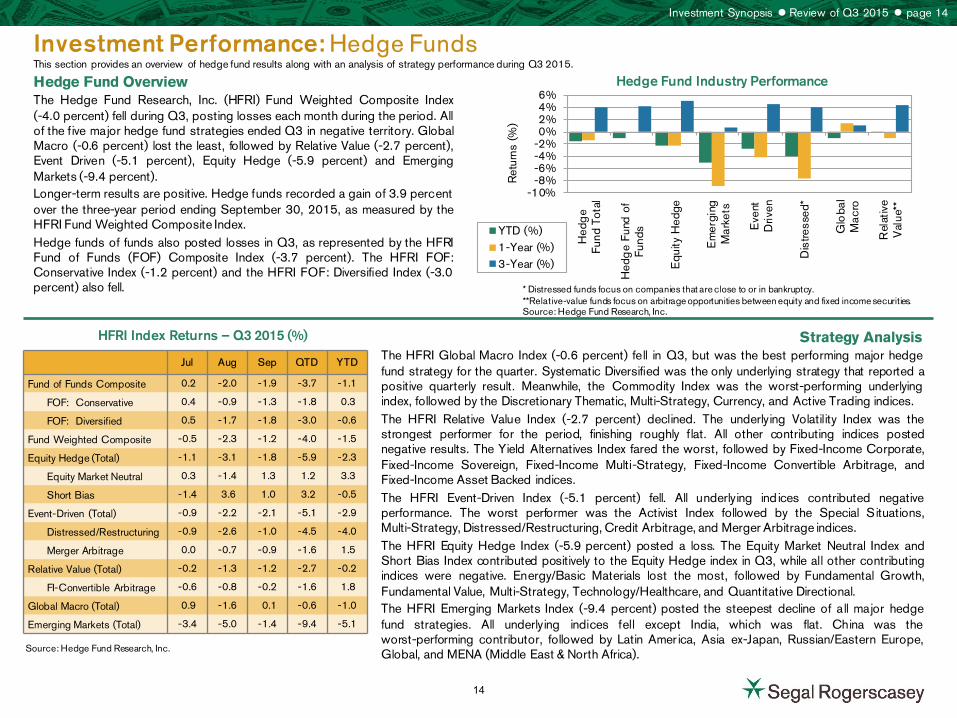
Hedge Fund Overview The Hedge Fund Research, Inc. (HFRI) Fund Weighted Composite Index (-4.0 percent) fell during Q3, posting losses each month during the period. All of the five major hedge fund strategies ended Q3 in negative territory. Global Macro (-0.6 percent) lost the least, followed by Relative Value (-2.7 percent), Event Driven (-5.1 percent), Equity Hedge (-5.9 percent) and Emerging Markets (-9.4 percent). Longer-term results are positive. Hedge funds recorded a gain of 3.9 percent over the three-year period ending September 30, 2015, as measured by the HFRI Fund Weighted Composite Index. Hedge funds of funds also posted losses in Q3, as represented by the HFRI Fund of Funds (FOF) Composite Index (-3.7 percent). The HFRI FOF: Conservative Index (-1.2 percent) and the HFRI FOF: Diversified Index (-3.0 percent) also fell.
Strategy Analysis The HFRI Global Macro Index (-0.6 percent) fell in Q3, but was the best performing major hedge fund strategy for the quarter. Systematic Diversified was the only underlying strategy that reported a positive quarterly result. Meanwhile, the Commodity Index was the worst-performing underlying index, followed by the Discretionary Thematic, Multi-Strategy, Currency, and Active Trading indices. The HFRI Relative Value Index (-2.7 percent) declined. The underlying Volatility Index was the strongest performer for the period, finishing roughly flat. All other contributing indices posted negative results. The Yield Alternatives Index fared the worst, followed by Fixed-Income Corporate, Fixed-Income Sovereign, Fixed-Income Multi-Strategy, Fixed-Income Convertible Arbitrage, and Fixed-Income Asset Backed indices. The HFRI Event-Driven Index (-5.1 percent) fell. All underlying ind ices contributed negative performance. The worst performer was the Activist Index followed by the Special Situations, Multi-Strategy, Distressed/Restructuring, Credit Arbitrage, and Merger Arbitrage indices. The HFRI Equity Hedge Index (-5.9 percent) posted a loss. The Equity Market Neutral Index and Short Bias Index contributed positively to the Equity Hedge index in Q3, while all other contributing indices were negative. Energy/Basic Materials lost the most, followed by Fundamental Growth, Fundamental Value, Multi-Strategy, Technology/Healthcare, and Quantitative Directional. The HFRI Emerging Markets Index (-9.4 percent) posted the steepest decline of all major hedge fund strategies. All underlying indices fell except India, which was flat. China was the worst-performing contributor, followed by Latin Amer ica, Asia ex-Japan, Russian/Eastern Europe, Global, and MENA (Middle East & North Africa).
* Distressed funds focus on companies that are close to or in bankruptcy. **Relative-value funds focus on arbitrage opportunities between equity and fixed income securities. Source: Hedge Fund Research, Inc.
Source: Hedge Fund Research, Inc.
Investment Synopsis Review of Q3 2015 page 14
-10%-8%-6%-4%-2%0%2%4%6%
Hed
ge
Fund
Tot
al
Hed
ge
Fund
of
Fund
s
Equ
ity H
edge
Em
ergi
ngM
arke
ts
Eve
ntD
riven
Dis
tress
ed*
Glo
bal
Mac
ro
Rel
ativ
eV
alue
**
Ret
urns
(%
)
YTD (%)1-Year (%)3-Year (%)
Jul Aug Sep QTD YTD
Fund of Funds Composite 0.2 -2.0 -1.9 -3.7 -1.1
FOF: Conservative 0.4 -0.9 -1.3 -1.8 0.3
FOF: Diversified 0.5 -1.7 -1.8 -3.0 -0.6
Fund Weighted Composite -0.5 -2.3 -1.2 -4.0 -1.5
Equity Hedge (Total) -1.1 -3.1 -1.8 -5.9 -2.3
Equity Market Neutral 0.3 -1.4 1.3 1.2 3.3
Short Bias -1.4 3.6 1.0 3.2 -0.5
Event-Driven (Total) -0.9 -2.2 -2.1 -5.1 -2.9
Distressed/Restructuring -0.9 -2.6 -1.0 -4.5 -4.0
Merger Arbitrage 0.0 -0.7 -0.9 -1.6 1.5
Relative Value (Total) -0.2 -1.3 -1.2 -2.7 -0.2
FI-Convertible Arbitrage -0.6 -0.8 -0.2 -1.6 1.8
Global Macro (Total) 0.9 -1.6 0.1 -0.6 -1.0
Emerging Markets (Total) -3.4 -5.0 -1.4 -9.4 -5.1
14
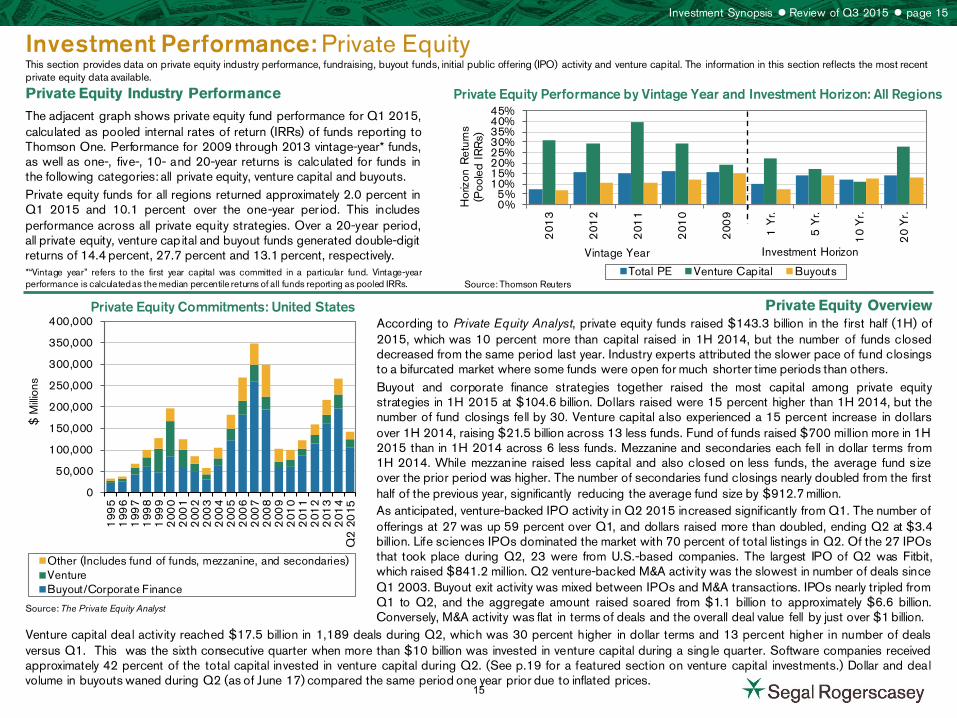
Venture capital deal activity reached $17.5 billion in 1,189 deals during Q2, which was 30 percent higher in dollar terms and 13 percent higher in number of deals versus Q1. This was the sixth consecutive quarter when more than $10 billion was invested in venture capital during a sing le quarter. Software companies received approximately 42 percent of the total capital invested in venture capital during Q2. (See p.19 for a featured section on venture capital investments.) Dollar and deal volume in buyouts waned during Q2 (as of June 17) compared the same period one year prior due to inflated prices.
0
50,000
100,000
150,000
200,000
250,000
300,000
350,000
400,000
199
51
996
199
71
998
199
92
000
200
12
002
200
32
004
200
52
006
200
72
008
200
92
010
201
12
012
201
32
014
Q2
20
15
$ M
illion
s
Other (Includes fund of funds, mezzanine, and secondaries)VentureBuyout/Corporate Finance
Investment Performance: Private Equity This section provides data on private equity industry performance, fundraising, buyout funds, initial public offering (IPO) activity and venture capital. The information in this section reflects the most recent private equity data available.
Private Equity Performance by Vintage Year and Investment Horizon: All Regions
Private Equity Commitments: United States
Private Equity Industry Performance
The adjacent graph shows private equity fund performance for Q1 2015, calculated as pooled internal rates of return (IRRs) of funds reporting to Thomson One. Performance for 2009 through 2013 vintage-year* funds, as well as one-, five-, 10- and 20-year returns is calculated for funds in the following categories: all private equity, venture capital and buyouts. Private equity funds for all regions returned approximately 2.0 percent in Q1 2015 and 10.1 percent over the one-year per iod. This includes performance across all private equity strategies. Over a 20-year period, all private equity, venture capital and buyout funds generated double-digit returns of 14.4 percent, 27.7 percent and 13.1 percent, respectively. *“Vintage year” refers to the first year capital was committed in a particular fund. Vintage-year performance is calculated as the median percentile returns of all funds reporting as pooled IRRs.
Private Equity Overview According to Private Equity Analyst, private equity funds raised $143.3 billion in the first half (1H) of 2015, which was 10 percent more than capital raised in 1H 2014, but the number of funds closed decreased from the same period last year. Industry experts attributed the slower pace of fund closings to a bifurcated market where some funds were open for much shorter time periods than others. Buyout and corporate finance strategies together raised the most capital among private equity strategies in 1H 2015 at $104.6 billion. Dollars raised were 15 percent higher than 1H 2014, but the number of fund closings fell by 30. Venture capital also experienced a 15 percent increase in dollars over 1H 2014, raising $21.5 billion across 13 less funds. Fund of funds raised $700 million more in 1H 2015 than in 1H 2014 across 6 less funds. Mezzanine and secondaries each fell in dollar terms from 1H 2014. While mezzanine raised less capital and also closed on less funds, the average fund s ize over the prior period was higher. The number of secondaries fund closings nearly doubled from the first half of the previous year, significantly reducing the average fund size by $912.7 million. As anticipated, venture-backed IPO activity in Q2 2015 increased significantly from Q1. The number of offerings at 27 was up 59 percent over Q1, and dollars raised more than doubled, ending Q2 at $3.4 billion. Life sciences IPOs dominated the market with 70 percent of total listings in Q2. Of the 27 IPOs that took place during Q2, 23 were from U.S.-based companies. The largest IPO of Q2 was Fitbit, which raised $841.2 million. Q2 venture-backed M&A activity was the slowest in number of deals since Q1 2003. Buyout exit activity was mixed between IPOs and M&A transactions. IPOs nearly tripled from Q1 to Q2, and the aggregate amount raised soared from $1.1 billion to approximately $6.6 billion. Conversely, M&A activity was flat in terms of deals and the overall deal value fell by just over $1 billion.
Source: The Private Equity Analyst
Investment Synopsis Review of Q3 2015 page 15
0%5%
10%15%20%25%30%35%40%45%
201
3
201
2
201
1
201
0
200
9
1 Y
r.
5 Y
r.
10
Yr.
20
Yr.
Hor
izon
Ret
urns
(P
oole
d IR
Rs)
Vintage Year
Total PE Venture Capital Buyouts
Investment Horizon
Source: Thomson Reuters
15
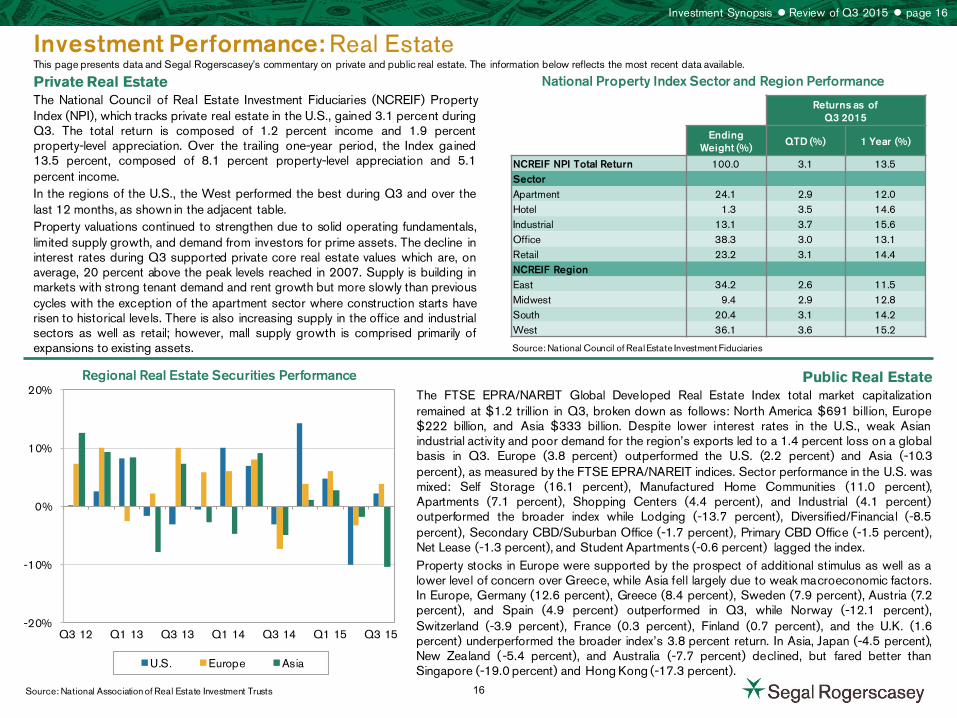
Investment Performance: Real Estate This page presents data and Segal Rogerscasey’s commentary on private and public real estate. The information below reflects the most recent data available.
National Property Index Sector and Region Performance
Regional Real Estate Securities Performance
Private Real Estate
Public Real Estate The FTSE EPRA/NAREIT Global Developed Real Estate Index total market capitalization remained at $1.2 trillion in Q3, broken down as follows: North America $691 billion, Europe $222 billion, and Asia $333 billion. Despite lower interest rates in the U.S., weak Asian industrial activity and poor demand for the region’s exports led to a 1.4 percent loss on a global basis in Q3. Europe (3.8 percent) outperformed the U.S. (2.2 percent) and Asia (-10.3 percent), as measured by the FTSE EPRA/NAREIT indices. Sector performance in the U.S. was mixed: Self Storage (16.1 percent), Manufactured Home Communities (11.0 percent), Apartments (7.1 percent), Shopping Centers (4.4 percent), and Industrial (4.1 percent) outperformed the broader index while Lodging (-13.7 percent), Diversified/Financial (-8.5 percent), Secondary CBD/Suburban Office (-1.7 percent), Primary CBD Office (-1.5 percent), Net Lease (-1.3 percent), and Student Apartments (-0.6 percent) lagged the index. Property stocks in Europe were supported by the prospect of additional stimulus as well as a lower level of concern over Greece, while Asia fell largely due to weak macroeconomic factors. In Europe, Germany (12.6 percent), Greece (8.4 percent), Sweden (7.9 percent), Austria (7.2 percent), and Spain (4.9 percent) outperformed in Q3, while Norway (-12.1 percent), Switzerland (-3.9 percent), France (0.3 percent), Finland (0.7 percent), and the U.K. (1.6 percent) underperformed the broader index’s 3.8 percent return. In Asia, Japan (-4.5 percent), New Zealand (-5.4 percent), and Australia (-7.7 percent) declined, but fared better than Singapore (-19.0 percent) and Hong Kong (-17.3 percent).
Source: National Association of Real Estate Investment Trusts
Investment Synopsis Review of Q3 2015 page 16
-20%
-10%
0%
10%
20%
Q3 12 Q1 13 Q3 13 Q1 14 Q3 14 Q1 15 Q3 15
U.S. Europe Asia
The National Council of Real Estate Investment Fiduciaries (NCREIF) Property Index (NPI), which tracks private real estate in the U.S., gained 3.1 percent during Q3. The total return is composed of 1.2 percent income and 1.9 percent property-level appreciation. Over the trailing one-year period, the Index gained 13.5 percent, composed of 8.1 percent property-level appreciation and 5.1 percent income. In the regions of the U.S., the West performed the best during Q3 and over the last 12 months, as shown in the adjacent table. Property valuations continued to strengthen due to solid operating fundamentals, limited supply growth, and demand from investors for prime assets. The decline in interest rates during Q3 supported private core real estate values which are, on average, 20 percent above the peak levels reached in 2007. Supply is building in markets with strong tenant demand and rent growth but more slowly than previous cycles with the exception of the apartment sector where construction starts have risen to historical levels. There is also increasing supply in the office and industrial sectors as well as retail; however, mall supply growth is comprised primarily of expansions to existing assets.
Returns as of Q3 2015
Ending
Weight (%) QTD (%) 1 Year (%)
NCREIF NPI Total Return 100.0 3.1 13.5 Sector Apartment 24.1 2.9 12.0 Hotel 1.3 3.5 14.6 Industrial 13.1 3.7 15.6 Office 38.3 3.0 13.1 Retail 23.2 3.1 14.4 NCREIF Region East 34.2 2.6 11.5 Midwest 9.4 2.9 12.8 South 20.4 3.1 14.2 West 36.1 3.6 15.2
Source: National Council of Real Estate Investment Fiduciaries
16
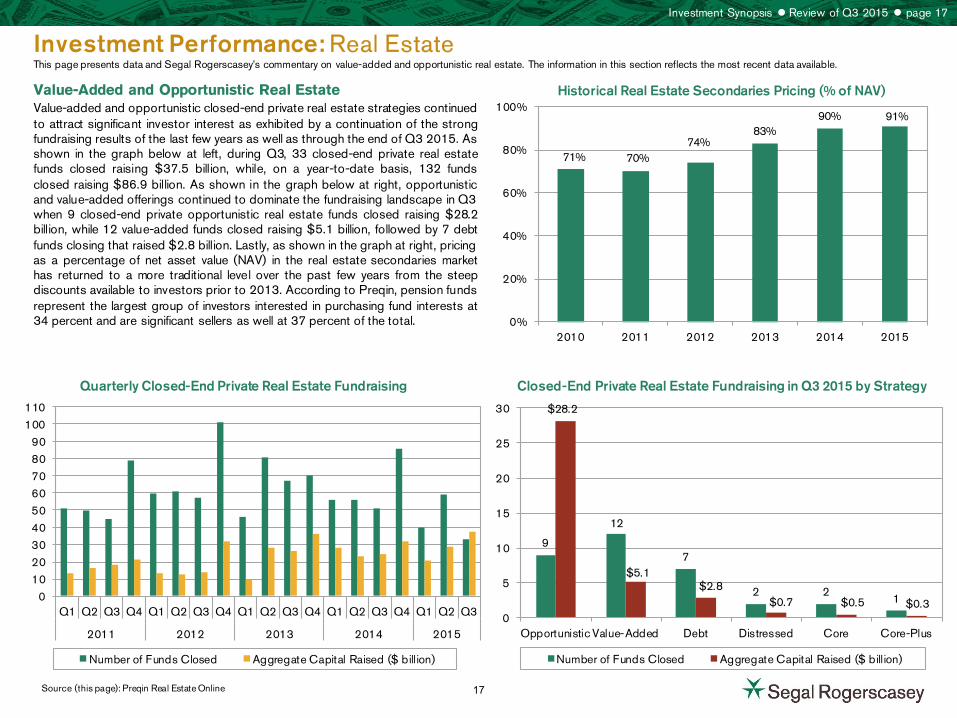
Investment Performance: Real Estate This page presents data and Segal Rogerscasey’s commentary on value-added and opportunistic real estate. The information in this section reflects the most recent data available.
Historical Real Estate Secondaries Pricing (% of NAV)
Quarterly Closed-End Private Real Estate Fundraising
Value-Added and Opportunistic Real Estate Value-added and opportunistic closed-end private real estate strategies continued to attract significant investor interest as exhibited by a continuation of the strong fundraising results of the last few years as well as through the end of Q3 2015. As shown in the graph below at left, during Q3, 33 closed-end private real estate funds closed raising $37.5 billion, while, on a year-to-date basis, 132 funds closed raising $86.9 billion. As shown in the graph below at right, opportunistic and value-added offerings continued to dominate the fundraising landscape in Q3 when 9 closed-end private opportunistic real estate funds closed raising $28.2 billion, while 12 value-added funds closed raising $5.1 billion, followed by 7 debt funds closing that raised $2.8 billion. Lastly, as shown in the graph at right, pricing as a percentage of net asset value (NAV) in the real estate secondaries market has returned to a more traditional level over the past few years from the steep discounts available to investors prior to 2013. According to Preqin, pension funds represent the largest group of investors interested in purchasing fund interests at 34 percent and are significant sellers as well at 37 percent of the total.
Source (this page): Preqin Real Estate Online
Investment Synopsis Review of Q3 2015 page 17
Closed-End Private Real Estate Fundraising in Q3 2015 by Strategy
0102030405060708090
100110
Q1 Q2 Q3 Q4 Q1 Q2 Q3 Q4 Q1 Q2 Q3 Q4 Q1 Q2 Q3 Q4 Q1 Q2 Q3
2011 2012 2013 2014 2015
Number of Funds Closed Aggregate Capital Raised ($ billion)
9
12
7
2 2 1
$28.2
$5.1 $2.8
$0.7 $0.5 $0.3 0
5
10
15
20
25
30
Opportunistic Value-Added Debt Distressed Core Core-Plus
Number of Funds Closed Aggregate Capital Raised ($ billion)
71% 70% 74%
83% 90% 91%
0%
20%
40%
60%
80%
100%
2010 2011 2012 2013 2014 2015
17
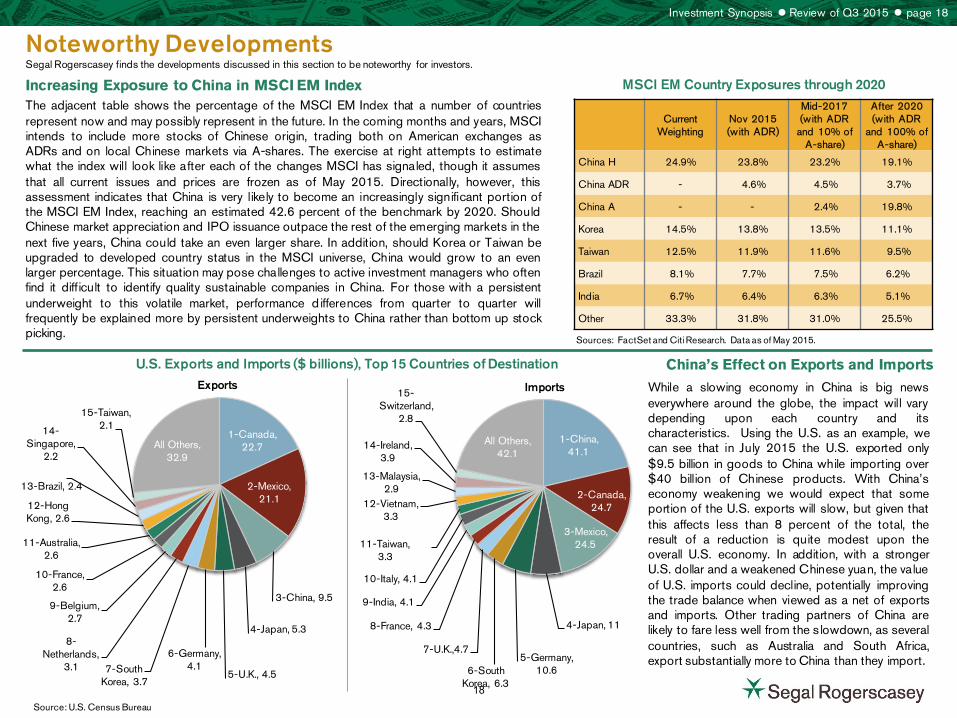
Noteworthy Developments Segal Rogerscasey finds the developments discussed in this section to be noteworthy for investors.
MSCI EM Country Exposures through 2020 Increasing Exposure to China in MSCI EM Index The adjacent table shows the percentage of the MSCI EM Index that a number of countries represent now and may possibly represent in the future. In the coming months and years, MSCI intends to include more stocks of Chinese origin, trading both on American exchanges as ADRs and on local Chinese markets via A-shares. The exercise at right attempts to estimate what the index will look like after each of the changes MSCI has signaled, though it assumes that all current issues and prices are frozen as of May 2015. Directionally, however, this assessment indicates that China is very likely to become an increasingly significant portion of the MSCI EM Index, reaching an estimated 42.6 percent of the benchmark by 2020. Should Chinese market appreciation and IPO issuance outpace the rest of the emerging markets in the next five years, China could take an even larger share. In addition, should Korea or Taiwan be upgraded to developed country status in the MSCI universe, China would grow to an even larger percentage. This situation may pose challenges to active investment managers who often find it difficult to identify quality sustainable companies in China. For those with a persistent underweight to this volatile market, performance d ifferences from quarter to quarter will frequently be explained more by persistent underweights to China rather than bottom up stock picking.
Investment Synopsis Review of Q3 2015 page 18
Sources: FactSet and Citi Research. Data as of May 2015.
Source: U.S. Census Bureau
China’s Effect on Exports and Imports
While a slowing economy in China is big news everywhere around the globe, the impact will vary depending upon each country and its characteristics. Using the U.S. as an example, we can see that in July 2015 the U.S. exported only $9.5 billion in goods to China while importing over $40 billion of Chinese products. With China’s economy weakening we would expect that some portion of the U.S. exports will slow, but given that this affects less than 8 percent of the total, the result of a reduction is quite modest upon the overall U.S. economy. In addition, with a stronger U.S. dollar and a weakened Chinese yuan, the value of U.S. imports could decline, potentially improving the trade balance when viewed as a net of exports and imports. Other trading partners of China are likely to fare less well from the s lowdown, as several countries, such as Australia and South Africa, export substantially more to China than they import.
U.S. Exports and Imports ($ billions), Top 15 Countries of Destination
1-Canada, 22.7
2-Mexico, 21.1
3-China, 9.5
4-Japan, 5.3
5-U.K., 4.5
6-Germany, 4.1 7-South
Korea, 3.7
8-Netherlands,
3.1
9-Belgium, 2.7
10-France, 2.6
11-Australia, 2.6
12-Hong Kong, 2.6
13-Brazil, 2.4
14-Singapore,
2.2
15-Taiwan, 2.1
All Others, 32.9
Exports
1-China, 41.1
2-Canada, 24.7
3-Mexico, 24.5
4-Japan, 11
5-Germany, 10.6 6-South
Korea, 6.3
7-U.K.,4.7
8-France, 4.3
9-India, 4.1
10-Italy, 4.1
11-Taiwan, 3.3
12-Vietnam, 3.3
13-Malaysia, 2.9
14-Ireland, 3.9
15-Switzerland,
2.8
All Others, 42.1
Imports
Current
Weighting Nov 2015 (with ADR)
Mid-2017 (with ADR
and 10% of A-share)
After 2020 (with ADR
and 100% of A-share)
China H 24.9% 23.8% 23.2% 19.1%
China ADR - 4.6% 4.5% 3.7%
China A - - 2.4% 19.8%
Korea 14.5% 13.8% 13.5% 11.1%
Taiwan 12.5% 11.9% 11.6% 9.5%
Brazil 8.1% 7.7% 7.5% 6.2%
India 6.7% 6.4% 6.3% 5.1%
Other 33.3% 31.8% 31.0% 25.5%
18
Noteworthy Developments Segal Rogerscasey finds the developments discussed in this section to be noteworthy for investors.
Investment Synopsis Review of Q3 2015 page 19
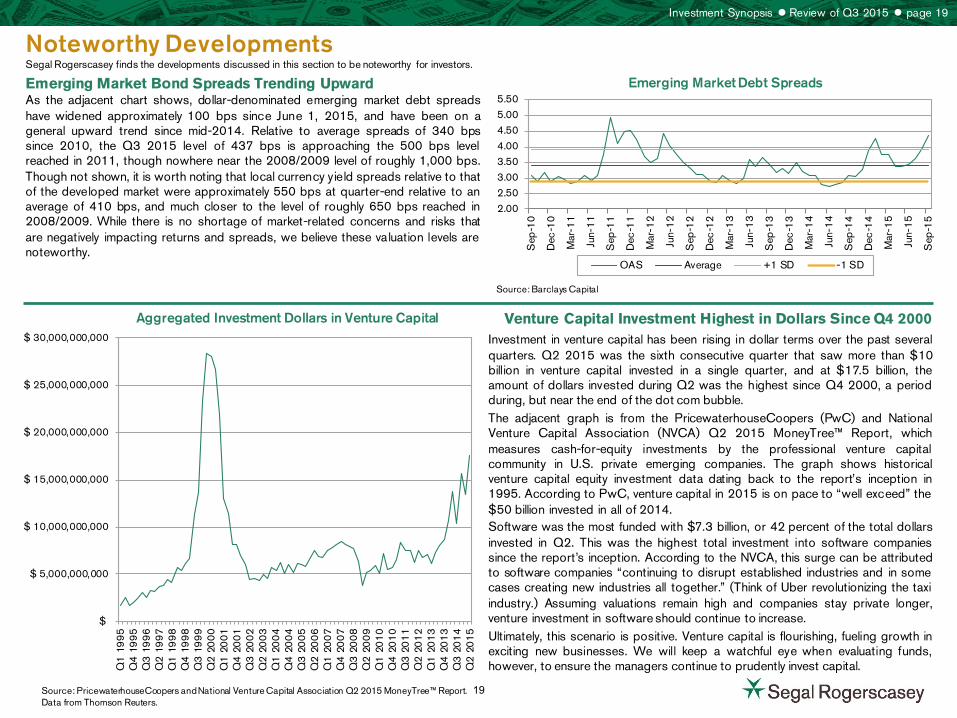
Emerging Market Bond Spreads Trending Upward
Aggregated Investment Dollars in Venture Capital
Source: PricewaterhouseCoopers and National Venture Capital Association Q2 2015 MoneyTree™ Report. Data from Thomson Reuters.
Venture Capital Investment Highest in Dollars Since Q4 2000 Investment in venture capital has been rising in dollar terms over the past several quarters. Q2 2015 was the sixth consecutive quarter that saw more than $10 billion in venture capital invested in a single quarter, and at $17.5 billion, the amount of dollars invested during Q2 was the highest since Q4 2000, a period during, but near the end of the dot com bubble. The adjacent graph is from the PricewaterhouseCoopers (PwC) and National Venture Capital Association (NVCA) Q2 2015 MoneyTree™ Report, which measures cash-for-equity investments by the professional venture capital community in U.S. private emerging companies. The graph shows historical venture capital equity investment data dating back to the report’s inception in 1995. According to PwC, venture capital in 2015 is on pace to “well exceed” the $50 billion invested in all of 2014. Software was the most funded with $7.3 billion, or 42 percent of the total dollars invested in Q2. This was the highest total investment into software companies since the report’s inception. According to the NVCA, this surge can be attributed to software companies “continuing to disrupt established industries and in some cases creating new industries all together.” (Think of Uber revolutionizing the taxi industry.) Assuming valuations remain high and companies stay private longer, venture investment in software should continue to increase. Ultimately, this scenario is positive. Venture capital is flourishing, fueling growth in exciting new businesses. We will keep a watchful eye when evaluating funds, however, to ensure the managers continue to prudently invest capital.
$
$ 5,000,000,000
$ 10,000,000,000
$ 15,000,000,000
$ 20,000,000,000
$ 25,000,000,000
$ 30,000,000,000
Q1
19
95
Q4
19
95
Q3
19
96
Q2
19
97
Q1
19
98
Q4
19
98
Q3
19
99
Q2
20
00
Q1
20
01
Q4
20
01
Q3
20
02
Q2
20
03
Q1
20
04
Q4
20
04
Q3
20
05
Q2
20
06
Q1
20
07
Q4
20
07
Q3
20
08
Q2
20
09
Q1
20
10
Q4
20
10
Q3
20
11
Q2
20
12
Q1
20
13
Q4
20
13
Q3
20
14
Q2
20
15
2.00
2.50
3.00
3.50
4.00
4.50
5.00
5.50
Sep
-10
Dec
-10
Mar
-11
Jun-
11
Sep
-11
Dec
-11
Mar
-12
Jun-
12
Sep
-12
Dec
-12
Mar
-13
Jun-
13
Sep
-13
Dec
-13
Mar
-14
Jun-
14
Sep
-14
Dec
-14
Mar
-15
Jun-
15
Sep
-15
OAS Average +1 SD -1 SD
Source: Barclays Capital
Emerging Market Debt Spreads As the adjacent chart shows, dollar-denominated emerging market debt spreads have widened approximately 100 bps since June 1, 2015, and have been on a general upward trend since mid-2014. Relative to average spreads of 340 bps since 2010, the Q3 2015 level of 437 bps is approaching the 500 bps level reached in 2011, though nowhere near the 2008/2009 level of roughly 1,000 bps. Though not shown, it is worth noting that local currency yield spreads relative to that of the developed market were approximately 550 bps at quarter-end relative to an average of 410 bps, and much closer to the level of roughly 650 bps reached in 2008/2009. While there is no shortage of market-related concerns and risks that are negatively impacting returns and spreads, we believe these valuation levels are noteworthy.
19
Total Fund Composite
20
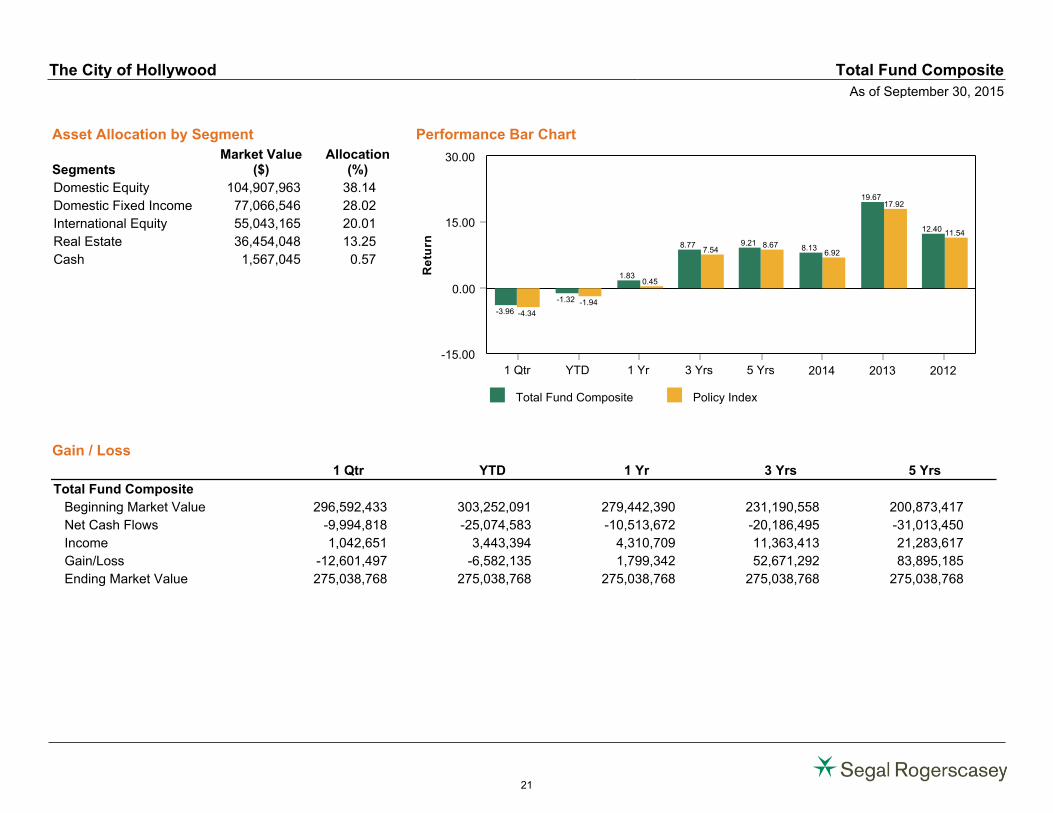
Asset Allocation by Segment
SegmentsMarket Value
($)Allocation
(%)
Domestic Equity 104,907,963 38.14
Domestic Fixed Income 77,066,546 28.02
International Equity 55,043,165 20.01
Real Estate 36,454,048 13.25
Cash 1,567,045 0.57
Performance Bar Chart
Total Fund Composite Policy Index
0.00
15.00
30.00
-15.00
Re
turn
1 Qtr YTD 1 Yr 3 Yrs 5 Yrs 2014 2013 2012
-4.34
-1.94
0.45
7.548.67
6.92
17.92
11.54
-3.96
-1.32
1.83
8.77 9.218.13
19.67
12.40
Gain / Loss
1 Qtr YTD 1 Yr 3 Yrs 5 Yrs
Total Fund Composite
Beginning Market Value 296,592,433 303,252,091 279,442,390 231,190,558 200,873,417
Net Cash Flows -9,994,818 -25,074,583 -10,513,672 -20,186,495 -31,013,450
Income 1,042,651 3,443,394 4,310,709 11,363,413 21,283,617
Gain/Loss -12,601,497 -6,582,135 1,799,342 52,671,292 83,895,185
Ending Market Value 275,038,768 275,038,768 275,038,768 275,038,768 275,038,768
The City of Hollywood Total Fund Composite
As of September 30, 2015
21
Target Allocation Actual Allocation Allocation Differences
0.0% 15.0% 30.0% 45.0% 60.0%-15.0 %-30.0 %
Real Estate Composite$36,454,197
Fixed Income Composite$78,133,537
International Equity Composite$55,043,165
Small / SMID Cap Composite$36,373,262
Large Cap Composite$69,034,607
10.0%
32.5%
15.0%
12.5%
30.0%
13.3%
28.4%
20.0%
13.2%
25.1%
3.3%
-4.1 %
5.0%
0.7%
-4.9 %
AssetAllocation
($)
AssetAllocation
(%)
TargetAllocation
(%)Differences
(%)
MinimumAllocation
(%)
MaximumAllocation
(%)
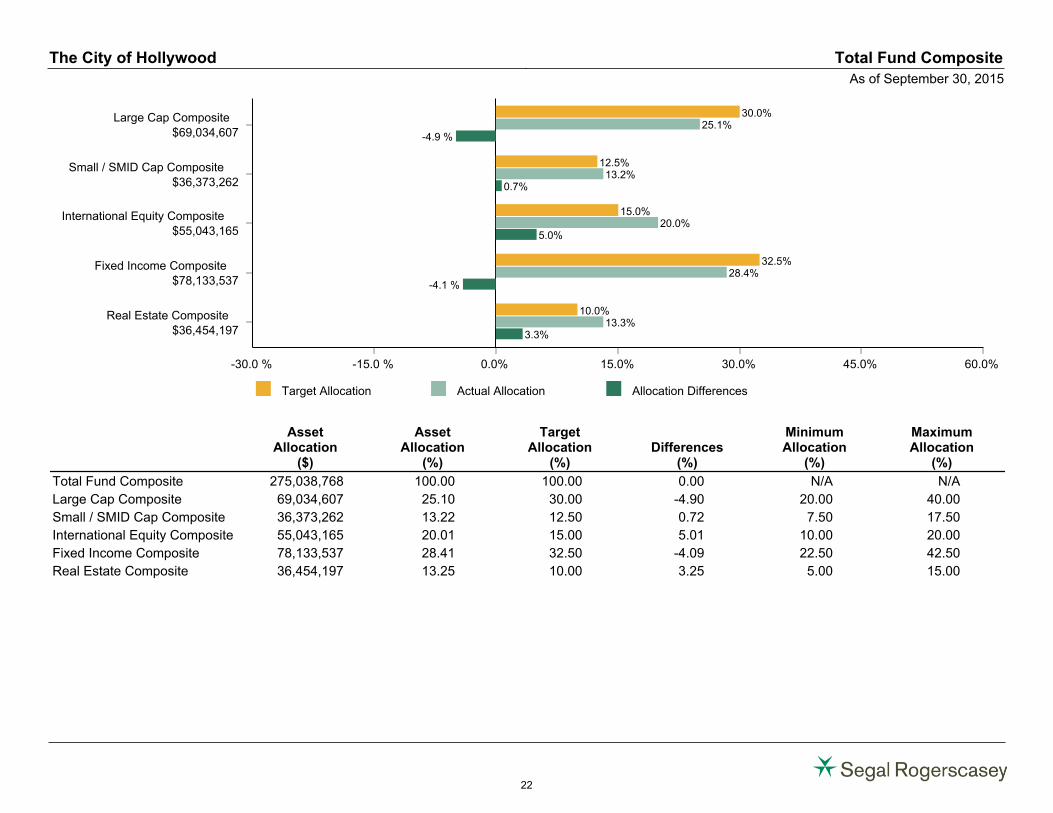
Total Fund Composite 275,038,768 100.00 100.00 0.00 N/A N/A
Large Cap Composite 69,034,607 25.10 30.00 -4.90 20.00 40.00
Small / SMID Cap Composite 36,373,262 13.22 12.50 0.72 7.50 17.50
International Equity Composite 55,043,165 20.01 15.00 5.01 10.00 20.00
Fixed Income Composite 78,133,537 28.41 32.50 -4.09 22.50 42.50
Real Estate Composite 36,454,197 13.25 10.00 3.25 5.00 15.00
The City of Hollywood Total Fund Composite
As of September 30, 2015
22
Total Fund
($) %
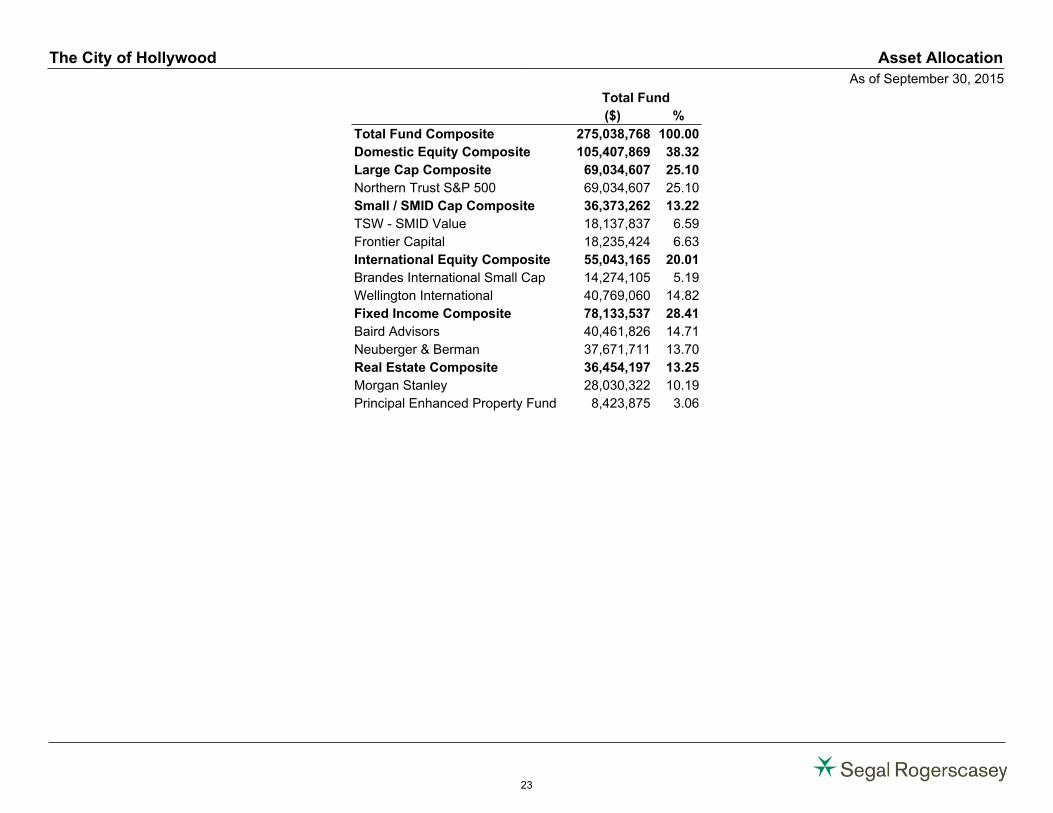
Total Fund Composite 275,038,768 100.00
Domestic Equity Composite 105,407,869 38.32
Large Cap Composite 69,034,607 25.10
Northern Trust S&P 500 69,034,607 25.10
Small / SMID Cap Composite 36,373,262 13.22
TSW - SMID Value 18,137,837 6.59
Frontier Capital 18,235,424 6.63
International Equity Composite 55,043,165 20.01
Brandes International Small Cap 14,274,105 5.19
Wellington International 40,769,060 14.82
Fixed Income Composite 78,133,537 28.41
Baird Advisors 40,461,826 14.71
Neuberger & Berman 37,671,711 13.70
Real Estate Composite 36,454,197 13.25
Morgan Stanley 28,030,322 10.19
Principal Enhanced Property Fund 8,423,875 3.06
The City of Hollywood Asset Allocation
As of September 30, 2015
23
Performance (%)
1Quarter
Oct-2014To
Sep-20151
Year3
Years5
Years7
Years10
YearsSince
InceptionInception
Date
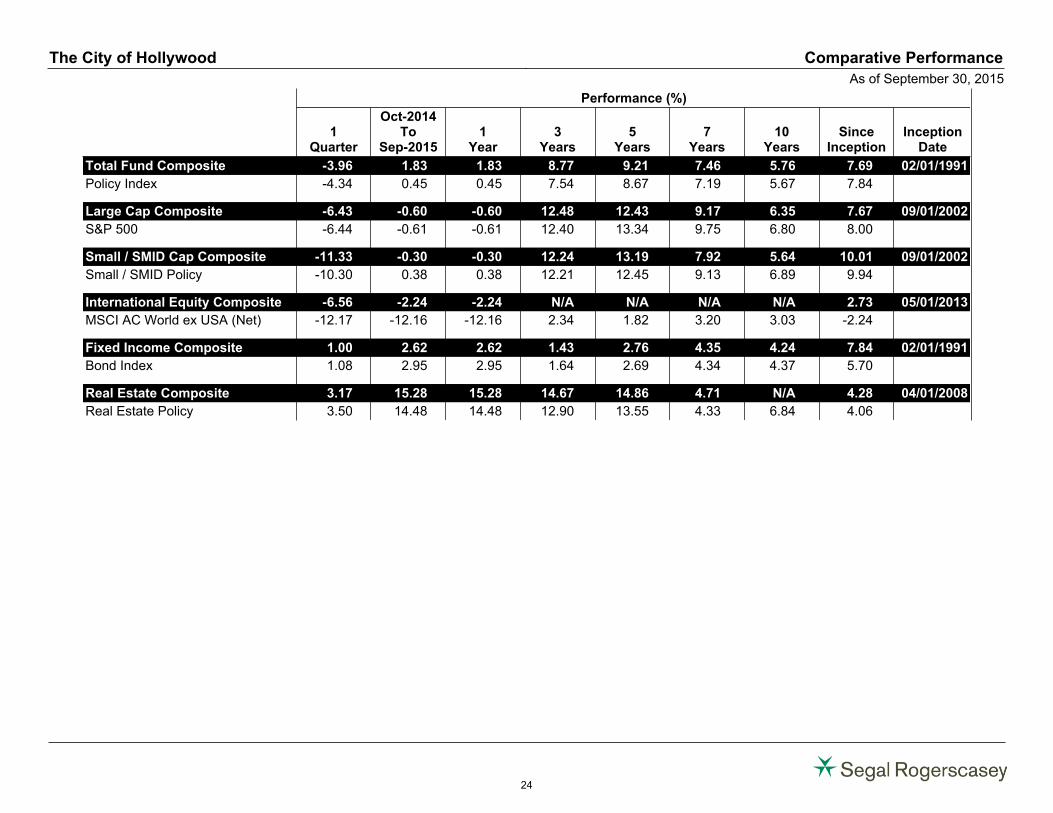
Total Fund Composite -3.96 1.83 1.83 8.77 9.21 7.46 5.76 7.69 02/01/1991
Policy Index -4.34 0.45 0.45 7.54 8.67 7.19 5.67 7.84
Large Cap Composite -6.43 -0.60 -0.60 12.48 12.43 9.17 6.35 7.67 09/01/2002
S&P 500 -6.44 -0.61 -0.61 12.40 13.34 9.75 6.80 8.00
Small / SMID Cap Composite -11.33 -0.30 -0.30 12.24 13.19 7.92 5.64 10.01 09/01/2002
Small / SMID Policy -10.30 0.38 0.38 12.21 12.45 9.13 6.89 9.94
International Equity Composite -6.56 -2.24 -2.24 N/A N/A N/A N/A 2.73 05/01/2013
MSCI AC World ex USA (Net) -12.17 -12.16 -12.16 2.34 1.82 3.20 3.03 -2.24
Fixed Income Composite 1.00 2.62 2.62 1.43 2.76 4.35 4.24 7.84 02/01/1991
Bond Index 1.08 2.95 2.95 1.64 2.69 4.34 4.37 5.70
Real Estate Composite 3.17 15.28 15.28 14.67 14.86 4.71 N/A 4.28 04/01/2008
Real Estate Policy 3.50 14.48 14.48 12.90 13.55 4.33 6.84 4.06
The City of Hollywood Comparative Performance
As of September 30, 2015
24
Performance (%)
1Quarter
Oct-2014To
Sep-20151
Year3
Years5
Years7
Years10
YearsSince
InceptionInception
Date
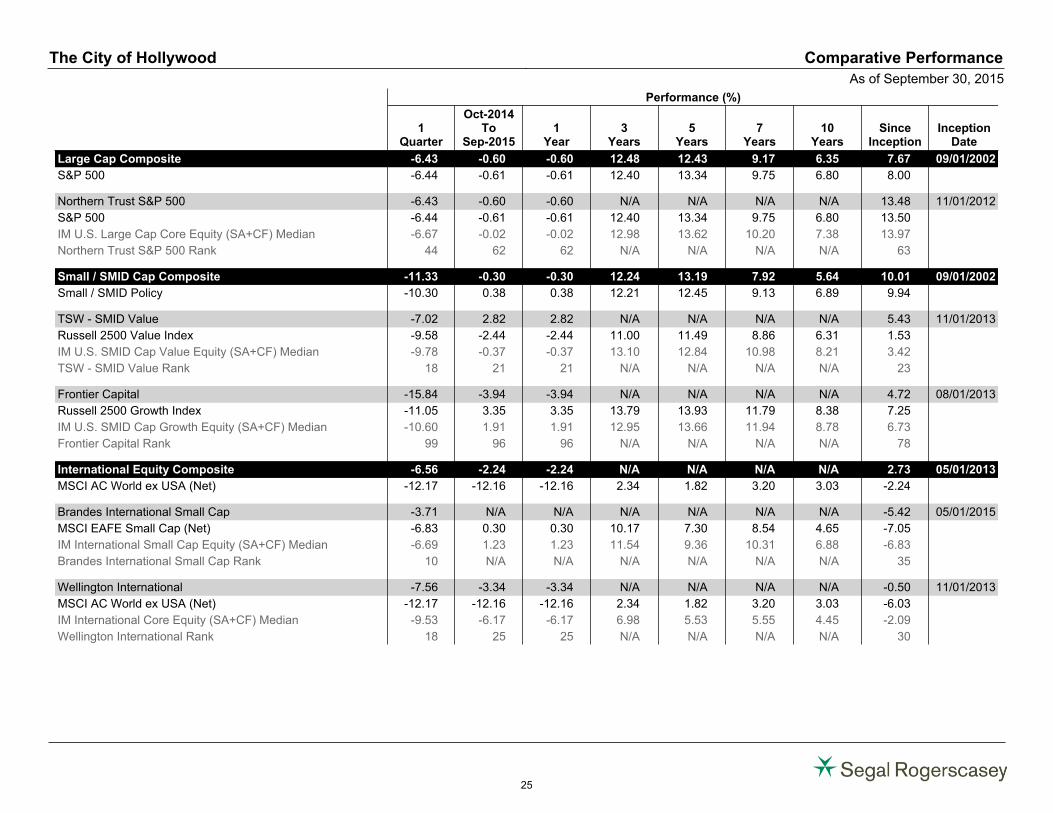
Large Cap Composite -6.43 -0.60 -0.60 12.48 12.43 9.17 6.35 7.67 09/01/2002
S&P 500 -6.44 -0.61 -0.61 12.40 13.34 9.75 6.80 8.00
Northern Trust S&P 500 -6.43 -0.60 -0.60 N/A N/A N/A N/A 13.48 11/01/2012
S&P 500 -6.44 -0.61 -0.61 12.40 13.34 9.75 6.80 13.50
IM U.S. Large Cap Core Equity (SA+CF) Median -6.67 -0.02 -0.02 12.98 13.62 10.20 7.38 13.97
Northern Trust S&P 500 Rank 44 62 62 N/A N/A N/A N/A 63
Small / SMID Cap Composite -11.33 -0.30 -0.30 12.24 13.19 7.92 5.64 10.01 09/01/2002
Small / SMID Policy -10.30 0.38 0.38 12.21 12.45 9.13 6.89 9.94
TSW - SMID Value -7.02 2.82 2.82 N/A N/A N/A N/A 5.43 11/01/2013
Russell 2500 Value Index -9.58 -2.44 -2.44 11.00 11.49 8.86 6.31 1.53
IM U.S. SMID Cap Value Equity (SA+CF) Median -9.78 -0.37 -0.37 13.10 12.84 10.98 8.21 3.42
TSW - SMID Value Rank 18 21 21 N/A N/A N/A N/A 23
Frontier Capital -15.84 -3.94 -3.94 N/A N/A N/A N/A 4.72 08/01/2013
Russell 2500 Growth Index -11.05 3.35 3.35 13.79 13.93 11.79 8.38 7.25
IM U.S. SMID Cap Growth Equity (SA+CF) Median -10.60 1.91 1.91 12.95 13.66 11.94 8.78 6.73
Frontier Capital Rank 99 96 96 N/A N/A N/A N/A 78
International Equity Composite -6.56 -2.24 -2.24 N/A N/A N/A N/A 2.73 05/01/2013
MSCI AC World ex USA (Net) -12.17 -12.16 -12.16 2.34 1.82 3.20 3.03 -2.24
Brandes International Small Cap -3.71 N/A N/A N/A N/A N/A N/A -5.42 05/01/2015
MSCI EAFE Small Cap (Net) -6.83 0.30 0.30 10.17 7.30 8.54 4.65 -7.05
IM International Small Cap Equity (SA+CF) Median -6.69 1.23 1.23 11.54 9.36 10.31 6.88 -6.83
Brandes International Small Cap Rank 10 N/A N/A N/A N/A N/A N/A 35
Wellington International -7.56 -3.34 -3.34 N/A N/A N/A N/A -0.50 11/01/2013
MSCI AC World ex USA (Net) -12.17 -12.16 -12.16 2.34 1.82 3.20 3.03 -6.03
IM International Core Equity (SA+CF) Median -9.53 -6.17 -6.17 6.98 5.53 5.55 4.45 -2.09
Wellington International Rank 18 25 25 N/A N/A N/A N/A 30
The City of Hollywood Comparative Performance
As of September 30, 2015
25
The City of Hollywood Comparative Performance
As of September 30, 2015
Performance (%)
1Quarter
Oct-2014To
Sep-20151
Year3
Years5
Years7
Years10
YearsSince
InceptionInception
Date
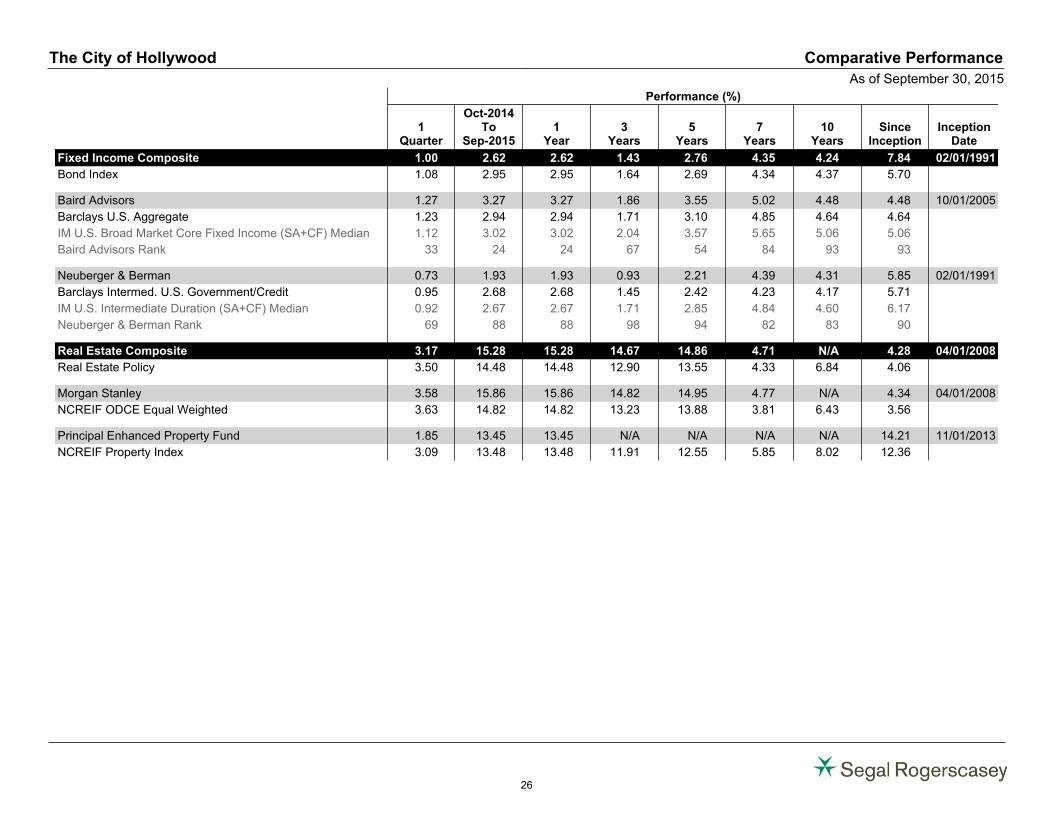
Fixed Income Composite 1.00 2.62 2.62 1.43 2.76 4.35 4.24 7.84 02/01/1991
Bond Index 1.08 2.95 2.95 1.64 2.69 4.34 4.37 5.70
Baird Advisors 1.27 3.27 3.27 1.86 3.55 5.02 4.48 4.48 10/01/2005
Barclays U.S. Aggregate 1.23 2.94 2.94 1.71 3.10 4.85 4.64 4.64
IM U.S. Broad Market Core Fixed Income (SA+CF) Median 1.12 3.02 3.02 2.04 3.57 5.65 5.06 5.06
Baird Advisors Rank 33 24 24 67 54 84 93 93
Neuberger & Berman 0.73 1.93 1.93 0.93 2.21 4.39 4.31 5.85 02/01/1991
Barclays Intermed. U.S. Government/Credit 0.95 2.68 2.68 1.45 2.42 4.23 4.17 5.71
IM U.S. Intermediate Duration (SA+CF) Median 0.92 2.67 2.67 1.71 2.85 4.84 4.60 6.17
Neuberger & Berman Rank 69 88 88 98 94 82 83 90
Real Estate Composite 3.17 15.28 15.28 14.67 14.86 4.71 N/A 4.28 04/01/2008
Real Estate Policy 3.50 14.48 14.48 12.90 13.55 4.33 6.84 4.06
Morgan Stanley 3.58 15.86 15.86 14.82 14.95 4.77 N/A 4.34 04/01/2008
NCREIF ODCE Equal Weighted 3.63 14.82 14.82 13.23 13.88 3.81 6.43 3.56
Principal Enhanced Property Fund 1.85 13.45 13.45 N/A N/A N/A N/A 14.21 11/01/2013
NCREIF Property Index 3.09 13.48 13.48 11.91 12.55 5.85 8.02 12.36
26
Performance (%)
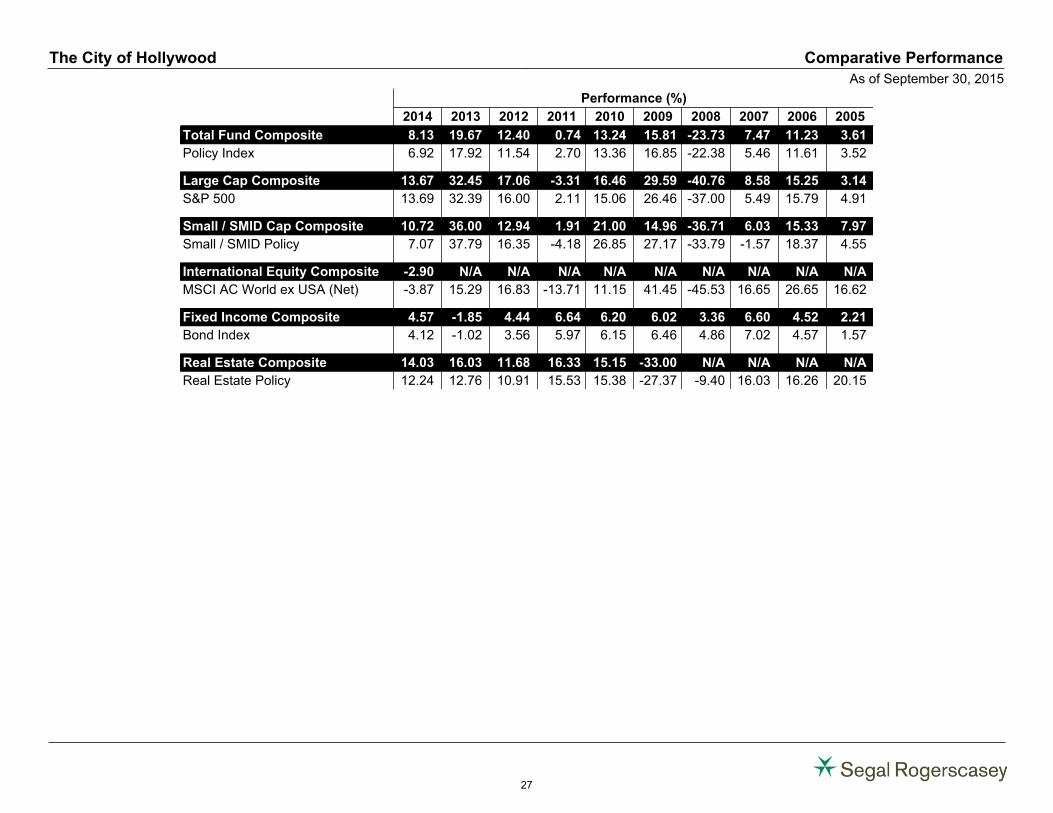
2014 2013 2012 2011 2010 2009 2008 2007 2006 2005
Total Fund Composite 8.13 19.67 12.40 0.74 13.24 15.81 -23.73 7.47 11.23 3.61
Policy Index 6.92 17.92 11.54 2.70 13.36 16.85 -22.38 5.46 11.61 3.52
Large Cap Composite 13.67 32.45 17.06 -3.31 16.46 29.59 -40.76 8.58 15.25 3.14
S&P 500 13.69 32.39 16.00 2.11 15.06 26.46 -37.00 5.49 15.79 4.91
Small / SMID Cap Composite 10.72 36.00 12.94 1.91 21.00 14.96 -36.71 6.03 15.33 7.97
Small / SMID Policy 7.07 37.79 16.35 -4.18 26.85 27.17 -33.79 -1.57 18.37 4.55
International Equity Composite -2.90 N/A N/A N/A N/A N/A N/A N/A N/A N/A
MSCI AC World ex USA (Net) -3.87 15.29 16.83 -13.71 11.15 41.45 -45.53 16.65 26.65 16.62
Fixed Income Composite 4.57 -1.85 4.44 6.64 6.20 6.02 3.36 6.60 4.52 2.21
Bond Index 4.12 -1.02 3.56 5.97 6.15 6.46 4.86 7.02 4.57 1.57
Real Estate Composite 14.03 16.03 11.68 16.33 15.15 -33.00 N/A N/A N/A N/A
Real Estate Policy 12.24 12.76 10.91 15.53 15.38 -27.37 -9.40 16.03 16.26 20.15
The City of Hollywood Comparative Performance
As of September 30, 2015
27
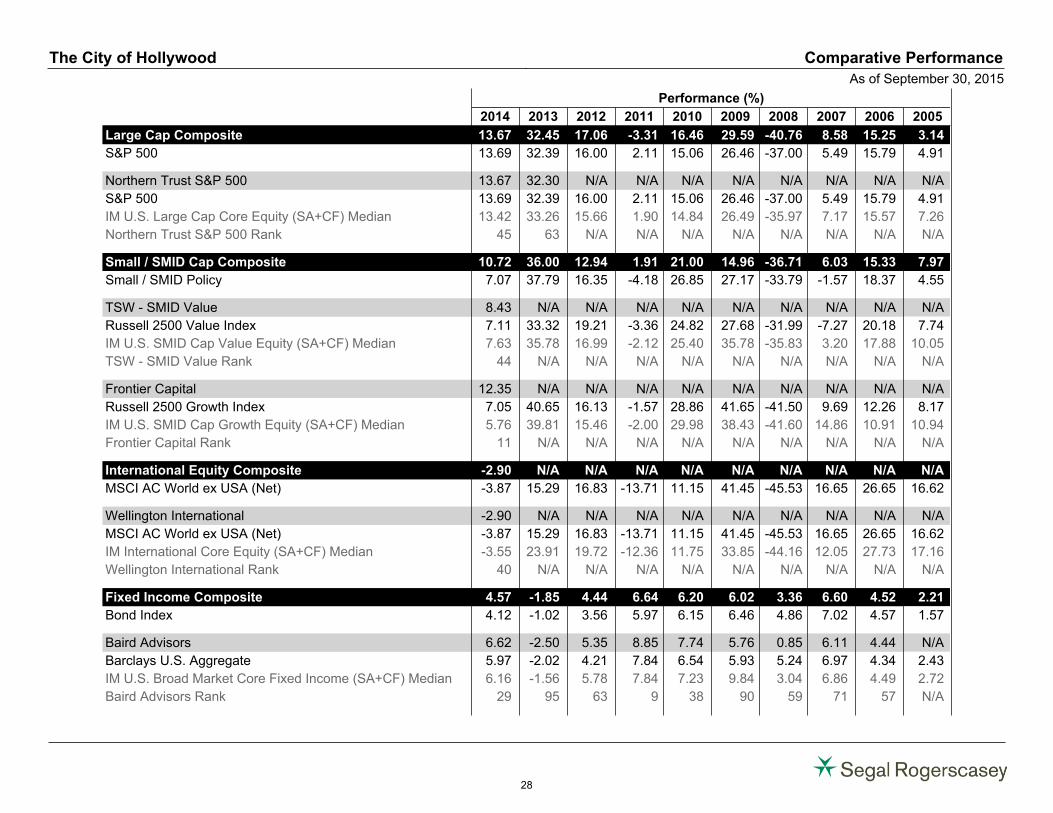
Performance (%)
2014 2013 2012 2011 2010 2009 2008 2007 2006 2005
Large Cap Composite 13.67 32.45 17.06 -3.31 16.46 29.59 -40.76 8.58 15.25 3.14
S&P 500 13.69 32.39 16.00 2.11 15.06 26.46 -37.00 5.49 15.79 4.91
Northern Trust S&P 500 13.67 32.30 N/A N/A N/A N/A N/A N/A N/A N/A
S&P 500 13.69 32.39 16.00 2.11 15.06 26.46 -37.00 5.49 15.79 4.91
IM U.S. Large Cap Core Equity (SA+CF) Median 13.42 33.26 15.66 1.90 14.84 26.49 -35.97 7.17 15.57 7.26
Northern Trust S&P 500 Rank 45 63 N/A N/A N/A N/A N/A N/A N/A N/A
Small / SMID Cap Composite 10.72 36.00 12.94 1.91 21.00 14.96 -36.71 6.03 15.33 7.97
Small / SMID Policy 7.07 37.79 16.35 -4.18 26.85 27.17 -33.79 -1.57 18.37 4.55
TSW - SMID Value 8.43 N/A N/A N/A N/A N/A N/A N/A N/A N/A
Russell 2500 Value Index 7.11 33.32 19.21 -3.36 24.82 27.68 -31.99 -7.27 20.18 7.74
IM U.S. SMID Cap Value Equity (SA+CF) Median 7.63 35.78 16.99 -2.12 25.40 35.78 -35.83 3.20 17.88 10.05
TSW - SMID Value Rank 44 N/A N/A N/A N/A N/A N/A N/A N/A N/A
Frontier Capital 12.35 N/A N/A N/A N/A N/A N/A N/A N/A N/A
Russell 2500 Growth Index 7.05 40.65 16.13 -1.57 28.86 41.65 -41.50 9.69 12.26 8.17
IM U.S. SMID Cap Growth Equity (SA+CF) Median 5.76 39.81 15.46 -2.00 29.98 38.43 -41.60 14.86 10.91 10.94
Frontier Capital Rank 11 N/A N/A N/A N/A N/A N/A N/A N/A N/A
International Equity Composite -2.90 N/A N/A N/A N/A N/A N/A N/A N/A N/A
MSCI AC World ex USA (Net) -3.87 15.29 16.83 -13.71 11.15 41.45 -45.53 16.65 26.65 16.62
Wellington International -2.90 N/A N/A N/A N/A N/A N/A N/A N/A N/A
MSCI AC World ex USA (Net) -3.87 15.29 16.83 -13.71 11.15 41.45 -45.53 16.65 26.65 16.62
IM International Core Equity (SA+CF) Median -3.55 23.91 19.72 -12.36 11.75 33.85 -44.16 12.05 27.73 17.16
Wellington International Rank 40 N/A N/A N/A N/A N/A N/A N/A N/A N/A
Fixed Income Composite 4.57 -1.85 4.44 6.64 6.20 6.02 3.36 6.60 4.52 2.21
Bond Index 4.12 -1.02 3.56 5.97 6.15 6.46 4.86 7.02 4.57 1.57
Baird Advisors 6.62 -2.50 5.35 8.85 7.74 5.76 0.85 6.11 4.44 N/A
Barclays U.S. Aggregate 5.97 -2.02 4.21 7.84 6.54 5.93 5.24 6.97 4.34 2.43
IM U.S. Broad Market Core Fixed Income (SA+CF) Median 6.16 -1.56 5.78 7.84 7.23 9.84 3.04 6.86 4.49 2.72
Baird Advisors Rank 29 95 63 9 38 90 59 71 57 N/A
The City of Hollywood Comparative Performance
As of September 30, 2015
28
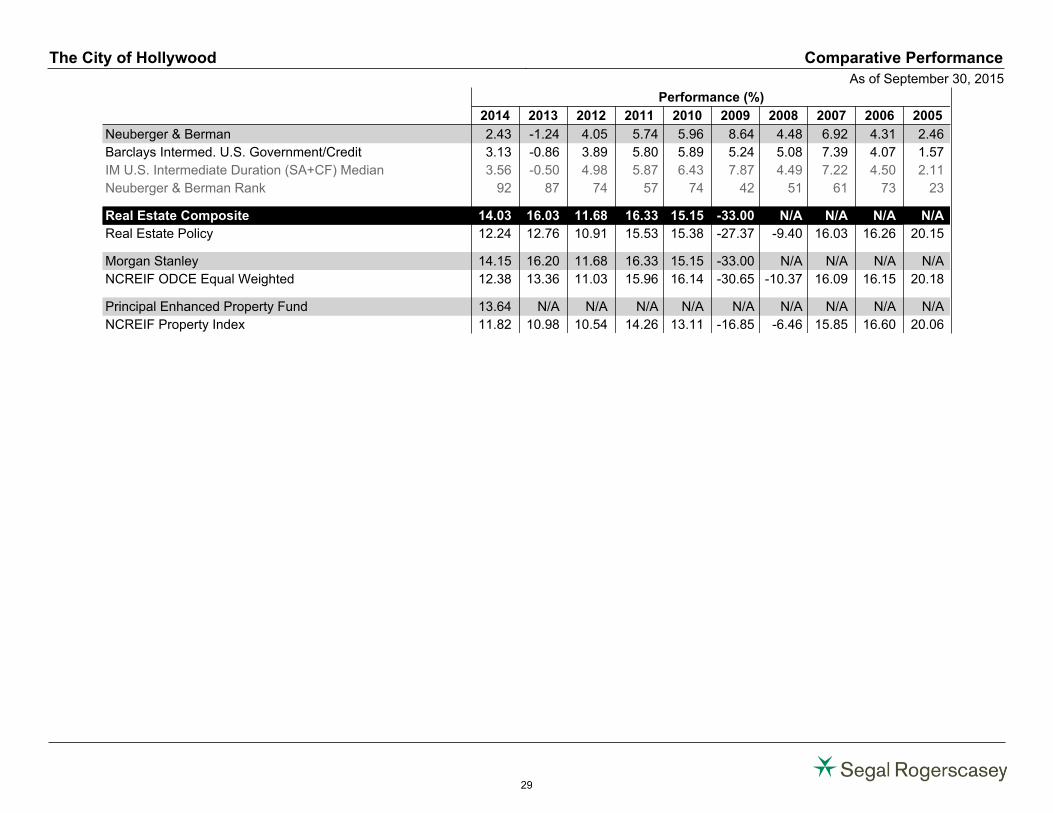
The City of Hollywood Comparative Performance
As of September 30, 2015
Performance (%)
2014 2013 2012 2011 2010 2009 2008 2007 2006 2005
Neuberger & Berman 2.43 -1.24 4.05 5.74 5.96 8.64 4.48 6.92 4.31 2.46
Barclays Intermed. U.S. Government/Credit 3.13 -0.86 3.89 5.80 5.89 5.24 5.08 7.39 4.07 1.57
IM U.S. Intermediate Duration (SA+CF) Median 3.56 -0.50 4.98 5.87 6.43 7.87 4.49 7.22 4.50 2.11
Neuberger & Berman Rank 92 87 74 57 74 42 51 61 73 23
Real Estate Composite 14.03 16.03 11.68 16.33 15.15 -33.00 N/A N/A N/A N/A
Real Estate Policy 12.24 12.76 10.91 15.53 15.38 -27.37 -9.40 16.03 16.26 20.15
Morgan Stanley 14.15 16.20 11.68 16.33 15.15 -33.00 N/A N/A N/A N/A
NCREIF ODCE Equal Weighted 12.38 13.36 11.03 15.96 16.14 -30.65 -10.37 16.09 16.15 20.18
Principal Enhanced Property Fund 13.64 N/A N/A N/A N/A N/A N/A N/A N/A N/A
NCREIF Property Index 11.82 10.98 10.54 14.26 13.11 -16.85 -6.46 15.85 16.60 20.06
29
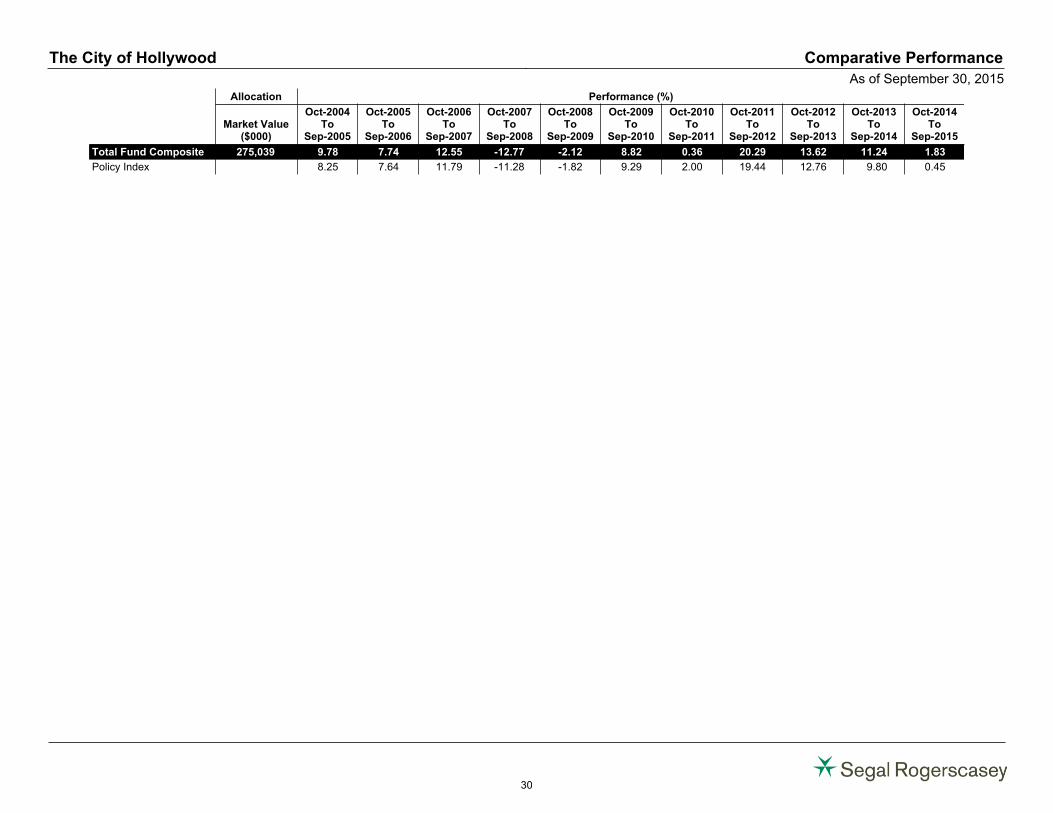
Allocation
Market Value($000)
Performance (%)
Oct-2004To
Sep-2005
Oct-2005To
Sep-2006
Oct-2006To
Sep-2007
Oct-2007To
Sep-2008
Oct-2008To
Sep-2009
Oct-2009To
Sep-2010
Oct-2010To
Sep-2011
Oct-2011To
Sep-2012
Oct-2012To
Sep-2013
Oct-2013To
Sep-2014
Oct-2014To
Sep-2015
Total Fund Composite 275,039 9.78 7.74 12.55 -12.77 -2.12 8.82 0.36 20.29 13.62 11.24 1.83
Policy Index 8.25 7.64 11.79 -11.28 -1.82 9.29 2.00 19.44 12.76 9.80 0.45
The City of Hollywood Comparative Performance
As of September 30, 2015
30
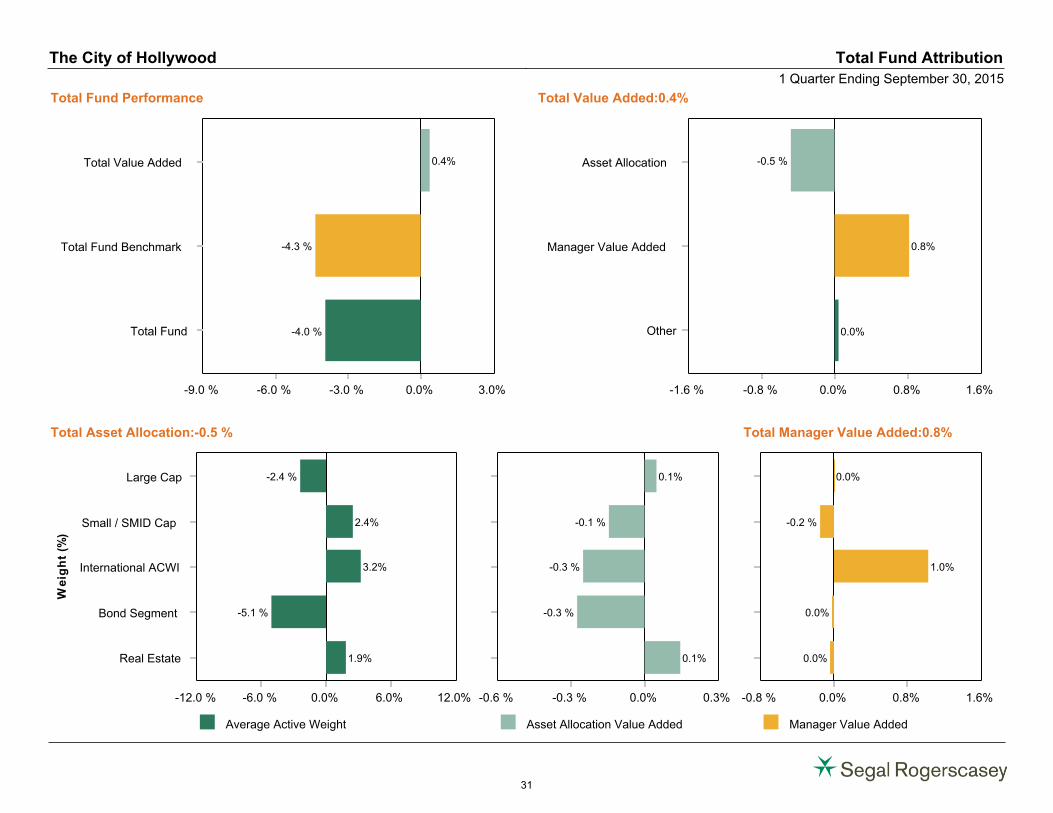
Total Fund Performance
0.0% 3.0%-3.0 %-6.0 %-9.0 %
Total Fund
Total Fund Benchmark
Total Value Added
-4.0 %
-4.3 %
0.4%
Total Value Added:0.4%
0.0% 0.8% 1.6%-0.8 %-1.6 %
Other
Manager Value Added
Asset Allocation
0.0%
0.8%
-0.5 %
Total Asset Allocation:-0.5 %
Average Active Weight
0.0% 6.0% 12.0%-6.0 %-12.0 %
Real Estate
Bond Segment
International ACWI
Small / SMID Cap
Large Cap
We
igh
t
(%)
1.9%
-5.1 %
3.2%
2.4%
-2.4 %
Asset Allocation Value Added
0.0% 0.3%-0.3 %-0.6 %
0.1%
-0.3 %
-0.3 %
-0.1 %
0.1%
Total Manager Value Added:0.8%
Manager Value Added
0.0% 0.8% 1.6%-0.8 %
0.0%
0.0%
1.0%
-0.2 %
0.0%
The City of Hollywood Total Fund Attribution
1 Quarter Ending September 30, 2015
31
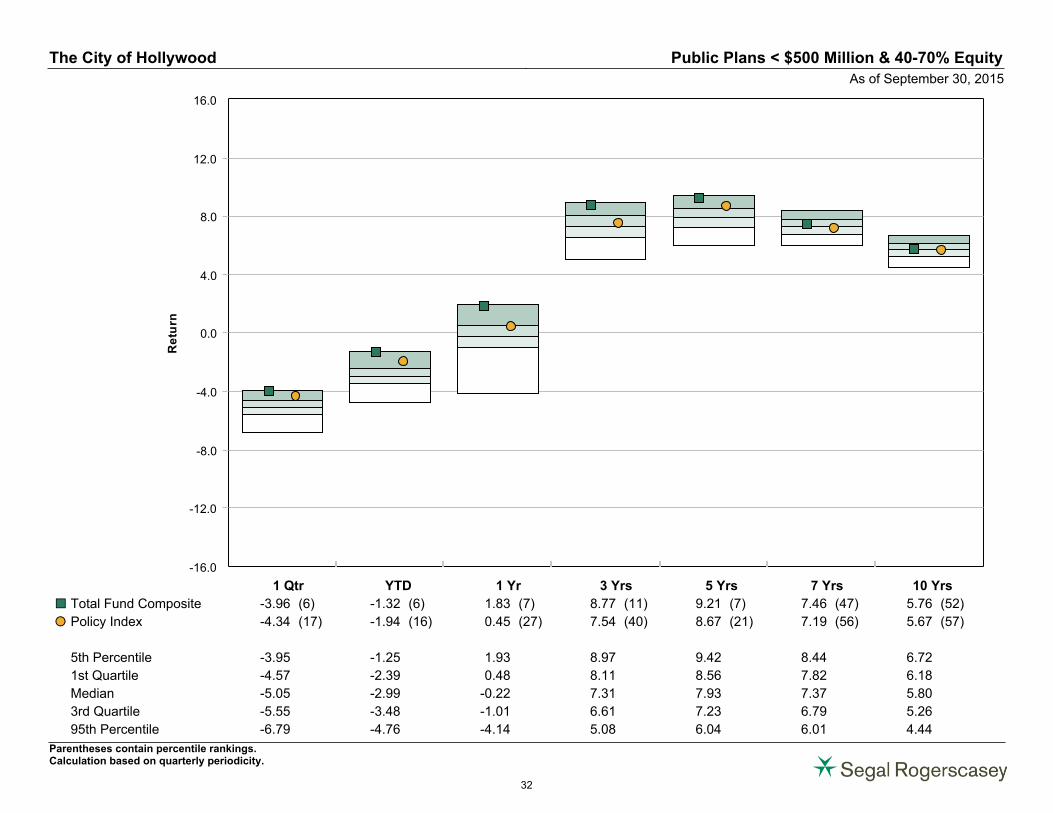
-16.0
-12.0
-8.0
-4.0
0.0
4.0
8.0
12.0
16.0
Re
turn
1 Qtr YTD 1 Yr 3 Yrs 5 Yrs 7 Yrs 10 Yrs
Total Fund Composite -3.96 (6) -1.32 (6) 1.83 (7) 8.77 (11) 9.21 (7) 7.46 (47) 5.76 (52)¢£
Policy Index -4.34 (17) -1.94 (16) 0.45 (27) 7.54 (40) 8.67 (21) 7.19 (56) 5.67 (57)�
5th Percentile -3.95 -1.25 1.93 8.97 9.42 8.44 6.72
1st Quartile -4.57 -2.39 0.48 8.11 8.56 7.82 6.18
Median -5.05 -2.99 -0.22 7.31 7.93 7.37 5.80
3rd Quartile -5.55 -3.48 -1.01 6.61 7.23 6.79 5.26
95th Percentile -6.79 -4.76 -4.14 5.08 6.04 6.01 4.44
The City of Hollywood Public Plans < $500 Million & 40-70% Equity
As of September 30, 2015
Parentheses contain percentile rankings.Calculation based on quarterly periodicity.
32
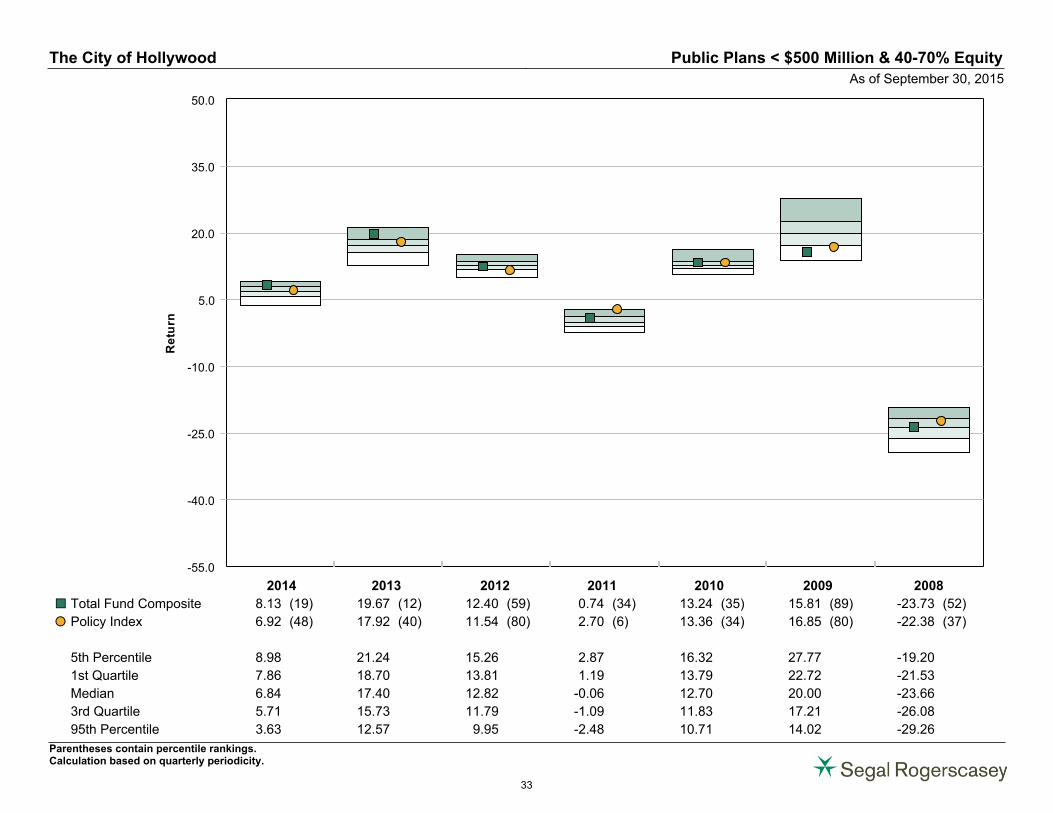
-55.0
-40.0
-25.0
-10.0
5.0
20.0
35.0
50.0
Re
turn
2014 2013 2012 2011 2010 2009 2008
Total Fund Composite 8.13 (19) 19.67 (12) 12.40 (59) 0.74 (34) 13.24 (35) 15.81 (89) -23.73 (52)¢£
Policy Index 6.92 (48) 17.92 (40) 11.54 (80) 2.70 (6) 13.36 (34) 16.85 (80) -22.38 (37)�
5th Percentile 8.98 21.24 15.26 2.87 16.32 27.77 -19.20
1st Quartile 7.86 18.70 13.81 1.19 13.79 22.72 -21.53
Median 6.84 17.40 12.82 -0.06 12.70 20.00 -23.66
3rd Quartile 5.71 15.73 11.79 -1.09 11.83 17.21 -26.08
95th Percentile 3.63 12.57 9.95 -2.48 10.71 14.02 -29.26
The City of Hollywood Public Plans < $500 Million & 40-70% Equity
As of September 30, 2015
Parentheses contain percentile rankings.Calculation based on quarterly periodicity.
33
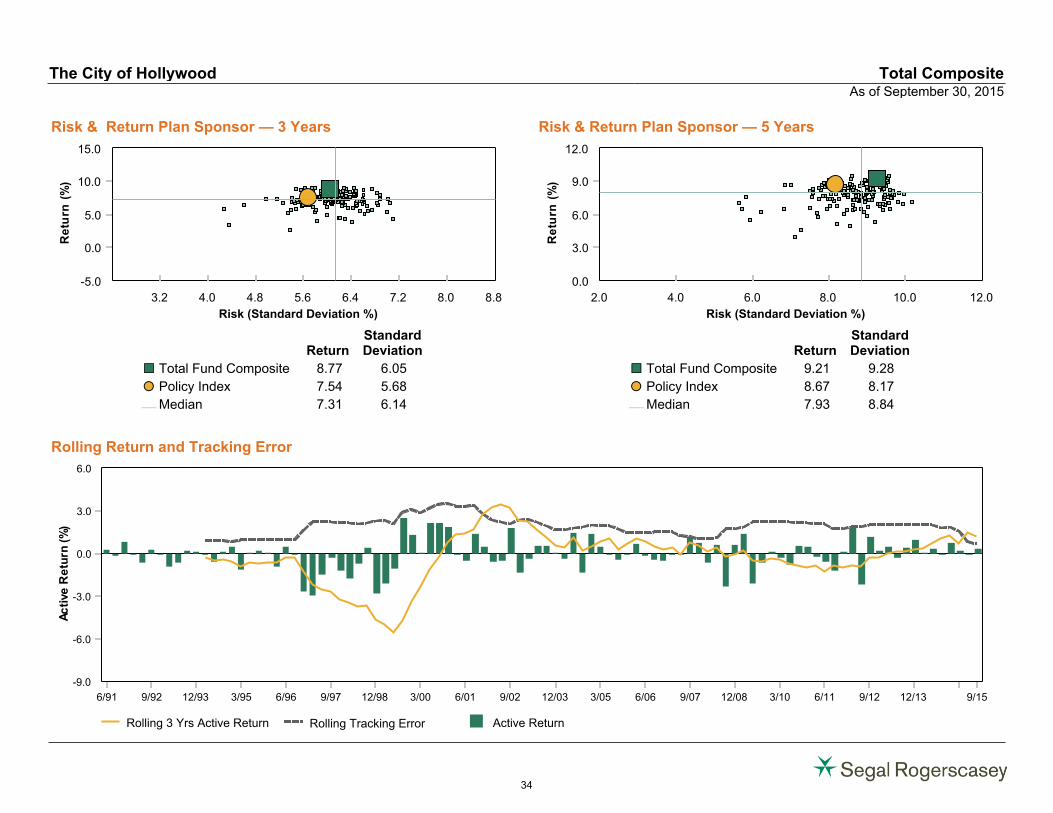
Risk & Return Plan Sponsor — 3 Years Risk & Return Plan Sponsor — 5 Years
Rolling Return and Tracking Error
-5.0
0.0
5.0
10.0
15.0
Re
turn
(%)
3.2 4.0 4.8 5.6 6.4 7.2 8.0 8.8
Risk (Standard Deviation %)
ReturnStandardDeviation
Total Fund Composite 8.77 6.05¢£
Policy Index 7.54 5.68�
Median 7.31 6.14¾
0.0
3.0
6.0
9.0
12.0
Re
turn
(%)
2.0 4.0 6.0 8.0 10.0 12.0
Risk (Standard Deviation %)
ReturnStandardDeviation
Total Fund Composite 9.21 9.28¢£
Policy Index 8.67 8.17�
Median 7.93 8.84¾
Rolling 3 Yrs Active Return Rolling Tracking Error Active Return
0.0
3.0
6.0
-3.0
-6.0
-9.0
Ac
tive
Re
turn
(%)
6/91 9/92 12/93 3/95 6/96 9/97 12/98 3/00 6/01 9/02 12/03 3/05 6/06 9/07 12/08 3/10 6/11 9/12 12/13 9/15
The City of Hollywood Total CompositeAs of September 30, 2015
34
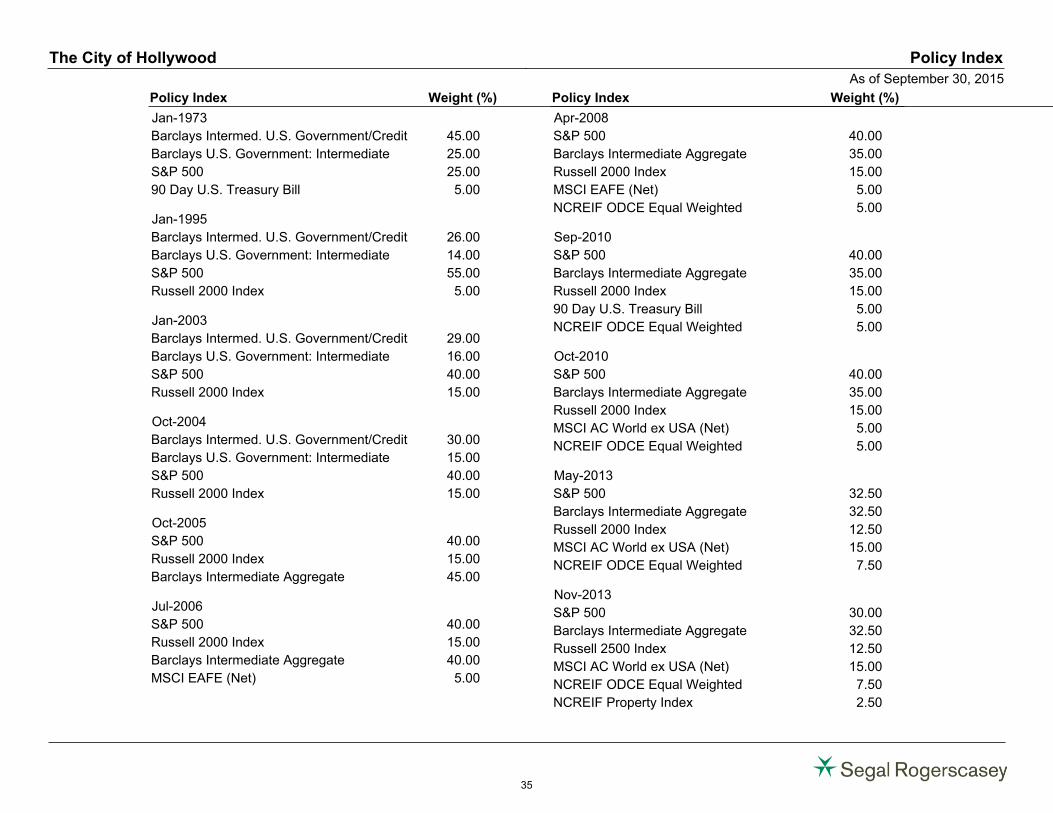
Policy Index Weight (%)
Jan-1973
Barclays Intermed. U.S. Government/Credit 45.00
Barclays U.S. Government: Intermediate 25.00
S&P 500 25.00
90 Day U.S. Treasury Bill 5.00
Jan-1995
Barclays Intermed. U.S. Government/Credit 26.00
Barclays U.S. Government: Intermediate 14.00
S&P 500 55.00
Russell 2000 Index 5.00
Jan-2003
Barclays Intermed. U.S. Government/Credit 29.00
Barclays U.S. Government: Intermediate 16.00
S&P 500 40.00
Russell 2000 Index 15.00
Oct-2004
Barclays Intermed. U.S. Government/Credit 30.00
Barclays U.S. Government: Intermediate 15.00
S&P 500 40.00
Russell 2000 Index 15.00
Oct-2005
S&P 500 40.00
Russell 2000 Index 15.00
Barclays Intermediate Aggregate 45.00
Jul-2006
S&P 500 40.00
Russell 2000 Index 15.00
Barclays Intermediate Aggregate 40.00
MSCI EAFE (Net) 5.00
Policy Index Weight (%)
Apr-2008
S&P 500 40.00
Barclays Intermediate Aggregate 35.00
Russell 2000 Index 15.00
MSCI EAFE (Net) 5.00
NCREIF ODCE Equal Weighted 5.00
Sep-2010
S&P 500 40.00
Barclays Intermediate Aggregate 35.00
Russell 2000 Index 15.00
90 Day U.S. Treasury Bill 5.00
NCREIF ODCE Equal Weighted 5.00
Oct-2010
S&P 500 40.00
Barclays Intermediate Aggregate 35.00
Russell 2000 Index 15.00
MSCI AC World ex USA (Net) 5.00
NCREIF ODCE Equal Weighted 5.00
May-2013
S&P 500 32.50
Barclays Intermediate Aggregate 32.50
Russell 2000 Index 12.50
MSCI AC World ex USA (Net) 15.00
NCREIF ODCE Equal Weighted 7.50
Nov-2013
S&P 500 30.00
Barclays Intermediate Aggregate 32.50
Russell 2500 Index 12.50
MSCI AC World ex USA (Net) 15.00
NCREIF ODCE Equal Weighted 7.50
NCREIF Property Index 2.50
The City of Hollywood Policy Index
As of September 30, 2015
35
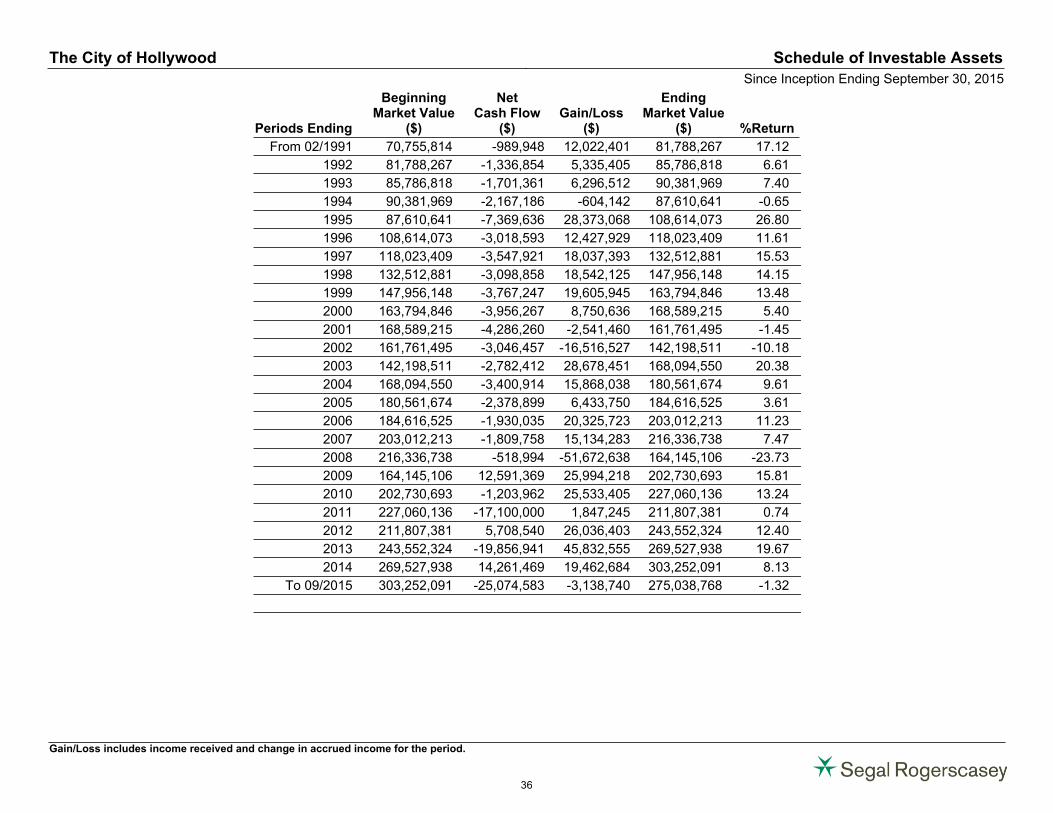
Periods Ending
BeginningMarket Value
($)
NetCash Flow
($)Gain/Loss
($)
EndingMarket Value
($) %Return
From 02/1991 70,755,814 -989,948 12,022,401 81,788,267 17.12
1992 81,788,267 -1,336,854 5,335,405 85,786,818 6.61
1993 85,786,818 -1,701,361 6,296,512 90,381,969 7.40
1994 90,381,969 -2,167,186 -604,142 87,610,641 -0.65
1995 87,610,641 -7,369,636 28,373,068 108,614,073 26.80
1996 108,614,073 -3,018,593 12,427,929 118,023,409 11.61
1997 118,023,409 -3,547,921 18,037,393 132,512,881 15.53
1998 132,512,881 -3,098,858 18,542,125 147,956,148 14.15
1999 147,956,148 -3,767,247 19,605,945 163,794,846 13.48
2000 163,794,846 -3,956,267 8,750,636 168,589,215 5.40
2001 168,589,215 -4,286,260 -2,541,460 161,761,495 -1.45
2002 161,761,495 -3,046,457 -16,516,527 142,198,511 -10.18
2003 142,198,511 -2,782,412 28,678,451 168,094,550 20.38
2004 168,094,550 -3,400,914 15,868,038 180,561,674 9.61
2005 180,561,674 -2,378,899 6,433,750 184,616,525 3.61
2006 184,616,525 -1,930,035 20,325,723 203,012,213 11.23
2007 203,012,213 -1,809,758 15,134,283 216,336,738 7.47
2008 216,336,738 -518,994 -51,672,638 164,145,106 -23.73
2009 164,145,106 12,591,369 25,994,218 202,730,693 15.81
2010 202,730,693 -1,203,962 25,533,405 227,060,136 13.24
2011 227,060,136 -17,100,000 1,847,245 211,807,381 0.74
2012 211,807,381 5,708,540 26,036,403 243,552,324 12.40
2013 243,552,324 -19,856,941 45,832,555 269,527,938 19.67
2014 269,527,938 14,261,469 19,462,684 303,252,091 8.13
To 09/2015 303,252,091 -25,074,583 -3,138,740 275,038,768 -1.32
70,755,814 -81,781,707 286,064,661 275,038,768 522.24
The City of Hollywood Schedule of Investable Assets
Since Inception Ending September 30, 2015
Gain/Loss includes income received and change in accrued income for the period.
36

Domestic Equity
37
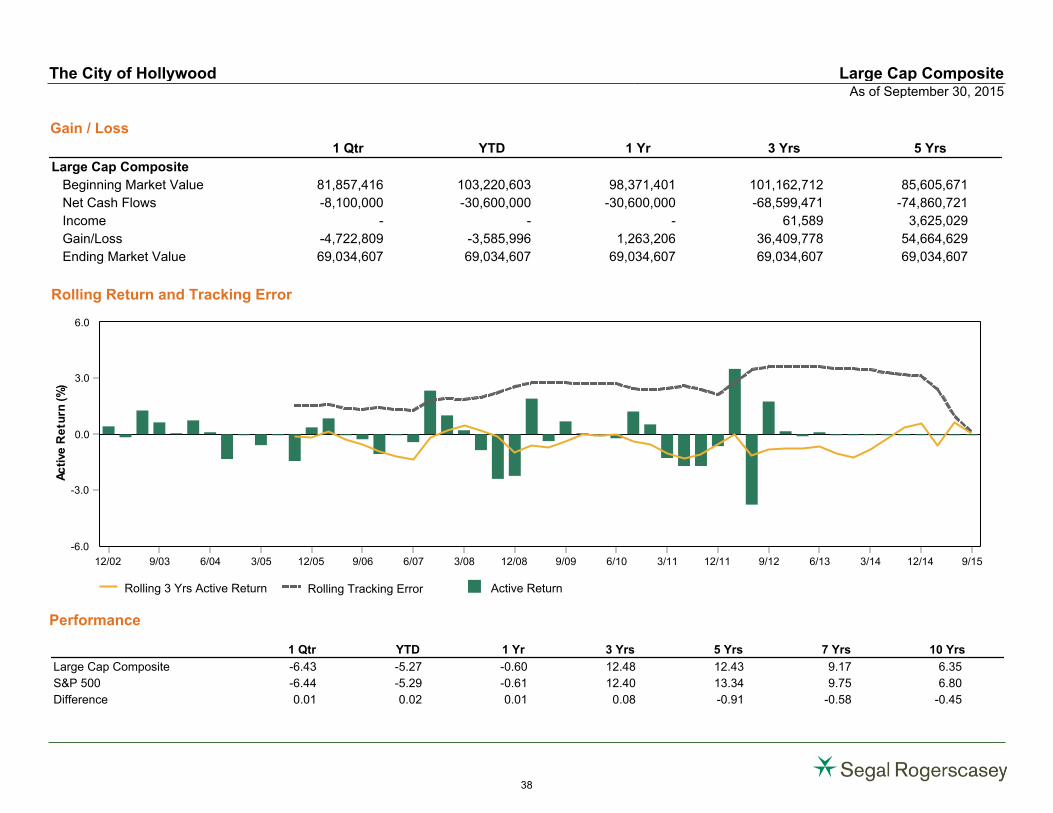
Rolling Return and Tracking Error
Performance
Gain / Loss
1 Qtr YTD 1 Yr 3 Yrs 5 Yrs
Large Cap Composite
Beginning Market Value 81,857,416 103,220,603 98,371,401 101,162,712 85,605,671
Net Cash Flows -8,100,000 -30,600,000 -30,600,000 -68,599,471 -74,860,721
Income - - - 61,589 3,625,029
Gain/Loss -4,722,809 -3,585,996 1,263,206 36,409,778 54,664,629
Ending Market Value 69,034,607 69,034,607 69,034,607 69,034,607 69,034,607
Rolling 3 Yrs Active Return Rolling Tracking Error Active Return
0.0
3.0
6.0
-3.0
-6.0
Ac
tive
Re
turn
(%)
12/02 9/03 6/04 3/05 12/05 9/06 6/07 3/08 12/08 9/09 6/10 3/11 12/11 9/12 6/13 3/14 12/14 9/15
1 Qtr YTD 1 Yr 3 Yrs 5 Yrs 7 Yrs 10 Yrs
Large Cap Composite -6.43 -5.27 -0.60 12.48 12.43 9.17 6.35
S&P 500 -6.44 -5.29 -0.61 12.40 13.34 9.75 6.80
Difference 0.01 0.02 0.01 0.08 -0.91 -0.58 -0.45
The City of Hollywood Large Cap CompositeAs of September 30, 2015
38
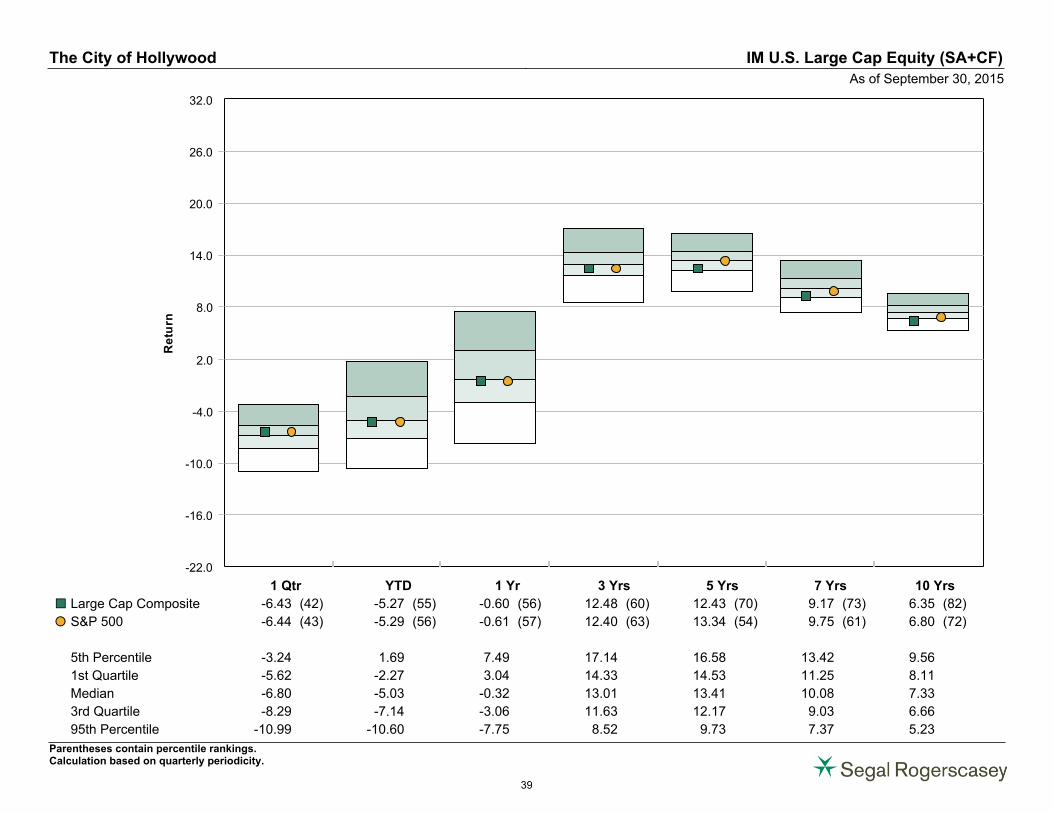
-22.0
-16.0
-10.0
-4.0
2.0
8.0
14.0
20.0
26.0
32.0
Re
turn
1 Qtr YTD 1 Yr 3 Yrs 5 Yrs 7 Yrs 10 Yrs
Large Cap Composite -6.43 (42) -5.27 (55) -0.60 (56) 12.48 (60) 12.43 (70) 9.17 (73) 6.35 (82)¢£
S&P 500 -6.44 (43) -5.29 (56) -0.61 (57) 12.40 (63) 13.34 (54) 9.75 (61) 6.80 (72)�
5th Percentile -3.24 1.69 7.49 17.14 16.58 13.42 9.56
1st Quartile -5.62 -2.27 3.04 14.33 14.53 11.25 8.11
Median -6.80 -5.03 -0.32 13.01 13.41 10.08 7.33
3rd Quartile -8.29 -7.14 -3.06 11.63 12.17 9.03 6.66
95th Percentile -10.99 -10.60 -7.75 8.52 9.73 7.37 5.23
The City of Hollywood IM U.S. Large Cap Equity (SA+CF)
As of September 30, 2015
Parentheses contain percentile rankings.Calculation based on quarterly periodicity.
39
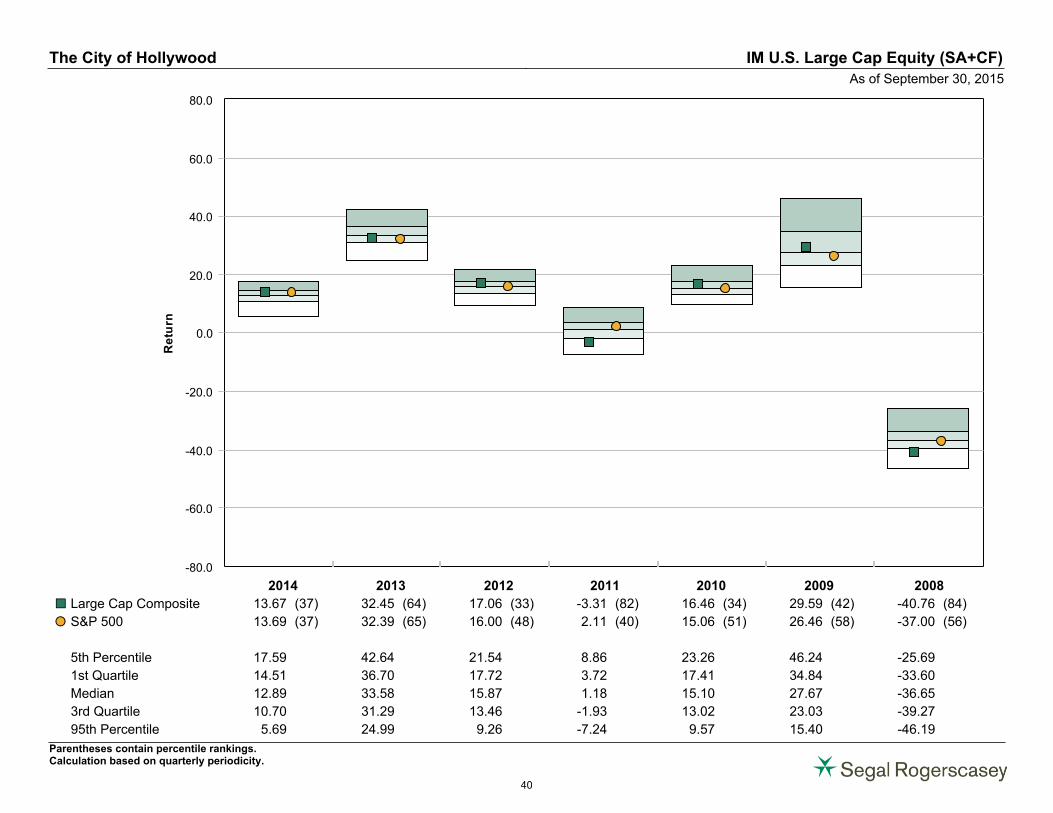
-80.0
-60.0
-40.0
-20.0
0.0
20.0
40.0
60.0
80.0
Re
turn
2014 2013 2012 2011 2010 2009 2008
Large Cap Composite 13.67 (37) 32.45 (64) 17.06 (33) -3.31 (82) 16.46 (34) 29.59 (42) -40.76 (84)¢£
S&P 500 13.69 (37) 32.39 (65) 16.00 (48) 2.11 (40) 15.06 (51) 26.46 (58) -37.00 (56)�
5th Percentile 17.59 42.64 21.54 8.86 23.26 46.24 -25.69
1st Quartile 14.51 36.70 17.72 3.72 17.41 34.84 -33.60
Median 12.89 33.58 15.87 1.18 15.10 27.67 -36.65
3rd Quartile 10.70 31.29 13.46 -1.93 13.02 23.03 -39.27
95th Percentile 5.69 24.99 9.26 -7.24 9.57 15.40 -46.19
The City of Hollywood IM U.S. Large Cap Equity (SA+CF)
As of September 30, 2015
Parentheses contain percentile rankings.Calculation based on quarterly periodicity.
40
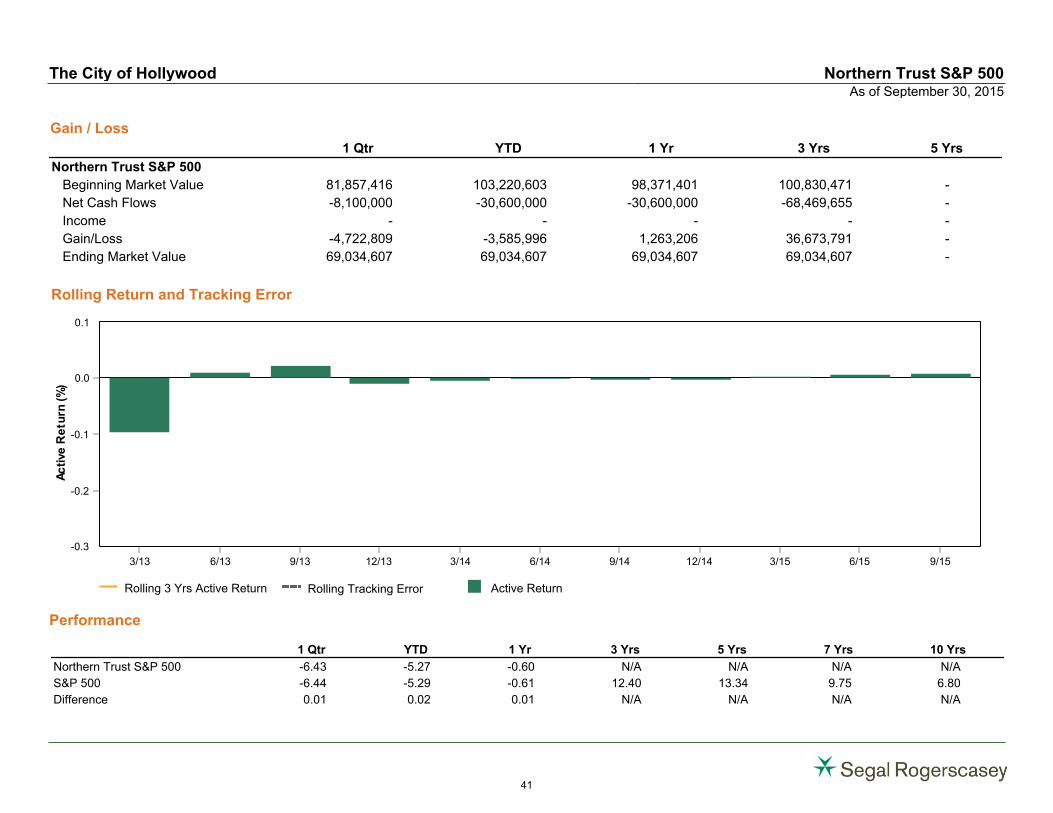
Rolling Return and Tracking Error
Performance
Gain / Loss
1 Qtr YTD 1 Yr 3 Yrs 5 Yrs
Northern Trust S&P 500
Beginning Market Value 81,857,416 103,220,603 98,371,401 100,830,471 -
Net Cash Flows -8,100,000 -30,600,000 -30,600,000 -68,469,655 -
Income - - - - -
Gain/Loss -4,722,809 -3,585,996 1,263,206 36,673,791 -
Ending Market Value 69,034,607 69,034,607 69,034,607 69,034,607 -
Rolling 3 Yrs Active Return Rolling Tracking Error Active Return
0.0
0.1
-0.1
-0.2
-0.3
Ac
tive
Re
turn
(%)
3/13 6/13 9/13 12/13 3/14 6/14 9/14 12/14 3/15 6/15 9/15
1 Qtr YTD 1 Yr 3 Yrs 5 Yrs 7 Yrs 10 Yrs
Northern Trust S&P 500 -6.43 -5.27 -0.60 N/A N/A N/A N/A
S&P 500 -6.44 -5.29 -0.61 12.40 13.34 9.75 6.80
Difference 0.01 0.02 0.01 N/A N/A N/A N/A
The City of Hollywood Northern Trust S&P 500As of September 30, 2015
41
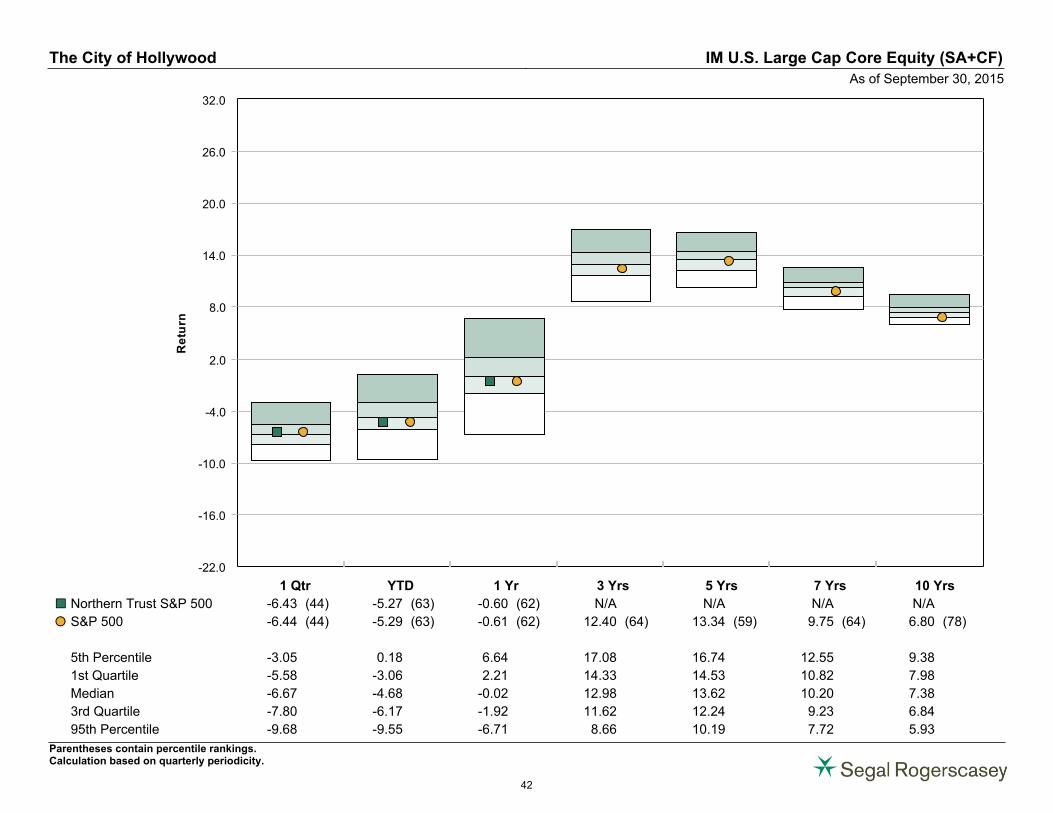
-22.0
-16.0
-10.0
-4.0
2.0
8.0
14.0
20.0
26.0
32.0
Re
turn
1 Qtr YTD 1 Yr 3 Yrs 5 Yrs 7 Yrs 10 Yrs
Northern Trust S&P 500 -6.43 (44) -5.27 (63) -0.60 (62) N/A N/A N/A N/A¢£
S&P 500 -6.44 (44) -5.29 (63) -0.61 (62) 12.40 (64) 13.34 (59) 9.75 (64) 6.80 (78)�
5th Percentile -3.05 0.18 6.64 17.08 16.74 12.55 9.38
1st Quartile -5.58 -3.06 2.21 14.33 14.53 10.82 7.98
Median -6.67 -4.68 -0.02 12.98 13.62 10.20 7.38
3rd Quartile -7.80 -6.17 -1.92 11.62 12.24 9.23 6.84
95th Percentile -9.68 -9.55 -6.71 8.66 10.19 7.72 5.93
The City of Hollywood IM U.S. Large Cap Core Equity (SA+CF)
As of September 30, 2015
Parentheses contain percentile rankings.Calculation based on quarterly periodicity.
42
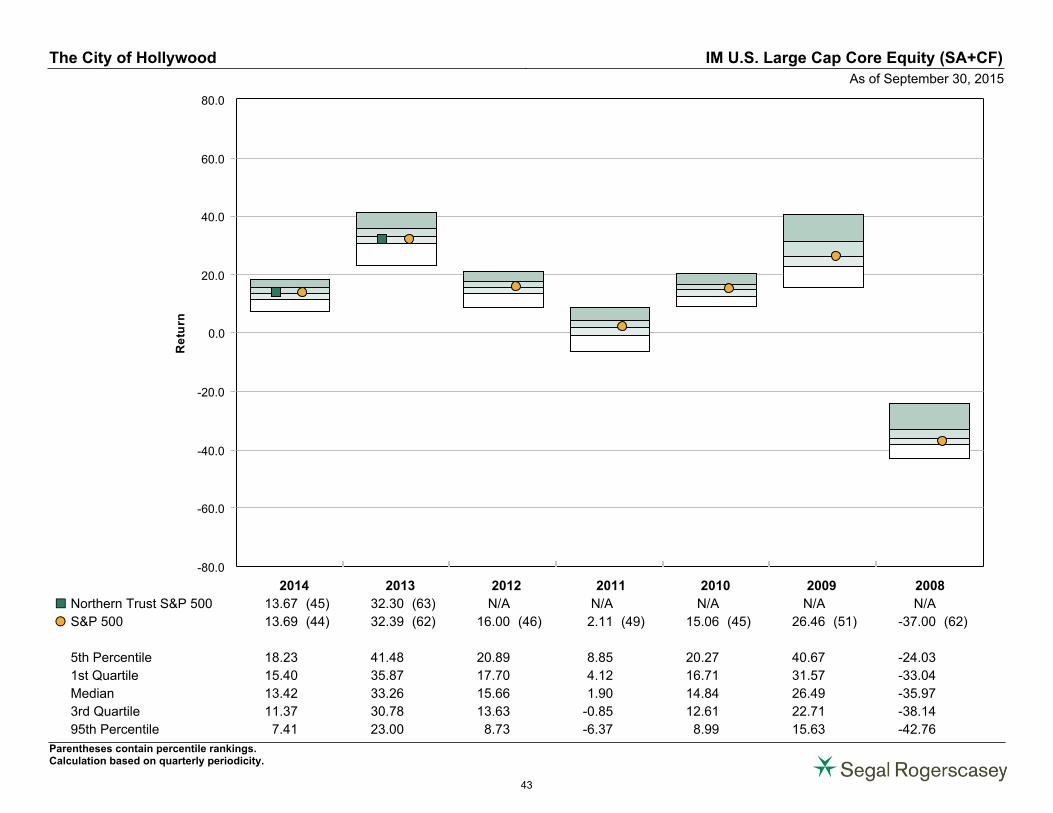
-80.0
-60.0
-40.0
-20.0
0.0
20.0
40.0
60.0
80.0
Re
turn
2014 2013 2012 2011 2010 2009 2008
Northern Trust S&P 500 13.67 (45) 32.30 (63) N/A N/A N/A N/A N/A¢£
S&P 500 13.69 (44) 32.39 (62) 16.00 (46) 2.11 (49) 15.06 (45) 26.46 (51) -37.00 (62)�
5th Percentile 18.23 41.48 20.89 8.85 20.27 40.67 -24.03
1st Quartile 15.40 35.87 17.70 4.12 16.71 31.57 -33.04
Median 13.42 33.26 15.66 1.90 14.84 26.49 -35.97
3rd Quartile 11.37 30.78 13.63 -0.85 12.61 22.71 -38.14
95th Percentile 7.41 23.00 8.73 -6.37 8.99 15.63 -42.76
The City of Hollywood IM U.S. Large Cap Core Equity (SA+CF)
As of September 30, 2015
Parentheses contain percentile rankings.Calculation based on quarterly periodicity.
43
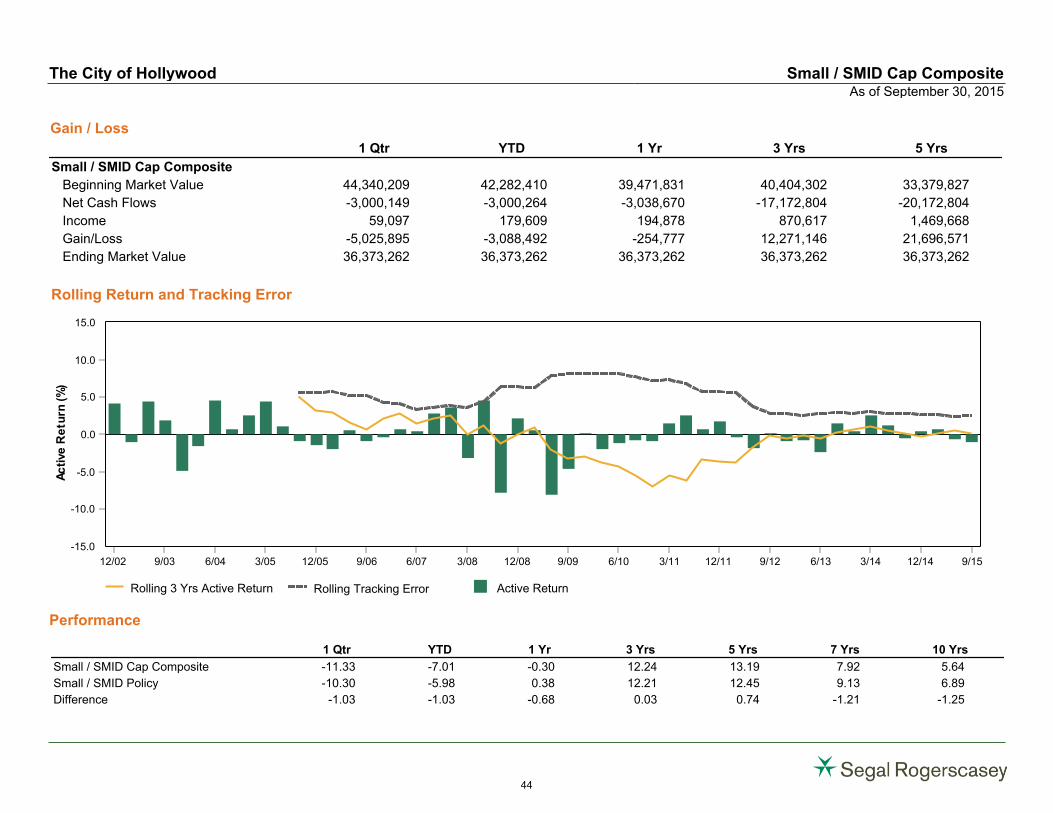
Rolling Return and Tracking Error
Performance
Gain / Loss
1 Qtr YTD 1 Yr 3 Yrs 5 Yrs
Small / SMID Cap Composite
Beginning Market Value 44,340,209 42,282,410 39,471,831 40,404,302 33,379,827
Net Cash Flows -3,000,149 -3,000,264 -3,038,670 -17,172,804 -20,172,804
Income 59,097 179,609 194,878 870,617 1,469,668
Gain/Loss -5,025,895 -3,088,492 -254,777 12,271,146 21,696,571
Ending Market Value 36,373,262 36,373,262 36,373,262 36,373,262 36,373,262
Rolling 3 Yrs Active Return Rolling Tracking Error Active Return
0.0
5.0
10.0
15.0
-5.0
-10.0
-15.0
Ac
tive
Re
turn
(%)
12/02 9/03 6/04 3/05 12/05 9/06 6/07 3/08 12/08 9/09 6/10 3/11 12/11 9/12 6/13 3/14 12/14 9/15
1 Qtr YTD 1 Yr 3 Yrs 5 Yrs 7 Yrs 10 Yrs
Small / SMID Cap Composite -11.33 -7.01 -0.30 12.24 13.19 7.92 5.64
Small / SMID Policy -10.30 -5.98 0.38 12.21 12.45 9.13 6.89
Difference -1.03 -1.03 -0.68 0.03 0.74 -1.21 -1.25
The City of Hollywood Small / SMID Cap CompositeAs of September 30, 2015
44
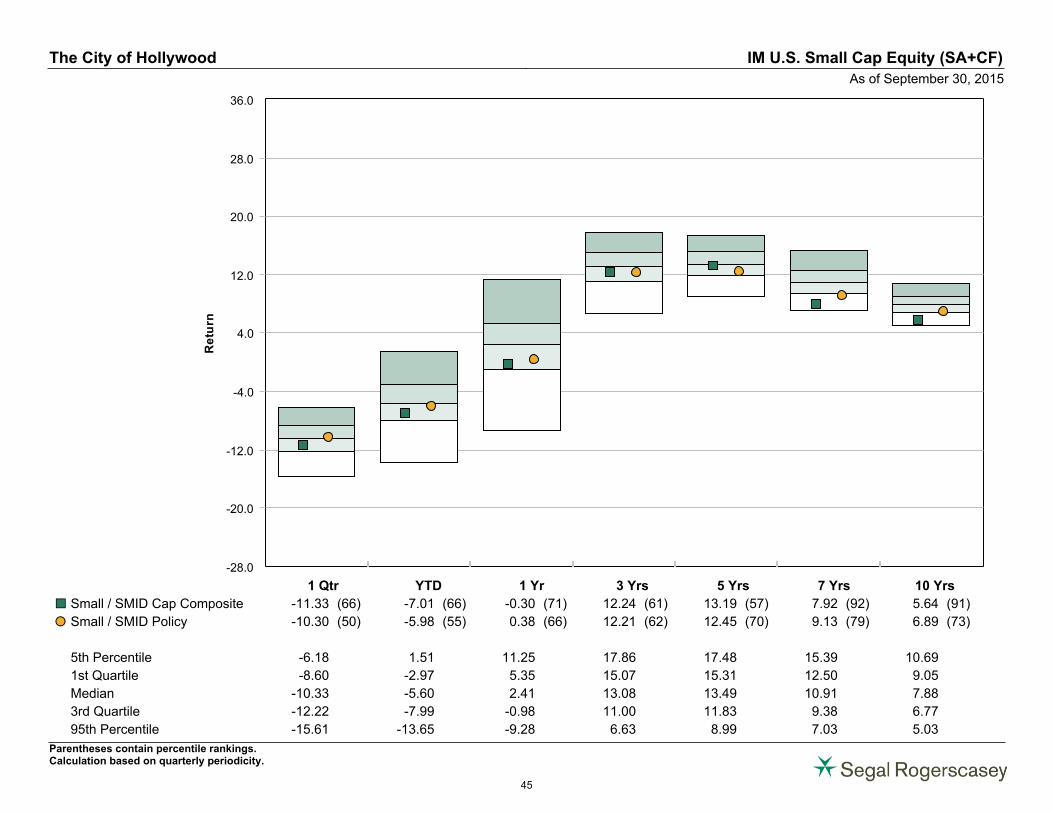
-28.0
-20.0
-12.0
-4.0
4.0
12.0
20.0
28.0
36.0
Re
turn
1 Qtr YTD 1 Yr 3 Yrs 5 Yrs 7 Yrs 10 Yrs
Small / SMID Cap Composite -11.33 (66) -7.01 (66) -0.30 (71) 12.24 (61) 13.19 (57) 7.92 (92) 5.64 (91)¢£
Small / SMID Policy -10.30 (50) -5.98 (55) 0.38 (66) 12.21 (62) 12.45 (70) 9.13 (79) 6.89 (73)�
5th Percentile -6.18 1.51 11.25 17.86 17.48 15.39 10.69
1st Quartile -8.60 -2.97 5.35 15.07 15.31 12.50 9.05
Median -10.33 -5.60 2.41 13.08 13.49 10.91 7.88
3rd Quartile -12.22 -7.99 -0.98 11.00 11.83 9.38 6.77
95th Percentile -15.61 -13.65 -9.28 6.63 8.99 7.03 5.03
The City of Hollywood IM U.S. Small Cap Equity (SA+CF)
As of September 30, 2015
Parentheses contain percentile rankings.Calculation based on quarterly periodicity.
45
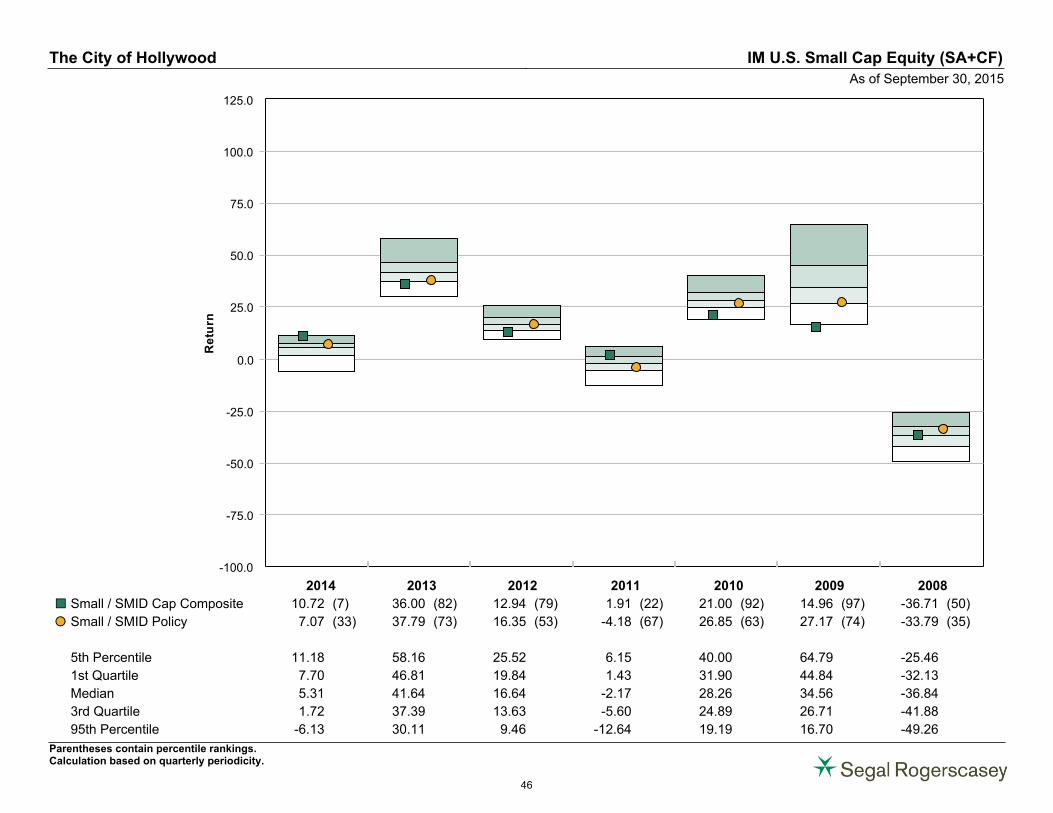
-100.0
-75.0
-50.0
-25.0
0.0
25.0
50.0
75.0
100.0
125.0
Re
turn
2014 2013 2012 2011 2010 2009 2008
Small / SMID Cap Composite 10.72 (7) 36.00 (82) 12.94 (79) 1.91 (22) 21.00 (92) 14.96 (97) -36.71 (50)¢£
Small / SMID Policy 7.07 (33) 37.79 (73) 16.35 (53) -4.18 (67) 26.85 (63) 27.17 (74) -33.79 (35)�
5th Percentile 11.18 58.16 25.52 6.15 40.00 64.79 -25.46
1st Quartile 7.70 46.81 19.84 1.43 31.90 44.84 -32.13
Median 5.31 41.64 16.64 -2.17 28.26 34.56 -36.84
3rd Quartile 1.72 37.39 13.63 -5.60 24.89 26.71 -41.88
95th Percentile -6.13 30.11 9.46 -12.64 19.19 16.70 -49.26
The City of Hollywood IM U.S. Small Cap Equity (SA+CF)
As of September 30, 2015
Parentheses contain percentile rankings.Calculation based on quarterly periodicity.
46
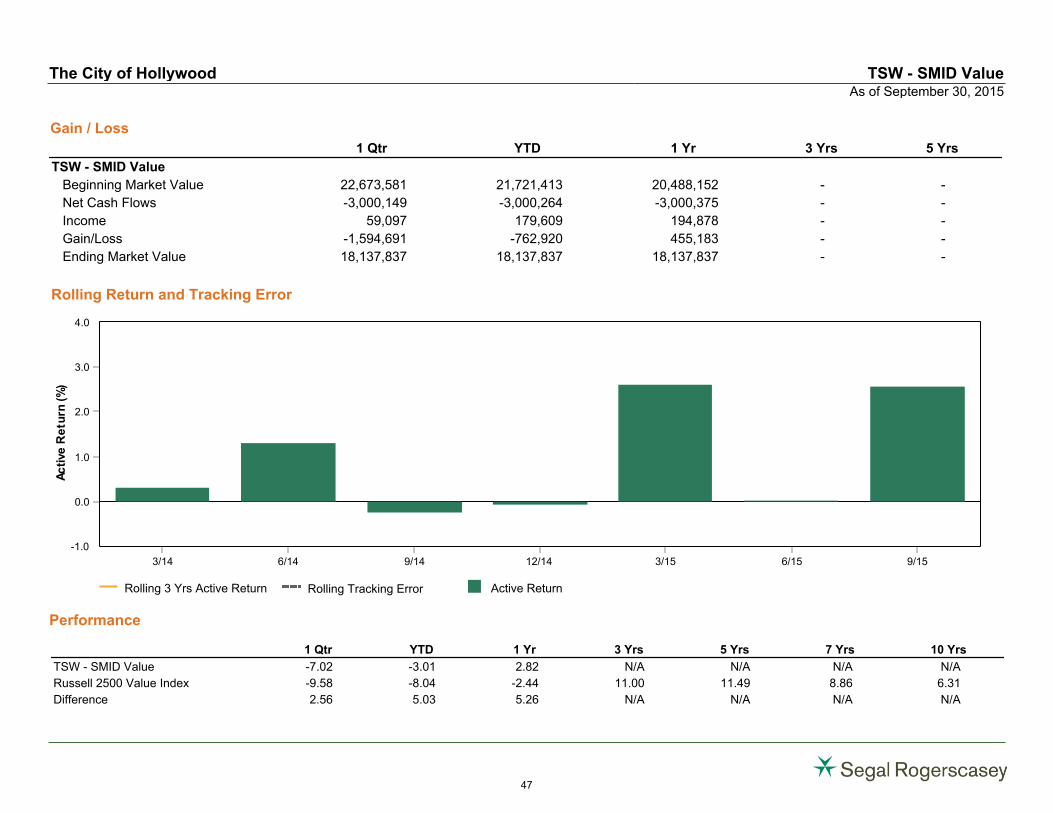
Rolling Return and Tracking Error
Performance
Gain / Loss
1 Qtr YTD 1 Yr 3 Yrs 5 Yrs
TSW - SMID Value
Beginning Market Value 22,673,581 21,721,413 20,488,152 - -
Net Cash Flows -3,000,149 -3,000,264 -3,000,375 - -
Income 59,097 179,609 194,878 - -
Gain/Loss -1,594,691 -762,920 455,183 - -
Ending Market Value 18,137,837 18,137,837 18,137,837 - -
Rolling 3 Yrs Active Return Rolling Tracking Error Active Return
0.0
1.0
2.0
3.0
4.0
-1.0
Ac
tive
Re
turn
(%)
3/14 6/14 9/14 12/14 3/15 6/15 9/15
1 Qtr YTD 1 Yr 3 Yrs 5 Yrs 7 Yrs 10 Yrs
TSW - SMID Value -7.02 -3.01 2.82 N/A N/A N/A N/A
Russell 2500 Value Index -9.58 -8.04 -2.44 11.00 11.49 8.86 6.31
Difference 2.56 5.03 5.26 N/A N/A N/A N/A
The City of Hollywood TSW - SMID ValueAs of September 30, 2015
47
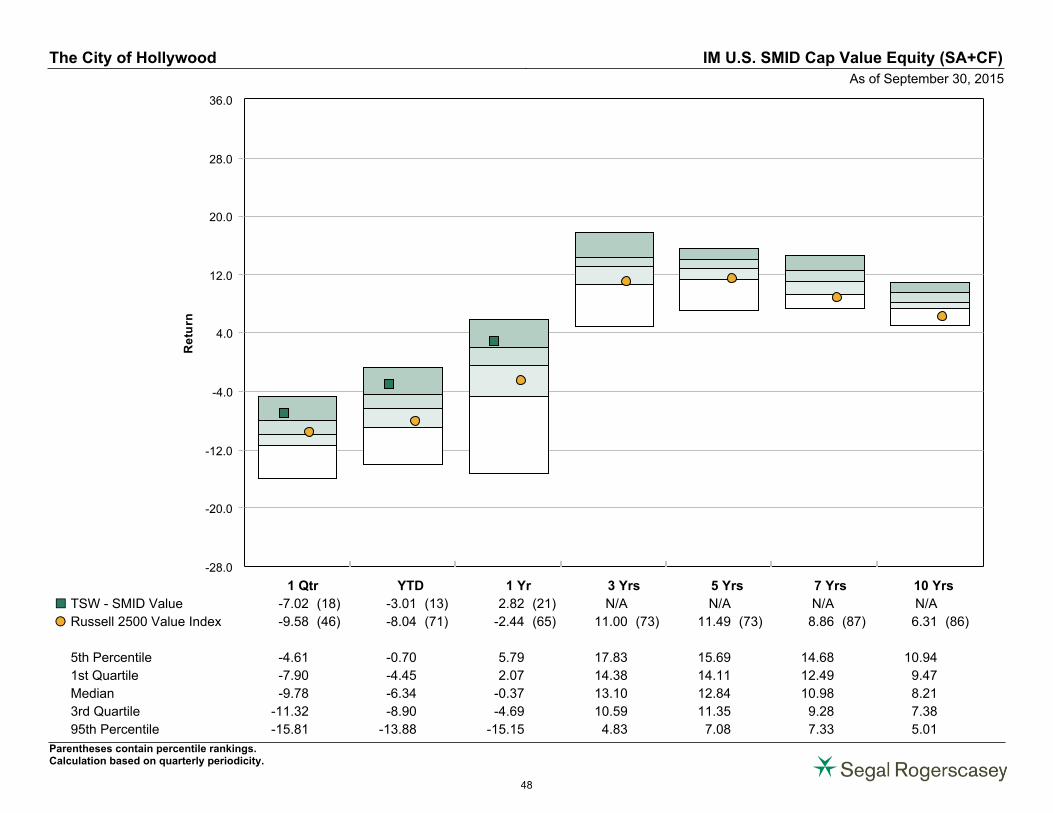
-28.0
-20.0
-12.0
-4.0
4.0
12.0
20.0
28.0
36.0
Re
turn
1 Qtr YTD 1 Yr 3 Yrs 5 Yrs 7 Yrs 10 Yrs
TSW - SMID Value -7.02 (18) -3.01 (13) 2.82 (21) N/A N/A N/A N/A¢£
Russell 2500 Value Index -9.58 (46) -8.04 (71) -2.44 (65) 11.00 (73) 11.49 (73) 8.86 (87) 6.31 (86)�
5th Percentile -4.61 -0.70 5.79 17.83 15.69 14.68 10.94
1st Quartile -7.90 -4.45 2.07 14.38 14.11 12.49 9.47
Median -9.78 -6.34 -0.37 13.10 12.84 10.98 8.21
3rd Quartile -11.32 -8.90 -4.69 10.59 11.35 9.28 7.38
95th Percentile -15.81 -13.88 -15.15 4.83 7.08 7.33 5.01
The City of Hollywood IM U.S. SMID Cap Value Equity (SA+CF)
As of September 30, 2015
Parentheses contain percentile rankings.Calculation based on quarterly periodicity.
48
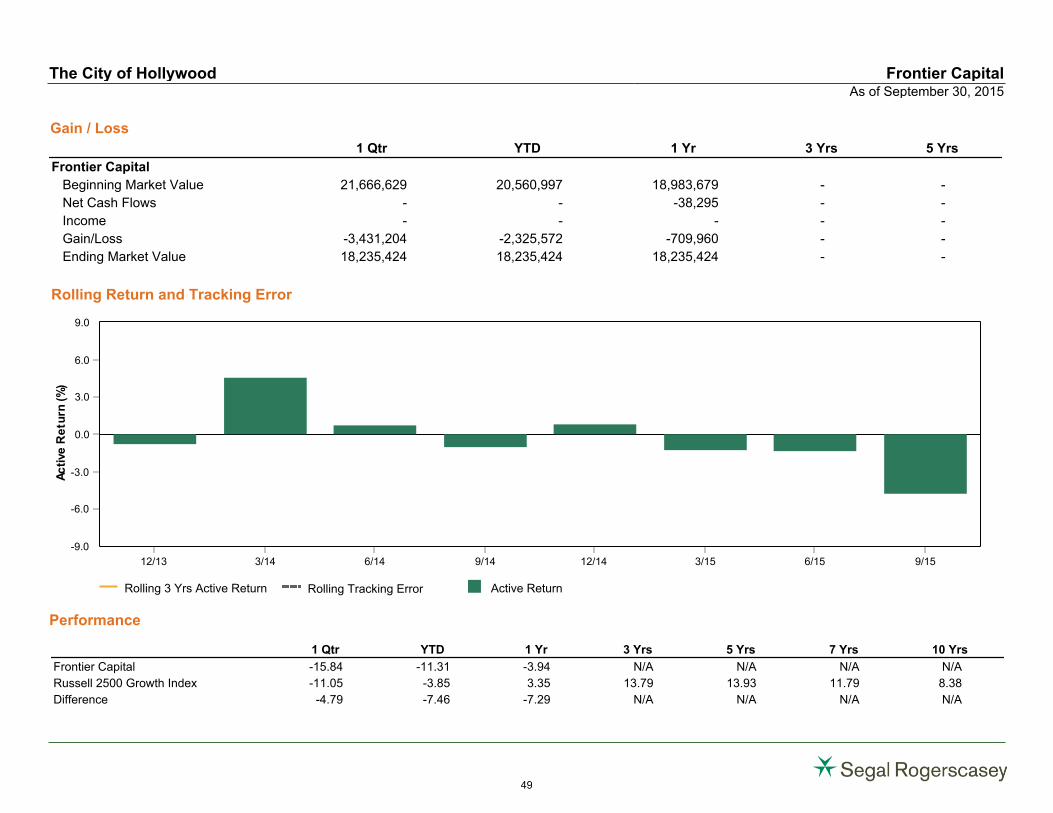
Rolling Return and Tracking Error
Performance
Gain / Loss
1 Qtr YTD 1 Yr 3 Yrs 5 Yrs
Frontier Capital
Beginning Market Value 21,666,629 20,560,997 18,983,679 - -
Net Cash Flows - - -38,295 - -
Income - - - - -
Gain/Loss -3,431,204 -2,325,572 -709,960 - -
Ending Market Value 18,235,424 18,235,424 18,235,424 - -
Rolling 3 Yrs Active Return Rolling Tracking Error Active Return
0.0
3.0
6.0
9.0
-3.0
-6.0
-9.0
Ac
tive
Re
turn
(%)
12/13 3/14 6/14 9/14 12/14 3/15 6/15 9/15
1 Qtr YTD 1 Yr 3 Yrs 5 Yrs 7 Yrs 10 Yrs
Frontier Capital -15.84 -11.31 -3.94 N/A N/A N/A N/A
Russell 2500 Growth Index -11.05 -3.85 3.35 13.79 13.93 11.79 8.38
Difference -4.79 -7.46 -7.29 N/A N/A N/A N/A
The City of Hollywood Frontier CapitalAs of September 30, 2015
49
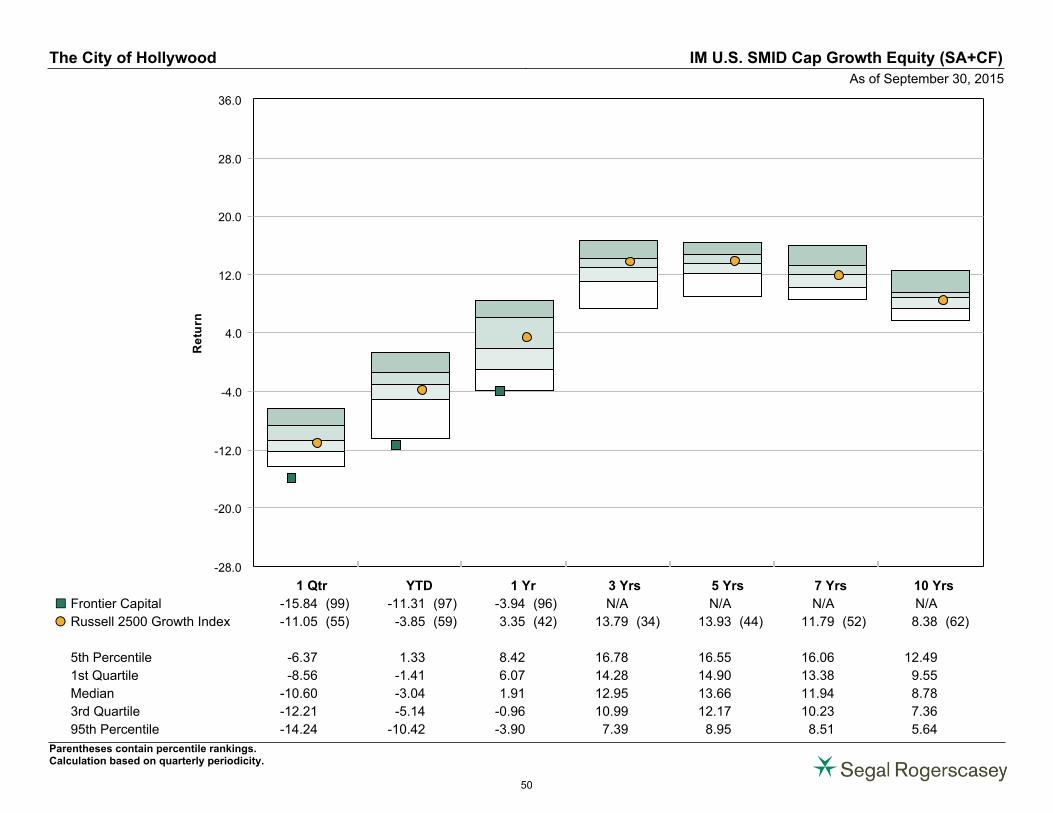
-28.0
-20.0
-12.0
-4.0
4.0
12.0
20.0
28.0
36.0
Re
turn
1 Qtr YTD 1 Yr 3 Yrs 5 Yrs 7 Yrs 10 Yrs
Frontier Capital -15.84 (99) -11.31 (97) -3.94 (96) N/A N/A N/A N/A¢£
Russell 2500 Growth Index -11.05 (55) -3.85 (59) 3.35 (42) 13.79 (34) 13.93 (44) 11.79 (52) 8.38 (62)�
5th Percentile -6.37 1.33 8.42 16.78 16.55 16.06 12.49
1st Quartile -8.56 -1.41 6.07 14.28 14.90 13.38 9.55
Median -10.60 -3.04 1.91 12.95 13.66 11.94 8.78
3rd Quartile -12.21 -5.14 -0.96 10.99 12.17 10.23 7.36
95th Percentile -14.24 -10.42 -3.90 7.39 8.95 8.51 5.64
The City of Hollywood IM U.S. SMID Cap Growth Equity (SA+CF)
As of September 30, 2015
Parentheses contain percentile rankings.Calculation based on quarterly periodicity.
50
International Equity
51
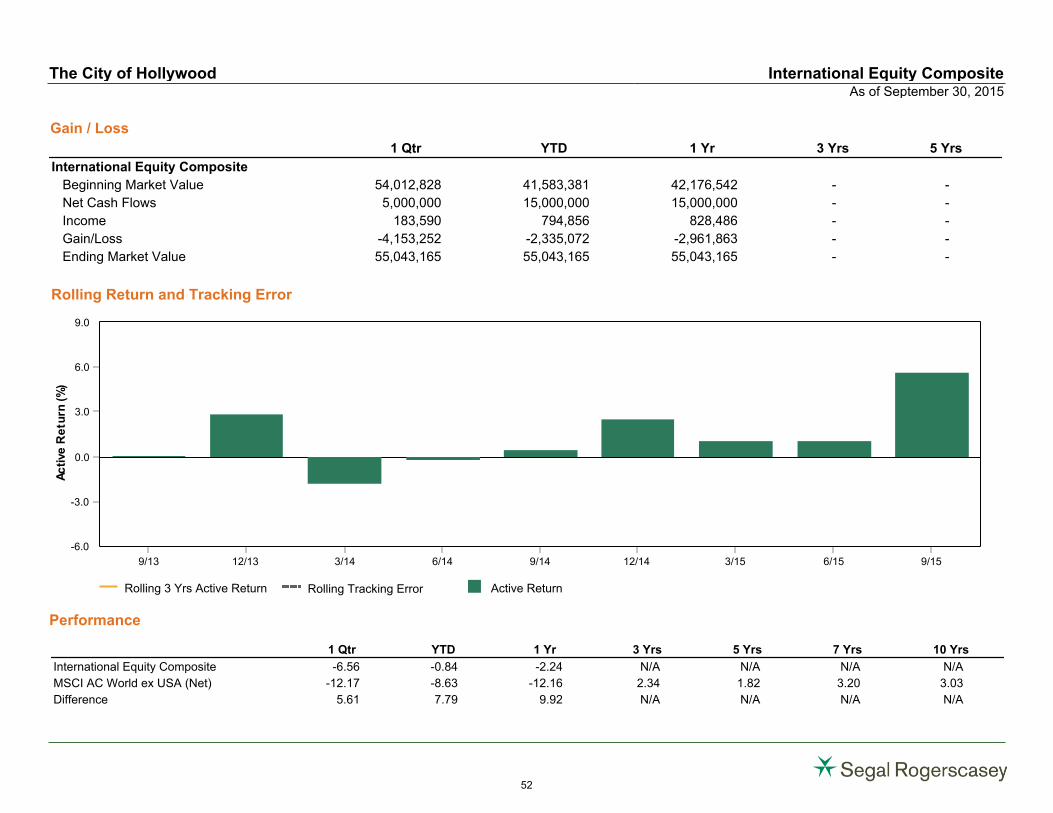
Rolling Return and Tracking Error
Performance
Gain / Loss
1 Qtr YTD 1 Yr 3 Yrs 5 Yrs
International Equity Composite
Beginning Market Value 54,012,828 41,583,381 42,176,542 - -
Net Cash Flows 5,000,000 15,000,000 15,000,000 - -
Income 183,590 794,856 828,486 - -
Gain/Loss -4,153,252 -2,335,072 -2,961,863 - -
Ending Market Value 55,043,165 55,043,165 55,043,165 - -
Rolling 3 Yrs Active Return Rolling Tracking Error Active Return
0.0
3.0
6.0
9.0
-3.0
-6.0
Ac
tive
Re
turn
(%)
9/13 12/13 3/14 6/14 9/14 12/14 3/15 6/15 9/15
1 Qtr YTD 1 Yr 3 Yrs 5 Yrs 7 Yrs 10 Yrs
International Equity Composite -6.56 -0.84 -2.24 N/A N/A N/A N/A
MSCI AC World ex USA (Net) -12.17 -8.63 -12.16 2.34 1.82 3.20 3.03
Difference 5.61 7.79 9.92 N/A N/A N/A N/A
The City of Hollywood International Equity CompositeAs of September 30, 2015
52
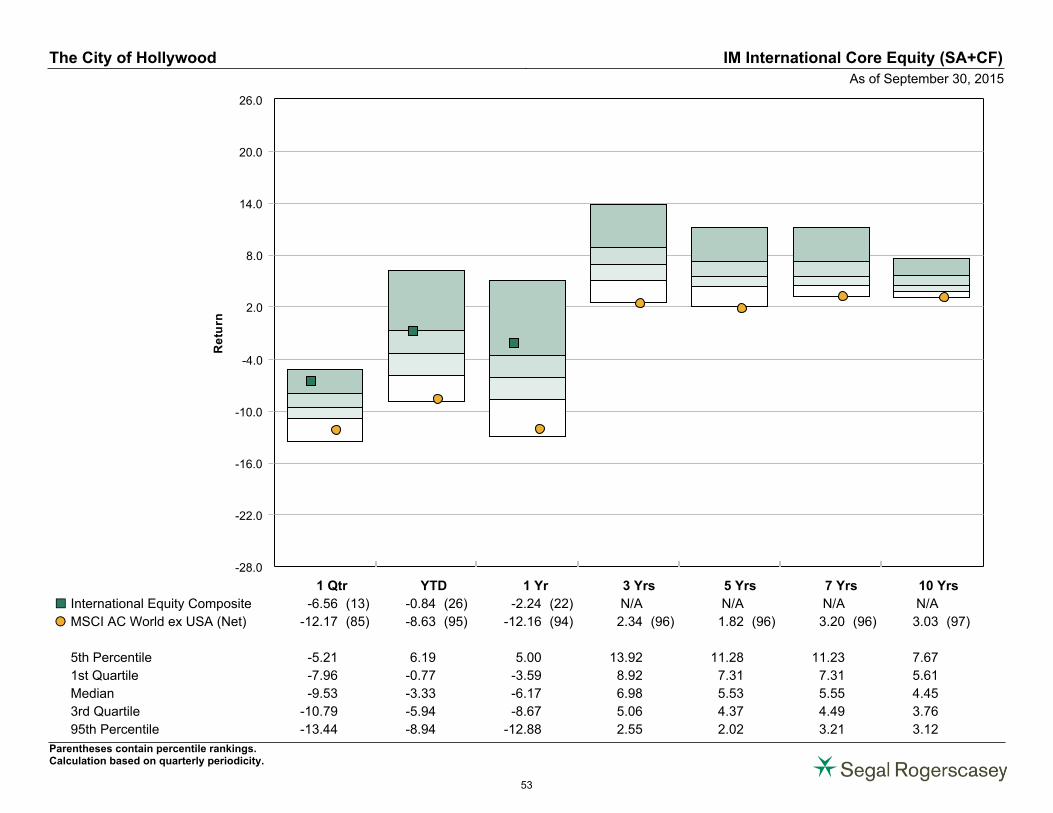
-28.0
-22.0
-16.0
-10.0
-4.0
2.0
8.0
14.0
20.0
26.0
Re
turn
1 Qtr YTD 1 Yr 3 Yrs 5 Yrs 7 Yrs 10 Yrs
International Equity Composite -6.56 (13) -0.84 (26) -2.24 (22) N/A N/A N/A N/A¢£
MSCI AC World ex USA (Net) -12.17 (85) -8.63 (95) -12.16 (94) 2.34 (96) 1.82 (96) 3.20 (96) 3.03 (97)�
5th Percentile -5.21 6.19 5.00 13.92 11.28 11.23 7.67
1st Quartile -7.96 -0.77 -3.59 8.92 7.31 7.31 5.61
Median -9.53 -3.33 -6.17 6.98 5.53 5.55 4.45
3rd Quartile -10.79 -5.94 -8.67 5.06 4.37 4.49 3.76
95th Percentile -13.44 -8.94 -12.88 2.55 2.02 3.21 3.12
The City of Hollywood IM International Core Equity (SA+CF)
As of September 30, 2015
Parentheses contain percentile rankings.Calculation based on quarterly periodicity.
53
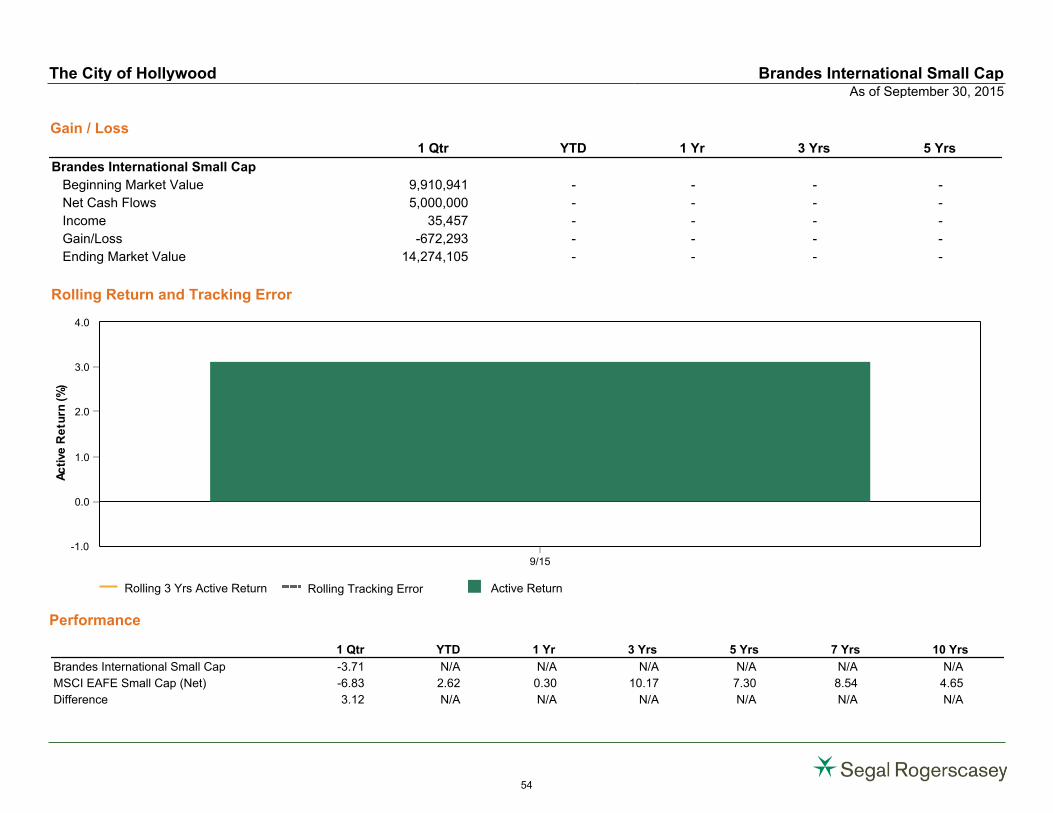
Rolling Return and Tracking Error
Performance
Gain / Loss
1 Qtr YTD 1 Yr 3 Yrs 5 Yrs
Brandes International Small Cap
Beginning Market Value 9,910,941 - - - -
Net Cash Flows 5,000,000 - - - -
Income 35,457 - - - -
Gain/Loss -672,293 - - - -
Ending Market Value 14,274,105 - - - -
Rolling 3 Yrs Active Return Rolling Tracking Error Active Return
0.0
1.0
2.0
3.0
4.0
-1.0
Ac
tive
Re
turn
(%)
9/15
1 Qtr YTD 1 Yr 3 Yrs 5 Yrs 7 Yrs 10 Yrs
Brandes International Small Cap -3.71 N/A N/A N/A N/A N/A N/A
MSCI EAFE Small Cap (Net) -6.83 2.62 0.30 10.17 7.30 8.54 4.65
Difference 3.12 N/A N/A N/A N/A N/A N/A
The City of Hollywood Brandes International Small CapAs of September 30, 2015
54
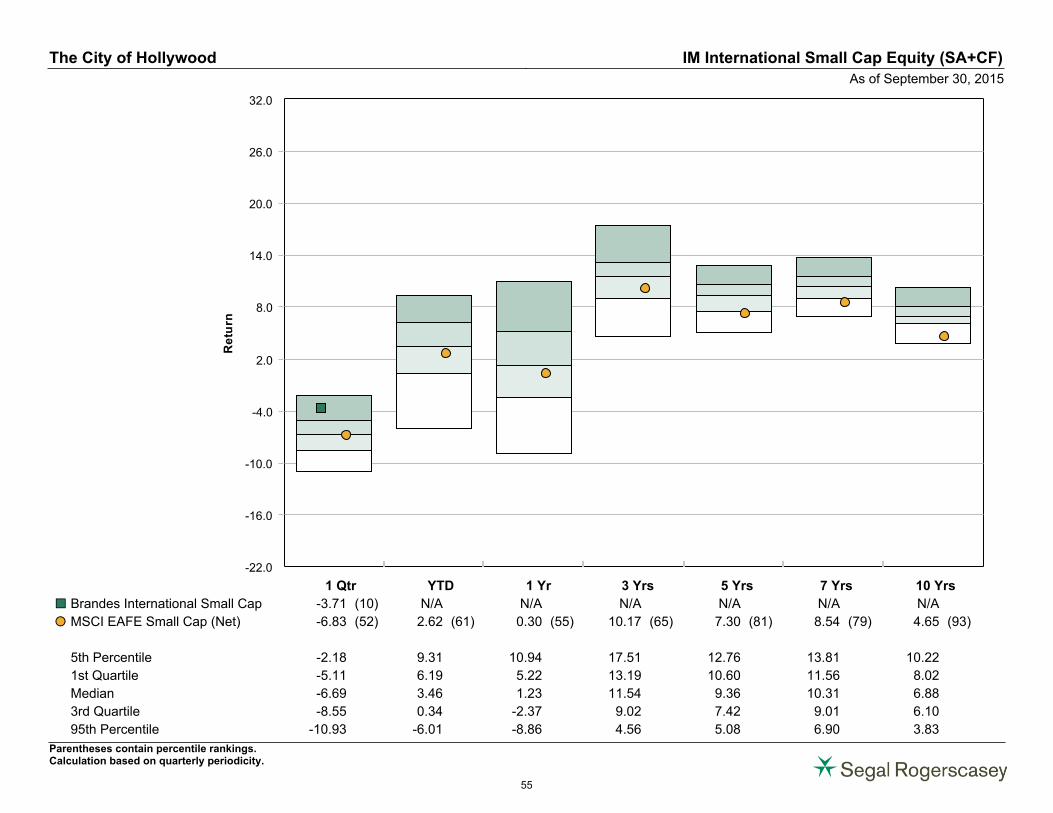
-22.0
-16.0
-10.0
-4.0
2.0
8.0
14.0
20.0
26.0
32.0
Re
turn
1 Qtr YTD 1 Yr 3 Yrs 5 Yrs 7 Yrs 10 Yrs
Brandes International Small Cap -3.71 (10) N/A N/A N/A N/A N/A N/A¢£
MSCI EAFE Small Cap (Net) -6.83 (52) 2.62 (61) 0.30 (55) 10.17 (65) 7.30 (81) 8.54 (79) 4.65 (93)�
5th Percentile -2.18 9.31 10.94 17.51 12.76 13.81 10.22
1st Quartile -5.11 6.19 5.22 13.19 10.60 11.56 8.02
Median -6.69 3.46 1.23 11.54 9.36 10.31 6.88
3rd Quartile -8.55 0.34 -2.37 9.02 7.42 9.01 6.10
95th Percentile -10.93 -6.01 -8.86 4.56 5.08 6.90 3.83
The City of Hollywood IM International Small Cap Equity (SA+CF)
As of September 30, 2015
Parentheses contain percentile rankings.Calculation based on quarterly periodicity.
55
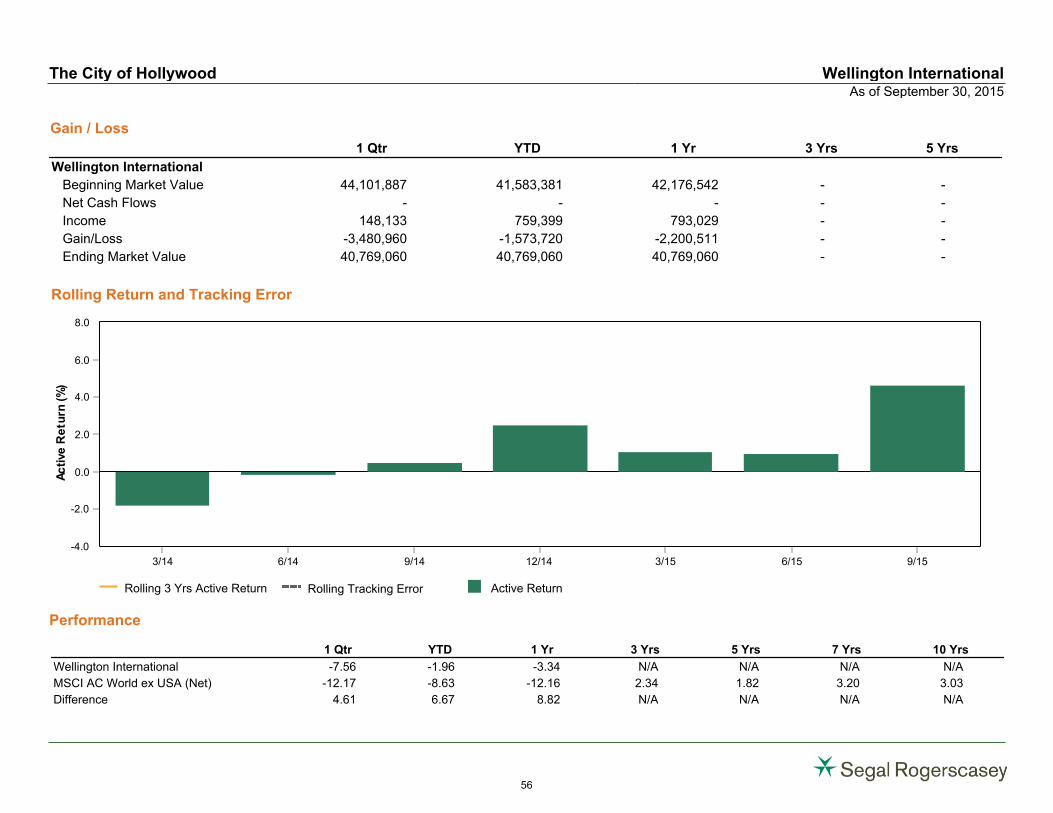
Rolling Return and Tracking Error
Performance
Gain / Loss
1 Qtr YTD 1 Yr 3 Yrs 5 Yrs
Wellington International
Beginning Market Value 44,101,887 41,583,381 42,176,542 - -
Net Cash Flows - - - - -
Income 148,133 759,399 793,029 - -
Gain/Loss -3,480,960 -1,573,720 -2,200,511 - -
Ending Market Value 40,769,060 40,769,060 40,769,060 - -
Rolling 3 Yrs Active Return Rolling Tracking Error Active Return
0.0
2.0
4.0
6.0
8.0
-2.0
-4.0
Ac
tive
Re
turn
(%)
3/14 6/14 9/14 12/14 3/15 6/15 9/15
1 Qtr YTD 1 Yr 3 Yrs 5 Yrs 7 Yrs 10 Yrs
Wellington International -7.56 -1.96 -3.34 N/A N/A N/A N/A
MSCI AC World ex USA (Net) -12.17 -8.63 -12.16 2.34 1.82 3.20 3.03
Difference 4.61 6.67 8.82 N/A N/A N/A N/A
The City of Hollywood Wellington InternationalAs of September 30, 2015
56

-28.0
-22.0
-16.0
-10.0
-4.0
2.0
8.0
14.0
20.0
26.0
Re
turn
1 Qtr YTD 1 Yr 3 Yrs 5 Yrs 7 Yrs 10 Yrs
Wellington International -7.56 (18) -1.96 (33) -3.34 (25) N/A N/A N/A N/A¢£
MSCI AC World ex USA (Net) -12.17 (85) -8.63 (95) -12.16 (94) 2.34 (96) 1.82 (96) 3.20 (96) 3.03 (97)�
5th Percentile -5.21 6.19 5.00 13.92 11.28 11.23 7.67
1st Quartile -7.96 -0.77 -3.59 8.92 7.31 7.31 5.61
Median -9.53 -3.33 -6.17 6.98 5.53 5.55 4.45
3rd Quartile -10.79 -5.94 -8.67 5.06 4.37 4.49 3.76
95th Percentile -13.44 -8.94 -12.88 2.55 2.02 3.21 3.12
The City of Hollywood IM International Core Equity (SA+CF)
As of September 30, 2015
Parentheses contain percentile rankings.Calculation based on quarterly periodicity.
57
Fixed Income
58
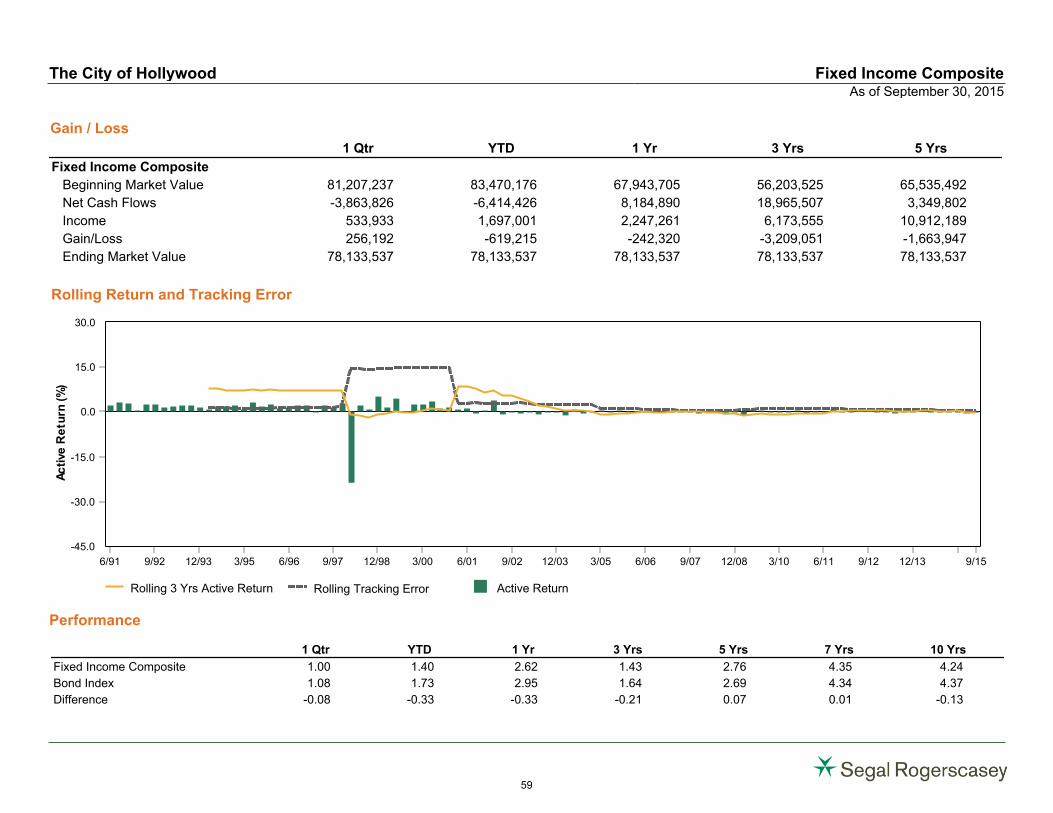
Rolling Return and Tracking Error
Performance
Gain / Loss
1 Qtr YTD 1 Yr 3 Yrs 5 Yrs
Fixed Income Composite
Beginning Market Value 81,207,237 83,470,176 67,943,705 56,203,525 65,535,492
Net Cash Flows -3,863,826 -6,414,426 8,184,890 18,965,507 3,349,802
Income 533,933 1,697,001 2,247,261 6,173,555 10,912,189
Gain/Loss 256,192 -619,215 -242,320 -3,209,051 -1,663,947
Ending Market Value 78,133,537 78,133,537 78,133,537 78,133,537 78,133,537
Rolling 3 Yrs Active Return Rolling Tracking Error Active Return
0.0
15.0
30.0
-15.0
-30.0
-45.0
Ac
tive
Re
turn
(%)
6/91 9/92 12/93 3/95 6/96 9/97 12/98 3/00 6/01 9/02 12/03 3/05 6/06 9/07 12/08 3/10 6/11 9/12 12/13 9/15
1 Qtr YTD 1 Yr 3 Yrs 5 Yrs 7 Yrs 10 Yrs
Fixed Income Composite 1.00 1.40 2.62 1.43 2.76 4.35 4.24
Bond Index 1.08 1.73 2.95 1.64 2.69 4.34 4.37
Difference -0.08 -0.33 -0.33 -0.21 0.07 0.01 -0.13
The City of Hollywood Fixed Income CompositeAs of September 30, 2015
59
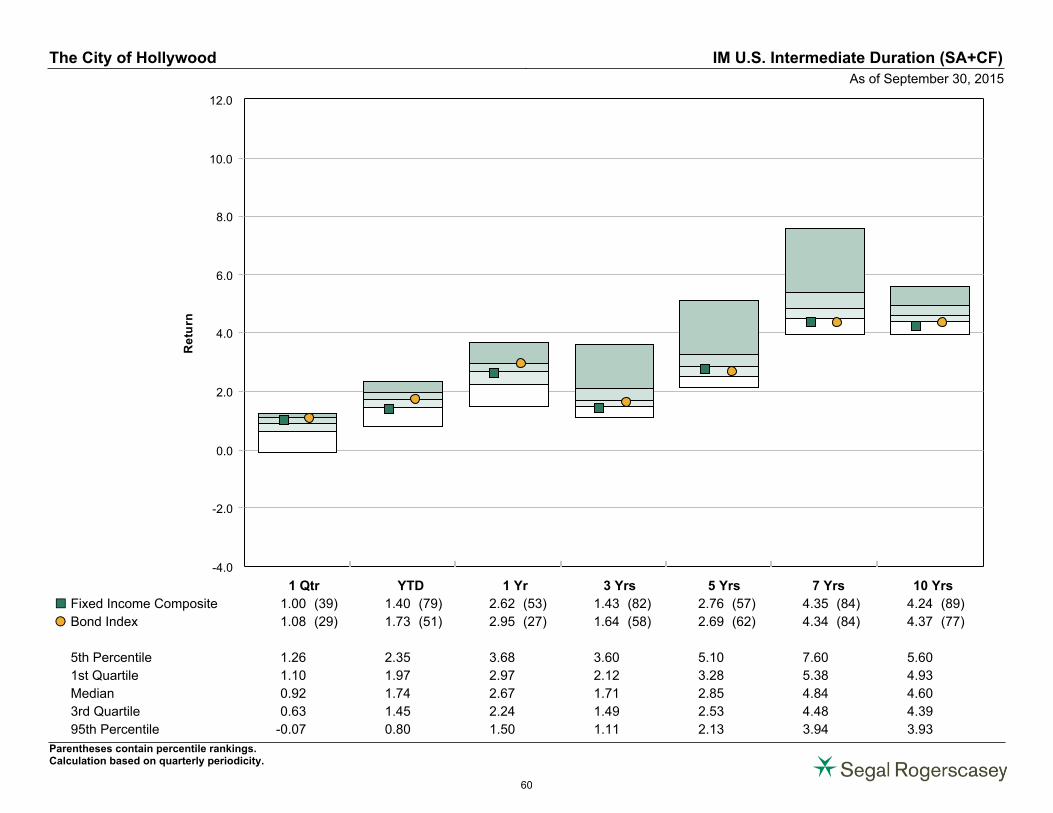
-4.0
-2.0
0.0
2.0
4.0
6.0
8.0
10.0
12.0
Re
turn
1 Qtr YTD 1 Yr 3 Yrs 5 Yrs 7 Yrs 10 Yrs
Fixed Income Composite 1.00 (39) 1.40 (79) 2.62 (53) 1.43 (82) 2.76 (57) 4.35 (84) 4.24 (89)¢£
Bond Index 1.08 (29) 1.73 (51) 2.95 (27) 1.64 (58) 2.69 (62) 4.34 (84) 4.37 (77)�
5th Percentile 1.26 2.35 3.68 3.60 5.10 7.60 5.60
1st Quartile 1.10 1.97 2.97 2.12 3.28 5.38 4.93
Median 0.92 1.74 2.67 1.71 2.85 4.84 4.60
3rd Quartile 0.63 1.45 2.24 1.49 2.53 4.48 4.39
95th Percentile -0.07 0.80 1.50 1.11 2.13 3.94 3.93
The City of Hollywood IM U.S. Intermediate Duration (SA+CF)
As of September 30, 2015
Parentheses contain percentile rankings.Calculation based on quarterly periodicity.
60
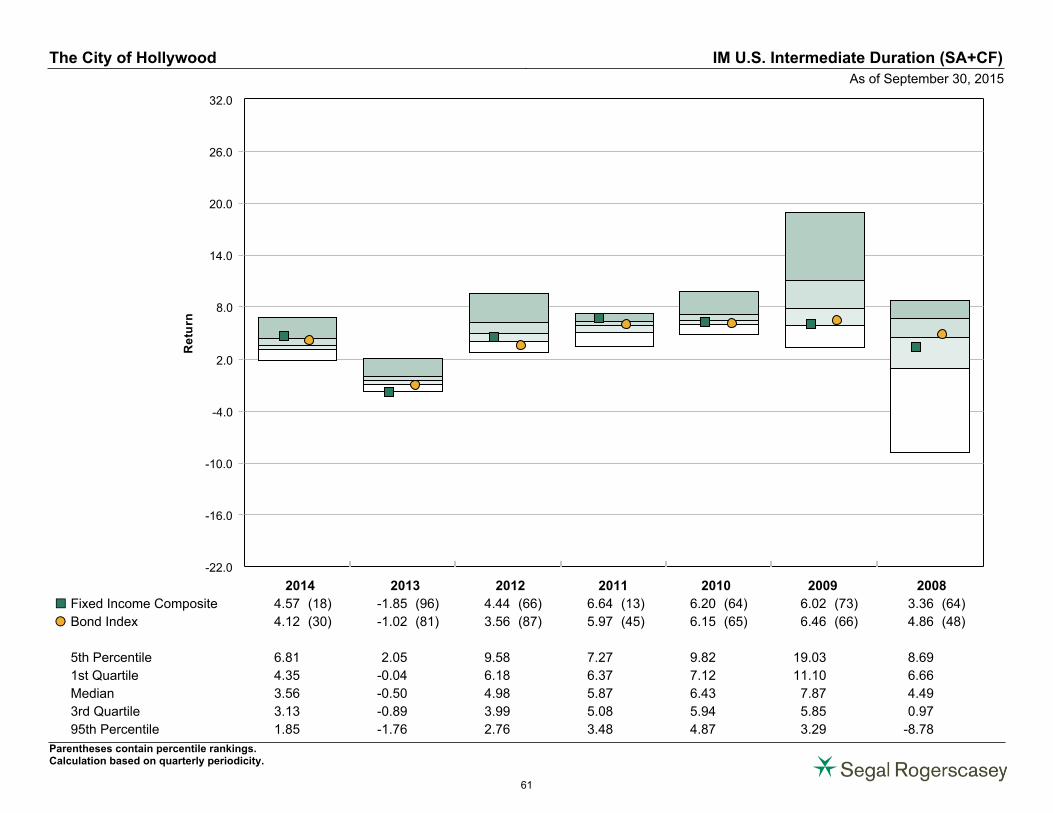
-22.0
-16.0
-10.0
-4.0
2.0
8.0
14.0
20.0
26.0
32.0
Re
turn
2014 2013 2012 2011 2010 2009 2008
Fixed Income Composite 4.57 (18) -1.85 (96) 4.44 (66) 6.64 (13) 6.20 (64) 6.02 (73) 3.36 (64)¢£
Bond Index 4.12 (30) -1.02 (81) 3.56 (87) 5.97 (45) 6.15 (65) 6.46 (66) 4.86 (48)�
5th Percentile 6.81 2.05 9.58 7.27 9.82 19.03 8.69
1st Quartile 4.35 -0.04 6.18 6.37 7.12 11.10 6.66
Median 3.56 -0.50 4.98 5.87 6.43 7.87 4.49
3rd Quartile 3.13 -0.89 3.99 5.08 5.94 5.85 0.97
95th Percentile 1.85 -1.76 2.76 3.48 4.87 3.29 -8.78
The City of Hollywood IM U.S. Intermediate Duration (SA+CF)
As of September 30, 2015
Parentheses contain percentile rankings.Calculation based on quarterly periodicity.
61
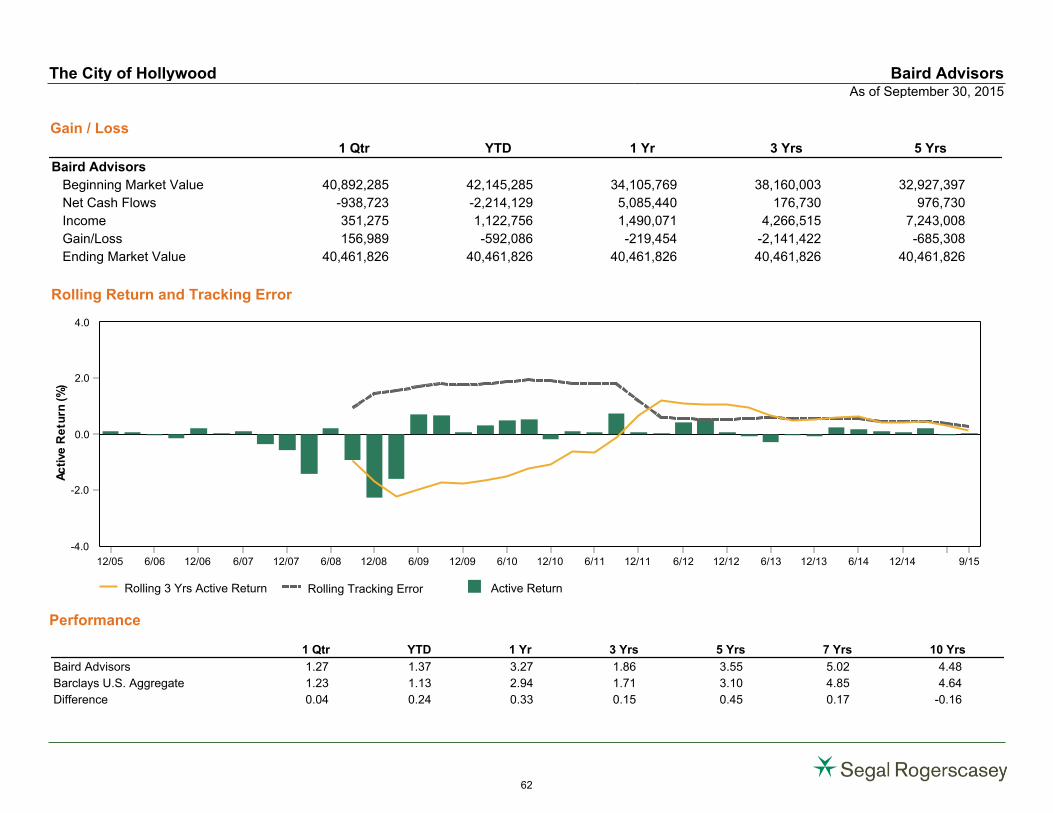
Rolling Return and Tracking Error
Performance
Gain / Loss
1 Qtr YTD 1 Yr 3 Yrs 5 Yrs
Baird Advisors
Beginning Market Value 40,892,285 42,145,285 34,105,769 38,160,003 32,927,397
Net Cash Flows -938,723 -2,214,129 5,085,440 176,730 976,730
Income 351,275 1,122,756 1,490,071 4,266,515 7,243,008
Gain/Loss 156,989 -592,086 -219,454 -2,141,422 -685,308
Ending Market Value 40,461,826 40,461,826 40,461,826 40,461,826 40,461,826
Rolling 3 Yrs Active Return Rolling Tracking Error Active Return
0.0
2.0
4.0
-2.0
-4.0
Ac
tive
Re
turn
(%)
12/05 6/06 12/06 6/07 12/07 6/08 12/08 6/09 12/09 6/10 12/10 6/11 12/11 6/12 12/12 6/13 12/13 6/14 12/14 9/15
1 Qtr YTD 1 Yr 3 Yrs 5 Yrs 7 Yrs 10 Yrs
Baird Advisors 1.27 1.37 3.27 1.86 3.55 5.02 4.48
Barclays U.S. Aggregate 1.23 1.13 2.94 1.71 3.10 4.85 4.64
Difference 0.04 0.24 0.33 0.15 0.45 0.17 -0.16
The City of Hollywood Baird AdvisorsAs of September 30, 2015
62
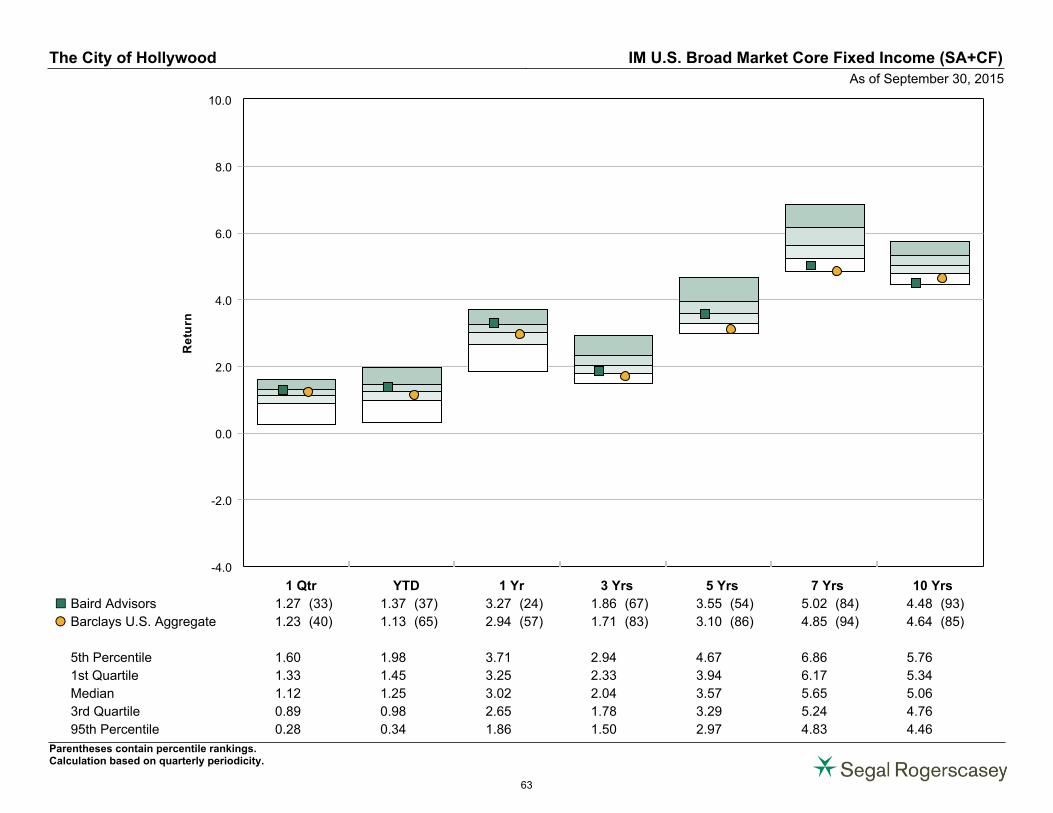
-4.0
-2.0
0.0
2.0
4.0
6.0
8.0
10.0
Re
turn
1 Qtr YTD 1 Yr 3 Yrs 5 Yrs 7 Yrs 10 Yrs
Baird Advisors 1.27 (33) 1.37 (37) 3.27 (24) 1.86 (67) 3.55 (54) 5.02 (84) 4.48 (93)¢£
Barclays U.S. Aggregate 1.23 (40) 1.13 (65) 2.94 (57) 1.71 (83) 3.10 (86) 4.85 (94) 4.64 (85)�
5th Percentile 1.60 1.98 3.71 2.94 4.67 6.86 5.76
1st Quartile 1.33 1.45 3.25 2.33 3.94 6.17 5.34
Median 1.12 1.25 3.02 2.04 3.57 5.65 5.06
3rd Quartile 0.89 0.98 2.65 1.78 3.29 5.24 4.76
95th Percentile 0.28 0.34 1.86 1.50 2.97 4.83 4.46
The City of Hollywood IM U.S. Broad Market Core Fixed Income (SA+CF)
As of September 30, 2015
Parentheses contain percentile rankings.Calculation based on quarterly periodicity.
63
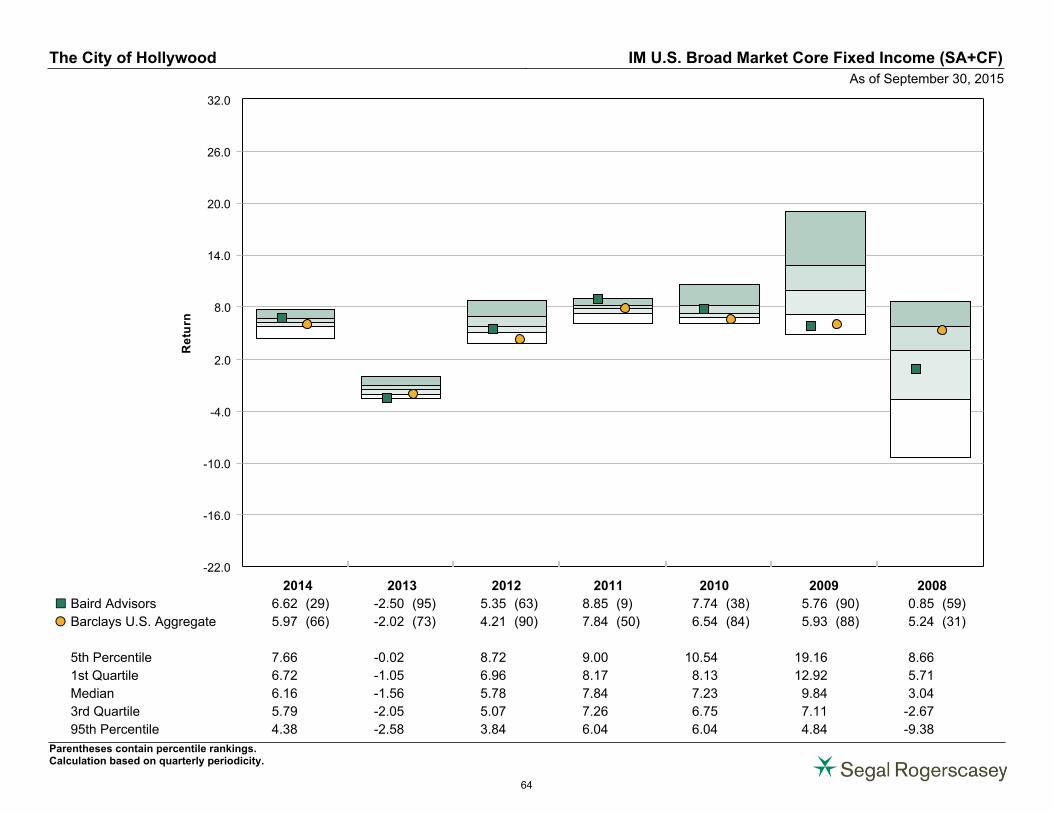
-22.0
-16.0
-10.0
-4.0
2.0
8.0
14.0
20.0
26.0
32.0
Re
turn
2014 2013 2012 2011 2010 2009 2008
Baird Advisors 6.62 (29) -2.50 (95) 5.35 (63) 8.85 (9) 7.74 (38) 5.76 (90) 0.85 (59)¢£
Barclays U.S. Aggregate 5.97 (66) -2.02 (73) 4.21 (90) 7.84 (50) 6.54 (84) 5.93 (88) 5.24 (31)�
5th Percentile 7.66 -0.02 8.72 9.00 10.54 19.16 8.66
1st Quartile 6.72 -1.05 6.96 8.17 8.13 12.92 5.71
Median 6.16 -1.56 5.78 7.84 7.23 9.84 3.04
3rd Quartile 5.79 -2.05 5.07 7.26 6.75 7.11 -2.67
95th Percentile 4.38 -2.58 3.84 6.04 6.04 4.84 -9.38
The City of Hollywood IM U.S. Broad Market Core Fixed Income (SA+CF)
As of September 30, 2015
Parentheses contain percentile rankings.Calculation based on quarterly periodicity.
64
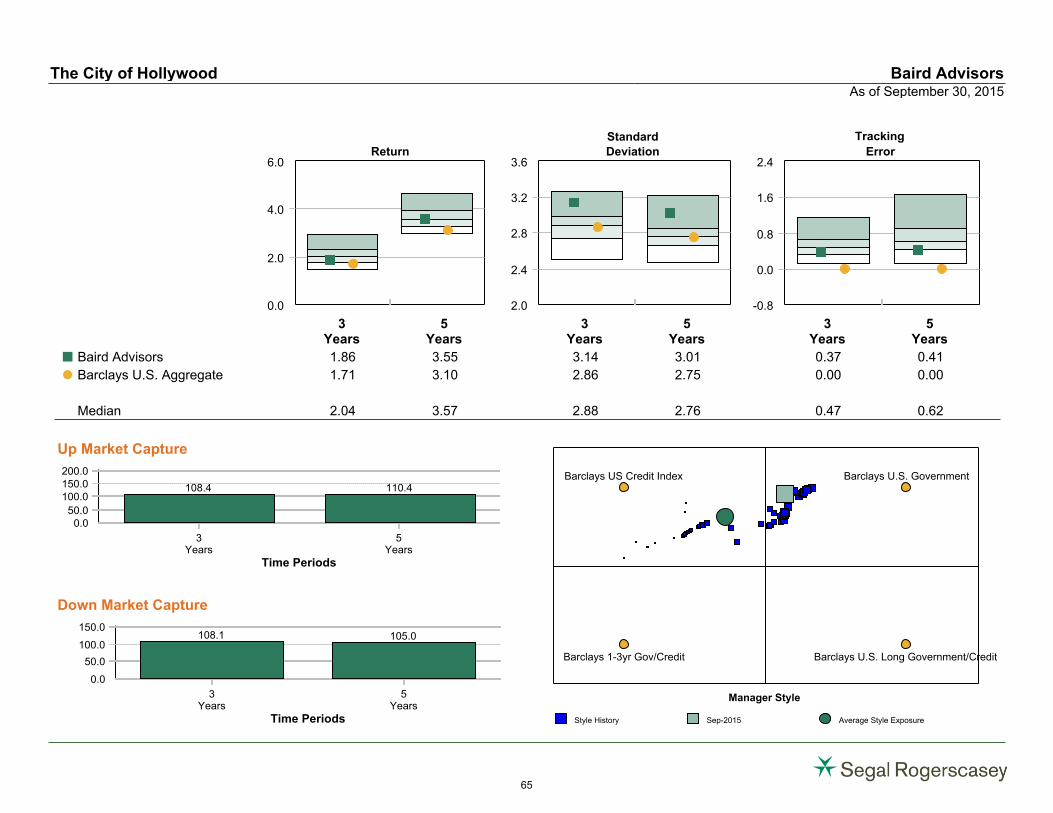
0.0
2.0
4.0
6.0 Return
2.0
2.4
2.8
3.2
3.6
StandardDeviation
-0.8
0.0
0.8
1.6
2.4
Tracking
Error
3Years
5Years
3Years
5Years
3Years
5Years
Baird Advisors 1.86 3.55 3.14 3.01 0.37 0.41¢
Barclays U.S. Aggregate 1.71 3.10 2.86 2.75 0.00 0.00Å
Median 2.04 3.57 2.88 2.76 0.47 0.62
Up Market Capture
0.050.0
100.0150.0200.0
3Years
5Years
Time Periods
108.4 110.4
Down Market Capture
0.0
50.0
100.0
150.0
3Years
5Years
Time Periods
108.1 105.0
Style History Sep-2015 Average Style Exposure
Manager Style
Barclays U.S. Government
Barclays U.S. Long Government/CreditBarclays 1-3yr Gov/Credit
Barclays US Credit Index
The City of Hollywood Baird AdvisorsAs of September 30, 2015
65
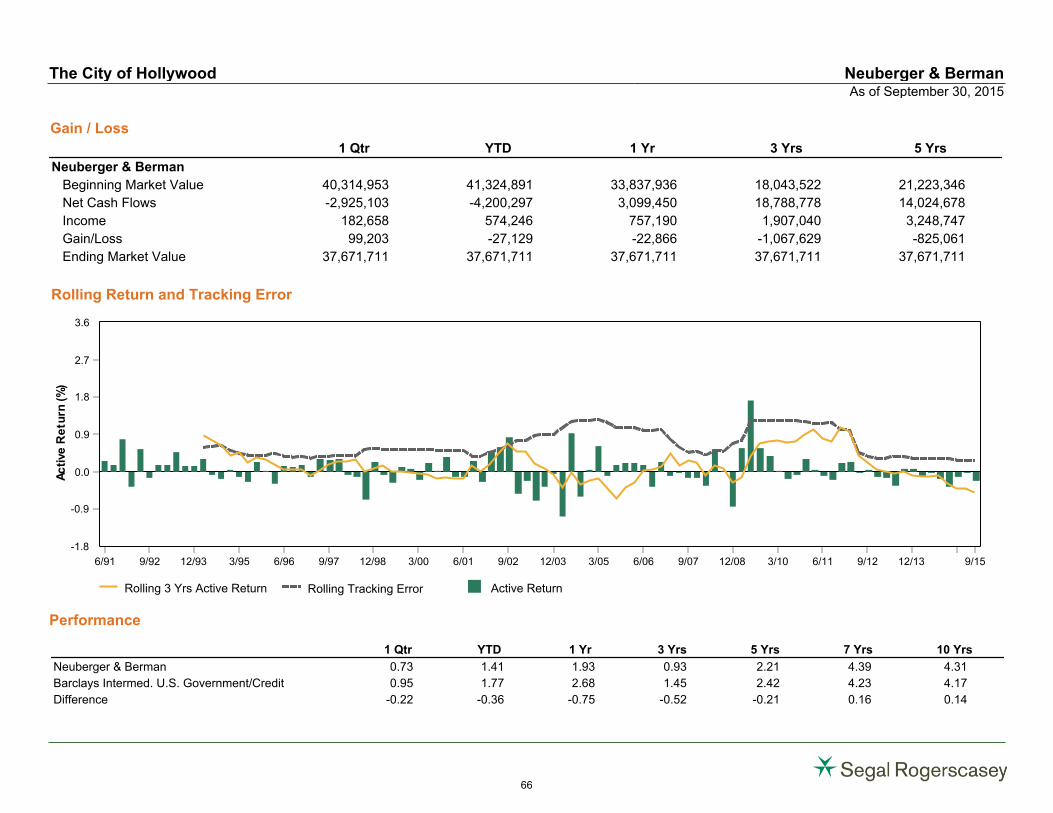
Rolling Return and Tracking Error
Performance
Gain / Loss
1 Qtr YTD 1 Yr 3 Yrs 5 Yrs
Neuberger & Berman
Beginning Market Value 40,314,953 41,324,891 33,837,936 18,043,522 21,223,346
Net Cash Flows -2,925,103 -4,200,297 3,099,450 18,788,778 14,024,678
Income 182,658 574,246 757,190 1,907,040 3,248,747
Gain/Loss 99,203 -27,129 -22,866 -1,067,629 -825,061
Ending Market Value 37,671,711 37,671,711 37,671,711 37,671,711 37,671,711
Rolling 3 Yrs Active Return Rolling Tracking Error Active Return
0.0
0.9
1.8
2.7
3.6
-0.9
-1.8
Ac
tive
Re
turn
(%)
6/91 9/92 12/93 3/95 6/96 9/97 12/98 3/00 6/01 9/02 12/03 3/05 6/06 9/07 12/08 3/10 6/11 9/12 12/13 9/15
1 Qtr YTD 1 Yr 3 Yrs 5 Yrs 7 Yrs 10 Yrs
Neuberger & Berman 0.73 1.41 1.93 0.93 2.21 4.39 4.31
Barclays Intermed. U.S. Government/Credit 0.95 1.77 2.68 1.45 2.42 4.23 4.17
Difference -0.22 -0.36 -0.75 -0.52 -0.21 0.16 0.14
The City of Hollywood Neuberger & BermanAs of September 30, 2015
66
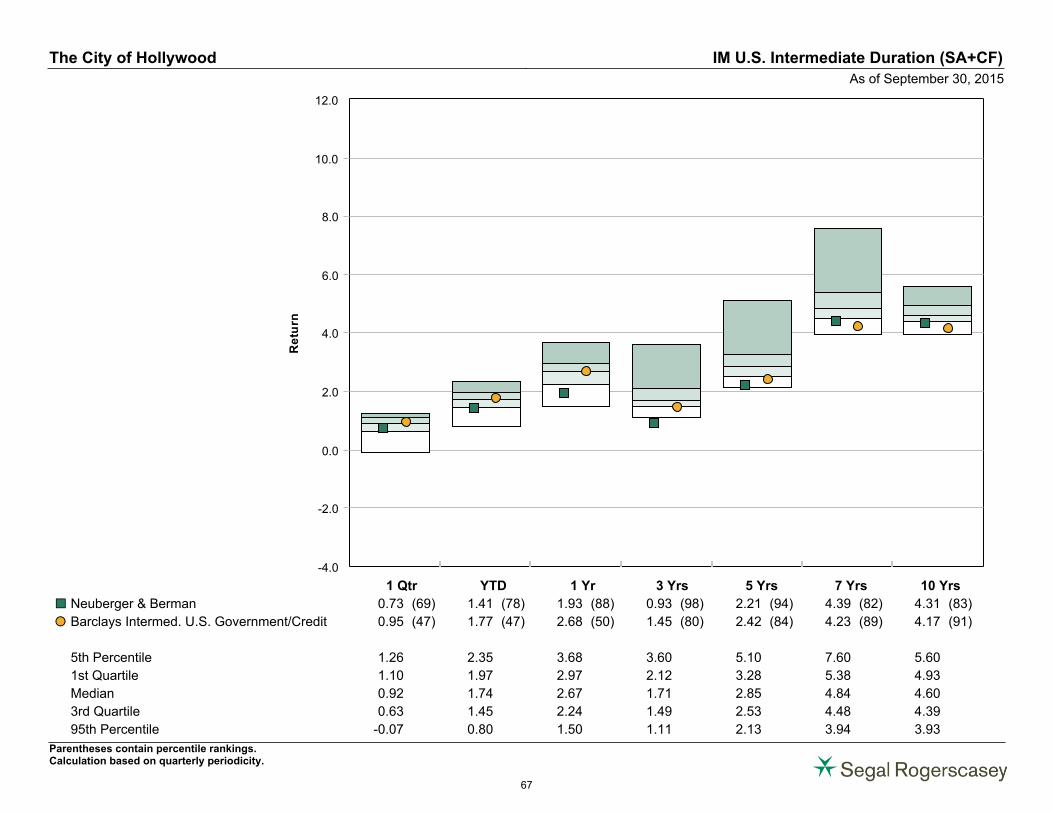
-4.0
-2.0
0.0
2.0
4.0
6.0
8.0
10.0
12.0
Re
turn
1 Qtr YTD 1 Yr 3 Yrs 5 Yrs 7 Yrs 10 Yrs
Neuberger & Berman 0.73 (69) 1.41 (78) 1.93 (88) 0.93 (98) 2.21 (94) 4.39 (82) 4.31 (83)¢£
Barclays Intermed. U.S. Government/Credit 0.95 (47) 1.77 (47) 2.68 (50) 1.45 (80) 2.42 (84) 4.23 (89) 4.17 (91)�
5th Percentile 1.26 2.35 3.68 3.60 5.10 7.60 5.60
1st Quartile 1.10 1.97 2.97 2.12 3.28 5.38 4.93
Median 0.92 1.74 2.67 1.71 2.85 4.84 4.60
3rd Quartile 0.63 1.45 2.24 1.49 2.53 4.48 4.39
95th Percentile -0.07 0.80 1.50 1.11 2.13 3.94 3.93
The City of Hollywood IM U.S. Intermediate Duration (SA+CF)
As of September 30, 2015
Parentheses contain percentile rankings.Calculation based on quarterly periodicity.
67
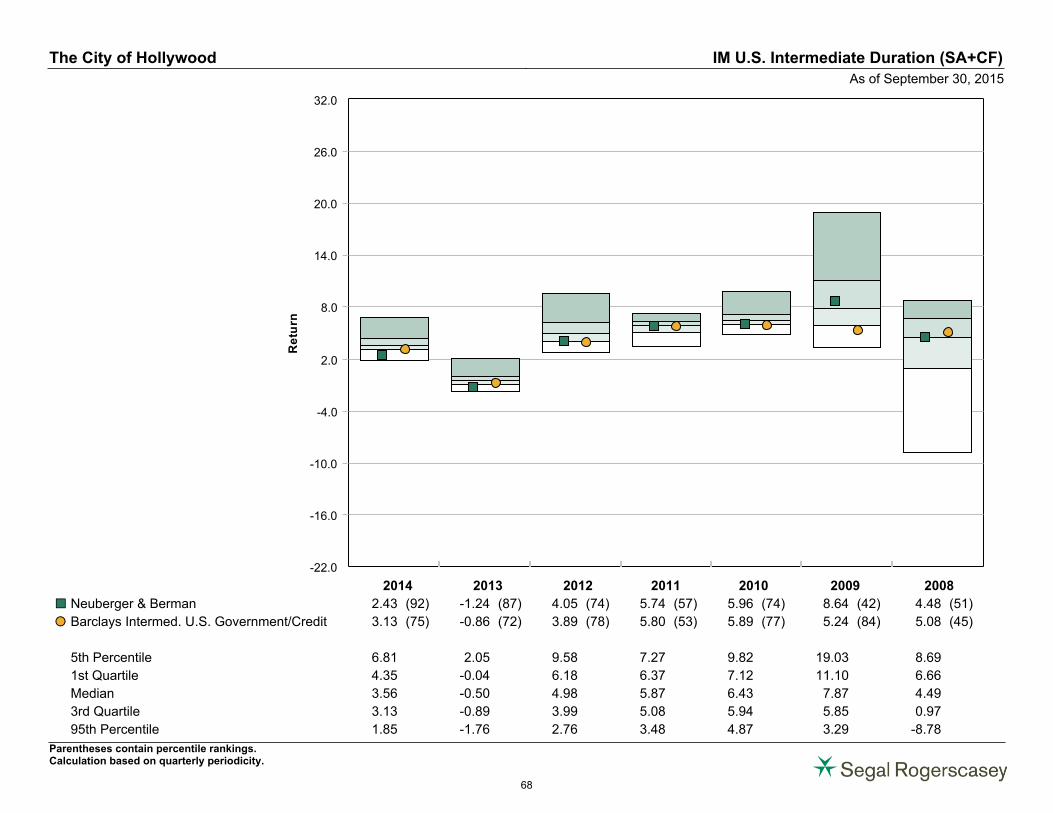
-22.0
-16.0
-10.0
-4.0
2.0
8.0
14.0
20.0
26.0
32.0
Re
turn
2014 2013 2012 2011 2010 2009 2008
Neuberger & Berman 2.43 (92) -1.24 (87) 4.05 (74) 5.74 (57) 5.96 (74) 8.64 (42) 4.48 (51)¢£
Barclays Intermed. U.S. Government/Credit 3.13 (75) -0.86 (72) 3.89 (78) 5.80 (53) 5.89 (77) 5.24 (84) 5.08 (45)�
5th Percentile 6.81 2.05 9.58 7.27 9.82 19.03 8.69
1st Quartile 4.35 -0.04 6.18 6.37 7.12 11.10 6.66
Median 3.56 -0.50 4.98 5.87 6.43 7.87 4.49
3rd Quartile 3.13 -0.89 3.99 5.08 5.94 5.85 0.97
95th Percentile 1.85 -1.76 2.76 3.48 4.87 3.29 -8.78
The City of Hollywood IM U.S. Intermediate Duration (SA+CF)
As of September 30, 2015
Parentheses contain percentile rankings.Calculation based on quarterly periodicity.
68
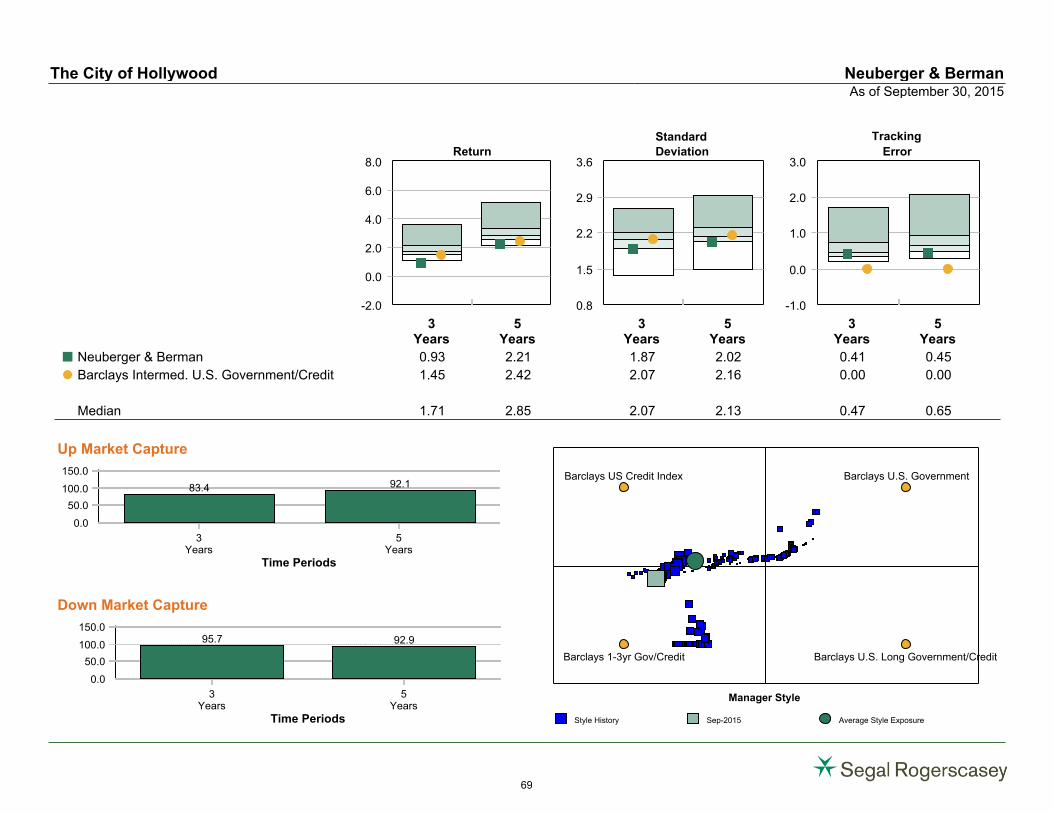
-2.0
0.0
2.0
4.0
6.0
8.0 Return
0.8
1.5
2.2
2.9
3.6
StandardDeviation
-1.0
0.0
1.0
2.0
3.0
Tracking
Error
3Years
5Years
3Years
5Years
3Years
5Years
Neuberger & Berman 0.93 2.21 1.87 2.02 0.41 0.45¢
Barclays Intermed. U.S. Government/Credit 1.45 2.42 2.07 2.16 0.00 0.00Å
Median 1.71 2.85 2.07 2.13 0.47 0.65
Up Market Capture
0.0
50.0
100.0
150.0
3Years
5Years
Time Periods
83.4 92.1
Down Market Capture
0.0
50.0
100.0
150.0
3Years
5Years
Time Periods
95.7 92.9
Style History Sep-2015 Average Style Exposure
Manager Style
Barclays U.S. Government
Barclays U.S. Long Government/CreditBarclays 1-3yr Gov/Credit
Barclays US Credit Index
The City of Hollywood Neuberger & BermanAs of September 30, 2015
69

Real Estate
70
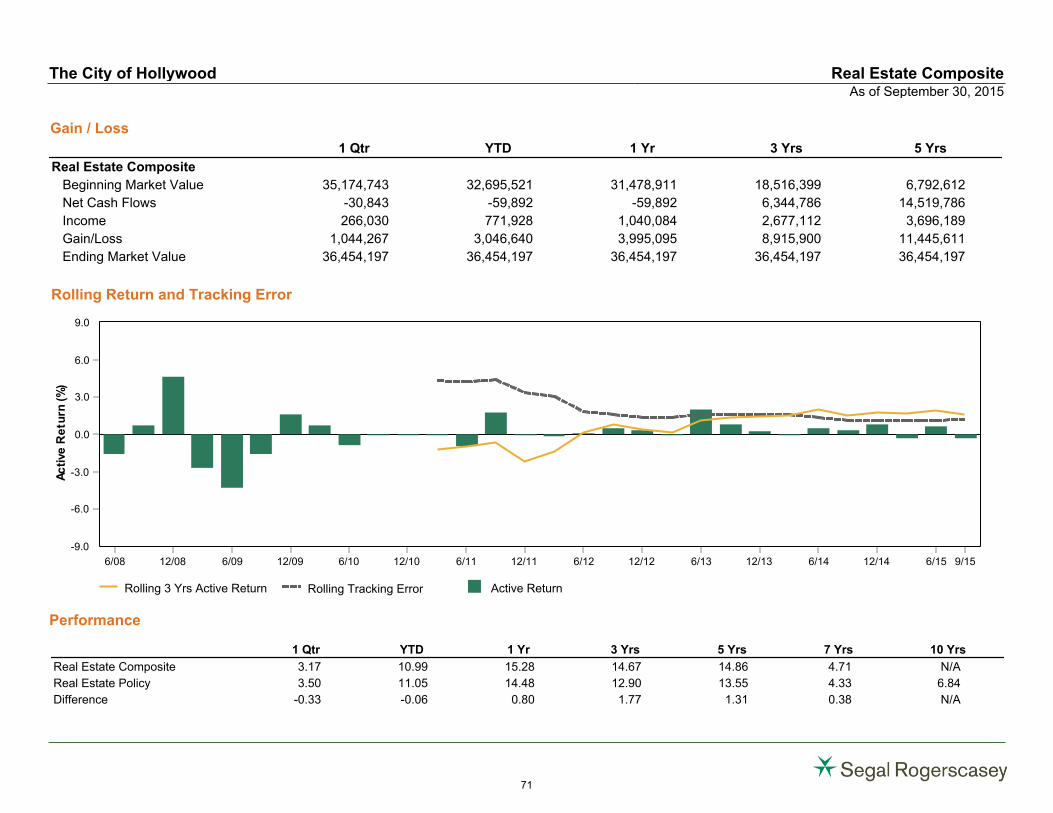
Rolling Return and Tracking Error
Performance
Gain / Loss
1 Qtr YTD 1 Yr 3 Yrs 5 Yrs
Real Estate Composite
Beginning Market Value 35,174,743 32,695,521 31,478,911 18,516,399 6,792,612
Net Cash Flows -30,843 -59,892 -59,892 6,344,786 14,519,786
Income 266,030 771,928 1,040,084 2,677,112 3,696,189
Gain/Loss 1,044,267 3,046,640 3,995,095 8,915,900 11,445,611
Ending Market Value 36,454,197 36,454,197 36,454,197 36,454,197 36,454,197
Rolling 3 Yrs Active Return Rolling Tracking Error Active Return
0.0
3.0
6.0
9.0
-3.0
-6.0
-9.0
Ac
tive
Re
turn
(%)
6/08 12/08 6/09 12/09 6/10 12/10 6/11 12/11 6/12 12/12 6/13 12/13 6/14 12/14 6/15 9/15
1 Qtr YTD 1 Yr 3 Yrs 5 Yrs 7 Yrs 10 Yrs
Real Estate Composite 3.17 10.99 15.28 14.67 14.86 4.71 N/A
Real Estate Policy 3.50 11.05 14.48 12.90 13.55 4.33 6.84
Difference -0.33 -0.06 0.80 1.77 1.31 0.38 N/A
The City of Hollywood Real Estate CompositeAs of September 30, 2015
71
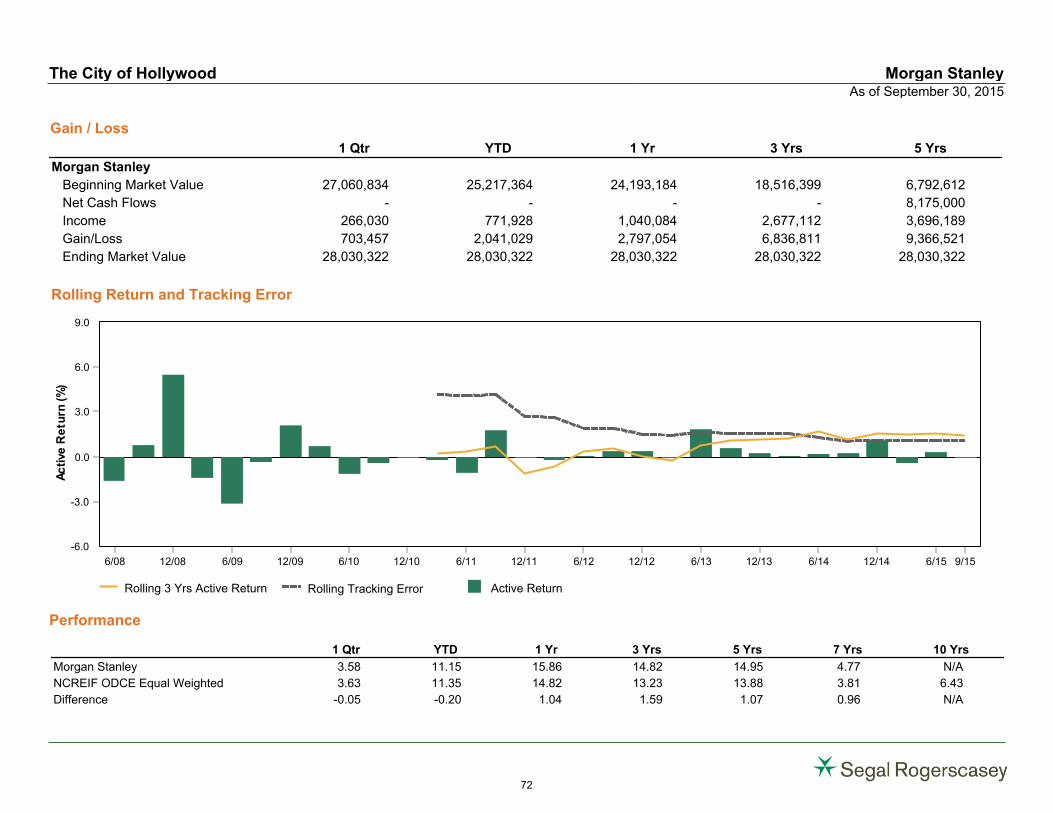
Rolling Return and Tracking Error
Performance
Gain / Loss
1 Qtr YTD 1 Yr 3 Yrs 5 Yrs
Morgan Stanley
Beginning Market Value 27,060,834 25,217,364 24,193,184 18,516,399 6,792,612
Net Cash Flows - - - - 8,175,000
Income 266,030 771,928 1,040,084 2,677,112 3,696,189
Gain/Loss 703,457 2,041,029 2,797,054 6,836,811 9,366,521
Ending Market Value 28,030,322 28,030,322 28,030,322 28,030,322 28,030,322
Rolling 3 Yrs Active Return Rolling Tracking Error Active Return
0.0
3.0
6.0
9.0
-3.0
-6.0
Ac
tive
Re
turn
(%)
6/08 12/08 6/09 12/09 6/10 12/10 6/11 12/11 6/12 12/12 6/13 12/13 6/14 12/14 6/15 9/15
1 Qtr YTD 1 Yr 3 Yrs 5 Yrs 7 Yrs 10 Yrs
Morgan Stanley 3.58 11.15 15.86 14.82 14.95 4.77 N/A
NCREIF ODCE Equal Weighted 3.63 11.35 14.82 13.23 13.88 3.81 6.43
Difference -0.05 -0.20 1.04 1.59 1.07 0.96 N/A
The City of Hollywood Morgan StanleyAs of September 30, 2015
72
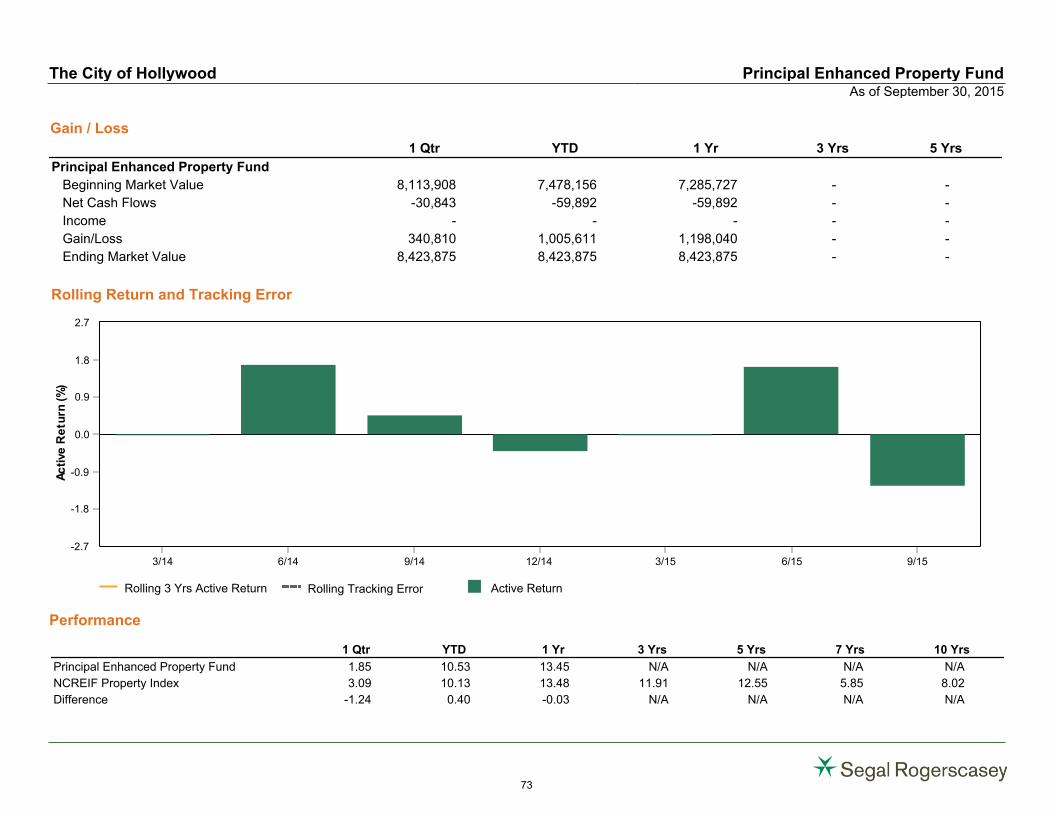
Rolling Return and Tracking Error
Performance
Gain / Loss
1 Qtr YTD 1 Yr 3 Yrs 5 Yrs
Principal Enhanced Property Fund
Beginning Market Value 8,113,908 7,478,156 7,285,727 - -
Net Cash Flows -30,843 -59,892 -59,892 - -
Income - - - - -
Gain/Loss 340,810 1,005,611 1,198,040 - -
Ending Market Value 8,423,875 8,423,875 8,423,875 - -
Rolling 3 Yrs Active Return Rolling Tracking Error Active Return
0.0
0.9
1.8
2.7
-0.9
-1.8
-2.7
Ac
tive
Re
turn
(%)
3/14 6/14 9/14 12/14 3/15 6/15 9/15
1 Qtr YTD 1 Yr 3 Yrs 5 Yrs 7 Yrs 10 Yrs
Principal Enhanced Property Fund 1.85 10.53 13.45 N/A N/A N/A N/A
NCREIF Property Index 3.09 10.13 13.48 11.91 12.55 5.85 8.02
Difference -1.24 0.40 -0.03 N/A N/A N/A N/A
The City of Hollywood Principal Enhanced Property FundAs of September 30, 2015
73