Embed Size (px)
Citation preview
Debt Investor Presentation
PREPARED February 8, 2018FIGURES January-December, 2017
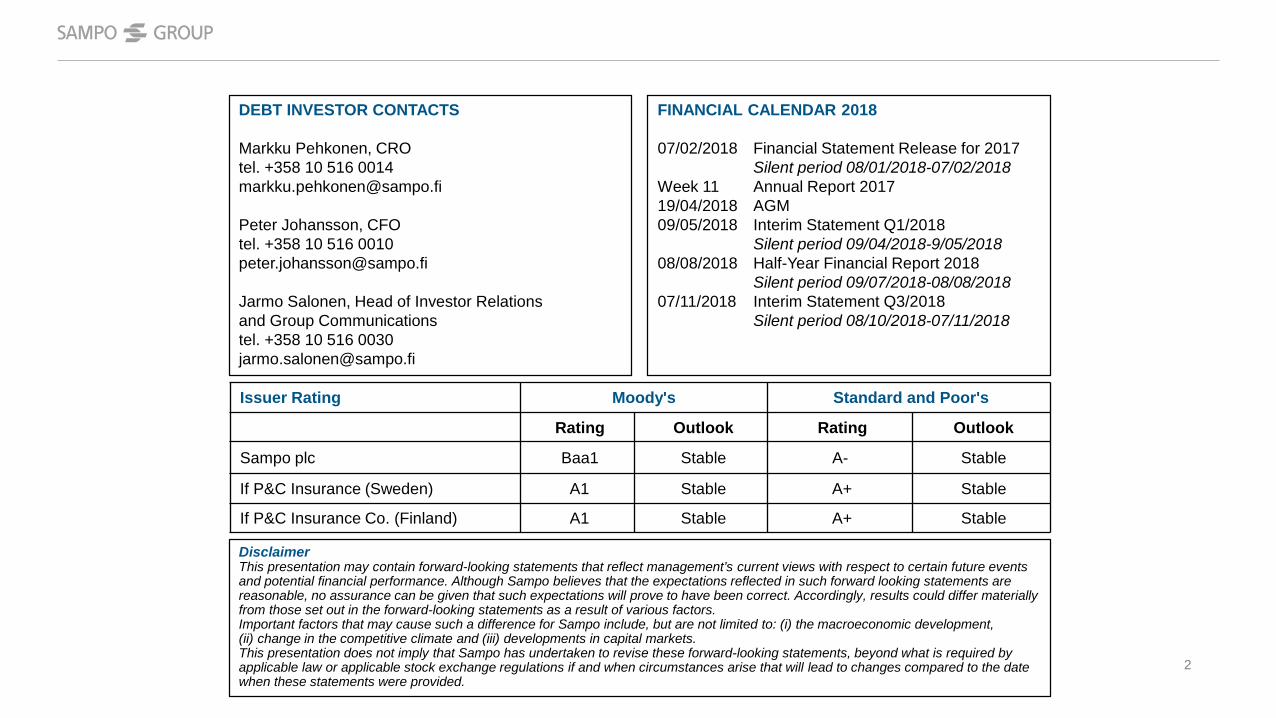
DEBT INVESTOR CONTACTS
Markku Pehkonen, CROtel. +358 10 516 [email protected]
Peter Johansson, CFOtel. +358 10 516 [email protected]
Jarmo Salonen, Head of Investor Relations and Group Communicationstel. +358 10 516 [email protected]
FINANCIAL CALENDAR 2018
07/02/2018 Financial Statement Release for 2017Silent period 08/01/2018-07/02/2018
Week 11 Annual Report 201719/04/2018 AGM09/05/2018 Interim Statement Q1/2018
Silent period 09/04/2018-9/05/201808/08/2018 Half-Year Financial Report 2018
Silent period 09/07/2018-08/08/201807/11/2018 Interim Statement Q3/2018
Silent period 08/10/2018-07/11/2018
Issuer Rating Moody's Standard and Poor's
Rating Outlook Rating Outlook
Sampo plc Baa1 Stable A- Stable
If P&C Insurance (Sweden) A1 Stable A+ Stable
If P&C Insurance Co. (Finland) A1 Stable A+ Stable
DisclaimerThis presentation may contain forward-looking statements that reflect management’s current views with respect to certain future events and potential financial performance. Although Sampo believes that the expectations reflected in such forward looking statements are reasonable, no assurance can be given that such expectations will prove to have been correct. Accordingly, results could differ materially from those set out in the forward-looking statements as a result of various factors.Important factors that may cause such a difference for Sampo include, but are not limited to: (i) the macroeconomic development,(ii) change in the competitive climate and (iii) developments in capital markets.This presentation does not imply that Sampo has undertaken to revise these forward-looking statements, beyond what is required by applicable law or applicable stock exchange regulations if and when circumstances arise that will lead to changes compared to the date when these statements were provided.
2
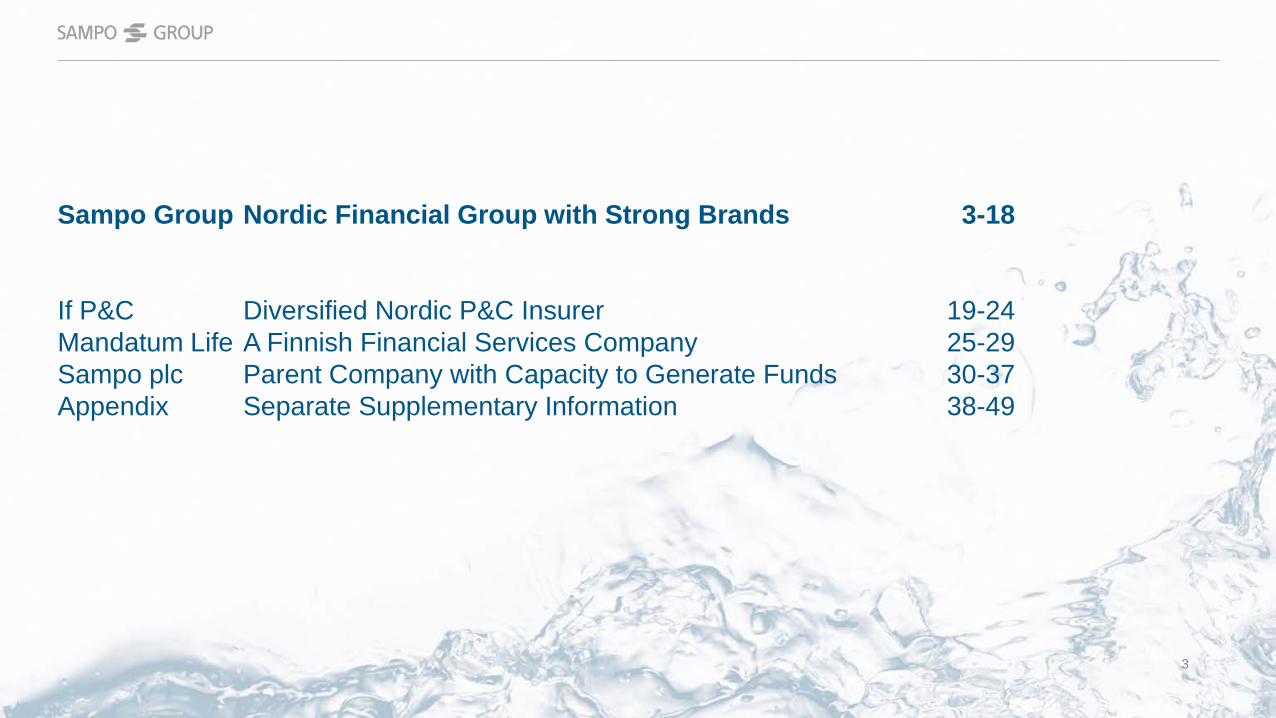
Sampo Group Nordic Financial Group with Strong Brands 3-18
If P&C Diversified Nordic P&C Insurer 19-24Mandatum Life A Finnish Financial Services Company 25-29Sampo plc Parent Company with Capacity to Generate Funds 30-37Appendix Separate Supplementary Information 38-49
3
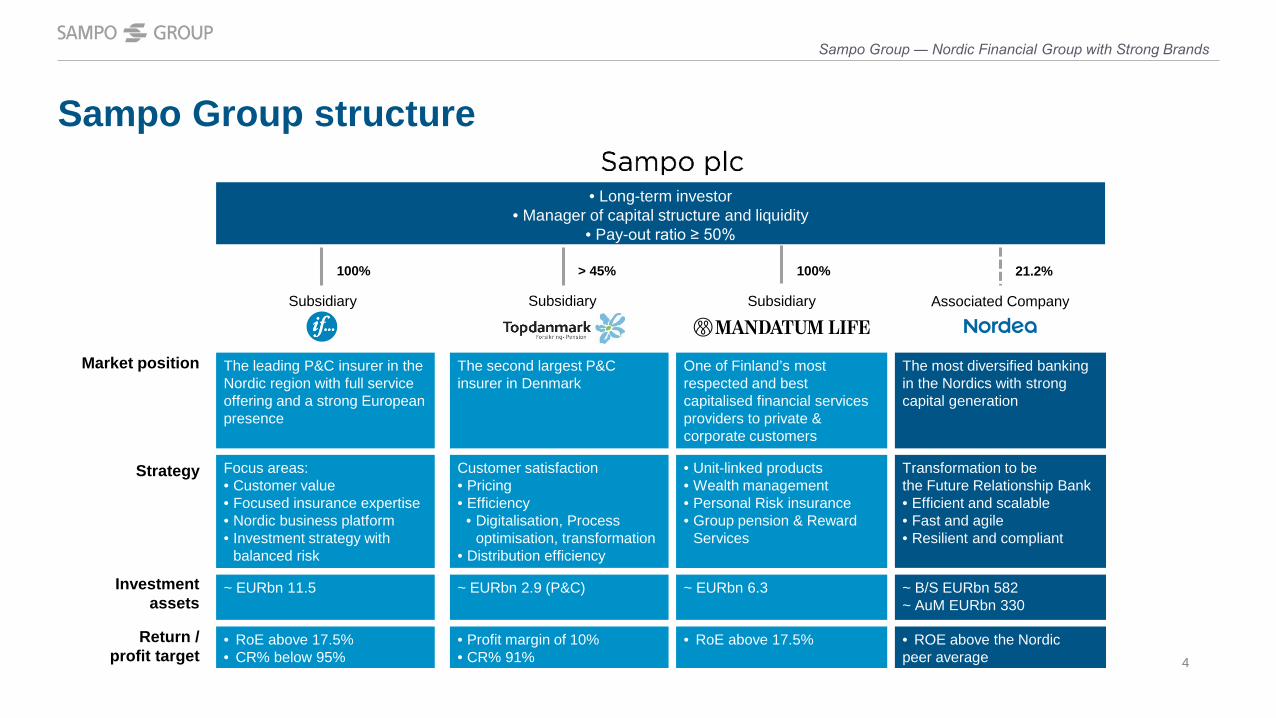
Sampo Group structure
The leading P&C insurer in the Nordic region with full service offering and a strong European presence
Focus areas:• Customer value• Focused insurance expertise• Nordic business platform• Investment strategy with
balanced risk
~ EURbn 11.5
• RoE above 17.5%• CR% below 95%
The second largest P&C insurer in Denmark
Customer satisfaction• Pricing• Efficiency
• Digitalisation, Processoptimisation, transformation
• Distribution efficiency
~ EURbn 2.9 (P&C)
• Profit margin of 10%• CR% 91%
One of Finland’s most respected and best capitalised financial services providers to private & corporate customers
• Unit-linked products• Wealth management• Personal Risk insurance • Group pension & Reward
Services
~ EURbn 6.3
• RoE above 17.5%
• Long-term investor• Manager of capital structure and liquidity
• Pay-out ratio ≥ 50%
Market position
Strategy
Investmentassets
Return /profit target
Subsidiary Subsidiary
100% > 45% 100%
The most diversified bankingin the Nordics with strong capital generation
Transformation to be the Future Relationship Bank• Efficient and scalable• Fast and agile• Resilient and compliant
~ B/S EURbn 582~ AuM EURbn 330
• ROE above the Nordic peer average
Associated Company
21.2%
Sampo Group ― Nordic Financial Group with Strong Brands
Subsidiary
4
40.230.6
26.526.2
23.222.322.0
18.07.5
6.15.9
4.13.53.3
1.70.80.6
NordeaDanske
DNBSampo
SwedbankSHBSEB
InvestorGjensidige
IndustrivärdenTryg
JyskeTopdanmark
StorebrandAlm.Brand
ProtectorNordax
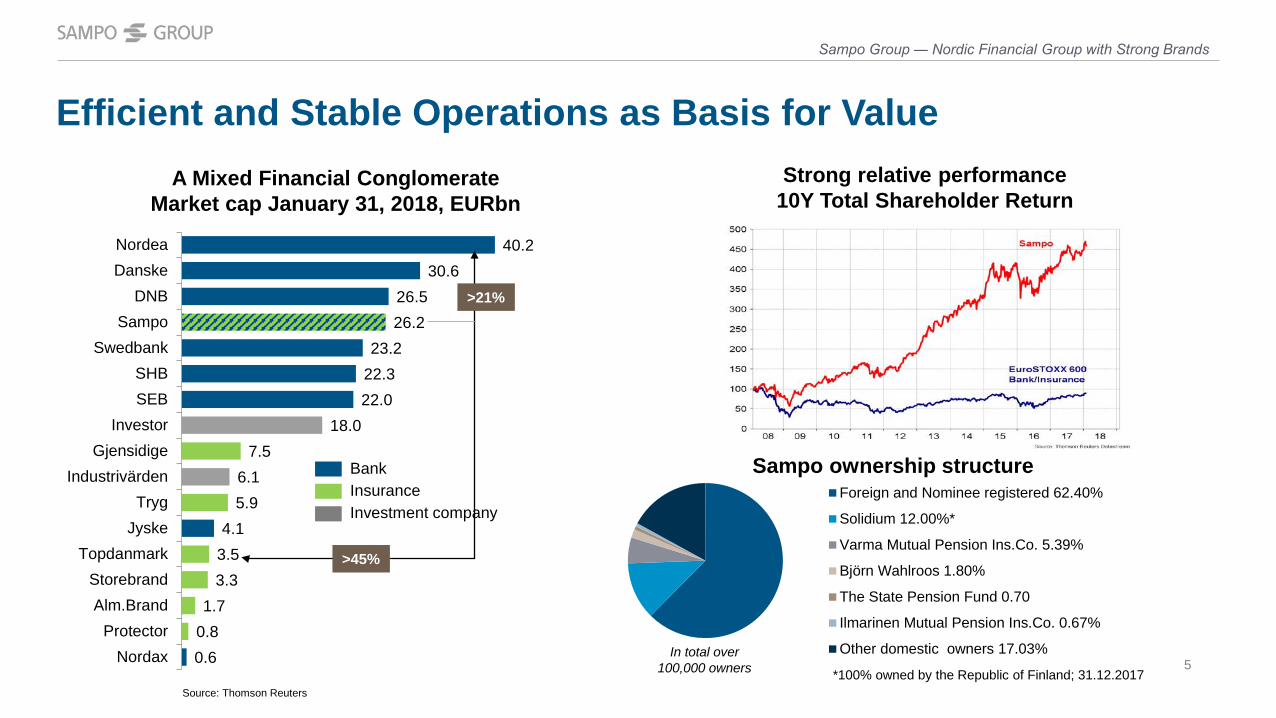
Efficient and Stable Operations as Basis for Value
Source: Thomson Reuters
>45%
*100% owned by the Republic of Finland; 31.12.2017
A Mixed Financial ConglomerateMarket cap January 31, 2018, EURbn
BankInsuranceInvestment company
Foreign and Nominee registered 62.40%
Solidium 12.00%*
Varma Mutual Pension Ins.Co. 5.39%
Björn Wahlroos 1.80%
The State Pension Fund 0.70
Ilmarinen Mutual Pension Ins.Co. 0.67%
Other domestic owners 17.03%
>21%
In total over100,000 owners
Strong relative performance10Y Total Shareholder Return
Sampo ownership structure
Sampo Group ― Nordic Financial Group with Strong Brands
5
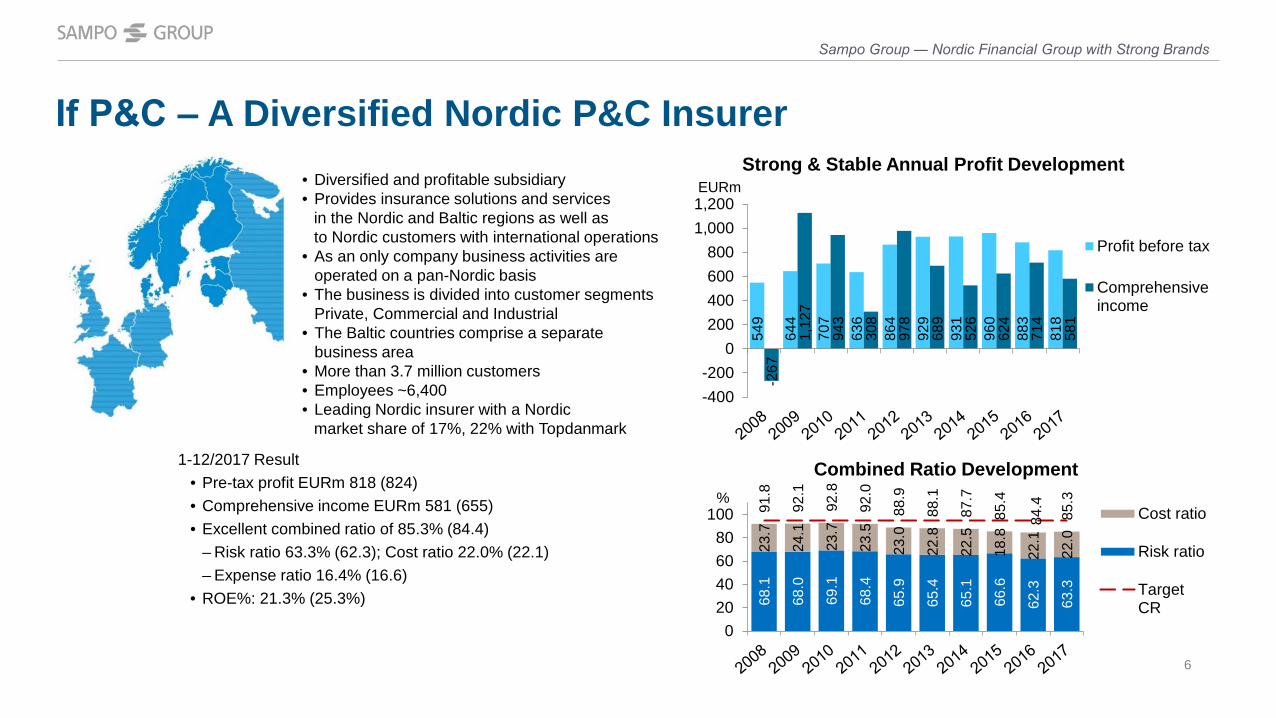
1-12/2017 Result • Pre-tax profit EURm 818 (824)• Comprehensive income EURm 581 (655)• Excellent combined ratio of 85.3% (84.4)
– Risk ratio 63.3% (62.3); Cost ratio 22.0% (22.1)– Expense ratio 16.4% (16.6)
• ROE%: 21.3% (25.3%)
If P&C ‒ A Diversified Nordic P&C Insurer• Diversified and profitable subsidiary• Provides insurance solutions and services
in the Nordic and Baltic regions as well asto Nordic customers with international operations
• As an only company business activities are operated on a pan-Nordic basis
• The business is divided into customer segments Private, Commercial and Industrial
• The Baltic countries comprise a separate business area
• More than 3.7 million customers• Employees ~6,400• Leading Nordic insurer with a Nordic
market share of 17%, 22% with Topdanmark
549
644
707
636
864
929
931
960
883
818
-267
1,12
7
943
308
978
689
526
624
714
581
-400-200
0200400600800
1,0001,200
Profit before tax
Comprehensiveincome
Strong & Stable Annual Profit DevelopmentEURm
68.1
68.0
69.1
68.4
65.9
65.4
65.1
66.6
62.3
63.3
23.7
24.1
23.7
23.5
23.0
22.8
22.5
18.8
22.1
22.0
91.8
92.1
92.8
92.0
88.9
88.1
87.7
85.4
84.4
85.3
020406080
100%
Cost ratio
Risk ratio
TargetCR
Combined Ratio Development
Sampo Group ― Nordic Financial Group with Strong Brands
6
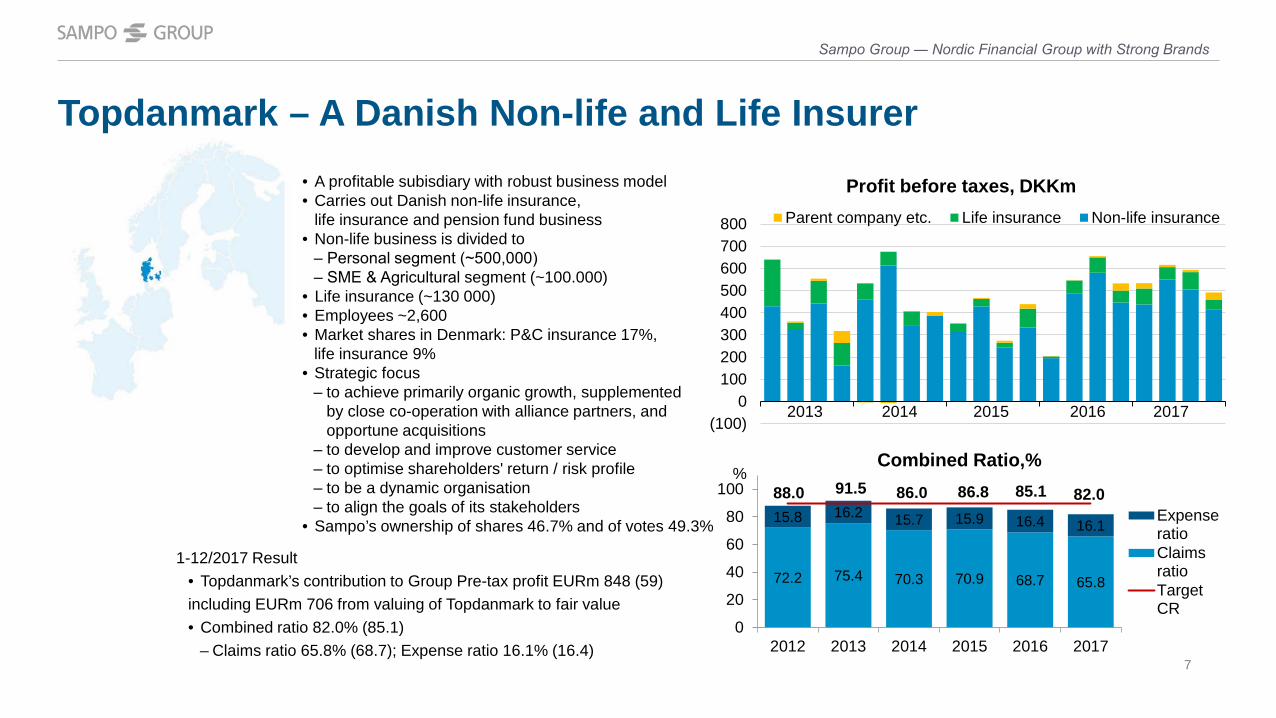
1-12/2017 Result• Topdanmark’s contribution to Group Pre-tax profit EURm 848 (59)including EURm 706 from valuing of Topdanmark to fair value• Combined ratio 82.0% (85.1)
– Claims ratio 65.8% (68.7); Expense ratio 16.1% (16.4)
• A profitable subisdiary with robust business model• Carries out Danish non-life insurance,
life insurance and pension fund business• Non-life business is divided to
‒ Personal segment (~500,000)‒ SME & Agricultural segment (~100.000)
• Life insurance (~130 000)• Employees ~2,600• Market shares in Denmark: P&C insurance 17%,
life insurance 9%• Strategic focus
‒ to achieve primarily organic growth, supplemented by close co-operation with alliance partners, and opportune acquisitions
‒ to develop and improve customer service‒ to optimise shareholders' return / risk profile ‒ to be a dynamic organisation‒ to align the goals of its stakeholders
• Sampo’s ownership of shares 46.7% and of votes 49.3%
Profit before taxes, DKKm
Combined Ratio,%
72.2 75.4 70.3 70.9 68.7 65.8
15.8 16.2 15.7 15.9 16.4 16.1
0
20
40
60
80
100
2012 2013 2014 2015 2016 2017
%
ExpenseratioClaimsratioTargetCR
85.186.886.091.588.0
Topdanmark – A Danish Non-life and Life Insurer
Sampo Group ― Nordic Financial Group with Strong Brands
82.0
2013 2014 2015 2016 2017(100)
0100200300400500600700800 Parent company etc. Life insurance Non-life insurance
7
0500
1,0001,5002,0002,5003,0003,5004,0004,5005,000 Other WP-liabilities
Segregated Group PensionWP-liabilities (3,5% guarantee)WP-liabilities (4,5% guarantee)
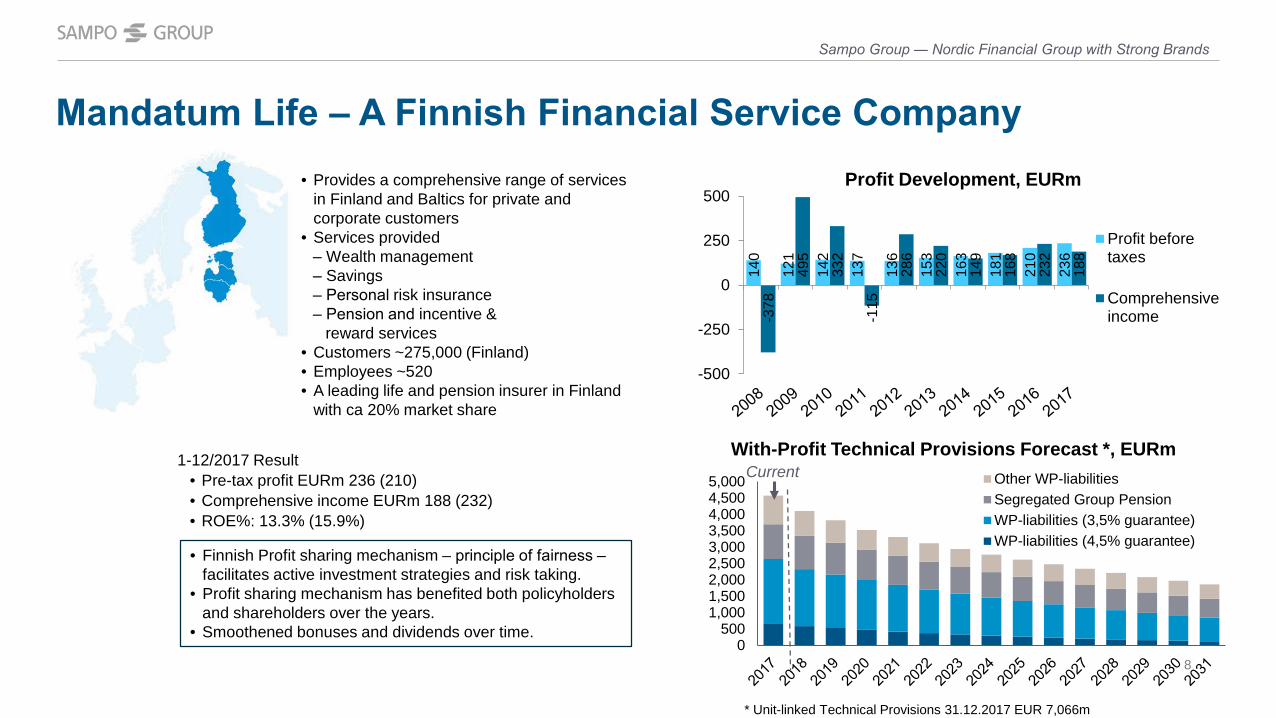
1-12/2017 Result• Pre-tax profit EURm 236 (210) • Comprehensive income EURm 188 (232)• ROE%: 13.3% (15.9%)
140
121
142
137
136
153
163
181
210
236
-378
495
332
-115
286
220
149
168
232
188
-500
-250
0
250
500
Profit beforetaxes
Comprehensiveincome
Profit Development, EURm
• Finnish Profit sharing mechanism – principle of fairness ‒ facilitates active investment strategies and risk taking.
• Profit sharing mechanism has benefited both policyholdersand shareholders over the years.
• Smoothened bonuses and dividends over time.
With-Profit Technical Provisions Forecast *, EURmCurrent
* Unit-linked Technical Provisions 31.12.2017 EUR 7,066m
• Provides a comprehensive range of servicesin Finland and Baltics for private and corporate customers
• Services provided‒ Wealth management‒ Savings‒ Personal risk insurance‒ Pension and incentive &
reward services• Customers ~275,000 (Finland)• Employees ~520• A leading life and pension insurer in Finland
with ca 20% market share
Sampo Group ― Nordic Financial Group with Strong Brands
Mandatum Life ‒ A Finnish Financial Service Company
8
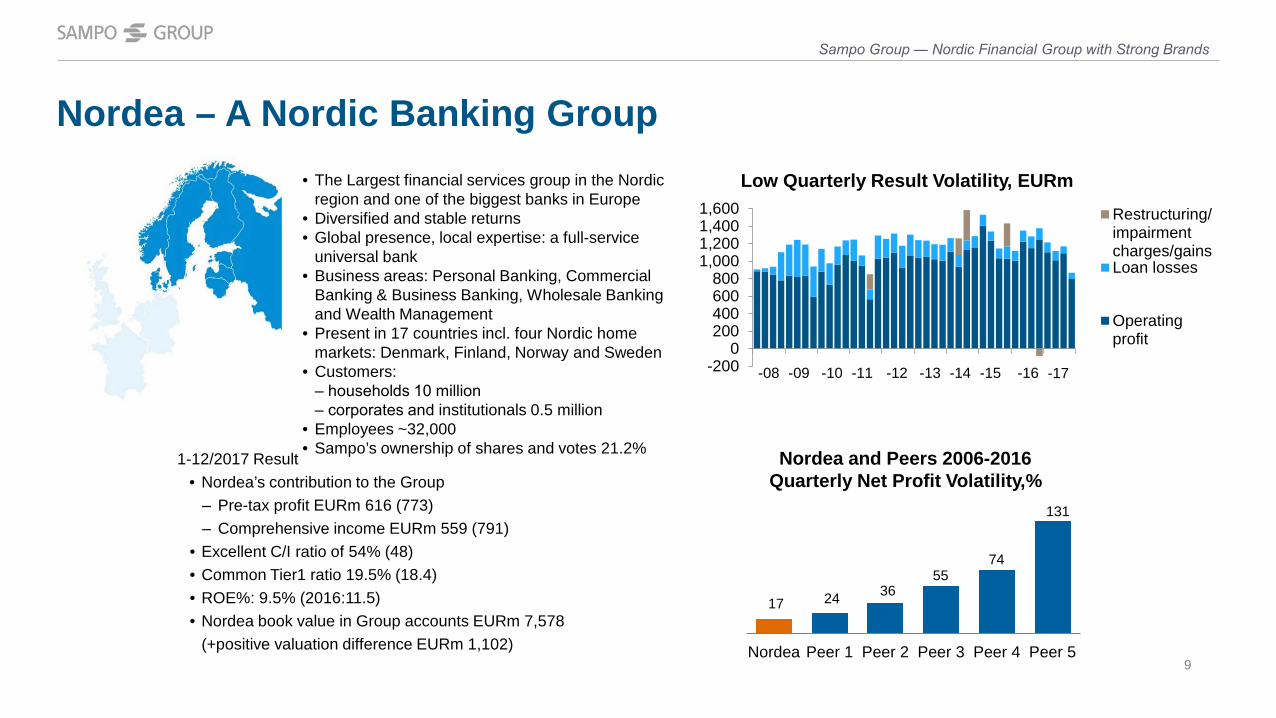
• The Largest financial services group in the Nordic region and one of the biggest banks in Europe
• Diversified and stable returns• Global presence, local expertise: a full-service
universal bank• Business areas: Personal Banking, Commercial
Banking & Business Banking, Wholesale Bankingand Wealth Management
• Present in 17 countries incl. four Nordic home markets: Denmark, Finland, Norway and Sweden
• Customers:‒ households 10 million‒ corporates and institutionals 0.5 million
• Employees ~32,000• Sampo’s ownership of shares and votes 21.2%
1-12/2017 Result• Nordea’s contribution to the Group
‒ Pre-tax profit EURm 616 (773)‒ Comprehensive income EURm 559 (791)
• Excellent C/I ratio of 54% (48)• Common Tier1 ratio 19.5% (18.4)• ROE%: 9.5% (2016:11.5)• Nordea book value in Group accounts EURm 7,578
(+positive valuation difference EURm 1,102)
-2000
200400600800
1,0001,2001,4001,600 Restructuring/
impairmentcharges/gainsLoan losses
Operatingprofit
-08 -09 -10 -11 -12 -13 -14 -15 -16
17 24 36 55
74
131
Nordea Peer 1 Peer 2 Peer 3 Peer 4 Peer 5
Nordea and Peers 2006-2016Quarterly Net Profit Volatility,%
Low Quarterly Result Volatility, EURm
-17
Nordea – A Nordic Banking Group
Sampo Group ― Nordic Financial Group with Strong Brands
9
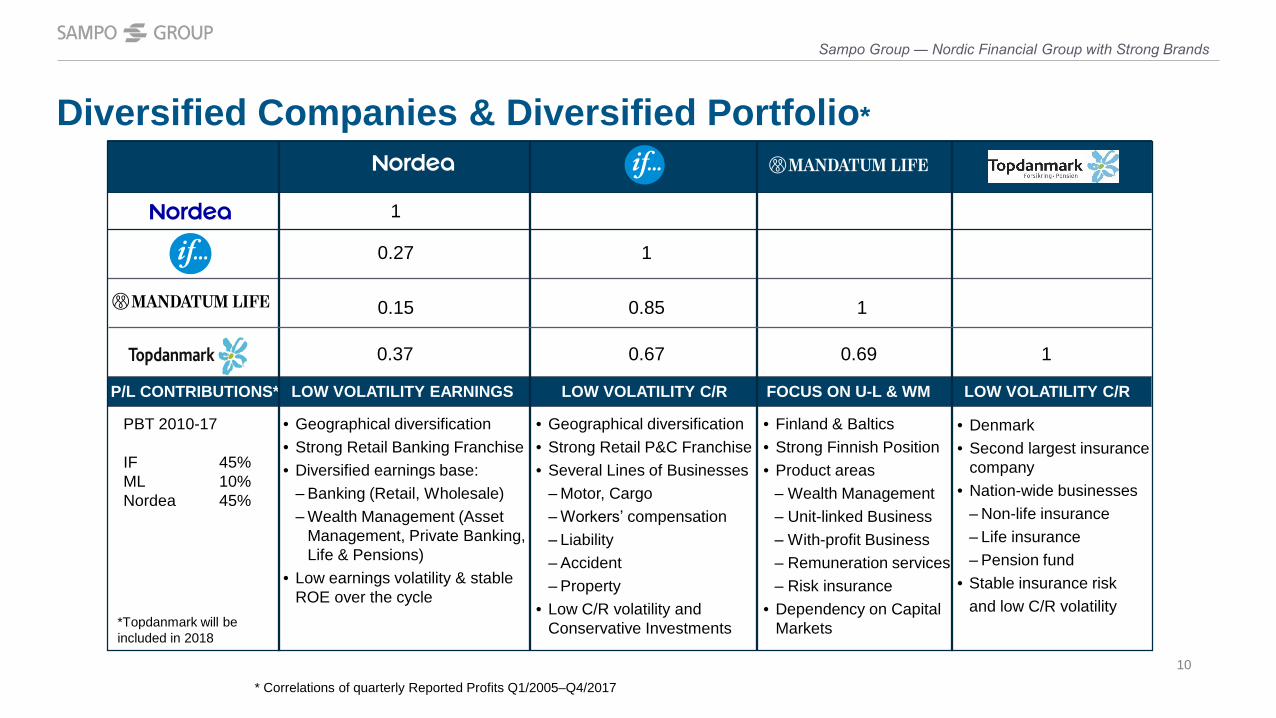
• Geographical diversification• Strong Retail P&C Franchise• Several Lines of Businesses
‒ Motor, Cargo‒ Workersʼ compensation‒ Liability ‒ Accident‒ Property
• Low C/R volatility and Conservative Investments
Diversified Companies & Diversified Portfolio*
• Geographical diversification• Strong Retail Banking Franchise• Diversified earnings base:
‒ Banking (Retail, Wholesale)‒ Wealth Management (Asset
Management, Private Banking, Life & Pensions)
• Low earnings volatility & stableROE over the cycle
• Finland & Baltics• Strong Finnish Position• Product areas
‒ Wealth Management‒ Unit-linked Business‒ With-profit Business ‒ Remuneration services‒ Risk insurance
• Dependency on Capital Markets
* Correlations of quarterly Reported Profits Q1/2005–Q4/2017
PBT 2010-17
IF 45%ML 10%Nordea 45%
P/L CONTRIBUTIONS* LOW VOLATILITY EARNINGS LOW VOLATILITY C/R FOCUS ON U-L & WM
0.27
0.15
1
0.85 1
1
Sampo Group ― Nordic Financial Group with Strong Brands
0.37 0.67 0.69 1
• Denmark• Second largest insurance
company• Nation-wide businesses
‒ Non-life insurance‒ Life insurance‒ Pension fund
• Stable insurance riskand low C/R volatility
LOW VOLATILITY C/R
*Topdanmark will beincluded in 2018
10
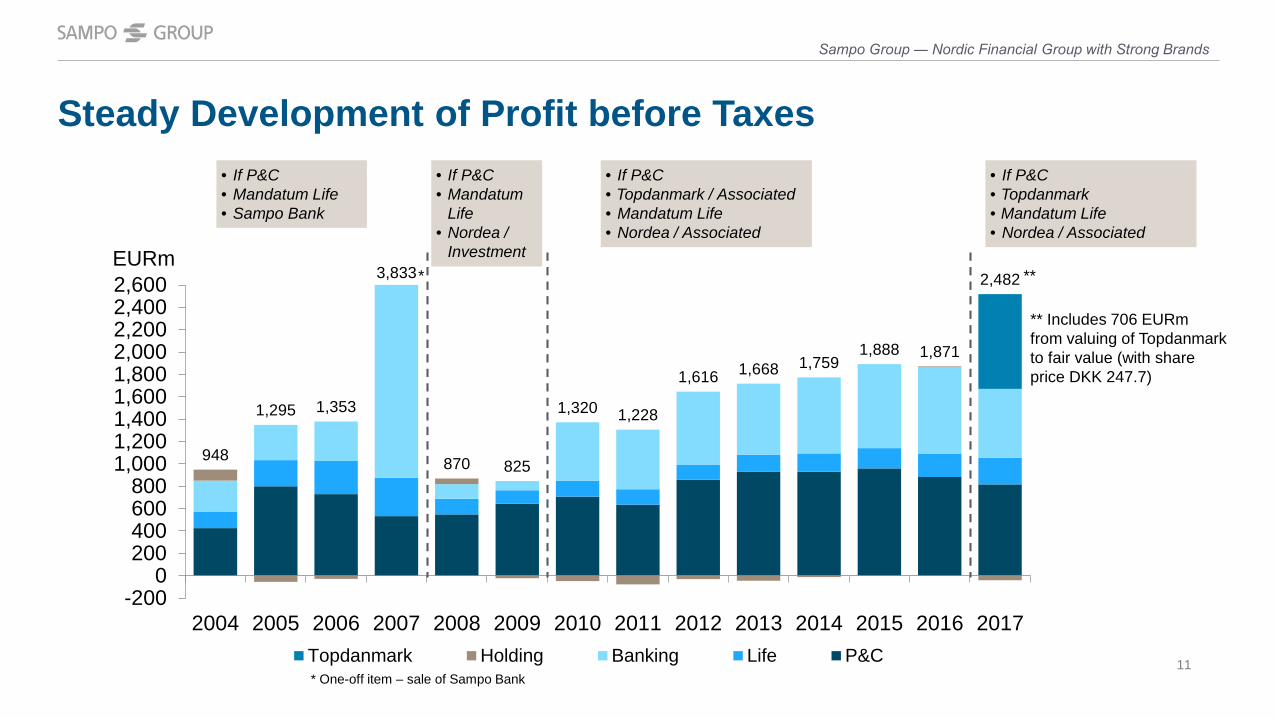
948
1,295 1,353
870 825
1,320 1,228
1,616 1,668 1,7591,888 1,871
2,482
-2000
200400600800
1,0001,2001,4001,6001,8002,0002,2002,4002,600
2004 2005 2006 2007 2008 2009 2010 2011 2012 2013 2014 2015 2016 2017Topdanmark Holding Banking Life P&C
Steady Development of Profit before Taxes
* One-off item – sale of Sampo Bank
EURm*
• If P&C• Mandatum Life• Sampo Bank
• If P&C• Mandatum
Life• Nordea /
Investment
• If P&C• Topdanmark / Associated• Mandatum Life • Nordea / Associated
3,833
Sampo Group ― Nordic Financial Group with Strong Brands
** Includes 706 EURmfrom valuing of Topdanmarkto fair value (with shareprice DKK 247.7)
• If P&C• Topdanmark• Mandatum Life • Nordea / Associated
**
11
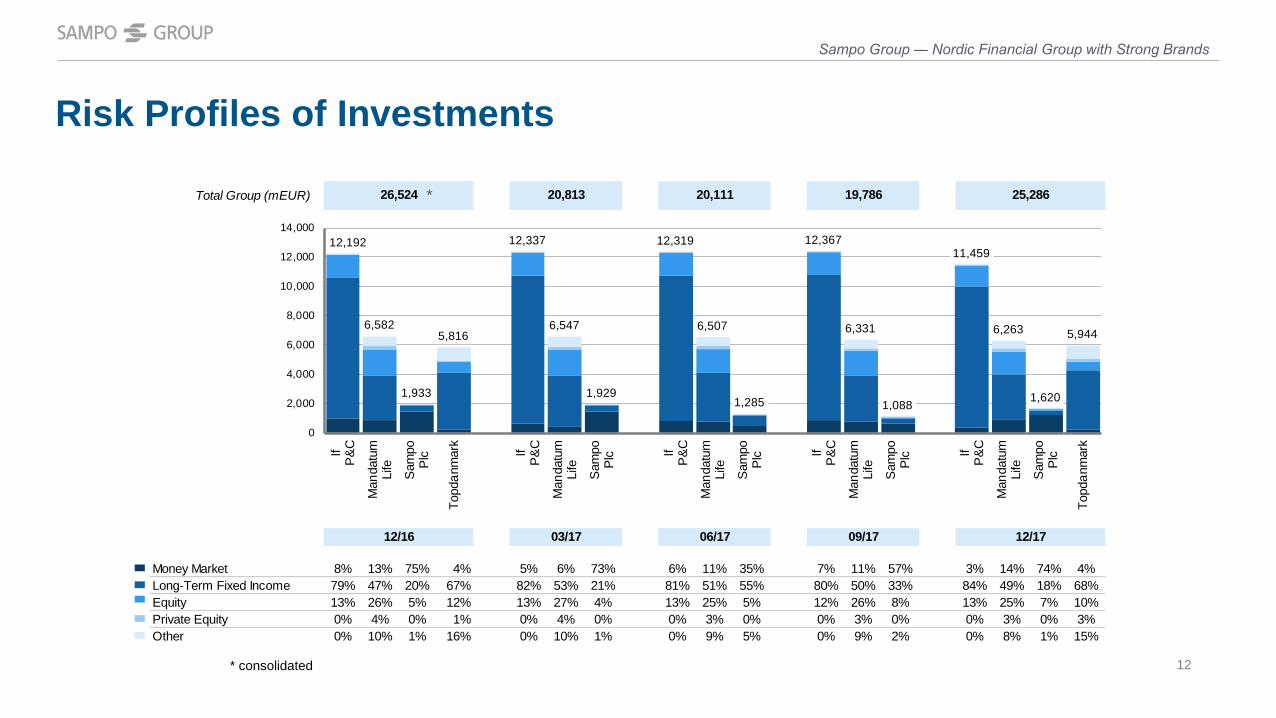
Risk Profiles of Investments
* consolidated
Sampo Group ― Nordic Financial Group with Strong Brands
Total Group (mEUR)
Money Market 8% 13% 75% 4% 5% 6% 73% 6% 11% 35% 7% 11% 57% 3% 14% 74% 4%Long-Term Fixed Income 79% 47% 20% 67% 82% 53% 21% 81% 51% 55% 80% 50% 33% 84% 49% 18% 68%Equity 13% 26% 5% 12% 13% 27% 4% 13% 25% 5% 12% 26% 8% 13% 25% 7% 10%Private Equity 0% 4% 0% 1% 0% 4% 0% 0% 3% 0% 0% 3% 0% 0% 3% 0% 3%Other 0% 10% 1% 16% 0% 10% 1% 0% 9% 5% 0% 9% 2% 0% 8% 1% 15%
12/16 03/17 06/17 09/17 12/17
26,524 20,813 20,111 19,786 25,286
12,192
6,582
1,933
5,816
12,337
6,547
1,929
12,319
6,507
1,285
12,367
6,331
1,088
11,459
6,263
1,620
5,944
0
2,000
4,000
6,000
8,000
10,000
12,000
14,000
IfP
&C
Man
datu
mLi
fe
Sam
poP
lc
Topd
anm
ark
IfP
&C
Man
datu
mLi
fe
Sam
poP
lc IfP
&C
Man
datu
mLi
fe
Sam
poP
lc IfP
&C
Man
datu
mLi
fe
Sam
poP
lc IfP
&C
Man
datu
mLi
fe
Sam
poP
lc
Topd
anm
ark
*
12
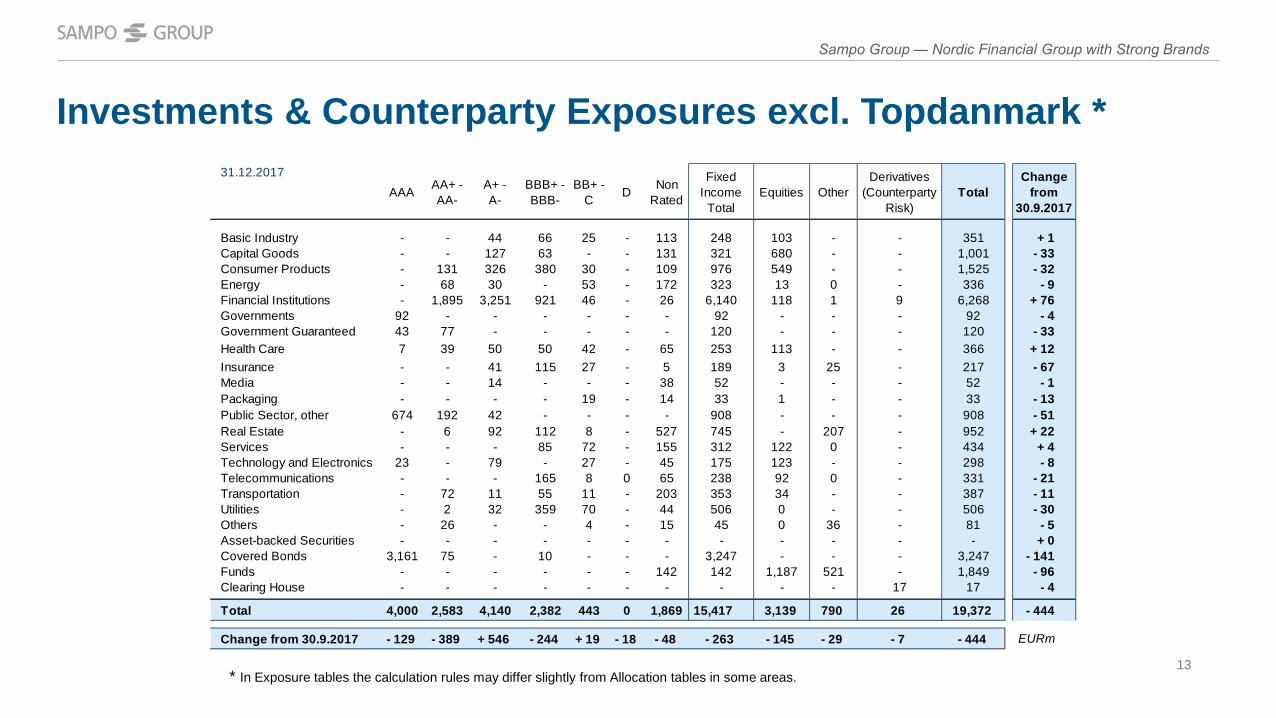
Investments & Counterparty Exposures excl. Topdanmark *
* In Exposure tables the calculation rules may differ slightly from Allocation tables in some areas.
Sampo Group ― Nordic Financial Group with Strong Brands
31.12.2017AAA AA+ -
AA-A+ - A-
BBB+ - BBB-
BB+ - C D Non
Rated
Fixed Income
TotalEquities Other
Derivatives (Counterparty
Risk)Total
Change from
30.9.2017
Basic Industry - - 44 66 25 - 113 248 103 - - 351 + 1Capital Goods - - 127 63 - - 131 321 680 - - 1,001 - 33 Consumer Products - 131 326 380 30 - 109 976 549 - - 1,525 - 32 Energy - 68 30 - 53 - 172 323 13 0 - 336 - 9 Financial Institutions - 1,895 3,251 921 46 - 26 6,140 118 1 9 6,268 + 76Governments 92 - - - - - - 92 - - - 92 - 4 Government Guaranteed 43 77 - - - - - 120 - - - 120 - 33 Health Care 7 39 50 50 42 - 65 253 113 - - 366 + 12Insurance - - 41 115 27 - 5 189 3 25 - 217 - 67 Media - - 14 - - - 38 52 - - - 52 - 1 Packaging - - - - 19 - 14 33 1 - - 33 - 13 Public Sector, other 674 192 42 - - - - 908 - - - 908 - 51 Real Estate - 6 92 112 8 - 527 745 - 207 - 952 + 22Services - - - 85 72 - 155 312 122 0 - 434 + 4Technology and Electronics 23 - 79 - 27 - 45 175 123 - - 298 - 8 Telecommunications - - - 165 8 0 65 238 92 0 - 331 - 21 Transportation - 72 11 55 11 - 203 353 34 - - 387 - 11 Utilities - 2 32 359 70 - 44 506 0 - - 506 - 30 Others - 26 - - 4 - 15 45 0 36 - 81 - 5 Asset-backed Securities - - - - - - - - - - - - + 0Covered Bonds 3,161 75 - 10 - - - 3,247 - - - 3,247 - 141 Funds - - - - - - 142 142 1,187 521 - 1,849 - 96 Clearing House - - - - - - - - - - 17 17 - 4
Total 4,000 2,583 4,140 2,382 443 0 1,869 15,417 3,139 790 26 19,372 - 444
Change from 30.9.2017 - 129 - 389 + 546 - 244 + 19 - 18 - 48 - 263 - 145 - 29 - 7 - 444 EURm
13
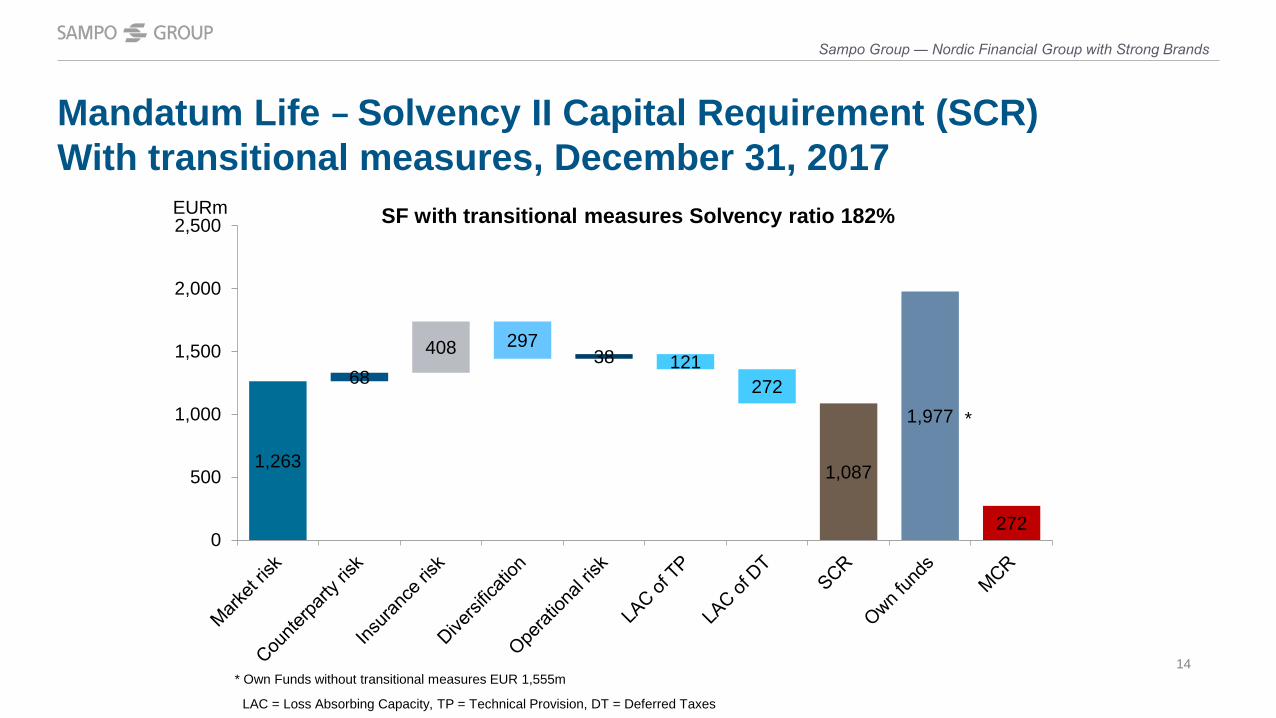
Mandatum Life – Solvency II Capital Requirement (SCR)With transitional measures, December 31, 2017
LAC = Loss Absorbing Capacity, TP = Technical Provision, DT = Deferred Taxes
* Own Funds without transitional measures EUR 1,555m
EURm SF with transitional measures Solvency ratio 182%
1,263
68408 297
38 121272
1,087
272
1,977
0
500
1,000
1,500
2,000
2,500
Sampo Group ― Nordic Financial Group with Strong Brands
*
14
EURm
672
1,40
4
272
790
167 215
1,51
0
3,87
5
0
500
1,000
1,500
2,000
2,500
3,000
3,500
4,000
1,35
8
1,15
0
9249
6
167 332
1,93
8
3,81
8
0
500
1,000
1,500
2,000
2,500
3,000
3,500
4,000
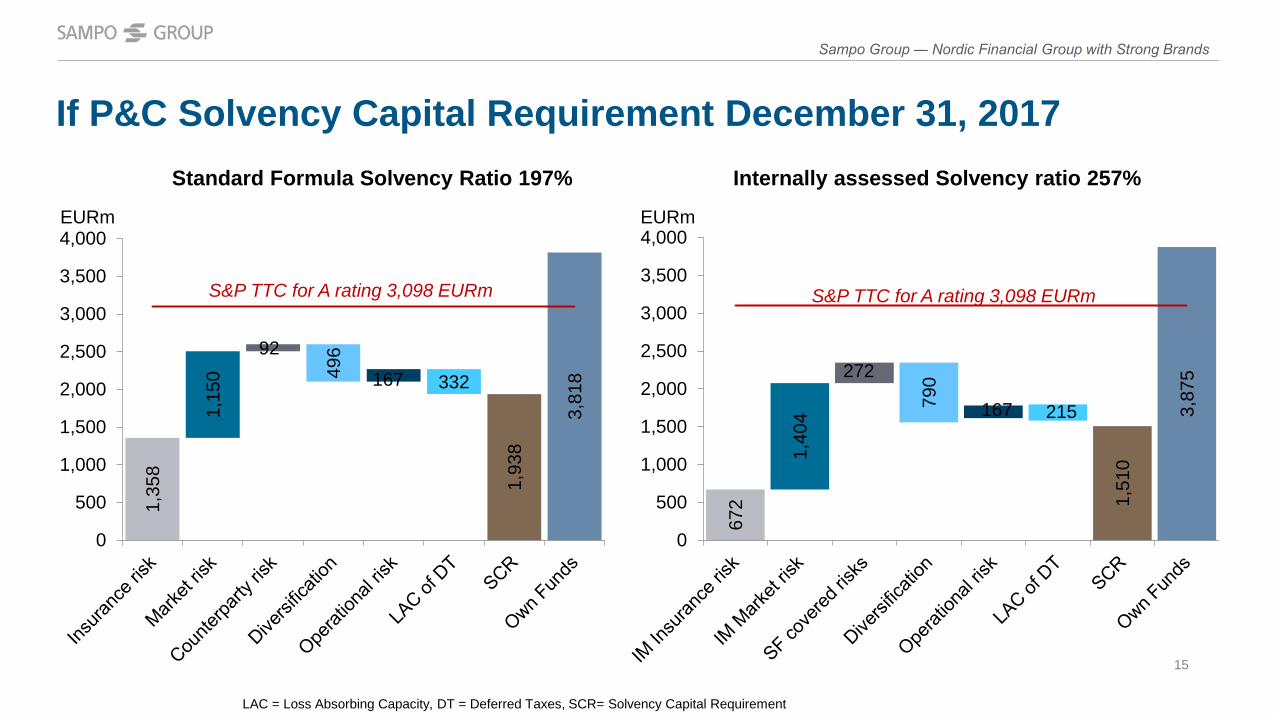
Internally assessed Solvency ratio 257%Standard Formula Solvency Ratio 197%
LAC = Loss Absorbing Capacity, DT = Deferred Taxes, SCR= Solvency Capital Requirement
EURm
S&P TTC for A rating 3,098 EURm S&P TTC for A rating 3,098 EURm
If P&C Solvency Capital Requirement December 31, 2017
Sampo Group ― Nordic Financial Group with Strong Brands
15
EURm
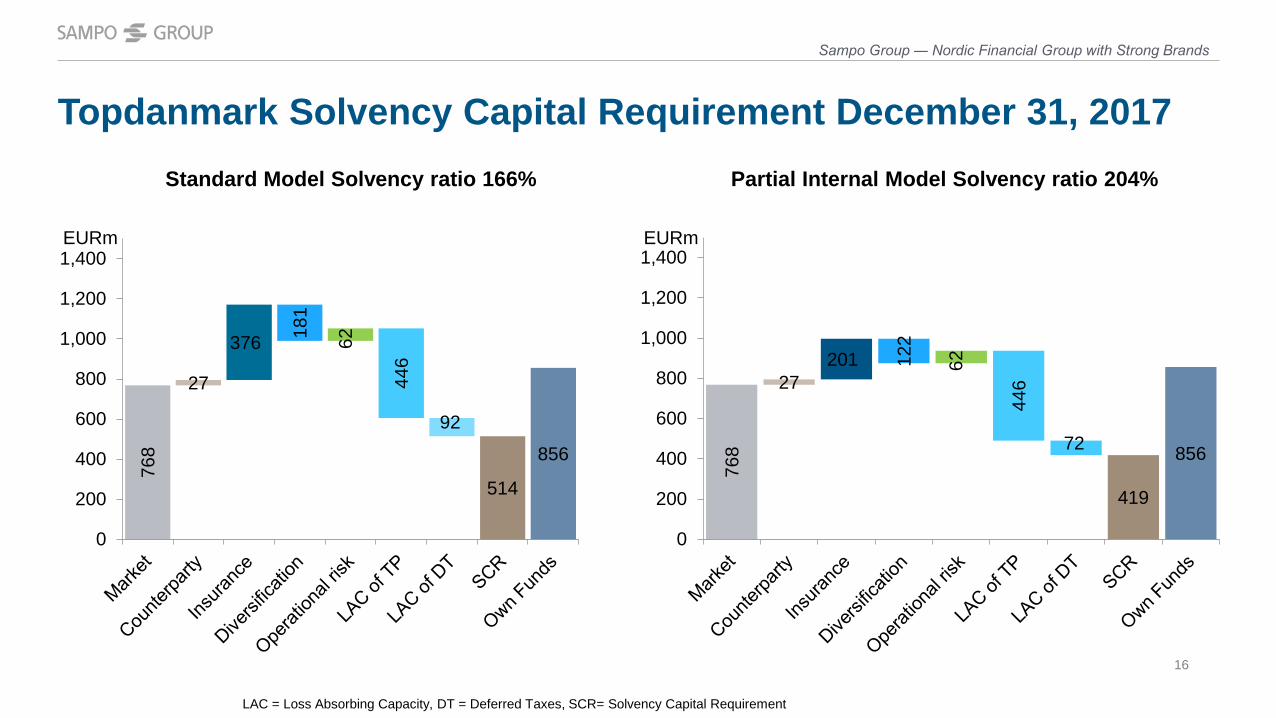
Partial Internal Model Solvency ratio 204%
LAC = Loss Absorbing Capacity, DT = Deferred Taxes, SCR= Solvency Capital Requirement
16
Topdanmark Solvency Capital Requirement December 31, 201776
8
27
376 181
62
446
92
514
856
0
200
400
600
800
1,000
1,200
1,400
Standard Model Solvency ratio 166%
EURm
768
27201 12
2
62
446
72
419
856
0
200
400
600
800
1,000
1,200
1,400
Sampo Group ― Nordic Financial Group with Strong Brands
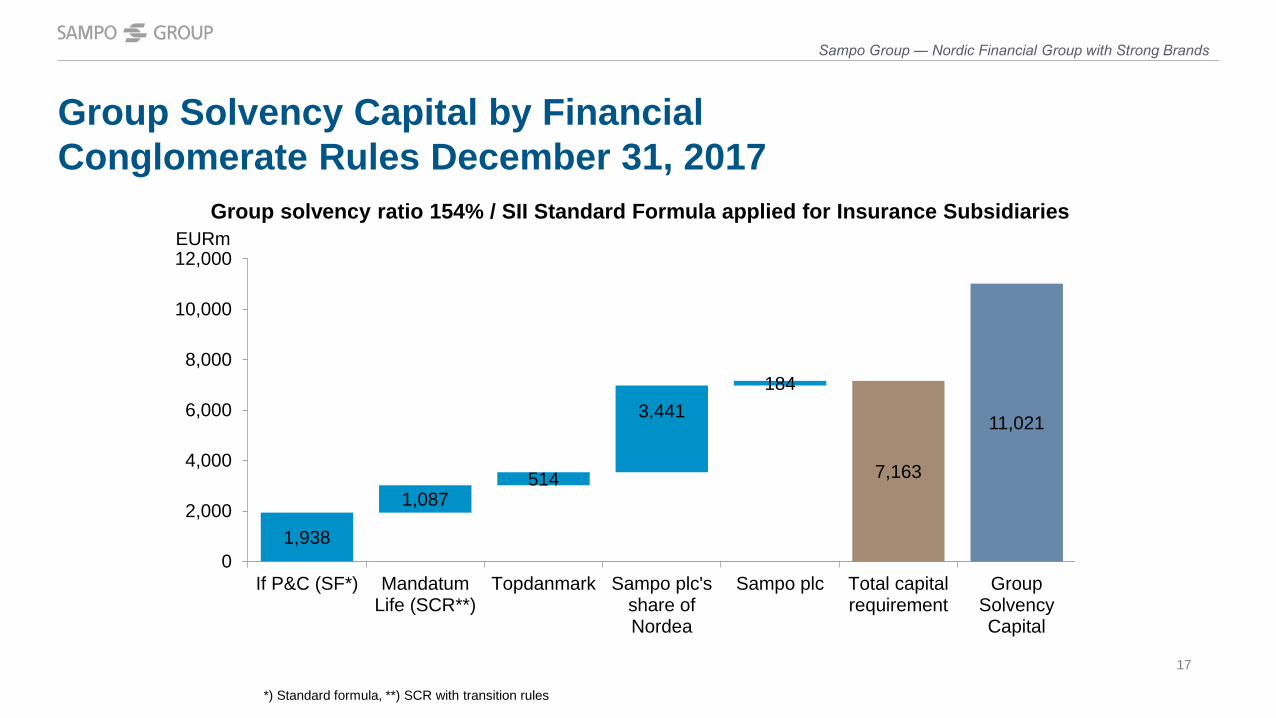
1,938
1,087514
3,441184
7,163
11,021
0
2,000
4,000
6,000
8,000
10,000
12,000
If P&C (SF*) MandatumLife (SCR**)
Topdanmark Sampo plc'sshare ofNordea
Sampo plc Total capitalrequirement
GroupSolvencyCapital
Group Solvency Capital by Financial Conglomerate Rules December 31, 2017
EURmGroup solvency ratio 154% / SII Standard Formula applied for Insurance Subsidiaries
*) Standard formula, **) SCR with transition rules
Sampo Group ― Nordic Financial Group with Strong Brands
17
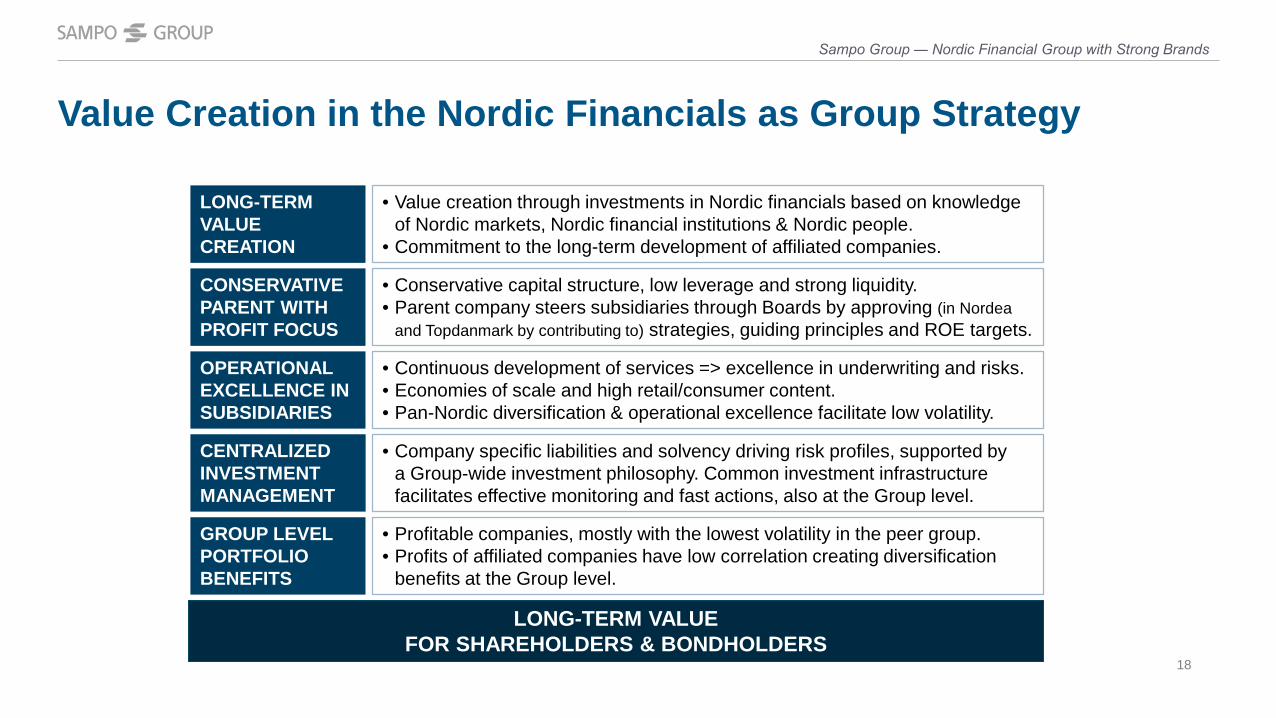
Value Creation in the Nordic Financials as Group Strategy
LONG-TERM VALUE CREATION
• Value creation through investments in Nordic financials based on knowledge of Nordic markets, Nordic financial institutions & Nordic people.
• Commitment to the long-term development of affiliated companies.
OPERATIONAL EXCELLENCE IN SUBSIDIARIES
• Continuous development of services => excellence in underwriting and risks.• Economies of scale and high retail/consumer content.• Pan-Nordic diversification & operational excellence facilitate low volatility.
CONSERVATIVE PARENT WITH PROFIT FOCUS
• Conservative capital structure, low leverage and strong liquidity.• Parent company steers subsidiaries through Boards by approving (in Nordea
and Topdanmark by contributing to) strategies, guiding principles and ROE targets.
GROUP LEVEL PORTFOLIO BENEFITS
• Profitable companies, mostly with the lowest volatility in the peer group.• Profits of affiliated companies have low correlation creating diversification
benefits at the Group level.
LONG-TERM VALUE FOR SHAREHOLDERS & BONDHOLDERS
CENTRALIZEDINVESTMENT MANAGEMENT
• Company specific liabilities and solvency driving risk profiles, supported bya Group-wide investment philosophy. Common investment infrastructure facilitates effective monitoring and fast actions, also at the Group level.
Sampo Group ― Nordic Financial Group with Strong Brands
18
Sampo Group Nordic Financial Group with Strong Brands 3-18
If P&C Diversified Nordic P&C Insurer 19-24Mandatum Life A Finnish Financial Services Company 25-29Sampo plc Parent Company with Capacity to Generate Funds 30-37Appendix Separate Supplementary Information 38-49
19
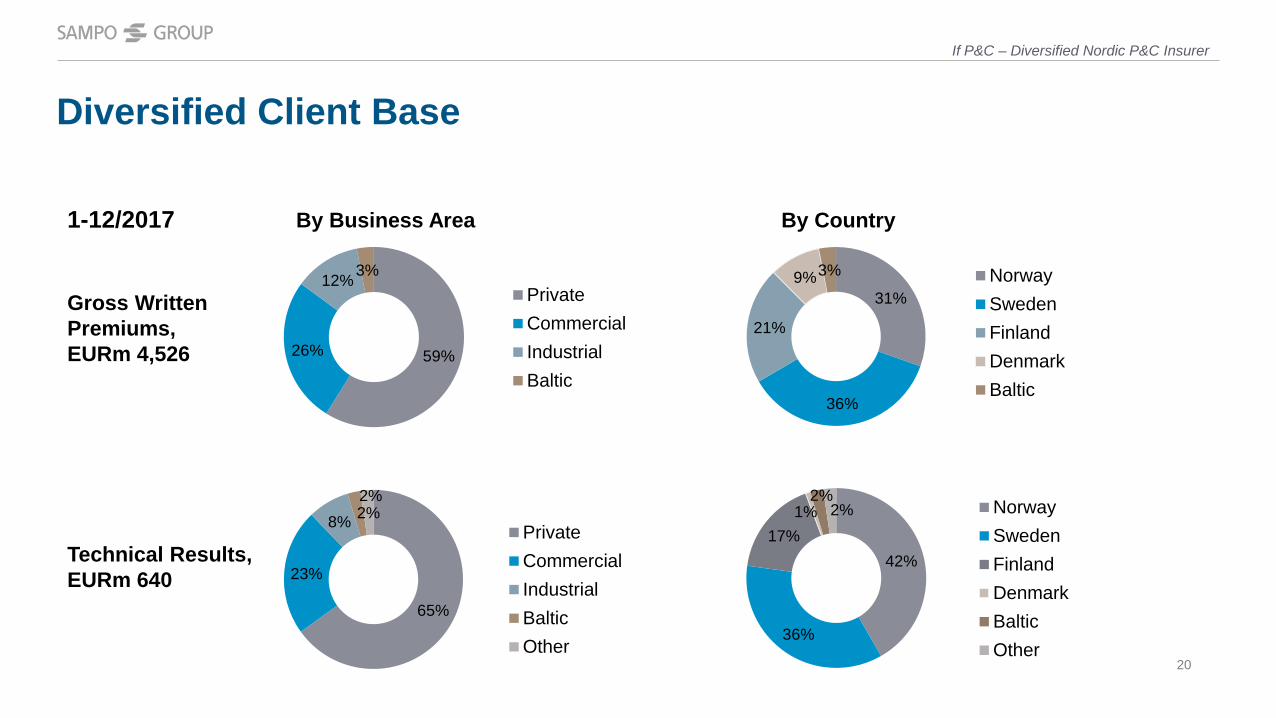
59%26%
12%3%PrivateCommercialIndustrialBaltic
By Business Area By Country
65%
23%
8%2%2%
PrivateCommercialIndustrialBalticOther
Technical Results,EURm 640
42%
36%
17%1%
2%2% Norway
SwedenFinlandDenmarkBalticOther
Gross WrittenPremiums, EURm 4,526
31%
36%
21%
9%3% NorwaySwedenFinlandDenmarkBaltic
If P&C – Diversified Nordic P&C Insurer
Diversified Client Base
1-12/2017
20
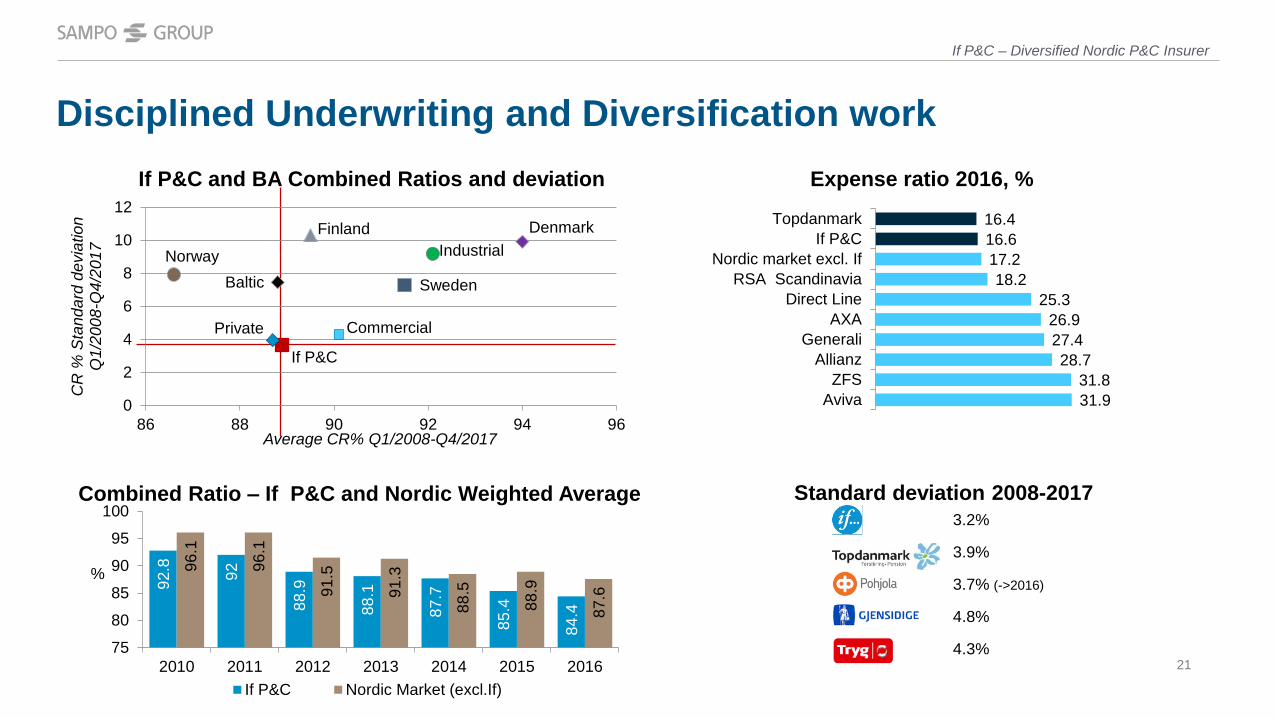
Expense ratio 2016, %
Combined Ratio ‒ If P&C and Nordic Weighted Average
If P&C and BA Combined Ratios and deviation
Standard deviation 2008-20173.2%
4.3%
4.8%
3.7% (->2016)
3.9%
92.8 92
88.9
88.1
87.7
85.4
84.4
96.1
96.1
91.5
91.3
88.5
88.9
87.6
75
80
85
90
95
100
2010 2011 2012 2013 2014 2015 2016If P&C Nordic Market (excl.If)
Disciplined Underwriting and Diversification work
%
16.416.617.218.2
25.326.927.428.7
31.831.9
TopdanmarkIf P&C
Nordic market excl. IfRSA Scandinavia
Direct LineAXA
GeneraliAllianz
ZFSAviva
Private Commercial
Industrial
Baltic
If P&C
Norway
Sweden
Finland Denmark
0
2
4
6
8
10
12
86 88 90 92 94 96
CR
% S
tand
ard
devi
atio
nQ
1/20
08-Q
4/20
17
Average CR% Q1/2008-Q4/2017
If P&C – Diversified Nordic P&C Insurer
21
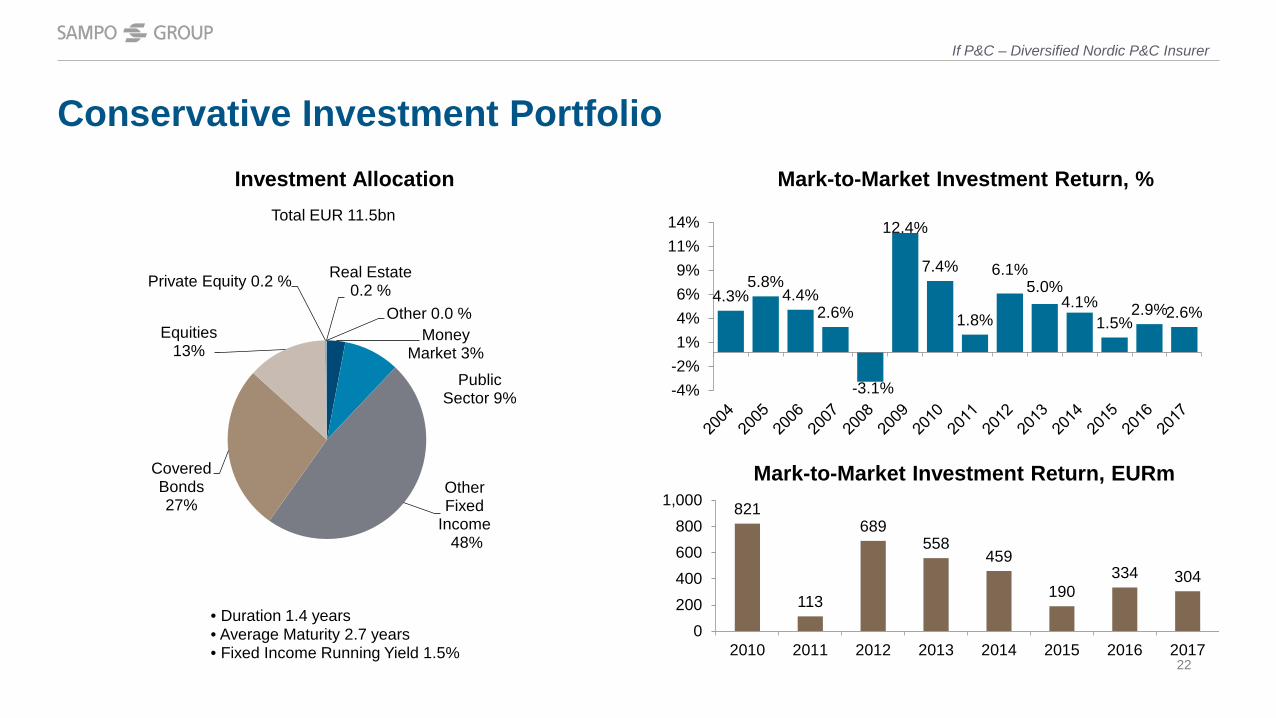
Conservative Investment Portfolio
• Duration 1.4 years• Average Maturity 2.7 years• Fixed Income Running Yield 1.5%
Mark-to-Market Investment Return, %Investment Allocation
4.3%5.8%
4.4%2.6%
-3.1%
12.4%
7.4%
1.8%
6.1%5.0%
4.1%1.5%
2.9%2.6%
-4%-2%1%4%6%9%
11%14%
Mark-to-Market Investment Return, EURm821
113
689558
459
190334 304
0200400600800
1,000
2010 2011 2012 2013 2014 2015 2016 2017
Total EUR 11.5bn
If P&C – Diversified Nordic P&C Insurer
Money Market 3%
Public Sector 9%
Other Fixed
Income48%
Covered Bonds27%
Equities13%
Private Equity 0.2 % Real Estate0.2 %
Other 0.0 %
22
0
50
100
150
200
250
300
350
Investment result
Technical result
Operating result
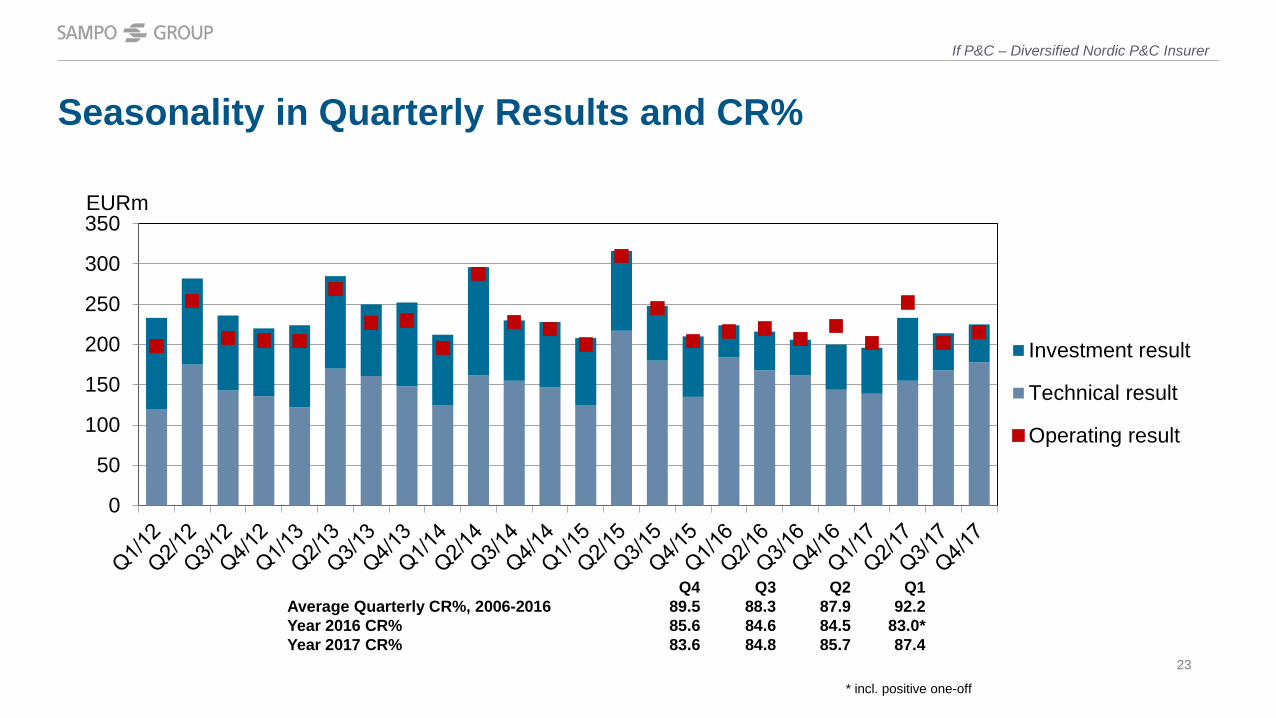
Seasonality in Quarterly Results and CR%
Q4 Q3 Q2 Q1Average Quarterly CR%, 2006-2016 89.5 88.3 87.9 92.2Year 2016 CR% 85.6 84.6 84.5 83.0*Year 2017 CR% 83.6 84.8 85.7 87.4
EURm
* incl. positive one-off
If P&C – Diversified Nordic P&C Insurer
23
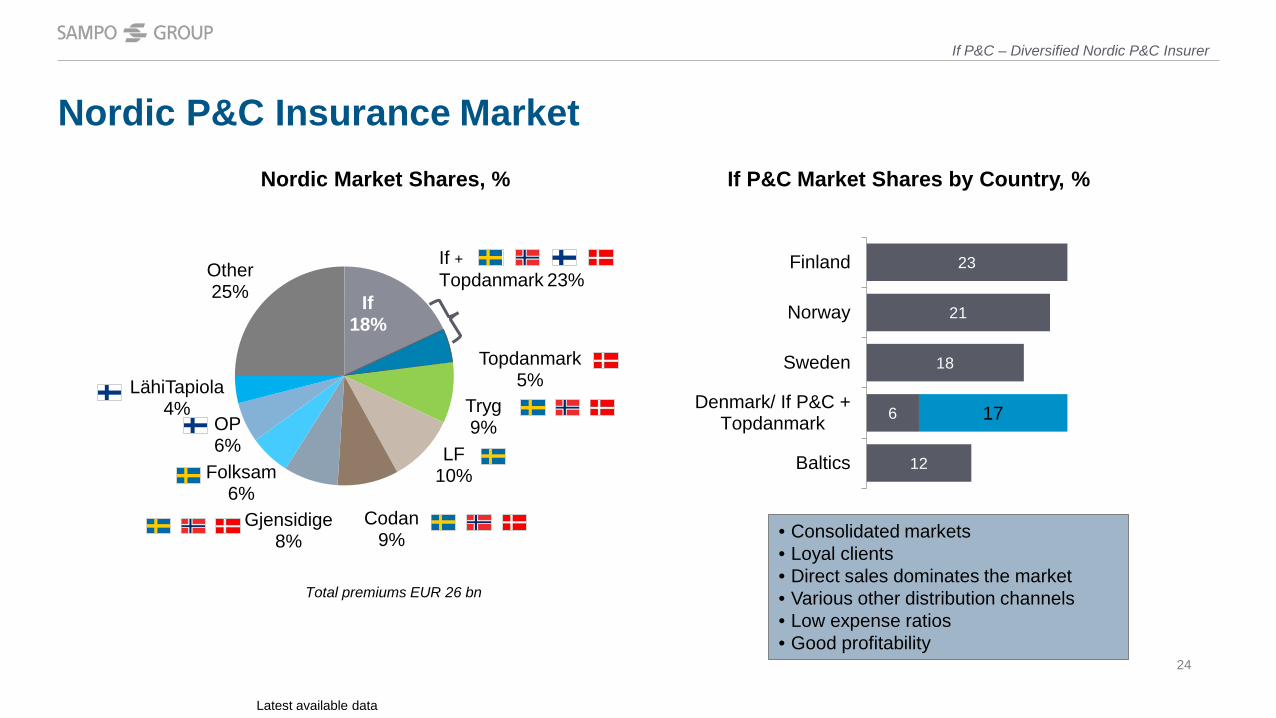
Nordic P&C Insurance Market
23
21
18
6
12
17
Finland
Norway
Sweden
Denmark/ If P&C +Topdanmark
Baltics
If18%
Topdanmark5%
Tryg9%
LF10%
Codan9%
Gjensidige8%
Folksam6%
OP6%
LähiTapiola4%
Other25%
If + Topdanmark 23%
Total premiums EUR 26 bn
• Consolidated markets• Loyal clients• Direct sales dominates the market• Various other distribution channels• Low expense ratios• Good profitability
Latest available data
Nordic Market Shares, % If P&C Market Shares by Country, %
If P&C – Diversified Nordic P&C Insurer
24
Sampo Group Nordic Financial Group with Strong Brands 3-18
If P&C Diversified Nordic P&C Insurer 19-24Mandatum Life A Finnish Financial Services Company 25-29Sampo plc Parent Company with Capacity to Generate Funds 30-37Appendix Separate Supplementary Information 38-49
25
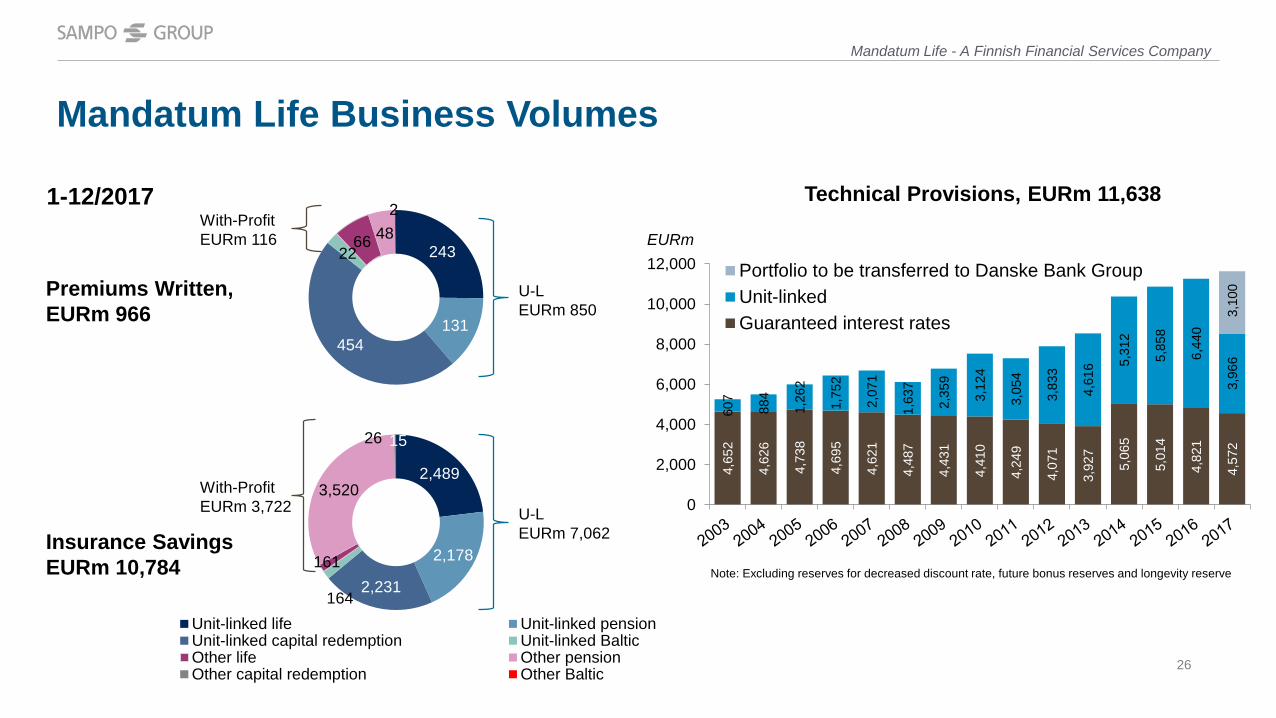
Premiums Written, EURm 966
Insurance SavingsEURm 10,784
243
131454
2266 48
2
2,489
2,178
2,231164
161
3,520
26 15
Unit-linked life Unit-linked pensionUnit-linked capital redemption Unit-linked BalticOther life Other pensionOther capital redemption Other Baltic
Mandatum Life Business Volumes
U-LEURm 7,062
With-ProfitEURm 3,722
U-L EURm 850
With-ProfitEURm 116
4,65
2
4,62
6
4,73
8
4,69
5
4,62
1
4,48
7
4,43
1
4,41
0
4,24
9
4,07
1
3,92
7
5,06
5
5,01
4
4,82
1
4,57
2
607
884
1,26
2
1,75
2
2,07
1
1,63
7
2,35
9
3,12
4
3,05
4
3,83
3
4,61
6 5,31
2
5,85
8
6,44
0
3,96
63,
100
0
2,000
4,000
6,000
8,000
10,000
12,000 Portfolio to be transferred to Danske Bank GroupUnit-linkedGuaranteed interest rates
Technical Provisions, EURm 11,638
EURm
Mandatum Life - A Finnish Financial Services Company
Note: Excluding reserves for decreased discount rate, future bonus reserves and longevity reserve
1-12/2017
26
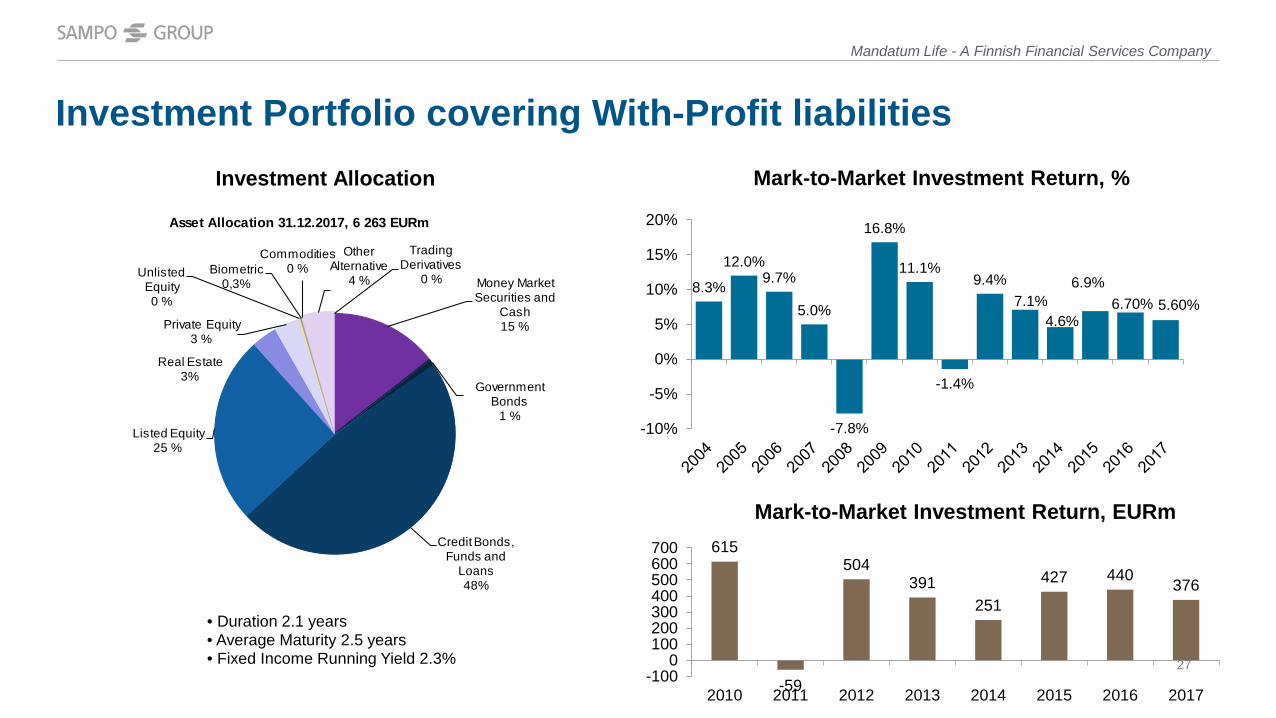
Investment Portfolio covering With-Profit liabilitiesMark-to-Market Investment Return, %Investment Allocation
8.3%
12.0%9.7%
5.0%
-7.8%
16.8%
11.1%
-1.4%
9.4%7.1%
4.6%
6.9%6.70% 5.60%
-10%
-5%
0%
5%
10%
15%
20%
615
-59
504391
251
427 440 376
-1000
100200300400500600700
2010 2011 2012 2013 2014 2015 2016 2017
• Duration 2.1 years• Average Maturity 2.5 years• Fixed Income Running Yield 2.3%
Mark-to-Market Investment Return, EURm
Mandatum Life - A Finnish Financial Services Company
Asset Allocation 31.12.2017, 6 263 EURm
Money Market Securities and
Cash15 %
Government Bonds
1 %
Credit Bonds, Funds and
Loans48%
Listed Equity25 %
Real Estate3%
Private Equity3 %
Unlisted Equity0 %
Biometric0,3%
Commodities0 %
Other Alternative
4 %
Trading Derivatives
0 %
27
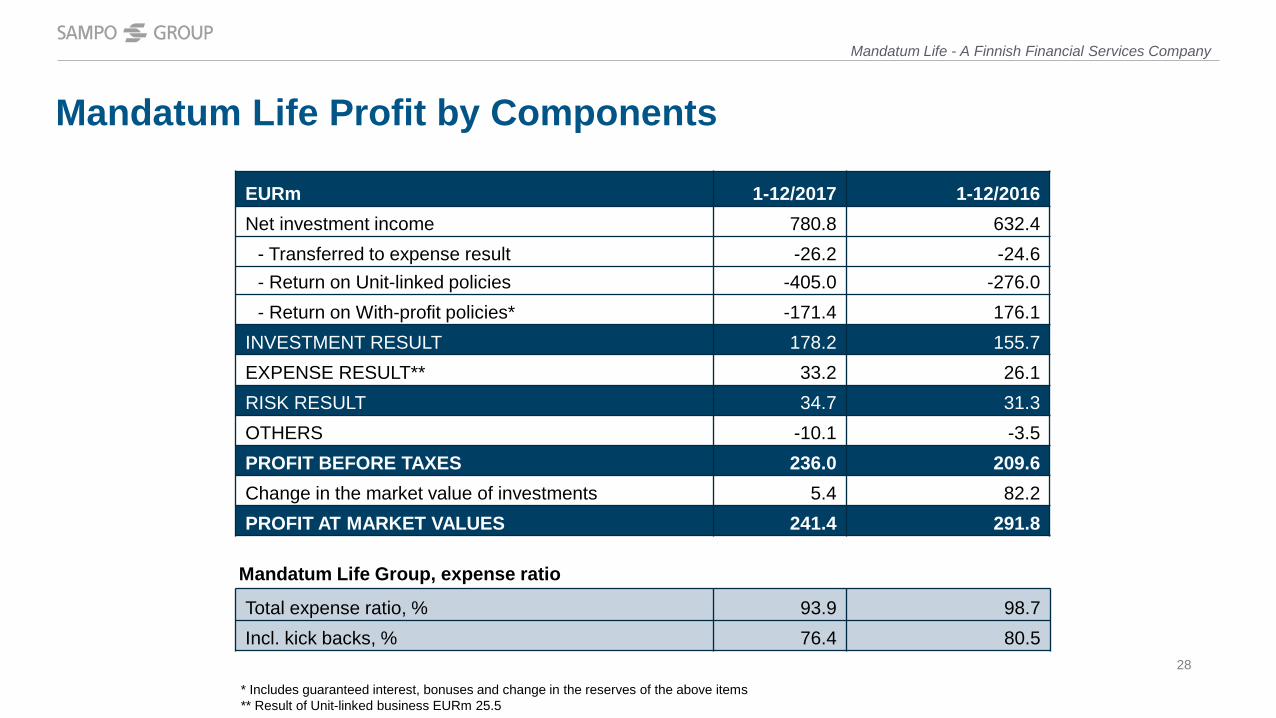
Mandatum Life Profit by Components
Total expense ratio, % 93.9 98.7Incl. kick backs, % 76.4 80.5
EURm 1-12/2017 1-12/2016Net investment income 780.8 632.4
- Transferred to expense result -26.2 -24.6- Return on Unit-linked policies -405.0 -276.0- Return on With-profit policies* -171.4 176.1
INVESTMENT RESULT 178.2 155.7EXPENSE RESULT** 33.2 26.1RISK RESULT 34.7 31.3OTHERS -10.1 -3.5PROFIT BEFORE TAXES 236.0 209.6Change in the market value of investments 5.4 82.2PROFIT AT MARKET VALUES 241.4 291.8
Mandatum Life Group, expense ratio
* Includes guaranteed interest, bonuses and change in the reserves of the above items** Result of Unit-linked business EURm 25.5
Mandatum Life - A Finnish Financial Services Company
28
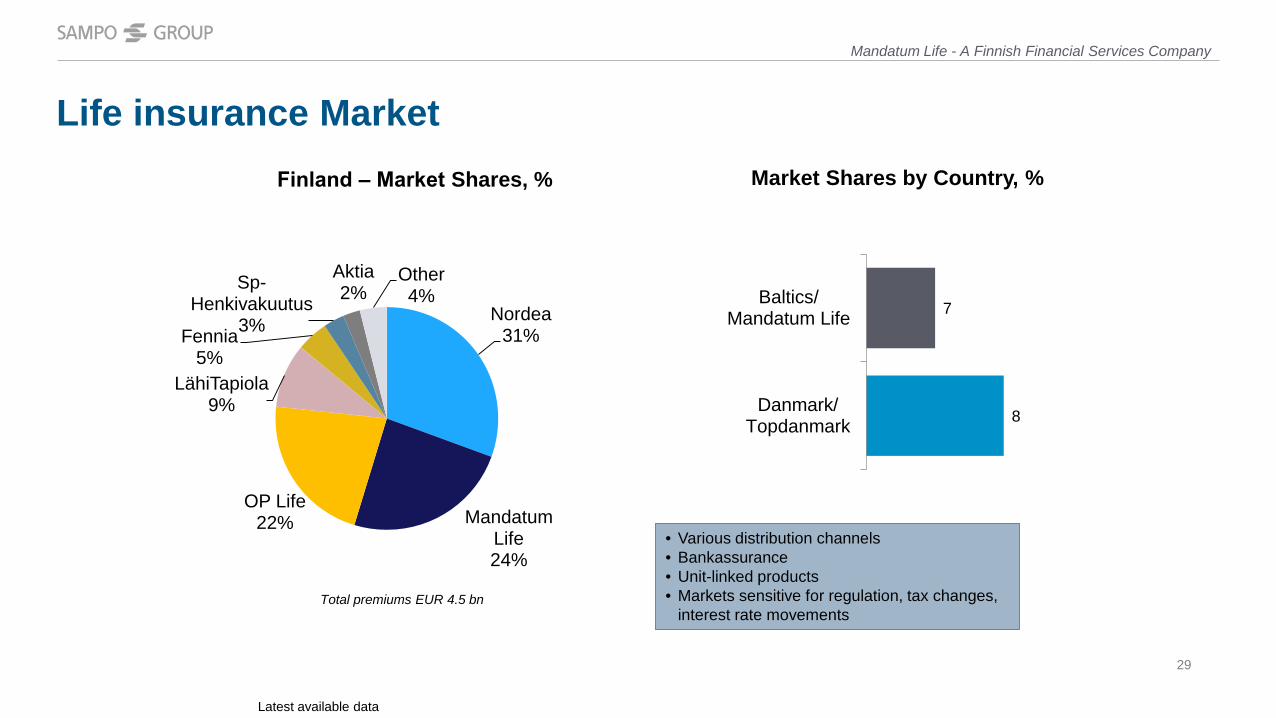
Life insurance Market
Nordea31%
Mandatum Life24%
OP Life22%
LähiTapiola9%
Fennia5%
Sp-Henkivakuutus
3%
Aktia 2%
Other4%
Total premiums EUR 4.5 bn
• Various distribution channels• Bankassurance• Unit-linked products• Markets sensitive for regulation, tax changes,
interest rate movements
7
8
Baltics/Mandatum Life
Danmark/Topdanmark
Latest available data
Finland ‒ Market Shares, % Market Shares by Country, %
Mandatum Life - A Finnish Financial Services Company
29
Sampo Group Nordic Financial Group with Strong Brands 3-18
If P&C Diversified Nordic P&C Insurer 19-24Mandatum Life A Finnish Financial Services Company 25-29Sampo plc Parent Company with Capacity to Generate Funds 30-37Appendix Separate Supplementary Information 38-49
30
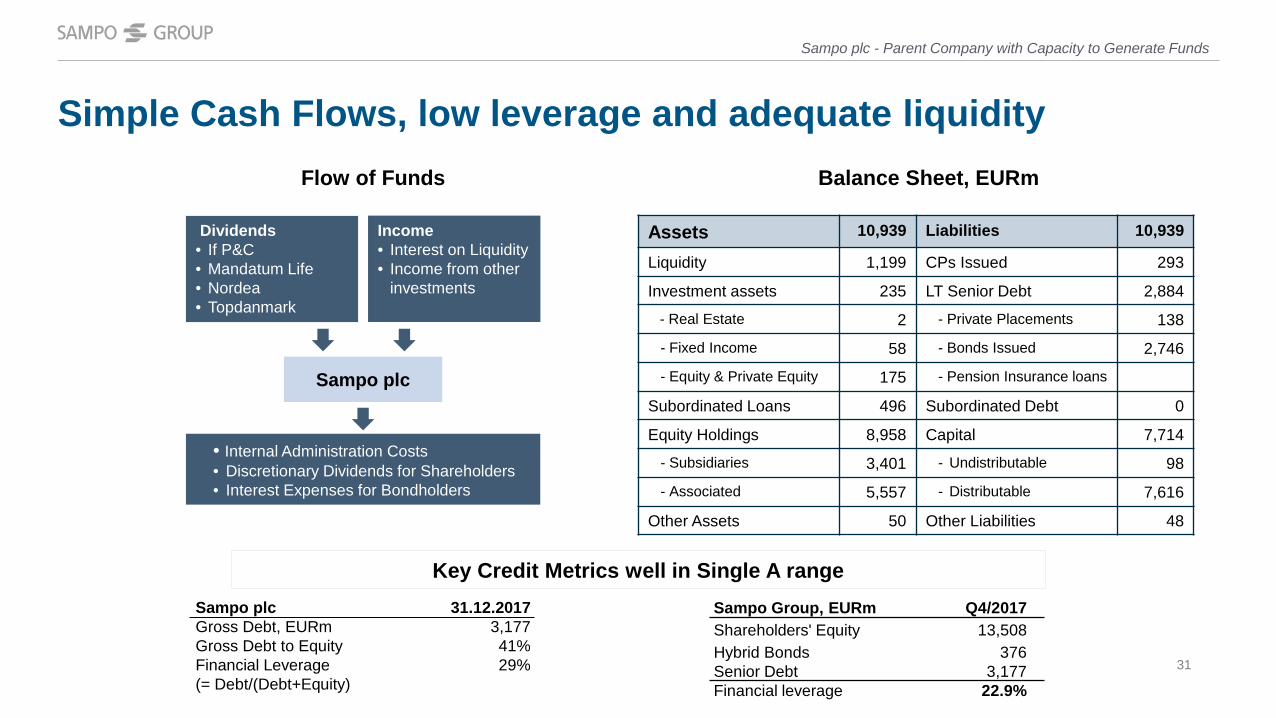
Simple Cash Flows, low leverage and adequate liquidity
Dividends • If P&C• Mandatum Life• Nordea• Topdanmark
• Internal Administration Costs• Discretionary Dividends for Shareholders• Interest Expenses for Bondholders
Income• Interest on Liquidity • Income from other
investments
Sampo plc
Assets 10,939 Liabilities 10,939
Liquidity 1,199 CPs Issued 293
Investment assets 235 LT Senior Debt 2,884
- Real Estate 2 - Private Placements 138
- Fixed Income 58 - Bonds Issued 2,746
- Equity & Private Equity 175 - Pension Insurance loans
Subordinated Loans 496 Subordinated Debt 0
Equity Holdings 8,958 Capital 7,714
- Subsidiaries 3,401 - Undistributable 98
- Associated 5,557 - Distributable 7,616
Other Assets 50 Other Liabilities 48
Flow of Funds Balance Sheet, EURm
Key Credit Metrics well in Single A rangeSampo plc 31.12.2017Gross Debt, EURm 3,177Gross Debt to Equity 41%Financial Leverage 29% (= Debt/(Debt+Equity)
Sampo Group, EURm Q4/2017Shareholders' Equity 13,508Hybrid Bonds 376Senior Debt 3,177Financial leverage 22.9%
Sampo plc - Parent Company with Capacity to Generate Funds
31
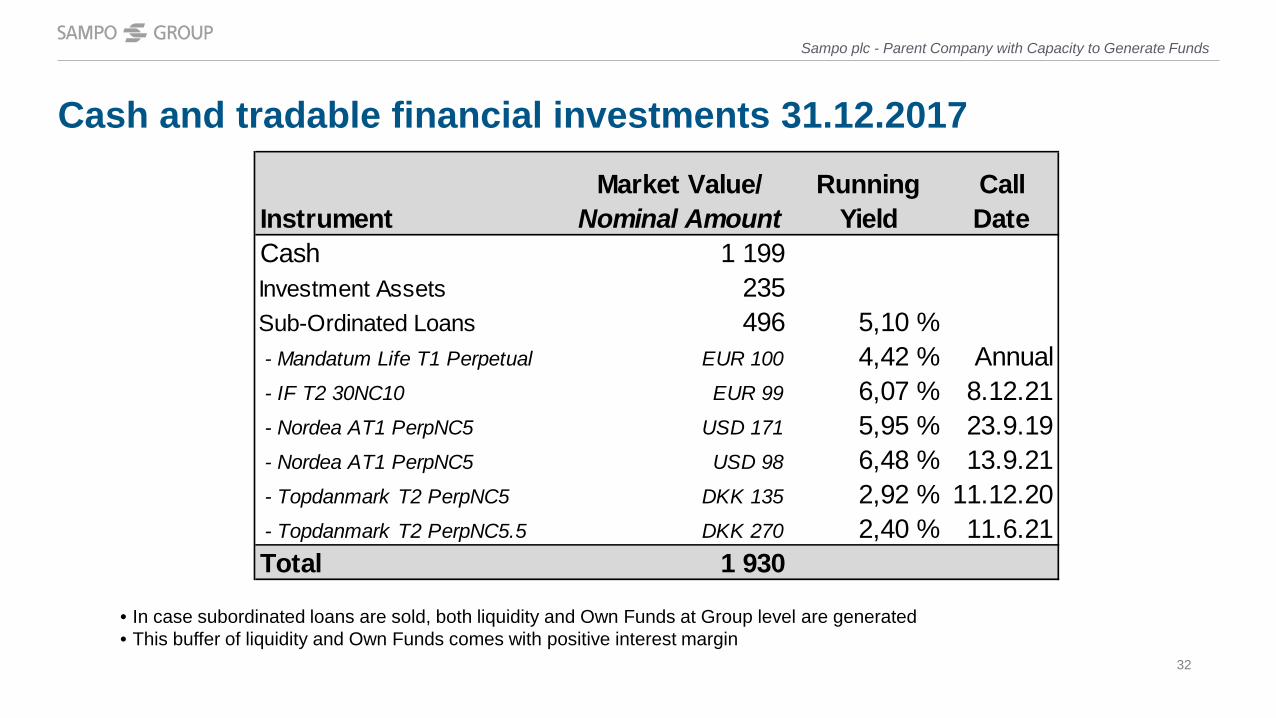
Cash and tradable financial investments 31.12.2017
• In case subordinated loans are sold, both liquidity and Own Funds at Group level are generated• This buffer of liquidity and Own Funds comes with positive interest margin
Sampo plc - Parent Company with Capacity to Generate Funds
InstrumentMarket Value/
Nominal AmountRunning
YieldCall Date
Cash 1 199Investment Assets 235Sub-Ordinated Loans 496 5,10 % - Mandatum Life T1 Perpetual EUR 100 4,42 % Annual - IF T2 30NC10 EUR 99 6,07 % 8.12.21 - Nordea AT1 PerpNC5 USD 171 5,95 % 23.9.19 - Nordea AT1 PerpNC5 USD 98 6,48 % 13.9.21 - Topdanmark T2 PerpNC5 DKK 135 2,92 % 11.12.20 - Topdanmark T2 PerpNC5.5 DKK 270 2,40 % 11.6.21Total 1 930
32
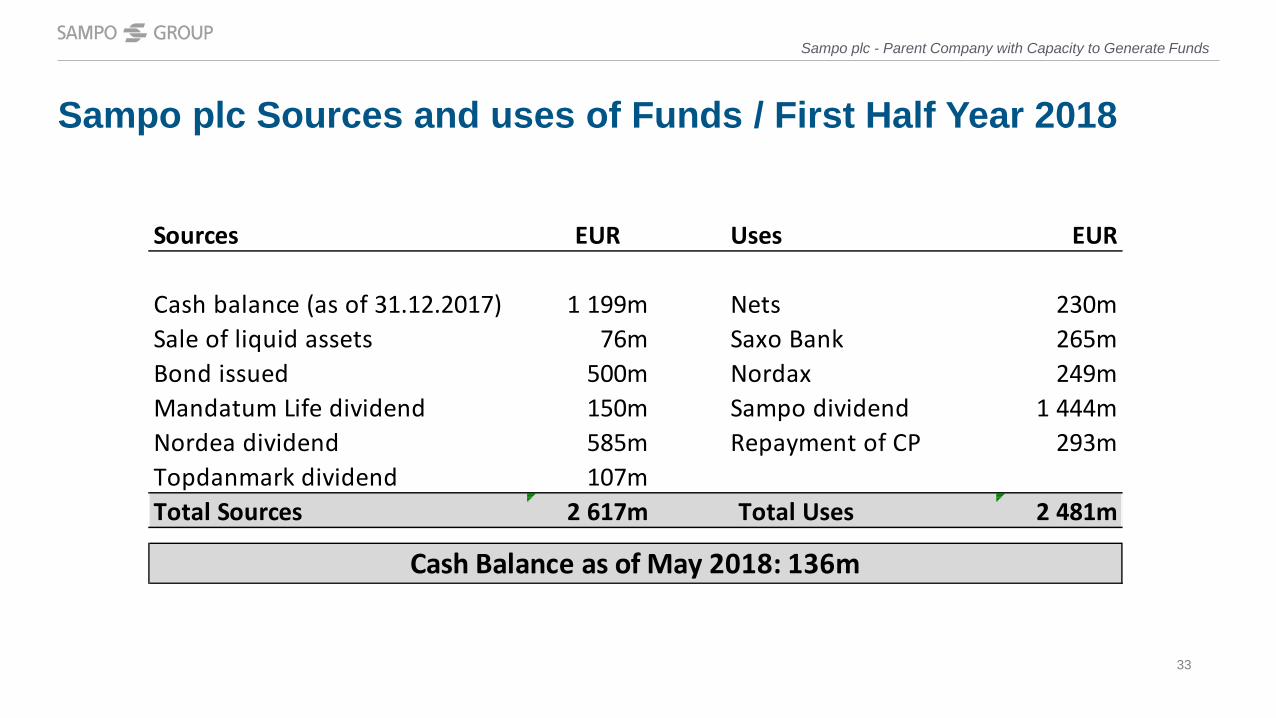
Sampo plc Sources and uses of Funds / First Half Year 2018
Sampo plc - Parent Company with Capacity to Generate Funds
Sources EUR Uses EUR
Cash balance (as of 31.12.2017) 1 199m Nets 230mSale of liquid assets 76m Saxo Bank 265mBond issued 500m Nordax 249mMandatum Life dividend 150m Sampo dividend 1 444mNordea dividend 585m Repayment of CP 293mTopdanmark dividend 107mTotal Sources 2 617m Total Uses 2 481m
Cash Balance as of May 2018: 136m
33
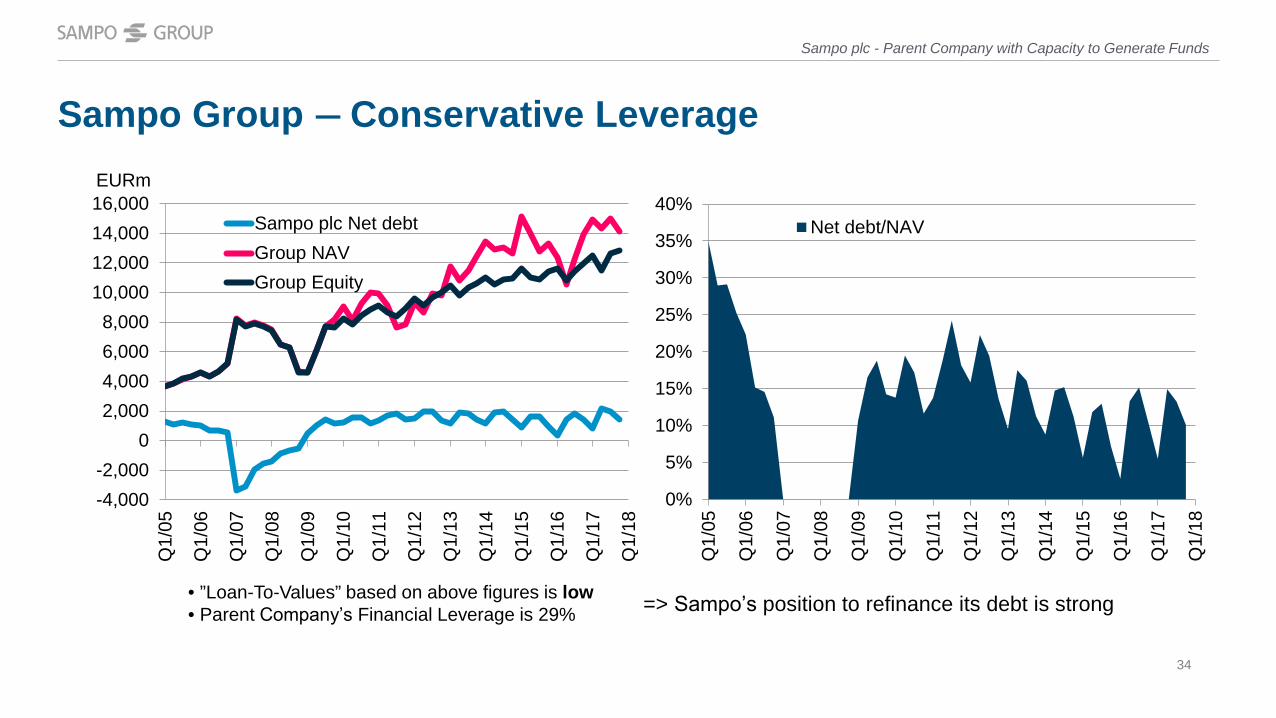
Sampo Group ― Conservative Leverage
-4,000-2,000
02,0004,0006,0008,000
10,00012,00014,00016,000
Q1/
05
Q1/
06
Q1/
07
Q1/
08
Q1/
09
Q1/
10
Q1/
11
Q1/
12
Q1/
13
Q1/
14
Q1/
15
Q1/
16
Q1/
17
Q1/
18
Sampo plc Net debtGroup NAVGroup Equity
EURm
0%
5%
10%
15%
20%
25%
30%
35%
40%
Q1/
05
Q1/
06
Q1/
07
Q1/
08
Q1/
09
Q1/
10
Q1/
11
Q1/
12
Q1/
13
Q1/
14
Q1/
15
Q1/
16
Q1/
17
Q1/
18
Net debt/NAV
• ”Loan-To-Values” based on above figures is low• Parent Companyʼs Financial Leverage is 29% => Sampoʼs position to refinance its debt is strong
Sampo plc - Parent Company with Capacity to Generate Funds
34
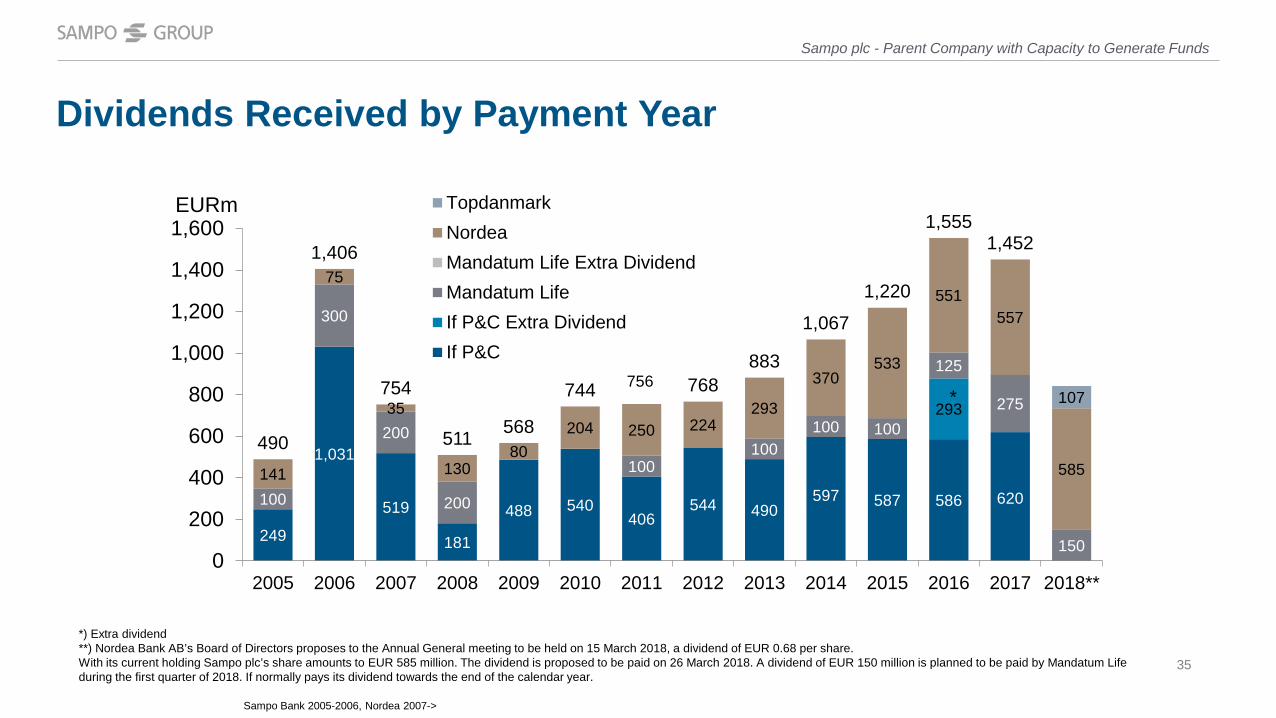
Dividends Received by Payment Year
EURm
249
1,031
519
181
488 540406
544 490597 587 586 620
293
100
300
200
200
100100
100 100
125
275
150
141
75
35
13080
204 250 224293
370533
551557
585
107
490
1,406
754
511 568
744 756 768883
1,067
1,220
1,5551,452
0
200
400
600
800
1,000
1,200
1,400
1,600
2005 2006 2007 2008 2009 2010 2011 2012 2013 2014 2015 2016 2017 2018**
TopdanmarkNordeaMandatum Life Extra DividendMandatum LifeIf P&C Extra DividendIf P&C
Sampo Bank 2005-2006, Nordea 2007->
*
Sampo plc - Parent Company with Capacity to Generate Funds
*) Extra dividend **) Nordea Bank AB’s Board of Directors proposes to the Annual General meeting to be held on 15 March 2018, a dividend of EUR 0.68 per share. With its current holding Sampo plc’s share amounts to EUR 585 million. The dividend is proposed to be paid on 26 March 2018. A dividend of EUR 150 million is planned to be paid by Mandatum Lifeduring the first quarter of 2018. If normally pays its dividend towards the end of the calendar year.
35
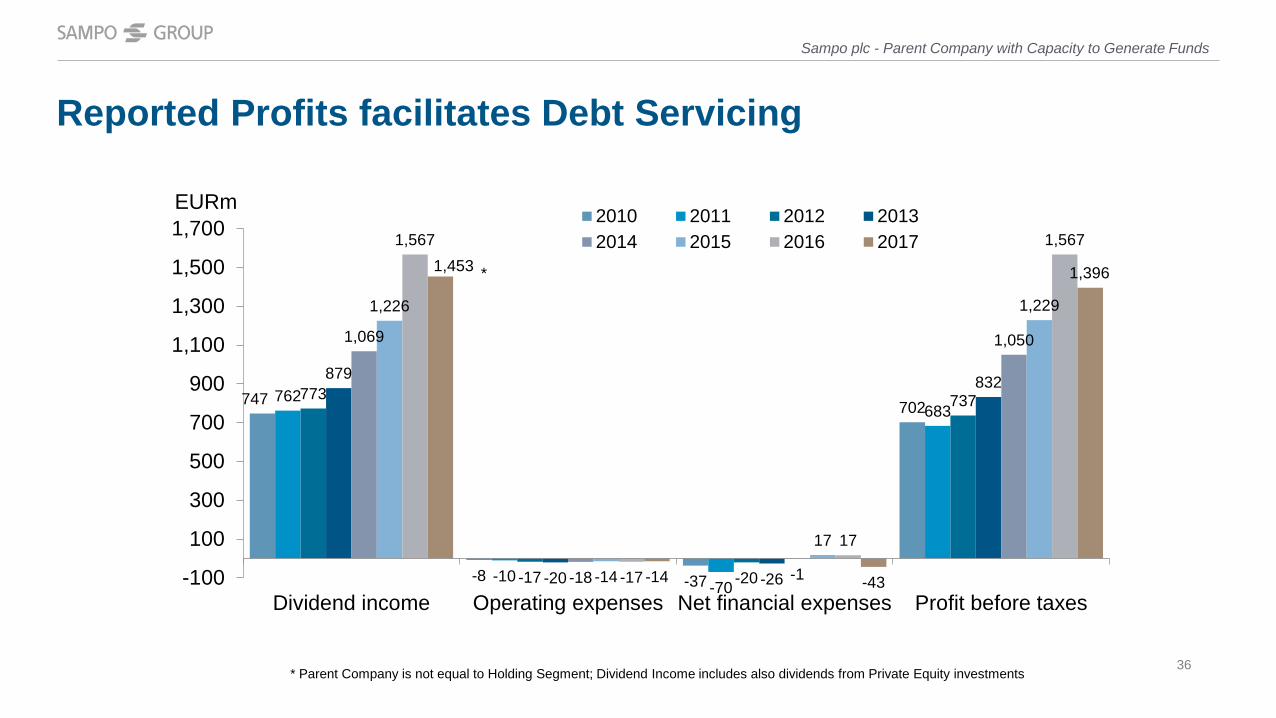
Reported Profits facilitates Debt Servicing
* Parent Company is not equal to Holding Segment; Dividend Income includes also dividends from Private Equity investments
747
-8 -37
702762
-10-70
683773
-17 -20
737
879
-20 -26
832
1,069
-18 -1
1,050
1,226
-14
17
1,229
1,567
-17
17
1,5671,453
-14 -43
1,396
-100
100
300
500
700
900
1,100
1,300
1,500
1,700
Dividend income Operating expenses Net financial expenses Profit before taxes
2010 2011 2012 20132014 2015 2016 2017
*
EURm
Sampo plc - Parent Company with Capacity to Generate Funds
36
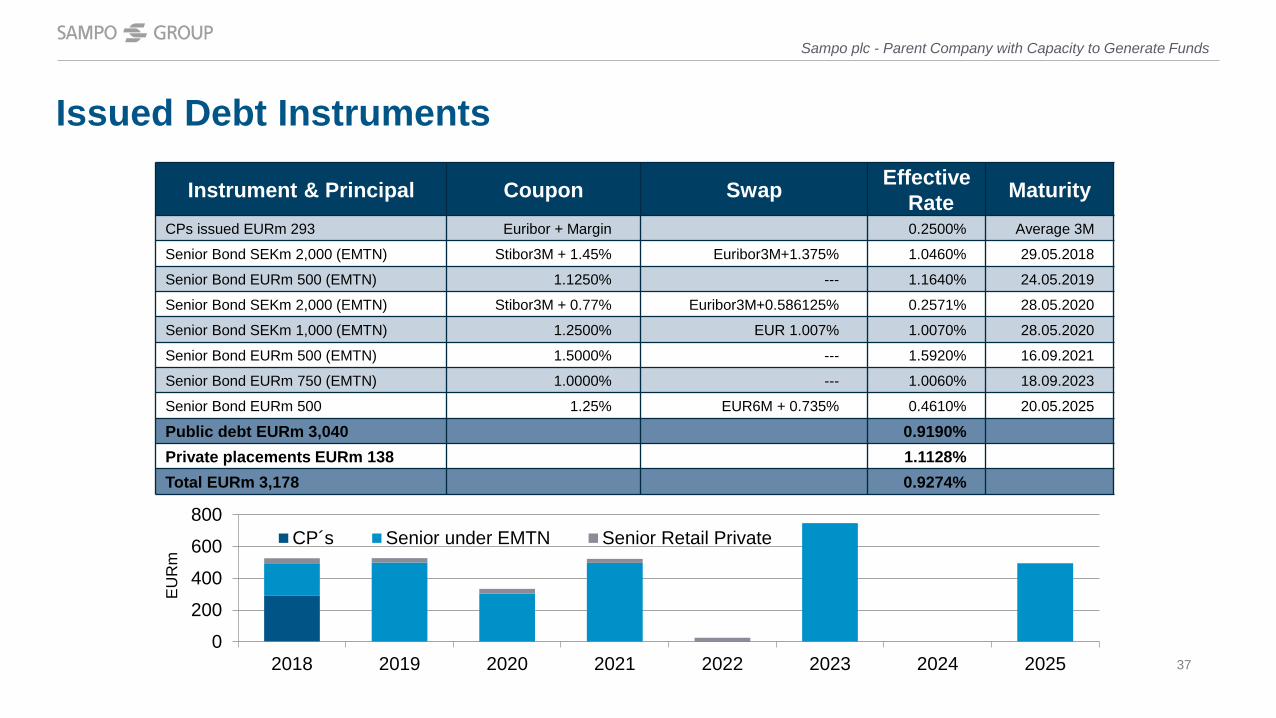
Issued Debt InstrumentsE
UR
mInstrument & Principal Coupon Swap Effective
Rate MaturityCPs issued EURm 293 Euribor + Margin 0.2500% Average 3M
Senior Bond SEKm 2,000 (EMTN) Stibor3M + 1.45% Euribor3M+1.375% 1.0460% 29.05.2018
Senior Bond EURm 500 (EMTN) 1.1250% --- 1.1640% 24.05.2019
Senior Bond SEKm 2,000 (EMTN) Stibor3M + 0.77% Euribor3M+0.586125% 0.2571% 28.05.2020
Senior Bond SEKm 1,000 (EMTN) 1.2500% EUR 1.007% 1.0070% 28.05.2020
Senior Bond EURm 500 (EMTN) 1.5000% --- 1.5920% 16.09.2021
Senior Bond EURm 750 (EMTN) 1.0000% --- 1.0060% 18.09.2023
Senior Bond EURm 500 1.25% EUR6M + 0.735% 0.4610% 20.05.2025
Public debt EURm 3,040 0.9190% Private placements EURm 138 1.1128%Total EURm 3,178 0.9274%
Sampo plc - Parent Company with Capacity to Generate Funds
0
200
400
600
800
2018 2019 2020 2021 2022 2023 2024 2025
CP´s Senior under EMTN Senior Retail Private
37
Sampo Group Nordic Financial Group with Strong Brands 3-18
If P&C Diversified P&C Insurer 19-24Mandatum Life A Finnish Financial Services Company 25-29Sampo plc Parent Company with Capacity to Generate Funds 30-37Appendix Separate Supplementary Information 38-49
38
Sampo Group’s Outlook for the rest of 2018
Appendix – Separate Supplementary Information
Sampo Group’s business areas are expected to report good operating results for 2018.
However, the mark-to-market results are, particularly in life insurance, highly dependent on capital market developments. The continuing low interest rate level also creates a challenging environment for reinvestment in fixed income instruments.
If is expected to reach its long-term combined ratio target of below 95 per cent in 2018 by a margin.
With regard to Topdanmark reference is made to the profit forecast model that the company publishes quarterly.
Nordea’s contribution to the Group’s profit is expected to be significant.
39
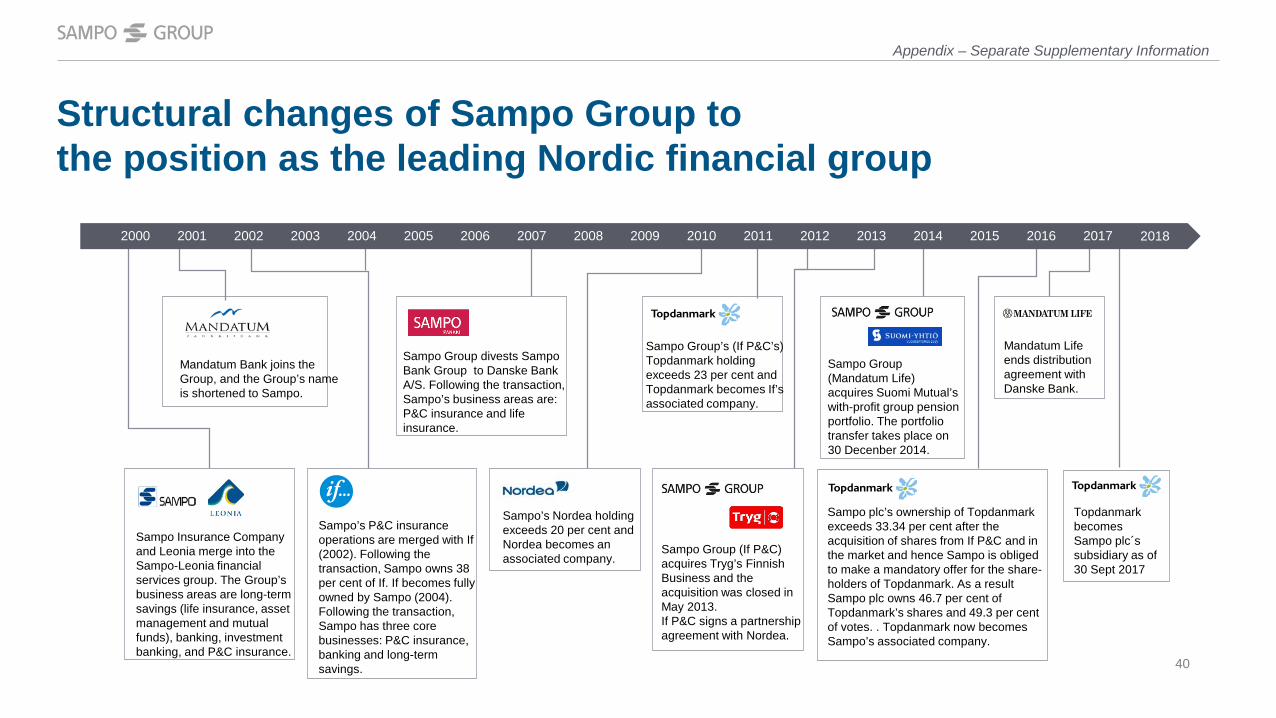
Structural changes of Sampo Group to the position as the leading Nordic financial group
Sampo Group’s (If P&C’s) Topdanmark holding exceeds 23 per cent and Topdanmark becomes If’s associated company.
Sampo Group (Mandatum Life) acquires Suomi Mutual’swith-profit group pension portfolio. The portfolio transfer takes place on 30 Decenber 2014.
Mandatum Life ends distribution agreement with Danske Bank.
Sampo Insurance Company and Leonia merge into the Sampo-Leonia financial services group. The Group’s business areas are long-term savings (life insurance, asset management and mutual funds), banking, investment banking, and P&C insurance.
Sampo’s P&C insurance operations are merged with If (2002). Following the transaction, Sampo owns 38 per cent of If. If becomes fully owned by Sampo (2004). Following the transaction, Sampo has three core businesses: P&C insurance, banking and long-term savings.
Sampo’s Nordea holding exceeds 20 per cent and Nordea becomes an associated company.
Sampo Group (If P&C) acquires Tryg’s Finnish Business and the acquisition was closed in May 2013. If P&C signs a partnership agreement with Nordea.
Sampo plc’s ownership of Topdanmarkexceeds 33.34 per cent after the acquisition of shares from If P&C and in the market and hence Sampo is obliged to make a mandatory offer for the share-holders of Topdanmark. As a result Sampo plc owns 46.7 per cent of Topdanmark’s shares and 49.3 per cent of votes. . Topdanmark now becomesSampo’s associated company.
Sampo Group divests SampoBank Group to Danske Bank A/S. Following the transaction, Sampo’s business areas are: P&C insurance and life insurance.
Mandatum Bank joins the Group, and the Group’s name is shortened to Sampo.
Appendix – Separate Supplementary Information
Topdanmarkbecomes Sampo plc´ssubsidiary as of 30 Sept 2017
20052003200220012000 2008 2011 2012 2013 2014 2016 20172004 20072006 20102009 2015 2018
40
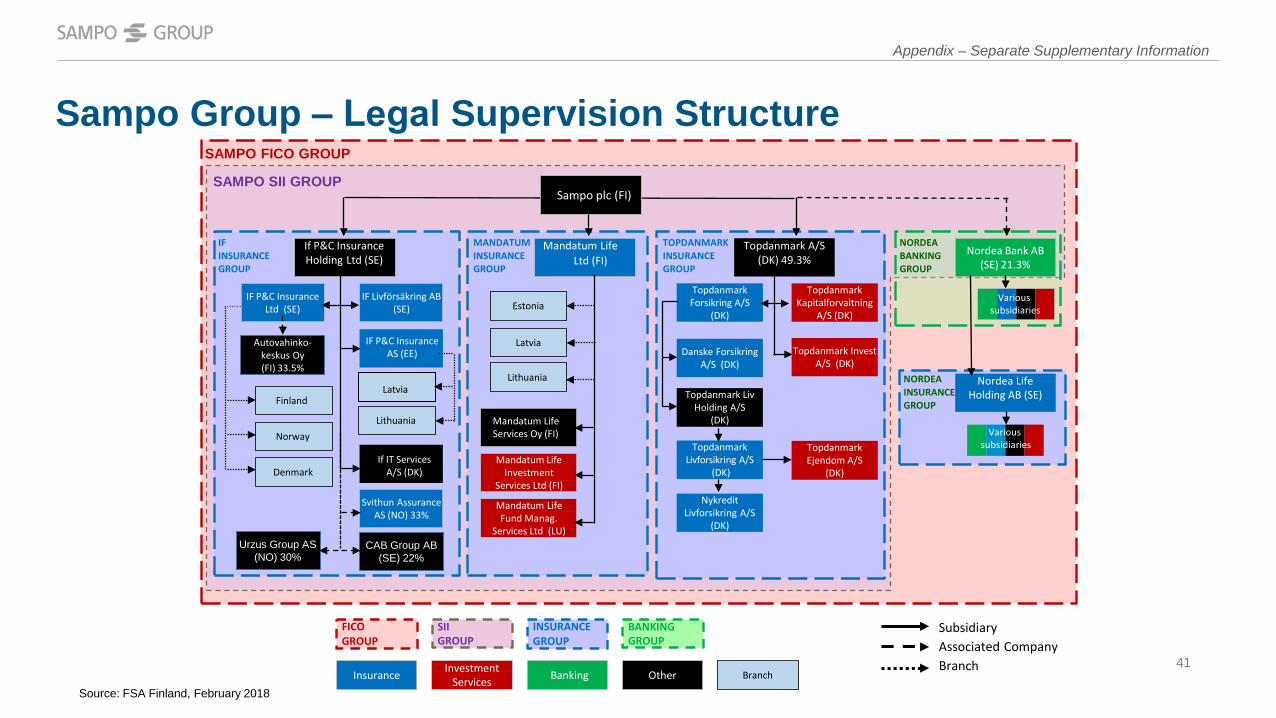
SAMPO FICO GROUP
NORDEABANKINGGROUP
TOPDANMARK INSURANCEGROUP
Nordea Bank AB(SE) 21.3%
SIIGROUP
BANKINGGROUP
FICO GROUP
INSURANCE GROUP
Insurance BankingInvestmentServices Other
Topdanmark A/S(DK) 49.3%
If IT ServicesA/S (DK)
IF P&C InsuranceAS (EE)
IFINSURANCE GROUP
If P&C InsuranceHolding Ltd (SE)
IF P&C InsuranceLtd (SE)
Svithun AssuranceAS (NO) 33%
Autovahinko-keskus Oy(FI) 33.5%
Latvia
Lithuania
Denmark
Norway
MANDATUMINSURANCE GROUP
Mandatum LifeServices Oy (FI)
Mandatum LifeLtd (FI)
Mandatum LifeInvestment
Services Ltd (FI)
Mandatum LifeFund Manag.
Services Ltd (LU)
Latvia
Lithuania
IF Livförsäkring AB (SE)
CAB Group AB (SE) 22%
Urzus Group AS(NO) 30%
Various subsidiaries
SAMPO SII GROUP
Source: FSA Finland, February 2018
Subsidiary Associated CompanyBranch
Finland
EstoniaTopdanmarkForsikring A/S
(DK)
Danske ForsikringA/S (DK)
Topdanmark LivHolding A/S
(DK)
TopdanmarkLivforsikring A/S
(DK)
NykreditLivforsikring A/S
(DK)
TopdanmarkKapitalforvaltning
A/S (DK)
Topdanmark Invest A/S (DK)
TopdanmarkEjendom A/S
(DK)
NORDEAINSURANCE GROUP
Nordea LifeHolding AB (SE)
Various subsidiaries
Branch
Sampo plc (FI)
Sampo Group ‒ Legal Supervision Structure
Appendix – Separate Supplementary Information
41
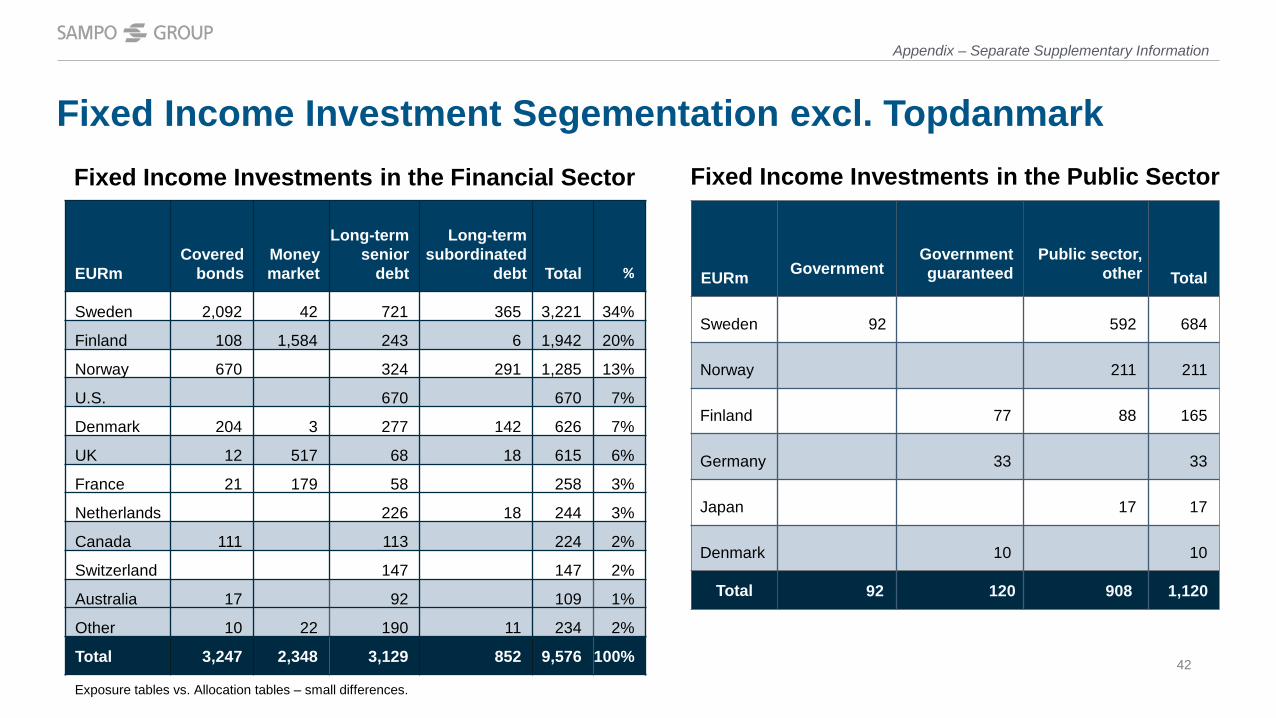
Fixed Income Investments in the Financial Sector
Exposure tables vs. Allocation tables – small differences.
EURmCovered
bondsMoney market
Long-term senior
debt
Long-term subordinated
debt Total %
Sweden 2,092 42 721 365 3,221 34%
Finland 108 1,584 243 6 1,942 20%
Norway 670 324 291 1,285 13%
U.S. 670 670 7%
Denmark 204 3 277 142 626 7%
UK 12 517 68 18 615 6%
France 21 179 58 258 3%
Netherlands 226 18 244 3%
Canada 111 113 224 2%
Switzerland 147 147 2%
Australia 17 92 109 1%
Other 10 22 190 11 234 2%
Total 3,247 2,348 3,129 852 9,576 100%
EURm GovernmentGovernment guaranteed
Public sector,other Total
Sweden 92 592 684
Norway 211 211
Finland 77 88 165
Germany 33 33
Japan 17 17
Denmark 10 10
Total 92 120 908 1,120
Fixed Income Investments in the Public Sector
Appendix – Separate Supplementary Information
Fixed Income Investment Segementation excl. Topdanmark
42
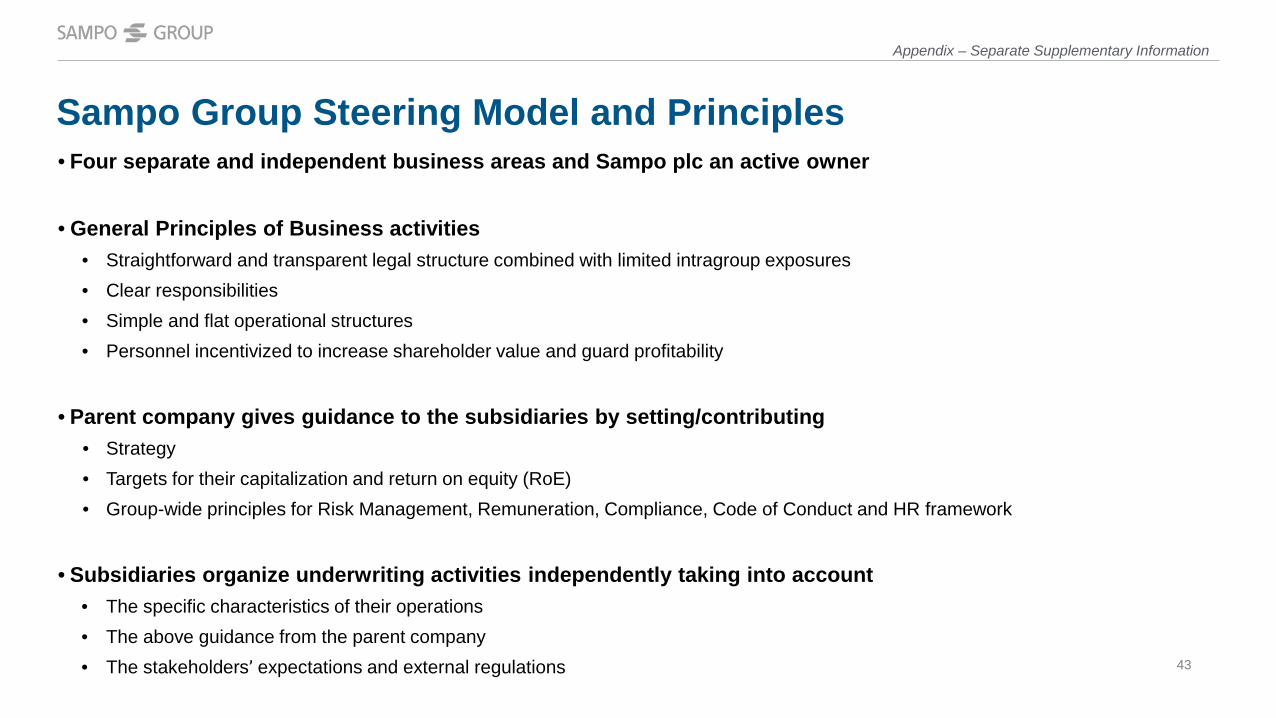
Sampo Group Steering Model and Principles• Four separate and independent business areas and Sampo plc an active owner
• General Principles of Business activities • Straightforward and transparent legal structure combined with limited intragroup exposures • Clear responsibilities• Simple and flat operational structures• Personnel incentivized to increase shareholder value and guard profitability
• Parent company gives guidance to the subsidiaries by setting/contributing • Strategy • Targets for their capitalization and return on equity (RoE) • Group-wide principles for Risk Management, Remuneration, Compliance, Code of Conduct and HR framework
• Subsidiaries organize underwriting activities independently taking into account• The specific characteristics of their operations• The above guidance from the parent company• The stakeholders’ expectations and external regulations
Appendix – Separate Supplementary Information
43
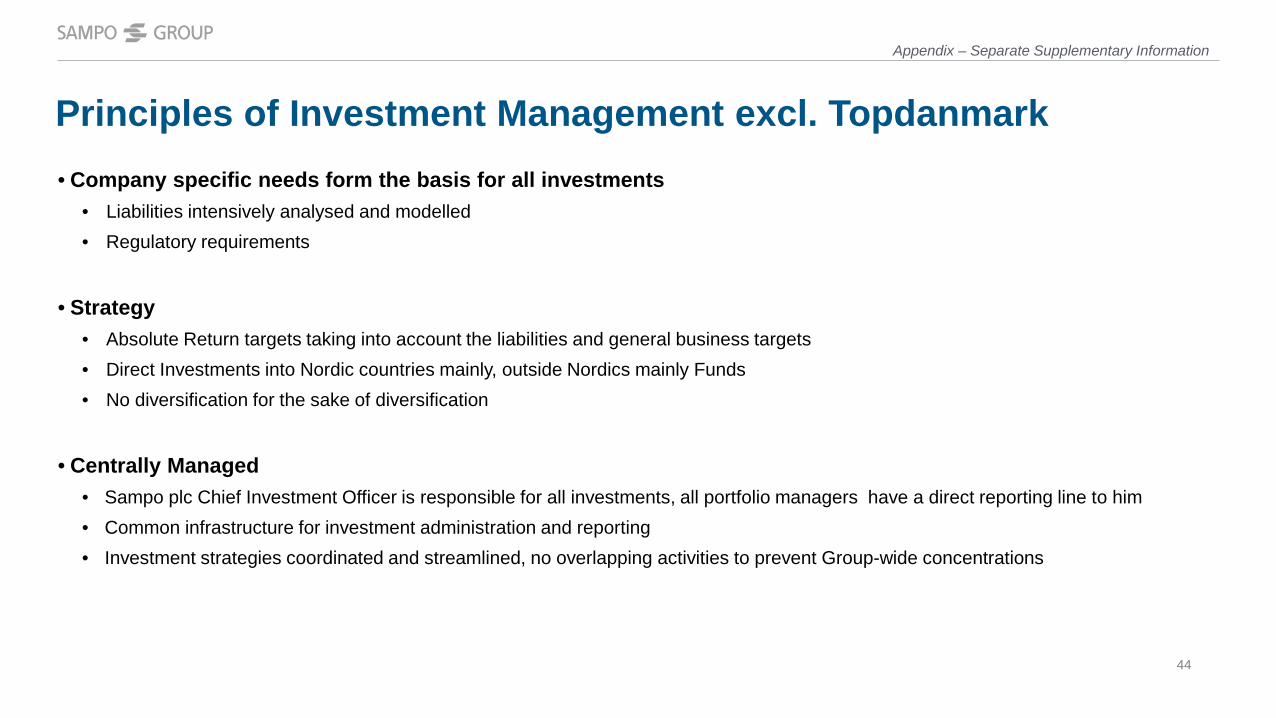
Principles of Investment Management excl. Topdanmark• Company specific needs form the basis for all investments
• Liabilities intensively analysed and modelled• Regulatory requirements
• Strategy• Absolute Return targets taking into account the liabilities and general business targets• Direct Investments into Nordic countries mainly, outside Nordics mainly Funds• No diversification for the sake of diversification
• Centrally Managed • Sampo plc Chief Investment Officer is responsible for all investments, all portfolio managers have a direct reporting line to him• Common infrastructure for investment administration and reporting• Investment strategies coordinated and streamlined, no overlapping activities to prevent Group-wide concentrations
Appendix – Separate Supplementary Information
44
Principles of Capital Management• Subgroups are adequately capitalized to ensure normal business operations
• At Group level the following issues are managed/monitored • Direct risk concentrations
• Correlations of the subgroups' profits
• Sub-groups do not cross-capitalize each others, parent is the source of capital
• The funds generating capacity of the parent company is maintained by having low leverage and adequate liquidity buffers
in normal situations
1 + 2 => Sampo Group is well-capitalized
Appendix – Separate Supplementary Information
45
Calculation Principles of Sampo Group Solvency• Group Solvency Capital
• Under FICOD rules, capital is Group equity with some additional items added or deducted (subordinated loans, deferred tax assets, planned dividends…)
• Under SII rules capital – referred to as Own funds (OF) – consists mainly of excess of assets over liabilities
• Under normal circumstances Group OF by Solvency II and FICOD rules are close to each other
• SCR by Financial Conglomerate Rules• The Group’s SCR is the sum of the separate sub-groups’ requirements (sectoral rules)
• Banking rules are applied for the parent company
• No diversification effect between the companies
• SCR by Solvency II rules • One capital requirement is calculated for the insurance group including the parent company Sampo plc, If P&C, Topdanmark and
Mandatum Life. This includes diversification effects and also capital requirement for the translation risk related to SEK denominated equity of If P&C and DKK nominated equity of Topdanmark.
• Nordea’s capital requirements are added to the requirement
• The SII SCR takes into account diversification only within the insurance group
=> Sampo Group Solvency Ratios are not comparable with most Insurance Groupsʼ solvency ratios
Appendix – Separate Supplementary Information
46
Risk Management Principles*• Scope
• Sampo’s Board of Directors requires that all activities involving the exposure of any Sampo Group company to risks, as well as activities controlling those risks, are arranged to comply with these general guidelines and related instructions as well as with applicable legislation and regulations
• The Board of Directors will supervise the risk taking and risk control activities • The Principles apply to all Sampo Group companies
• The Key Objectives • Balance between risks, capital and earnings• Cost efficiency and high quality processes• Strategic and operational flexibility
• The Central Tasks • Identification of risks• Assessment of required capital• Pricing of risks• Managing risk exposures, capital positions and operative processes• Measuring and reporting risks
Appendix – Separate Supplementary Information
*Topdanmark is in a process to align its business practices with Sampo Group principles
47
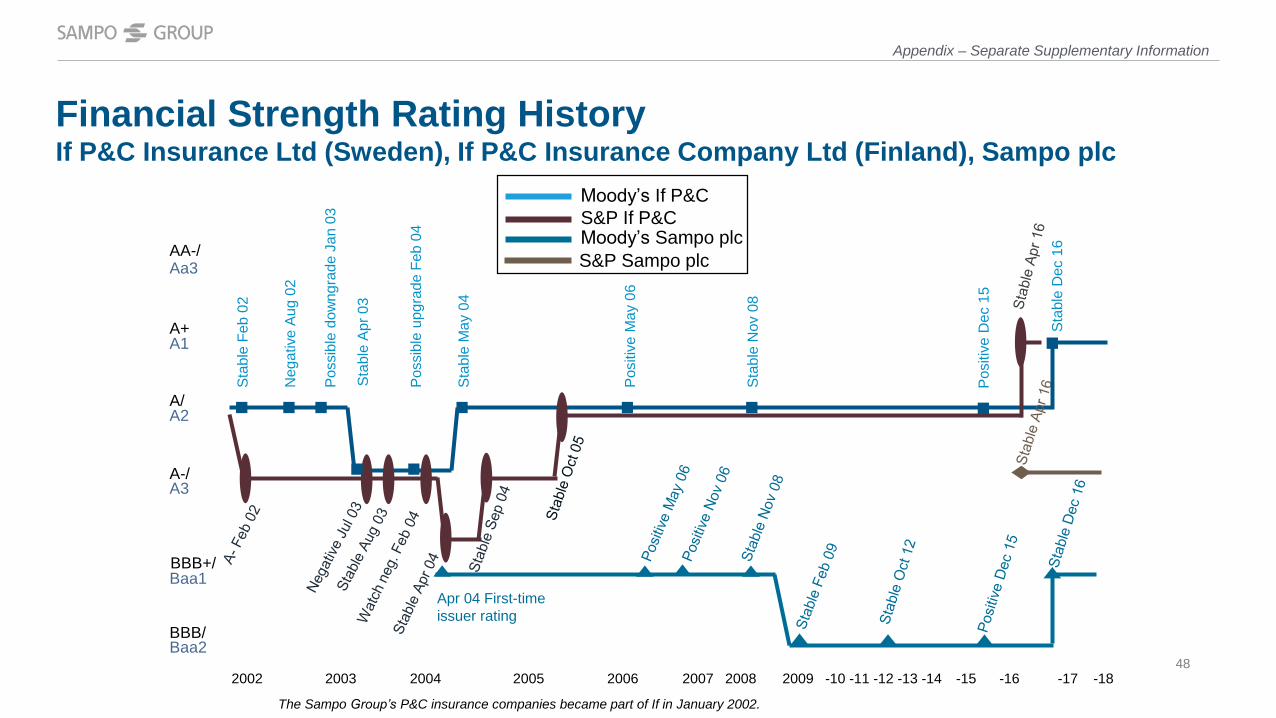
Financial Strength Rating HistoryIf P&C Insurance Ltd (Sweden), If P&C Insurance Company Ltd (Finland), Sampo plc
The Sampo Groupʼs P&C insurance companies became part of If in January 2002.
2002 2003 2004 2005 2006 2007 2008 2009 -10 -11 -12 -13 -14 -15 -16 -17 -18
Poss
ible
dow
ngra
de J
an 0
3
Stab
le F
eb 0
2
Neg
ativ
e Au
g 02
Stab
le A
pr 0
3
Poss
ible
upg
rade
Feb
04
Stab
le M
ay 0
4
Posi
tive
May
06
Stab
le N
ov 0
8
Apr 04 First-time issuer rating
Aa3
A1
A2
A3
Baa1
Baa2
Posi
tive
Dec
15
Moodyʼs If P&CS&P If P&CMoodyʼs Sampo plcS&P Sampo plc
Stab
le D
ec 1
6AA-/
A+
A/
A-/
BBB+/
BBB/
Appendix – Separate Supplementary Information
48
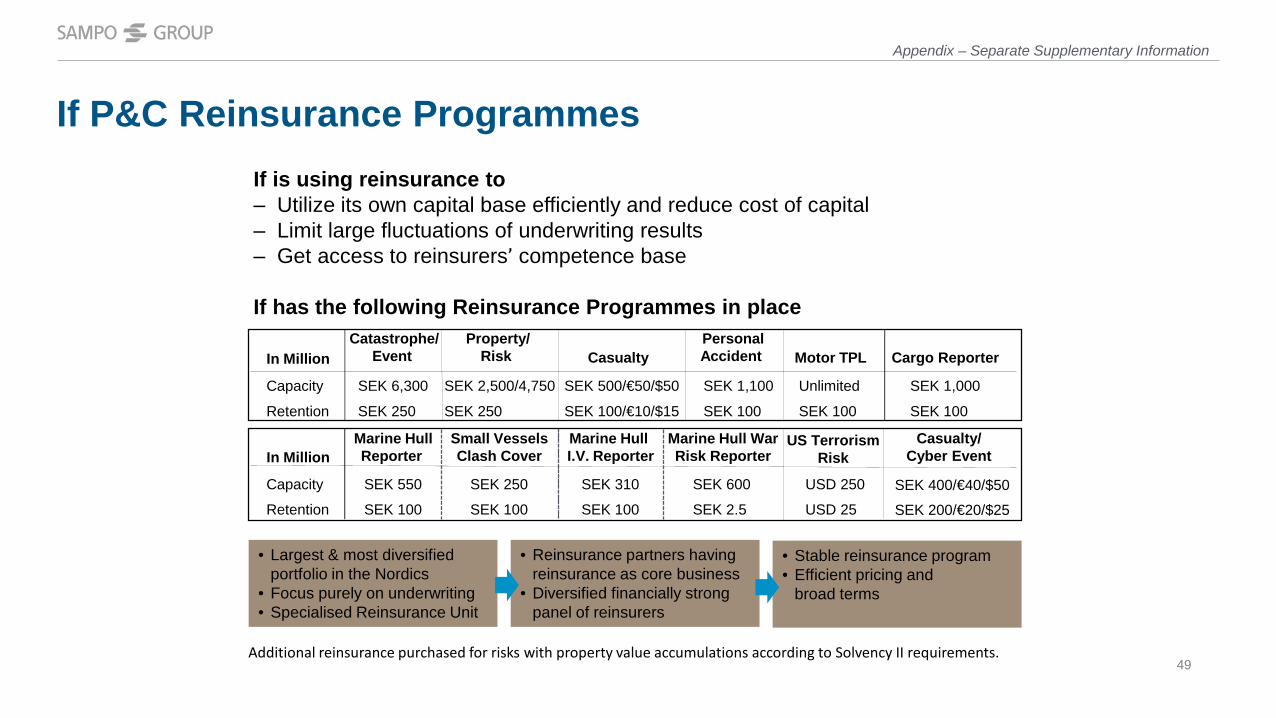
If P&C Reinsurance ProgrammesIf is using reinsurance to‒ Utilize its own capital base efficiently and reduce cost of capital‒ Limit large fluctuations of underwriting results‒ Get access to reinsurers’ competence base
If has the following Reinsurance Programmes in place
• Largest & most diversifiedportfolio in the Nordics
• Focus purely on underwriting• Specialised Reinsurance Unit
• Reinsurance partners having reinsurance as core business
• Diversified financially strong panel of reinsurers
• Stable reinsurance program • Efficient pricing and
broad terms
Additional reinsurance purchased for risks with property value accumulations according to Solvency II requirements.
In MillionCatastrophe/
EventProperty/
Risk CasualtyPersonalAccident Motor TPL Cargo Reporter
Capacity SEK 6,300 SEK 2,500/4,750 SEK 500/€50/$50 SEK 1,100 Unlimited SEK 1,000
Retention SEK 250 SEK 250 SEK 100/€10/$15 SEK 100 SEK 100 SEK 100
In MillionMarine HullReporter
Small VesselsClash Cover
Marine Hull I.V. Reporter
Marine Hull WarRisk Reporter
US TerrorismRisk
Capacity SEK 550 SEK 250 SEK 310 SEK 600 USD 250
Retention SEK 100 SEK 100 SEK 100 SEK 2.5 USD 25
Casualty/Cyber Event
SEK 400/€40/$50
SEK 200/€20/$25
Appendix – Separate Supplementary Information
49