Embed Size (px)
Citation preview
Lehrstuhl für Botanik
der Technischen Universität München
Gene Induction by Nitric Oxide (NO) in Arabidopsis thaliana
Xi Huang
Vollständiger Abdruck der von
der Fakultät Wissenschaftszentrum Weihenstephan
für Ernährung, Landnutzung und Umwelt der Technischen Universität München
zur Erlangung des akademischen Grades eines Doktors der Naturwissenschaften
(Dr. rer. nat.) genehmigten Dissertation.
Vorsitzender: Univ.-Prof. Dr. E. F. Elstner
Prüfer der Dissertation:
1. Univ.-Prof. Dr. E. Grill
2. Priv.-Doz. Dr. J. Durner
Die Dissertation wurde am 25. 09. 2003 bei der Technischen Universität München
eingereicht und durch die Fakultät Wissenschaftszentrum Weihenstephan
für Ernährung, Landnutzung und Umwelt am 13. 11. 2003 angenommen.

Finished in
Institute of Biochemical Plant Pathology
GSF - National Research Center for Environment and Health
Under Supervision by PD Dr. Jörg Durner
Index
I
Index
I. Introduction........................................................................................................................... 1
1. Chemical basis for NO-mediated signaling effects................................................................ 2
1.1. Peroxynitrite formation ............................................................................................... 2
1.2. Formation of S-nitrosylation ....................................................................................... 3
1.3. Reaction with transition metals ................................................................................... 3
2. NO signaling in mammalian systems..................................................................................... 4
2.1. Nitric oxide biosynthesis in mammals ........................................................................ 4
2.2. Regulation of gene expression by nitric oxide ............................................................ 5
2.2.1. NO and DNA-methylation ................................................................................... 6
2.2.2. NO and transcription factors ................................................................................ 6
2.2.3. NO effects mRNA stability and translation ......................................................... 7
2.2.4. Regulation of posttranslational events by NO...................................................... 7
2.3. NO signaling and animal immune response................................................................ 8
3. NO signaling in plants.......................................................................................................... 10
3.1. Biosynthesis of nitric oxide in plants ........................................................................ 10
3.2. NO signaling in plant defense responses................................................................... 12
3.2.1. Mechanisms of plant defense responses............................................................. 12
3.2.2. The role of NO in plant defense responses ........................................................ 14
4. Goal of the work and the research strategy .......................................................................... 17
4.1. Simulation of NO burst in Arabidopsis plants and suspension cells......................... 17
4.2. Use of cDNA microarrays to study different gene expression.................................. 18
4.3. Verify and explain the gene induction ...................................................................... 18
II. Materials and Methods ..................................................................................................... 20
1. Materials............................................................................................................................... 20
1.1. Plant materials ........................................................................................................... 20
1.2. Chemicals .................................................................................................................. 20
1.3. Molecular biological Kits.......................................................................................... 22
1.4. Buffers and solutions................................................................................................. 22
Index
II
1.5. Mediums.................................................................................................................... 25
1.6. Apparatus .................................................................................................................. 26
1.7. Consumed materials .................................................................................................. 27
2. Methods................................................................................................................................ 28
2.1. Growth condition of Arabidopsis plants and treatment with NO.............................. 28
2.2. Cell culture and NO treatment .................................................................................. 28
2.3. Microarray................................................................................................................. 28
2.3.1 PCR amplification and purification of target DNA ............................................ 29
2.3.1.1 Amplification of the target DNA ................................................................. 29
2.3.1.2. Purification of target DNA.......................................................................... 30
2.3.2 Array printing...................................................................................................... 31
2.3.3. Post-washing and blocking................................................................................. 32
2.3.4 Probe labeling...................................................................................................... 32
2.3.4.1 RNA extraction ............................................................................................ 32
2.3.4.2. cDNA synthesis........................................................................................... 34
2.3.4.3. Reaction Purification I: Removal of unincorporated aminoallyl-dUTP (aa-
dUTP) and freeamines.............................................................................................. 34
2.3.4.4. Coupling aminoallyl-labeled cDNA to Cyanine dye ester......................... 35
2.3.4.5. Reaction purification II: removal of uncoupled dye ................................... 36
2.3.5. Pre-hybridization................................................................................................ 36
2.3.6. Hybridization...................................................................................................... 37
2.3.7. Post-washing and scanning ................................................................................ 37
2.3.8. Data collection and analysis............................................................................... 37
2.4. Northern blotting ....................................................................................................... 38
2.4.1 Agarose/formaldehyde gelelectrophoresis .......................................................... 39
2.4.2 Transfer of RNA from gel to membrane............................................................. 39
2.4.3. Preparation of DIG-labeling DNA probe ........................................................... 40
2.4.4. Hybridization...................................................................................................... 41
2.4.5. Washing, blocking and detection ....................................................................... 41
2.4.6. Designing specific primers for AOX genes and 12-oxo-phytodienoic acid
reductase (OPR3) ......................................................................................................... 42
2.5. Cellular respiration.................................................................................................... 42
2.6. Cell death assay......................................................................................................... 43
2.7. Determination of SA, ethylene and JA...................................................................... 43
Index
III
2.8. NO detected by fluorescent microscopes .................................................................. 43
2.9. NO detection by electron paramagnetic resonance (EPR) ........................................ 44
III. Results............................................................................................................................... 45
1. Preparation of the cDNA used for spotting.......................................................................... 45
2. Microarray analysis of transcripts of suspension cells after NO treatment.......................... 47
2.1 Data analysis and normalization ................................................................................ 48
2.2. Dynamics of gaseous NO-inducible gene expression ............................................... 49
3. Identification of the alternative oxidase (AOX) as NO counteracting principle.................. 52
3.1. Northern blot verify the AOX induction by NO ....................................................... 52
3.2. Identification of other AOX homolog in Arabidopsis .............................................. 54
3.3. Identification of the transcript of AOX1a in mutants ............................................... 56
3.4. Determination of the respiration after NO treatment ................................................ 57
3.5. Identify the role of AOX in protection the cell from NO-induced cell death ........... 58
4. Microarray transcripts analysis of Arabidopsis plants after gaseous NO treatment ............ 61
4.1. Dynamics of gaseous NO-inducible gene expression ............................................... 61
4.2. Microarray analysis of NO-induced gene expression in wt, jar1 and NahG plants .. 63
4.3. Classification of NO-induced gene based on their functions.................................... 66
5. Identification of the role of NO in jasmonic acid signaling pathway .................................. 69
5.1. Verify the transcript accumulation of AOS and LOX2 by northern blot.................. 69
5.2. cPTIO didn’t inhibit the AOS induction by wounding ............................................. 72
5.3. Induction of 12-oxo-phytodienoic acid reductase (OPR3) by NO............................ 72
5.4. Analysis of defense genes downstream of JA........................................................... 74
5.5. Determination of ethylene, SA and JA concentration after NO treatment................ 75
5.6. DAF fluorescence detect the NO burst after wounding and JA treatment................ 76
5.7. Electron paramagnetic resonance (EPR) detect the NO burst after wounding ......... 78
5.8. NO primes for JA accumulation after wounding in Arabidopsis leaves................... 80
IV. Discussion ......................................................................................................................... 82
1. DNA microarray................................................................................................................... 82
1.1. Comparision of fluorescent and filter-based microarray........................................... 82
1.2. The nonlinearity in cDNA microarray expression measurements ............................ 83
1.3. Data analysis and normalization ............................................................................... 83
Index
IV
1.4. Confidence of the fluorescent labeling cDNA microarray........................................ 84
2. Microarray analyses of gene regulation by NO ................................................................... 84
2.1. Gene induction after NOR3 treatment in suspension cells ....................................... 85
2.2. Gene induction by gaseous NO treatment in plants .................................................. 86
2.3. Comparison of NO-dependent gene induction in suspension cells and in plants ..... 88
3. Identification the role of alternative oxidase (AOX1a) as NO counteracting principle....... 90
3.1. Detrimental effect of NO........................................................................................... 90
3.2. The role of AOX in plant physiology........................................................................ 91
3.3. Induction of AOX by NO treatment.......................................................................... 92
3.4. The biological context of NO- induction of AOX .................................................... 93
4. Identification the role of NO in JA signaling pathway ........................................................ 96
4.1. Plants defense signaling pathways ............................................................................ 96
4.2. Interaction of plants defense signaling pathways...................................................... 96
4.3. The role of NO in JA signaling pathway................................................................... 97
4.3.1. Wounding induces NO burst in plants ............................................................... 97
4.3.2. NO induced JA signaling related genes ............................................................. 98
4.3.3. SA plays a role in inhibition of JA synthesis ..................................................... 99
4.3.4. Cross-talk among NO, JA-, and SA- signaling ................................................ 100
V. Conclusion........................................................................................................................ 103
VI. References....................................................................................................................... 105
VII. Supplement ................................................................................................................... 120
Tabele S1. The gene that used for microarray ....................................................................... 120
Table S2. DNA microarray analysis of transcripts in Arabidopsis suspension cell after NO
treatment................................................................................................................................. 129
Table S3. DNA microarray analysis of transcripts in Arabidopsis plants after gaseous NO
treatment................................................................................................................................. 135
Abbreviations
aa Aminoallyl
AOS Allene oxide synthase
AOX Alternative oxidase
avr Avirulence gene
BH4 Tetrahydrobiopterin
BIOP Institute of Biochemical Plant Pathology
bp Base pairs
BSA Bovine serum albumin
°C Degree Celsius
CaM Calmodulin
cDNA Complementary DNA
COX Cytochrome c oxidase
cPTIO Carboxy-2-phenyl-4,4,5,5-tetramethylimidazolinone-3-oxide-1-oxyl
Cy Cyanine dye
d distilled
DAF-2 DA 4, 5-Diaminofluorescein diacetate solution
DEPC Diethyl cyanophosphonate
DETC Sodium diethyldithiocarbamate hydrate
DMSO Dimethylsulfoxid
DNA Deoxyribonucleic acid
dNTP Deoxynucleotid-5’-triphosphate
EDRF Endothelium derived relaxing factor
EDTA Ethylendiaminetetraacetic acid
e. g. For example
EPR Electron paramagnetic resonance
EST Expressed sequence tag
et al. and others
etr1 Ethylene resistant mutant
GDC Glycine decarboxylase complex
GST Glutathione S-transferase
h Hour
HR Hypersensitive response
IRP Iron regulatory protein
JA Jasmonic acid
jar1 Jasmonate resistant mutant
jin1 Jasmonate insensitive mutant
JIP Jasmonate inducible protein
kD Thousand dalton
l Liter
LAP Latency-associated peptide
LOX Lipoxygenase
M Molar
mg Milligram
MJ Methyl jasmonate
ml Milliliter
mM Millimolar
MOPS 4-Morpholinepropanesulfonic acid; 3-Morpholinopropanesulfonic acid
mRNA Messenger RNA
µ Micron
µl Microliter
µM Micromolar
NahG Transgenic plants containing bacterial salicylate hydroxylase gene
NaR Nitrate reductase
NASC Nottingham Aiabidopsis Stock Centre
NF- B Nuclear factor kappa B
nM Nanomolar
NO Nitric oxide
NOS Nitric oxide synthase
NOR3 (+/-)-(E)-4-ethyl-2-[(E)-hydroxyimino]-5-nitro-3-hexenamide
NPR1 Nonexpresser of PR genes
opr 12-oxo-phytodienoic acid reductase
PAD4 Phytoalexin deficient mutant
PAL Phenylalanine ammonia lyase
PBS Phosphate-buffered saline
PCD Programmed cell death
PCR Polymerase chain reaction
PD Privatdozent
PDF1.2 Defensin 1.2
pH Negative decadic logarithm of the molar concentration of hydrogen ions
ppm parts per mille
PR Pathogen-related protein
PVP Polyvinylpyrrelidon
RNA Ribonucleic acid
ROS Reactive oxygen species
rpm Rotations per minute
SA Salicylic acid
sai1 Salicylic acid insensitive mutant
SAR Systemic acquired resistance
SD Standard deviation
SDS Sodium dodecyl sulfate
sGC Soluble isoform of guanylyl cyclase
SHAM salicylhydroxamic acid
SNP Sodium nitroprusside
ssDNA Salmon sperm DNA
TAE Tris-acetate-EDTA
TBE Tris-boric acid-EDTA
TE Tris-EDTA
TGF Transforming growth factor
TM Trademark
UV Ultra violet
VSP Vegetative storage protein
v/v Volume per volume
wt Wild type
w/v Weight per volume
www World wild web
Introduction
1
I. Introduction
During the past two decades, one of the most vigorously researched and intriguing entities of
biological chemistry is nitric oxide (NO, often also abbreviated as .NO to indicate that it is a
free radical with a unpaired electron), a unique type of biological messenger in animal cells.
Previously NO’s notoriety stemmed primarily from the recognition of its presence in the
environmentally polluting NOx complex (NO2 and NO), the component of which, via the
Chapman pathway converts stratospheric and tropospheric O3 to O2 (Howard, 1980;
Sandermann, 2001). In 1987, vascular ‘endothelium derived relaxing Factor’ (EDRF) was
identified as NO by team headed by Salvador Moncada in UK (Palmer et al., 1987). This
finding is regarded as the groundbreaking one serving as a cornerstone for subsequent
research on NO. From then on, NO has attracted a great deal of attention. Nitric oxide became
the sources of intensive and exciting research in animal. In 1992, NO was recognized by
Science magazine as the ‘Molecule of the year’. Further investigations led to the finding that
NO is a multifunctional effectors in numerous mammalian physiological processes, including
the relaxation of smooth muscle, inhibition of platelet aggregation, neural communication and
immune regulation (Schmidt and Walter, 1994). Many insights into the understanding of NO
functions came from the identification of nitric oxide synthase (NOS), the enzyme responsible
for NO production (Nathan and Xie, 1994). Moreover, studies of NO chemistry have
contributed to an understanding of NO signaling mechanisms that are achieved through its
interaction with targets via a rich redox and additive chemistry (Stamler, 1994; Stamler et al.,
1992). In 1998, three NO research pioneers (Robert F. Furchgott, Louis J. Ignarro and Ferid
Murad) won the Nobel Prize for "Physiology or Medicine" for their discoveries concerning
"the nitric oxide as a signaling molecule in the cardiovascular system".
The use of NO is not confined to the animal kingdom. The ability of plants to accumulate and
metabolize atmospheric NO has been known for some time (Nishimura et al., 1986).
Moreover, measurement of gaseous emissions from plants have shown that NO can be
synthesized in plants, through both non-enzymatic and enzymatic reactions (Leshem and
Haramaty, 1996; Yamasaki, 2000). Interestingly, studies conducted in the past several years
show that NO is at the heart of several physiological functions ranging from plant
development to defense responses (Beligni and Lamattina, 2000; Durner and Klessig, 1999).
Remarkably, these analyses suggest that many aspects of NO signaling are shared by plants
Introduction
2
and animals. Interestingly, a pathogen-inducible nitric oxide synthase (iNOS) in plant was
identified and cloned very recently (Chandok et al., 2003). Despite the lack of sequence
homology, the biochemical properties of this plant enzyme, including cofactor requirements
and inhibitor sensitivity, as well as its kinetic properties, appear to be very similar to those of
its animal counterparts. Moreover, plant iNOS, like that of animals, is specifically induced
during the resistance response to pathogen infection.
NO, first identified as EDRF, is now recognized as one of the most versatile mediators in
bacteria, protozoa, animal and plant. The following sections will endeavor to highlight the
current progress in NO research and clarify the goal of this work.
1. Chemical basis for NO-mediated signaling effects
NO has been known as a ubiquitous inter- and intracellular messenger. NO controls a variety
of complex biological processes, including blood pressure homeostasis, platelet aggregation,
and transmission of signals by the nervous system. NO is also important for immune system
function, playing key roles in the activation of macrophages and cellular defenses against
microbial pathogens (Aslan and Freeman, 2002). How can NO function as a signaling
molecule? NO chemistry implicates an interplay between the three redox-related species:
nitric oxide radical (NO), nitrosonium cation (NO+) and nitroxyl anion (NO-). In biological
systems, NO reacts rapidly with molecular oxygen (O2), superoxide anion (O2-) and transition
metals. The reaction of NO with O2 results in the generation of NOx compounds (including
NO2., N2O3 and N2O4), which can either react with cellular amines and thiols, or simply
hydrolyze to form the end metabolites nitrite (NO2-) and nitrate (NO3
-) (Wendehenne et al.,
2001). NO can entertain several complex chemical reactions, some of which have been shown
to be associated with certain biological effects of NO.
1.1. Peroxynitrite formation
The reaction of NO with O2- yields peroxynitrite (ONOO-). Peroxynitrite is a strong oxidant
that mediates cellular injury. At physiological pH, ONOO- equilibrates rapidly with pernitrous
acid (ONOOH), which, depending on its conformation, rapidly decomposes to NO3- or to the
highly reactive hydroxyl radical HO (Wendehenne et al., 2001). ONOO- can also oxidize thiol
residues to sulfenic and sulfonic acids and nitrate peptides and proteins at the phenyl side
chain of tyrosine residues. Tyrosine nitration is a widely used marker of peroxynitrite
Introduction
3
produced from the reaction of nitric oxide with superoxide (Reiter et al., 2000). However, the
molecular targets of peroxynitrite and the functional consequences of peroxynitrite-mediated
tyrosine nitration in vivo (including possible effects on cellular signaling cascades) have only
begun to be defined.
1.2. Formation of S-nitrosylation
NO is extremely susceptible to both oxidation and reduction. One electron oxidation of NO
leads to NO+. This oxidation can be supported by Fe(III)-containing metalloproteins. NO+
mediates electrophilic attack on reactive sulfur, oxygen, nitrogen and aromatic carbon centers,
with thiols being the most reactive groups. This chemical process is referred to as
nitrosylation. Nitrosylation of sulfhydryl (S-nitrosylation) centers of many enzymes or
proteins have been described and the resulting chemical modification affects activity in many
cases. Considering that, within complex proteins such as enzymes and transcription factors,
cysteine residues and the formation or disruption of disulfide bridges are frequently crucial for
tertiary structure and function, it is evident that S-nitrosylation is a valid mechanism for the
signaling effects of NO (Bogdan, 2001b; Stamler and Hausladen, 1998; Wendehenne et al.,
2001).
1.3. Reaction with transition metals
NO is capable of donating electrons and therefore reacts with transition metals such as iron,
copper and zinc, which leads to the formation of metal-nitrosyl complexes. Transition metals
are not only components of prosthetic groups of enzymes and other proteins (e.g. iron of the
heme moiety of soluble isoform of guanylyl cyclase [sGC], hemoglobin or myoglobin) but
also coordinate sulfide clusters in enzymes (e.g. [Fe-S] proteins of the respiratory chain),
transcription factors (e.g. zinc-finger proteins) and mRNA-binding proteins (e.g. iron-
regulatory protein 1) (Durner et al., 1999; Gow et al., 1999; Shinyashiki et al., 2000; Zhao et
al., 1999). Again, NO was found to either activate or inhibit the function of the respective
proteins (e.g. in the case of the zinc-finger domains).
Introduction
4
2. NO signaling in mammalian systems
Progress of NO research in mammalian system is earlier and more prosperous than in plant
system. Of course research in medicine occupies more resources than in plant research. The
advance of NO research in animal has directly inspired and promoted the research in plants.
For example, using animal NOS, NOS inhibitors to study plant NO signaling has reached
exiting success (Delledonne et al., 1998; Durner et al., 1998). So it is very necessary to
overview the present state of the NO research in animal, before I try to draw up the work
scheme about the NO signaling in plants.
2.1. Nitric oxide biosynthesis in mammals
To fully understand the regulation of NO, the first urgent task is to reveal the origin of NO.
In animals, NO is generated by nitric oxide synthases (NOS), a group of evolutionarily
conserved cytosolic or membranebound isoenzymes that convert the amino acid L-arginine
to citrulline and NO (Nappi et al., 2000; Stuehr, 1999). Three NOS isoforms have been
identified (Nathan and Xie, 1994), named on the basis of the tissue source from which they
were originally extracted: neuronal NOS (nNOS or NOS1), inducible NOS in macrophages
(iNOS or NOS2), and endothelial NOS (eNOS or NOS3). Recently, a new isoform of NOS
was found in mitochondria isolated from rat liver (Tatoyan and Giulivi, 1998). This isoform,
named mtNOS, is similar to iNOS. All NOS isoforms are homodimeric enzymes that require
the same cosubstrates (molecular oxygen, NADPH) and cofactors (FMN, FAD,
tetrahydrobiopterin, heme, Ca2+/calmodulin, and, possibly, also Zn2+ ions) and show ~50-
60% identity in their amino acid sequences (Stuehr, 1999).
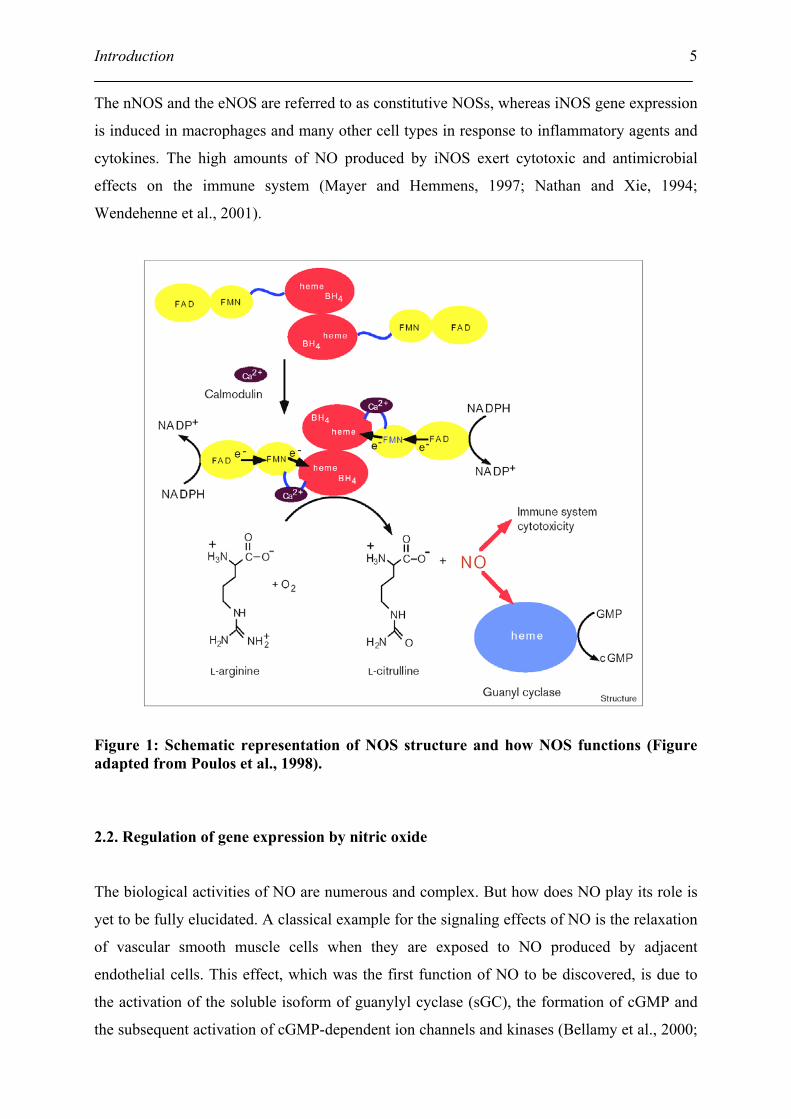
The structure and function of NOS is schematic represented in Figure 1. Each NOS is a bi-
domain enzyme consisting of an N-terminal oxygenase and a C-terminal reductase (Mayer
and Hemmens, 1997). The oxygenase domain contains a cytochrome P-450 type heme center
and a binding site for the cofactor tetrahydrobiopterin (BH4). The reductase domain contains
NADPH, FAD and FMN binding sites and exhibits significant homology with NADPH
cytochrome P-450 reductase. Both domains are connected by a calmodulin (CaM) binding
site in the middle of the enzyme. In addition, each NOS has a different N-terminal extension
determining the intracellular localization of the enzyme (Mayer and Hemmens, 1997).
Introduction
5
The nNOS and the eNOS are referred to as constitutive NOSs, whereas iNOS gene expression
is induced in macrophages and many other cell types in response to inflammatory agents and
cytokines. The high amounts of NO produced by iNOS exert cytotoxic and antimicrobial
effects on the immune system (Mayer and Hemmens, 1997; Nathan and Xie, 1994;
Wendehenne et al., 2001).
Figure 1: Schematic representation of NOS structure and how NOS functions (Figure adapted from Poulos et al., 1998).
2.2. Regulation of gene expression by nitric oxide
The biological activities of NO are numerous and complex. But how does NO play its role is
yet to be fully elucidated. A classical example for the signaling effects of NO is the relaxation
of vascular smooth muscle cells when they are exposed to NO produced by adjacent
endothelial cells. This effect, which was the first function of NO to be discovered, is due to
the activation of the soluble isoform of guanylyl cyclase (sGC), the formation of cGMP and
the subsequent activation of cGMP-dependent ion channels and kinases (Bellamy et al., 2000;
Introduction
6
Zhao et al., 1999). However, sGC is not the only ‘receptor’ for NO. During the past years,
multiple other target molecules have been identified, many of which are part of intracellular
signal-transduction cascades leading to modulation of certain genes. To date, there is no
evidence for the existence of DNA elements within the promoters region of eukaryotic genes
that respond directly to NO. Most, if not all, of these effects of NO are indirect. They are
based on the modulation of transcription factors, of the translation or stability of mRNA, or of
the processing of the primary (functionally inactive) gene product (Bogdan, 2001b). Recent
examples of NO regulated gene expression in mammalian system will be summarized in the
following sections.
2.2.1. NO and DNA-methylation
Methylation status of control regions in the genome plays a critical role in the regulation of
gene expression. In eukaryotic cells, cytosine 5'-methylation of CpG-dinucleotides favors a
repressive chromatin structure that impedes the promoter binding of transcriptional activators
and causes gene silencing (Bird, 1992). Fragile X mental retardation gene (FMR1) and
hypoxanthine phosphoribosyltransferase (HPRT) have a CpG island in their promoter region.
The repression of these genes by interleukin (IL)-1ß could be fully prevented by iNOS
inhibitors. NO donors also caused FMR1 and HPRT gene silencing by methylation of CpG
island. This effect could be reverted by demethylating agents, which, in turn, produced the
recovery of gene expression (Hmadcha et al., 1999).
2.2.2. NO and transcription factors
NO regulates gene expression on transcriptional level mainly through modulating the
transcriptional factors. In the bacterial system, studies on SoxR and OxyR, two transcriptional
activators of genes encoding antioxidants, have yielded rather uniform results showing that
reactive nitrogen intermediates (as well as reactive oxygen species) can induce and activate
these two resistance mechanisms (e.g. in Escherichia coli and Salmonella typhimurium) (Ding
and Demple, 2000; Hausladen et al., 1996).
In eukaryotic system, the results seem to be disputed. The paradigmatic NO mediated
eukaryotic transcription factor is nuclear factor kappa B (NF- B). NF- B is a dimeric
transcription factor that is sequestered in the cytoplasm by tightly bound inhibitory proteins
called I Bs (Verma et al., 1995). It is best known for its stimulatory functions in the immune
Introduction
7
system, notably in B-cells and macrophages. Activation of these cells leads to an I B kinase
(IKK)-mediated phosphorylation, ubiquitination and proteosomal degradation of I B, which
then allows the translocation of free NF- B into the nucleus (Stancovski and Baltimore,
1997). There are considerable body of evidence that NO (endogenous NO or NO donors) can
modulate the process of NF- B activation. But the obtained results are far less clear and even
contradictory, namely, NO can activate or inhibit NF- B (Deora et al., 1998; Matthews et al.,
1996; Spiecker et al., 1997; Umansky et al., 1998).
2.2.3. NO effects mRNA stability and translation
NO-dependent posttranstriptional mechanisms of gene regulation have been well documented.
A best known example is iron homeostasis control. The cellular iron homeostasis is
maintained by iron-regulatory protein (IRP) that was determined to be the cytosolic isoform
of aconitase (Kaptain et al., 1991). IRP binds to iron-responsive elements (IREs) that are
located in the 5'-untranslated regions of the mRNA of ferritin, and thereby regulates their
translation. NO converts the cytosolic aconitase into an IRP by promoting the loss of the iron-
sulfur cluster, which otherwise prevents IRE binding. Consequently, the activities of aconitase
and IRP are mutually exclusive and regulated by in part by NO (Hentze and Kuhn, 1996).
2.2.4. Regulation of posttranslational events by NO
Tumor cells often produce abundant transforming growth factor ß1 (TGF-ß1), which
suppresses the inducible isoform of NO synthase. TGF-ß1 is secreted in a latent form, which
consists of TGF-ß1 noncovalently associated with latency-associated peptide (LAP). TGF
becomes active upon disassembly of this complex, which can be elicited by acid pH, enzymes
(e.g. plasmin) or oxidants including hemin and nitroxyl anion (NO-). LAP, however, is able to
reassociate with and neutralize the bioactivity of TGF. Recently, Vodovotz et al. have
demonstrated that the latter process is controlled by NO radicals through their inactivation of
LAP by S-nitrosylation. Active TGF or the latent TGF- complex, by contrast, were not
affected by NO (Vodovotz et al., 1999).
Introduction
8
2.3. NO signaling and animal immune response
When nitric oxide (NO) formally entered the immunology scene, between 1985 and 1990, its
role in the immune system was simply defined: NO is a product of macrophages activated by
cytokines, microbial compounds or both, is derived from the amino acid L-arginine by the
enzymatic activity of inducible nitric oxide synthase (iNOS or NOS2) and functions as a
tumoricidal and antimicrobial molecule in vitro and in vivo (Nathan, 1992). Although this
basic definition is still accepted, during the past decade it has been recognized that NO plays
many more roles in the immune system as well as in other organ systems. There are a number
causes for this. First, not only macrophages, but also a large number of immune-system cell
(dendritic cells, natural killer (NK) cells, mast cells and phagocytic cells including monocytes,
macrophages, microglia, Kupffer cells, eosinophils, and neutrophils) produce and response to
NO. Second, contrary to previous views, all known isoform of NO synthase (nNOS, iNOS
and eNOS) operate in the immune system. Third, the activity of NO is not restricted to the site
of its production. No is highly diffusible and can combine with other molecules to function as
long distance signaling (e.g. GSH - GSNO). Finally, in contrast to cytokines, the interaction
of NO is not restricted to a single receptor (Bogdan, 2001a).
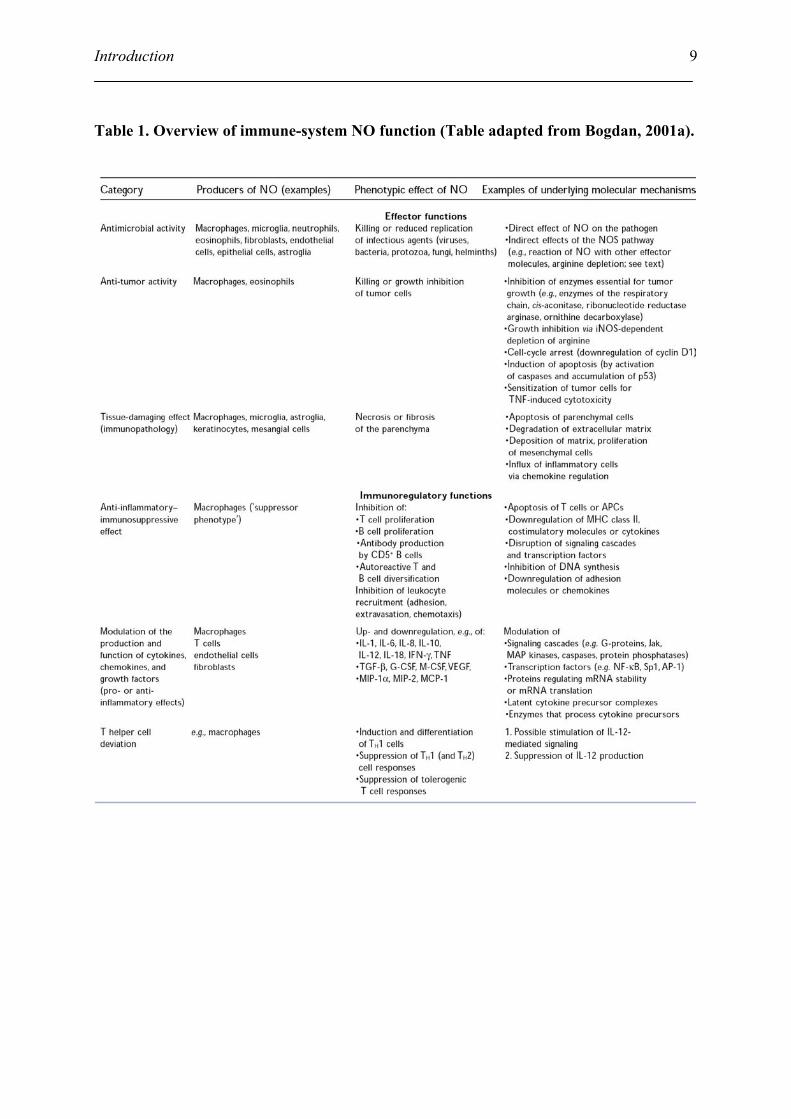
NO has been recognized as one of the most versatile players in the immune system (Table 1).
It is involved in anti-microbial activity; anti-tumor activity; tissue-damaging effects; anti-
inflammatory-immunosuppressive effects; modulation of the production and function of
cytokines, chemokines, and growth factors and T helper cell deviation. But most studies of
NO have involved exogenous NO sources (and arbitrarily chosen NO concentration) and NOS
inhibitors with possible side effects, and have been carried out a wide range of cell types and
cell-free systems. It has therefore been impossible to estimate the true extent to which NO
exerts positive or negative signaling effects. Because of variety of reaction partners of NO, its
widespread production and the fact that its activity is strongly influenced by its concentration,
NO continues to surprise and perplex NO researchers (Bogdan, 2001a).
Introduction
9
Table 1. Overview of immune-system NO function (Table adapted from Bogdan, 2001a).
Introduction
10
3. NO signaling in plants
When NO entered plant biologist’s field of vision, NO was regarded as a polluting gas.
Combustion is a classic source of NOx (NO and NO2). The atmospheric NOx likely enters
plants through stomata, or maybe by penetrating the damaged cuticle. Fumigating the plants
to atmospheric NOx led to a series of biochemical and physiological changing in plants, e. g.
nitrate reductase and nitrite reductase activation, depression of dark respiration, inhibition of
net photosynthesis, changing root physiology, membrane structure and so on. But the most
visible evidence to show NO’s detrimental sides is that gaseous NO obviously inhibited the
plants growth, although it didn’t induced apparent visible injure at 2 ppm concentration
(Wellburn, 1990).
The further research showed that NO involved in photomorphogenesis, mitochondrial
activity, leaf expansion, root growth, stomatal closure, senescence, and iron metabolism
(Beligni and Lamattina, 2000; Graziano et al., 2002; Leshem et al., 1998; Neill et al., 2002a;
Wendehenne et al., 2001). NO is also important for defense response, playing key roles in the
activation of defense gene (PR1 and Phytoalexin) and modulation of programmed cell death
(PCD) (Delledonne et al., 1998; Durner et al., 1998; Wendehenne et al., 2001). However, NO
research in plants is much more in its infancy and the results obtained to date are more
intriguing than proofing. The question about its cytotoxic or cytoprotective roles has already
been stated (Beligni and Lamattina, 1999a). Because plant NOS and endogenous NO in plants
are less known, most experiments are carried out by using animal NOS inhibitors or arbitrary
choosing NO concentrations as well as NO sources with possible side effects. It is not
surprising that the results from different labs seem to be inconsistent, or even contrary. But
due to its multiple and mysterious role, NO has attracted much attention and is becoming an
exciting research field in plant biology.
3.1. Biosynthesis of nitric oxide in plants
The presence and synthesis of NO in plant cells is undisputed. The question to be answered is
not whether but how do plants produce NO? It was first reported that NO could be produced
non-enzymatically. Non-enzymatic NO formation could be the result of chemical reactions
between N-oxides and plant metabolites (Cooney et al., 1994), of nitrous oxide
decomposition, or of chemical reduction of nitrite (NO2-) at acidic pH (Klepper, 1991;
Introduction
11
Nishimura et al., 1986). NO is also produced enzymatically from NO2- in plants by
NAD(P)H-dependent nitrate reductase (NaR) (Yamasaki and Sakihama, 2000). For example,
NO production in nonelicited sunflower and spinach leaves appears to be mediated by NaR
(Rockel et al., 2002). NaR-mediated NO generation may also play a role in abscisic acid
(ABA)-induced stomatal closure in Arabidopsis (Desikan et al., 2002). Studies have
demonstrated that plant NaRs can convert nitrite to NO under certain conditions in vitro
(Kaiser et al., 2002; Yamasaki et al., 1999).
In addition to NaR as a possible source for NO, the existence of mammalian-type NOS in
plants has been explored since years. NOS-like activity, based on the formation of L-citrulline
from L-arginine and/or sensitivity to mammalian NOS inhibitors, has been detected in several
plants. Many of the reported NOS activities were Ca2+-dependent, thus resembling
mammalian constitutive NOS (Barroso et al., 1999; Cueto et al., 1996; Ribeiro et al., 1999).
This hypothesis is further supported by the observation that cryptogein, an elicitor of tobacco
defense responses, triggers within minutes an NO burst sensitive to NOS inhibitors in
epidermal tobacco cells (Foissner et al., 2000).
In addition, western blot analysis using antibodies raised against mammalian NOSs enabled
the detection of immunoreactive proteins in plant extracts. Electron microscopy
immunolocalization using such antibodies showed the presence of NOS-like protein in the
matrix of peroxisomes and chloroplasts in pea leaves. Moreover, immunofluorescence
experiments in maize roots allowed researchers to localize a NOS-like protein in the cytosol
of cells in the division zone, and into the nucleus in the elongation zone (Barroso et al., 1999;
Ribeiro et al., 1999). However, the confidence of this immunoreaction has been doubted
based on the fact that the putative tobacco NOS has a Mr of 56 kD, whereas that from maize
is 166 kD (mammalian NOSs range in size from 130-160 kD) (Durner and Klessig, 1999).
Recent research showed that using immunological technique is inappropriate to infer the
presence of plant NOS. A proteomic approach verified that many NOS-unrelated plant
proteins cross-reacted with the mammalian NOS antibodies (Butt et al., 2003).
Although NOS-like activity have been detected in a wide variety of plants and Arabidopsis
genome has been sequenced, analysis of the complete Arabidopsis genome failed to detect a
NOS-like gene. The efforts to purify a plant NOS and clone its encoding gene were
unsuccessful until very recently. The bottleneck was finally broken by team headed by Daniel
F. Klessig (Chandok et al., 2003). Following a six-step purification protocol, and a 33.000-
fold purification, biochemical and molecular analysis revealed that the pathogen-inducible
nitric oxide synthase (iNOS) in plants is a variant of the P protein of the glycine
Introduction
12
decarboxylase (GDC) complex. Since the variant P protein shares very little sequence
homology with animal NOSs, this unexpected discovery explains why previous efforts to
identify this enzyme failed. Despite the lack of sequence homology, the biochemical
properties of the plant enzyme, including cofactor requirements and inhibitor sensitivity, as
well as its kinetic properties, appear to be very similar to those of its animal counterparts.
Moreover, plant iNOS, like that of animals, is specifically induced during the resistance
response to pathogen infection (Chandok et al., 2003).
3.2. NO signaling in plant defense responses
Plants cannot move to escape environmental challenges. Biotic stresses result from a battery
of potential pathogens: fungi, bacteria, nematodes and insects intercept the photosynthate
produced by plants, and viruses use replication machinery at the host's expense. Plants, in
turn, have evolved sophisticated mechanisms to perceive such attacks, and to translate that
perception into an adaptive response (Dangl and Jones, 2001).
3.2.1. Mechanisms of plant defense responses
Plants have evolved an array of rapid and efficient defense response against a wide variety of
pathogens including bacteria, fungi viruses and nematodes. In many cases, plant defense
responses is initiated by a ‘gene for gene’ interaction (Flor, 1971). For example, when a plant
has a specific resistance gene (R) that interacts with the corresponding avirulence gene (avr)
from the pathogen, plant can immediately recognize the pathogen and induce a rapid defense
mechanism known as programmed cell death (PCD) at the side of pathogen invasion. This
‘hypersensitive response’ (HR) is though to be one of the most powerful weapons and directly
kill invaders and /or to interfere with their acquisition of nutrients. But, if either the pathogen
or host lacks the corresponding avr or R gene, then the plant-microbe interaction results in
disease (Beers and McDowell, 2001; Dong, 1998). In addition to the localized HR, many
plants respond to pathogen infection by activating defenses in uninfected parts of the plant
(systemic acquired resistance, SAR). As a result, the entire plant is more resistant to a
secondary infection. SAR induction requires the signal molecule salicylic acid (SA), which
accumulates in plants prior to the onset of SAR (Sticher et al., 1997; Van Loon, 1999). SAR is
believed to be a result of the concerted activation of pathogenesis-related (PR) genes. NPR1
Introduction
13
(nonexpresser of PR genes) regulates the PR gene expression that serves as convenient marker
for monitoring SAR (Cao et al., 1997; Dong, 1998).
Pathogen-derived avr gene products are delivered to intercellular spaces or directly inside
plant cells, where they interact with the products of plant R genes. The R proteins are either
transmembrane or intracellular proteins that are presumed to initiate signal-transduction
cascades upon ligand binding. Many R gene products share structural motifs, indicating that
similar pathways might control resistance to diverse pathogens (Dangl and Jones, 2001). To
date, over 20 R genes have been identified and 5 classes are recognized: (1) intracellular
proteins with a nucleotide-binding site (NBS), a leucine-zipper motif and a leucine-rich repeat
(LRR) domain; (2) intracellular NBS¯LRR proteins with a region of similarity to the
cytoplasmic domain of mammalian interleukin-1 receptor (IL-1R) and the Drosophila Toll
proteins (i.e. the TIR [Toll/IL-1R] domain); (3) intracellular protein kinases (PKs); (4)
proteins with an LRR domain that encodes membrane-bound extracellular proteins; and (5)
receptor-like kinases (RLKs) with an extracellular LRR domain (Cohn et al., 2001; Dangl and
Jones, 2001).
The observation that some R gene products share similar amino acid motifs is likely to
provide insights into how these proteins interact with downstream signaling components
involved in disease resistance. Mammals, insects and plants share common components in
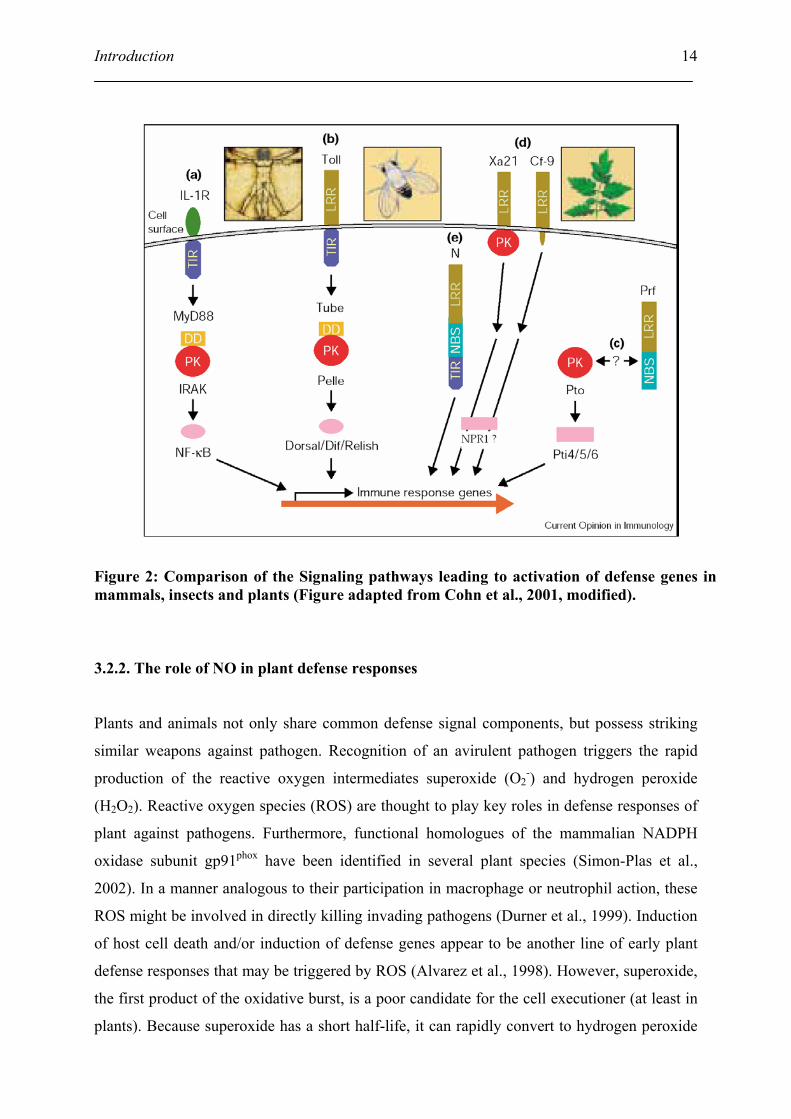
signaling pathways of defense response (Figure 2). For example, several of the plant R genes
such as N or Xa21 encode proteins with LRR, DDs and TIR domains, which are found in
mammalian interleukin-1 receptors (IL-1R) and the Drosophila Toll. Related protein kinases
(PK) occur in the defense pathways in all organisms. Owing to the fact that NPR1 shares
similarities to I- B, it has been proposed that NPR1 might act as a negative regulator of gene
transcription, similar to mammalian I- B, which participate in controlling immune responses
such as NO production and defensin induction (Despres et al., 2000).
Introduction
14
Figure 2: Comparison of the Signaling pathways leading to activation of defense genes in mammals, insects and plants (Figure adapted from Cohn et al., 2001, modified).
3.2.2. The role of NO in plant defense responses
Plants and animals not only share common defense signal components, but possess striking
similar weapons against pathogen. Recognition of an avirulent pathogen triggers the rapid
production of the reactive oxygen intermediates superoxide (O2-) and hydrogen peroxide
(H2O2). Reactive oxygen species (ROS) are thought to play key roles in defense responses of
plant against pathogens. Furthermore, functional homologues of the mammalian NADPH
oxidase subunit gp91phox have been identified in several plant species (Simon-Plas et al.,
2002). In a manner analogous to their participation in macrophage or neutrophil action, these
ROS might be involved in directly killing invading pathogens (Durner et al., 1999). Induction
of host cell death and/or induction of defense genes appear to be another line of early plant
defense responses that may be triggered by ROS (Alvarez et al., 1998). However, superoxide,
the first product of the oxidative burst, is a poor candidate for the cell executioner (at least in
plants). Because superoxide has a short half-life, it can rapidly convert to hydrogen peroxide
Introduction
15
and does not readily diffuse. Hydrogen peroxide itself is toxic at high concentrations, but not
enough of it is commonly produced during resistance responses to kill cells outright. A co-
conspirator to PCD maybe exists and has been sought. In mammalian macrophages, ROSs
collaborate with NO to execute bacterial pathogens (Nathan and Shiloh, 2000).
In soybean cells, NO potentiates the induction of hypersensitive cell death by reactive oxygen
intermediates and functions independently of such intermediates to induce genes for the
synthesis of protective natural products. Inhibitors of NOS compromise the hypersensitive
disease-resistance response of Arabidopsis leaves to Pseudomonas syringae, promoting
disease and bacterial growth. These finding suggest that NO plays a key role in disease
resistance in plants (Delledonne et al., 1998). Moreover, tobacco was infected with resistant,
but not susceptible tobacco mosaic virus resulted in enhanced NO synthase (NOS) activity.
Furthermore, NO donors or recombinant mammalian NOS triggered expression of
pathogenesis-related protein (PR1) and phenylalanine ammonia lyase (PAL) in tobacco plants
or tobacco suspension cells. These genes were also induced by cyclic GMP (cGMP) and
cyclic ADP-ribose, two molecules that can serve as second messengers for NO signaling in
mammals. Consistent with cGMP acting as a second messenger in tobacco, NO treatment
induced dramatic and transient increases in endogenous cGMP levels. Furthermore, NO-
induced activation of PAL was blocked by two inhibitors of guanylate cyclase (Durner et al.,
1998). Recently, a pathogen inducible nitric oxide synthase (iNOS) was purified in tobacco
and its corresponding gene in Arabidopsis was cloned (Chandok et al., 2003). Many other
publications also demonstrate the participation of NO, peroxynitrite and cGMP in plant
apoptosis, gene regulation and defense responses against pathogens (Alamillo and García-
Olmedo, 2001; Clark et al., 2000; Clarke et al., 2000; Clough et al., 2000; Shirasu and
Schulze-Lefert, 2000; Wendehenne et al., 2001; Wojtaszek, 2000; Yamasaki, 2000).
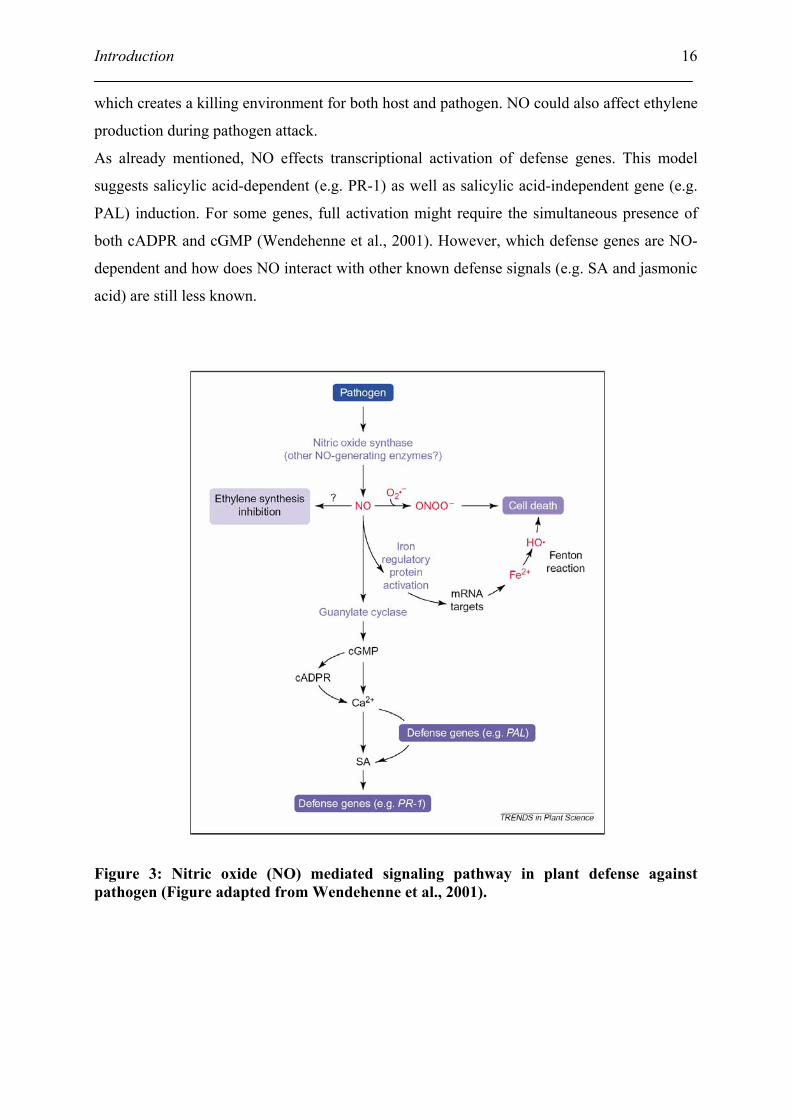
Summarily, nitric oxide (NO)-mediated signaling pathway in plant defense response could be
proposed as in Figure 3 (Wendehenne et al., 2001). Recognition of an infecting pathogen
leads to the production of reactive oxygen species (ROS such as superoxide [O2·-] and
hydrogen peroxide [H2O2]) possibly by NADPH oxidase and NO by NOS. ROS and NO
collaborate to execute pathogens via formation of peroxynitrite (ONOO-), which is highly
toxic and could play an important role in the activation of the cell death program. In another
pathway, NO might convert cytosolic aconitase into an iron regulatory protein (IRP), which
modulates the translation and stability of mRNAs encoding proteins involved in the
intracellular iron homeostasis (Navarre et al., 2000). The resulting increase in free iron
concentration promotes the Fenton reaction, leading to formation of the hydroxyl radical HO.,
Introduction
16
which creates a killing environment for both host and pathogen. NO could also affect ethylene
production during pathogen attack.
As already mentioned, NO effects transcriptional activation of defense genes. This model
suggests salicylic acid-dependent (e.g. PR-1) as well as salicylic acid-independent gene (e.g.
PAL) induction. For some genes, full activation might require the simultaneous presence of
both cADPR and cGMP (Wendehenne et al., 2001). However, which defense genes are NO-
dependent and how does NO interact with other known defense signals (e.g. SA and jasmonic
acid) are still less known.
Figure 3: Nitric oxide (NO) mediated signaling pathway in plant defense against pathogen (Figure adapted from Wendehenne et al., 2001).
Introduction
17
4. Goal of the work and the research strategy
Briefly, the goals of this work were:
1. Identifying NO-responsive genes by microarray analysis.
2. Verifying and explaining the induction/suppression of genes of interest within their
biological context.
4.1. Simulation of NO burst in Arabidopsis plants and suspension cells
Arabidopsis has been selected as research model plant, because the genome of Arabidopsis is
relative small and has recently been completely sequenced, which enables us to a
comprehensive genome-wide survey of gene expression patterns. The expression pattern can
be viewed as maps that reflect the order and logic of the genetic program, rather than the
physical order of genes on chromosomes. I carry out the research in two systems: whole plant
systems and cell suspension systems. Suspension cells are a good model to study intracellular,
but not intercellular signaling. To study NO intercellular signaling, transcript analysis in
whole plant is necessary.
The origin of NO in plants and the concentrations, at which it exerts its functions, is hitherto
still not known. To study the NO dependant gene induction, the best strategy is to simulate the
NO burst in plants as well as in cell suspension. Treatment with NO donors is a favorite
strategy of NO simulation in cell culture. But as we work with NO donors, we have to keep in
mind that we are working with side effects. Side effects cannot be avoided, but can be
reduced. What I can do is to use NO donors with fewer side effects. (+/-)-(E)-4-ethyl-2-[(E)-
hydroxyimino]-5-nitro-3-hexenamide (NOR3) is a novel NO donor, which has been isolated
from microbial products and reported to release NO spontaneously and stoichiometrically 1-
1.5 mol /mol of NOR3 in physiological pH (Kita et al., 1994). Compared to other classical
NO donors, such as sodium nitroprusside (SNP) or S-nitroso-N-acetylpenicillamine, NOR3 is
assumed to be superior in the present kinetic studies. NOR3 is known to be an excellent NO
donor to study NO-signaling both in the animal and the plant field, especially for treatment of
cell layers and/or cell suspensions (Yamamoto et al., 2000). In addition, to analyze NO-
mediated defense gene expression in Arabidopsis plants, and to obtain large quantities of
uniformly treated material, whole plants were treated with gaseous NO.
Introduction
18
4.2. Use of cDNA microarrays to study different gene expression
Various methods are available for detecting and quantitating gene expression levels, including
northern blots (Alwine et al., 1977), S1 nuclease protection (Berk and Sharp, 1977),
differential display (Liang and Pardee, 1992), sequencing of cDNA libraries (Adams et al.,
1991; Okubo et al., 1992), serial analysis of gene expression (SAGE) (Velculescu et al., 1995)
and cDNA microarrays.
The most common use of these is for the determination of patterns of differential gene
expression, comparing differences in mRNA expression levels between identical cells
subjected to different stimuli or between different cellular phenotypes or developmental
stages. Microarray expression analysis (Schena et al., 1995) has a number of features that
have made it the most widely used method for profiling mRNA expression. DNA segments
representing the collection of genes to be assayed are amplified by PCR and mechanically
spotted at high density on glass microscope slides using relatively simple x-y-z stage robotic
systems, creating a microarray containing thousands of elements. Microarrays containing the
entire set of genes from a microbial genome or tens of thousands of eukaryotic cDNA clones
can be easily constructed. The microarrays are queried in a co-hybridization assay using two
or more fluorescently labeled probes prepared from messenger RNA from the cellular
phenotypes of interest (Shalon et al., 1996). The kinetics of hybridization allows relative
expression levels to be determined based on the ratio with which each probe hybridizes to an
individual array element. Hybridization is assayed using a confocal laser scanner to measure
fluorescence intensities, allowing simultaneous determination of the relative expression levels
of all genes represented in the array.
Currently, several companies offer Arabidopsis genome covering arrays. The commercial
arrays are expensive. At the first stage, the fluorescent labeling protocol using 330 stress
and/or redox-regulated genes that were previously developed in institute of biochemical plant
pathology (BIOP) should be established. Once the standard protocol is proved to be economic
and efficient, the array is extended by increasing the number of genes to be analyzed.
4.3. Verify and explain the gene induction
Microarray analysis should reveal which gene can be activated or suppressed by NO. This
could help us to insight the role of NO in the plant signaling network and to define the
Introduction
19
downstream components of NO signaling. In addition, I wanted to verify the microarray
results by classical methods (e.g. northern blot) and follow the hints obtained through
expression profiling to carry out further research, possibly using biochemical and
physiological methods. Moreover, I wanted to elucidate the effects of NO in plant defense
response, especially the interaction between NO and other known defense signals (e.g. SA, JA
and ethylene). To reveal this interaction, transcripts of wild type plants were compared with
that from mutants/transgenes impaired in plant defense responses.
Thus, the data generated by these approaches should eventually increase our understanding of
NO’s role in plant defense responses, and they should help to define NO’s place within the
complex signaling pathways.
Materials and Methods
20
II. Materials and Methods
1. Materials
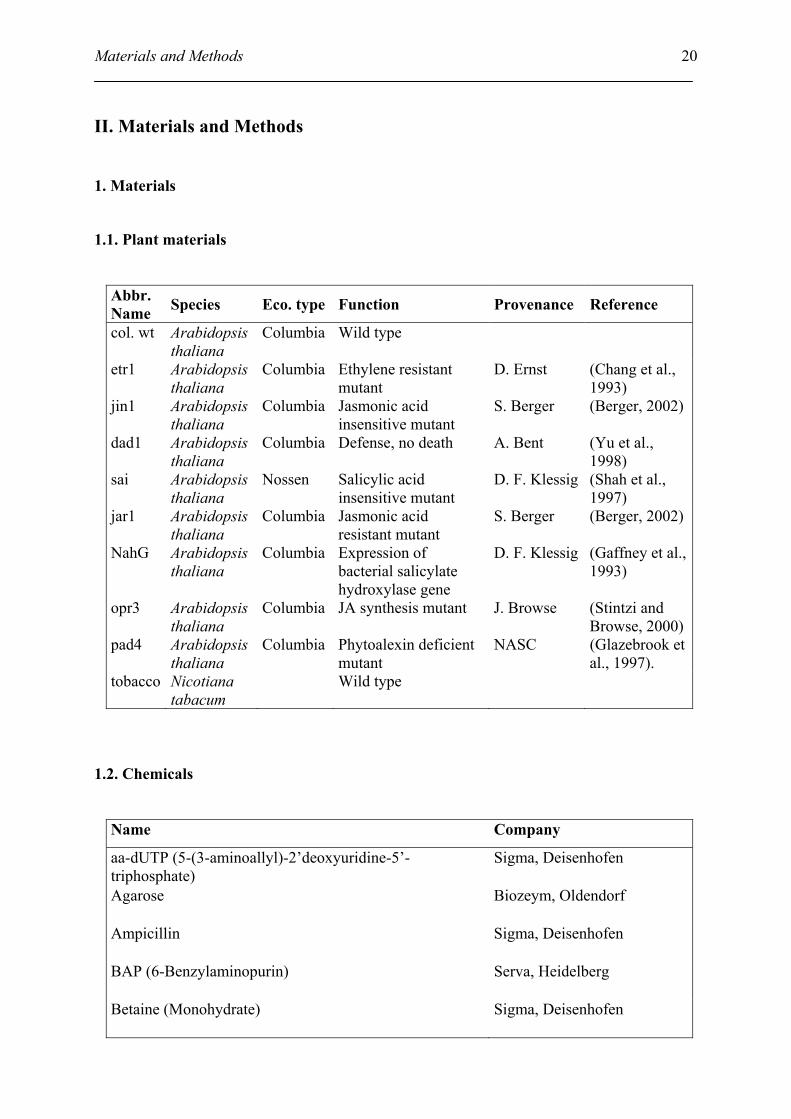
1.1. Plant materials
Abbr. Name Species Eco. type Function Provenance Reference
col. wt Arabidopsis thaliana
Columbia Wild type
etr1 Arabidopsis thaliana
Columbia Ethylene resistant mutant
D. Ernst (Chang et al., 1993)
jin1 Arabidopsis thaliana
Columbia Jasmonic acid insensitive mutant
S. Berger (Berger, 2002)
dad1 Arabidopsis thaliana
Columbia
Defense, no death
A. Bent
(Yu et al., 1998)
sai Arabidopsis thaliana
Nossen Salicylic acid insensitive mutant
D. F. Klessig (Shah et al., 1997)
jar1 Arabidopsis thaliana
Columbia Jasmonic acid resistant mutant
S. Berger (Berger, 2002)
NahG Arabidopsis thaliana
Columbia Expression of bacterial salicylate hydroxylase gene
D. F. Klessig (Gaffney et al., 1993)
opr3 Arabidopsis thaliana
Columbia JA synthesis mutant J. Browse (Stintzi and Browse, 2000)
pad4 Arabidopsis thaliana
Columbia Phytoalexin deficient mutant
NASC (Glazebrook et al., 1997).
tobacco Nicotiana tabacum
Wild type
1.2. Chemicals
Name Company
aa-dUTP (5-(3-aminoallyl)-2’deoxyuridine-5’-triphosphate)
Sigma, Deisenhofen
Agarose Biozeym, Oldendorf
Ampicillin Sigma, Deisenhofen
BAP (6-Benzylaminopurin) Serva, Heidelberg
Betaine (Monohydrate) Sigma, Deisenhofen
Materials and Methods
21
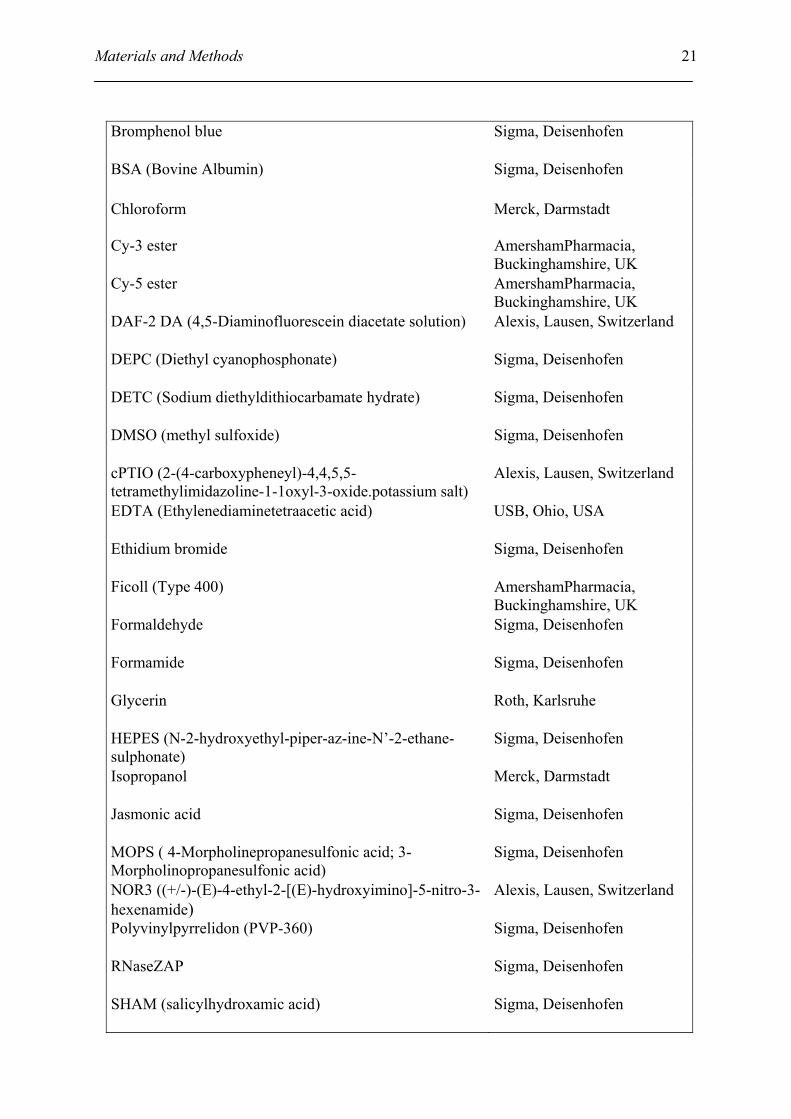
Bromphenol blue Sigma, Deisenhofen
BSA (Bovine Albumin) Sigma, Deisenhofen
Chloroform Merck, Darmstadt
Cy-3 ester AmershamPharmacia, Buckinghamshire, UK
Cy-5 ester AmershamPharmacia, Buckinghamshire, UK
DAF-2 DA (4,5-Diaminofluorescein diacetate solution) Alexis, Lausen, Switzerland
DEPC (Diethyl cyanophosphonate) Sigma, Deisenhofen
DETC (Sodium diethyldithiocarbamate hydrate) Sigma, Deisenhofen
DMSO (methyl sulfoxide) Sigma, Deisenhofen
cPTIO (2-(4-carboxypheneyl)-4,4,5,5-tetramethylimidazoline-1-1oxyl-3-oxide.potassium salt)
Alexis, Lausen, Switzerland
EDTA (Ethylenediaminetetraacetic acid) USB, Ohio, USA
Ethidium bromide Sigma, Deisenhofen
Ficoll (Type 400) AmershamPharmacia, Buckinghamshire, UK
Formaldehyde Sigma, Deisenhofen
Formamide Sigma, Deisenhofen
Glycerin Roth, Karlsruhe
HEPES (N-2-hydroxyethyl-piper-az-ine-N’-2-ethane-sulphonate)
Sigma, Deisenhofen
Isopropanol Merck, Darmstadt
Jasmonic acid Sigma, Deisenhofen
MOPS ( 4-Morpholinepropanesulfonic acid; 3-Morpholinopropanesulfonic acid)
Sigma, Deisenhofen
NOR3 ((+/-)-(E)-4-ethyl-2-[(E)-hydroxyimino]-5-nitro-3-hexenamide)
Alexis, Lausen, Switzerland
Polyvinylpyrrelidon (PVP-360) Sigma, Deisenhofen
RNaseZAP Sigma, Deisenhofen
SHAM (salicylhydroxamic acid) Sigma, Deisenhofen
Materials and Methods
22
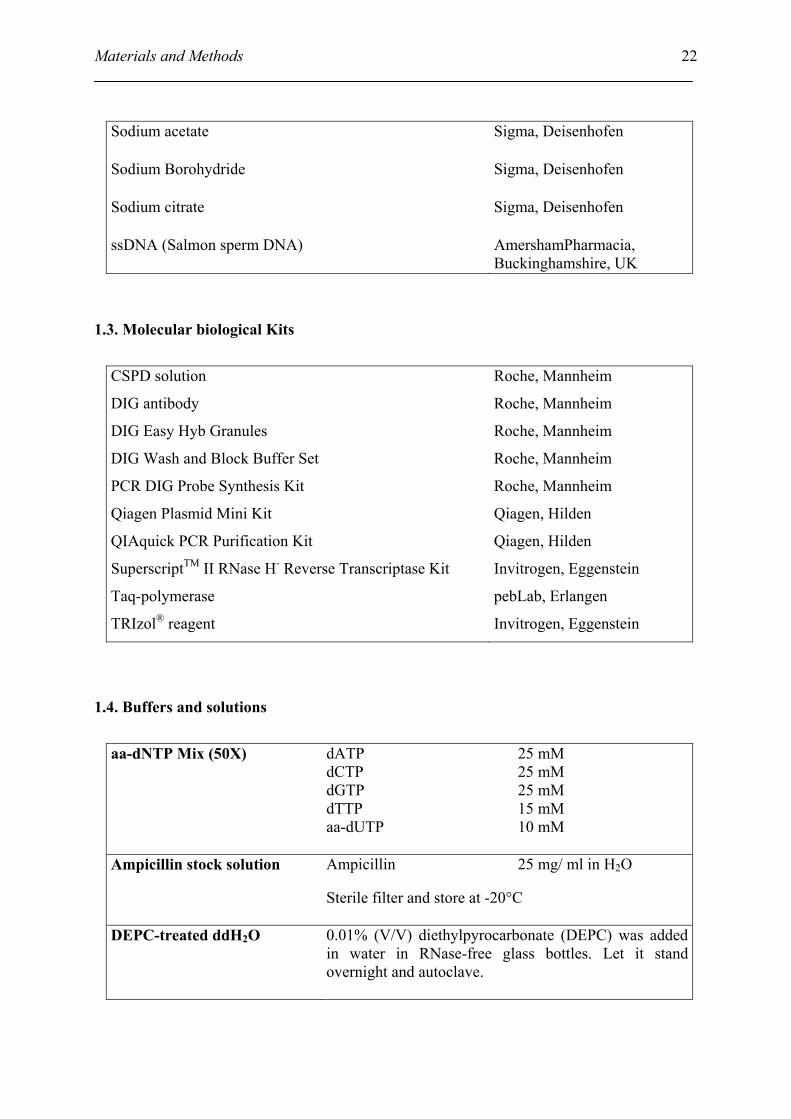
Sodium acetate Sigma, Deisenhofen
Sodium Borohydride Sigma, Deisenhofen
Sodium citrate Sigma, Deisenhofen
ssDNA (Salmon sperm DNA) AmershamPharmacia, Buckinghamshire, UK
1.3. Molecular biological Kits
CSPD solution
DIG antibody
DIG Easy Hyb Granules
DIG Wash and Block Buffer Set
PCR DIG Probe Synthesis Kit
Qiagen Plasmid Mini Kit
QIAquick PCR Purification Kit
SuperscriptTM II RNase H- Reverse Transcriptase Kit
Taq-polymerase
TRIzol® reagent
Roche, Mannheim
Roche, Mannheim
Roche, Mannheim
Roche, Mannheim
Roche, Mannheim
Qiagen, Hilden
Qiagen, Hilden
Invitrogen, Eggenstein
pebLab, Erlangen
Invitrogen, Eggenstein
1.4. Buffers and solutions
aa-dNTP Mix (50X)
dATP dCTP dGTP dTTP aa-dUTP
25 mM 25 mM 25 mM 15 mM 10 mM
Ampicillin 25 mg/ ml in H2O Ampicillin stock solution
Sterile filter and store at -20°C
DEPC-treated ddH2O 0.01% (V/V) diethylpyrocarbonate (DEPC) was added in water in RNase-free glass bottles. Let it stand overnight and autoclave.
Materials and Methods
23
Ficoll Polyvinylpyrrelidon BSA Add H2O to
10 g 10 g 10 g 500 ml
Denhardt solution (100×)
Sterile filter and store at -20°C
DNA extraction buffer Hexadecyltrimethyl-ammonium bromide (CTAB) NaCl EDTA Tris (pH8.0) PVP 40 Ascorbic acid Diethyldithiocarbamic acid Autoclave
2% (w/v) 1.42 M 20 mM 100 mM 2% (w/v) 5 mM 4 mM
Hybridization buffer (for microarray)
Formamide 20×SSC 10% SDS 100×Denhardt solution ssDNA (10 mg/ ml) Add H2O to
50 ml 30 ml 5 ml 5 ml 1 ml 100 ml
MOPS Buffer (10×) MOPS Sodium acetate EDTA Adjust to pH 7.0
200 mM 50 mM 10 mM
PCR buffer (10×) Tris (NH4)2SO4 MgCl2 Tween 20 Adjust with HCl to pH 9.0
750 mM 200 mM 15 mM 0.1% (v/v)
Phosphate buffer (1M) 1M K2HPO4 1M KH2PO4 Adjust to pH 8.5
9.5 ml 0.5 ml
Phosphate elution buffer (for aa-dUTP labeling cDNA synthase)
1 M KPO4
Add H2O to Adjust to pH 8.5
4 ml 1000 ml
Phosphate wash buffer (for aa-dUTP labeling cDNA synthase)
1 M KPO4
MilliQ water 95% ethanol Total
0.5 ml 15.25 ml 84.25 ml 100 ml
Materials and Methods
24
Phosphate-buffered saline (PBS)
NaCl KCl Na2HPO4 KH2PO4 Adjust to pH 7.4
137 mM 2.7 mM 10.0 mM 2.0 mM
Pre-hybridization buffer (for microarray)
20×SSC 10% SDS BSA ssDNA (10 mg/ ml) Add H2O to
30 ml 5 ml 1 g 1 ml 100 ml
RNA probe buffer Formaldehyde Formamide deion. 10×MOSP buffer Bromphenol blue
30 µl 8700 µl 500 µl trace
SSC (20×) NaCl Sodium citrate Adjust to pH 7.0
3 M 0.3 M
Salmon sperm DNA 10 mg/ ml ssDNA stock solution
Dissolve the ssDNA in water, autoclave, and store at -20°C. Before adding to hybridization buffer, ssDNA was denatured at 100°C for 2 min and cooled on ice.
TE buffer Tris EDTA Adjust to pH 8.0
10 mM 1 mM
TBE buffer Tris-borate EDTA Adjust to pH 8.0
45 mM 1 mM
TRIzol Reagent Phenol in saturated buffer Guanidine thiocyanate Ammonium thiocyanate Sodium acetate, pH5 Glycerol Add H2O to
38 % 0.8 M 0.4 M 0.1 M 5 % 1.0 liter
Materials and Methods
25
1.5. Mediums
LB glycine medium K2HPO4 KH2PO4 MgSO4 Natrium citrate (NH4)2SO4 Glycine Tryptone Yeast extracts NaCl Adjust to pH 8.0
36.0 mM 13.2 mM 0.4 mM 1.7 mM 6.8 mM 4.4% 1% (w/v) 0.5% (w/v) 1% (w/v)
PS medium
MS Macro element (10×) MS Micro element (1000×) MS Vitamin Fe-EDTA (200×) 2, 4-D (2 mg/ ml) Saccharose Agar BAP (1 mg/ ml) Add H2O to Adjust to pH 6.0 Autoclave
100 ml 1 ml 10 ml 5 ml 1 ml 30 g 12 g 1 ml 1000 ml
Stock solutions of PS medium:
MS macro element (10×) NH4NO3 KNO3 CaCl2 .2H2O MgSO4 .7H2O KH2PO4 KI Add bidist. H2O to Autoclave
33.0 g 38.0 g 8.8 g 7.4 g 3.4 g 16.6 mg 2000 ml
MS micro elements (1000×)
MnSO4 .H2O H3BO3 ZnSO4 .7H2O Na2MoO4 .2H2O CuSO4 .5H2O CoCl2 .6H2O Add H2O to
3340 mg 1240 mg 2120 mg 50 mg 50 mg 50 mg 200 ml
Materials and Methods
26
MS Vitamins (100×) Nicotinic acid Pyridoxine-HCl Thiamine-HCl m-Inosite Add H2O to Store at -20°C
25 mg 25 mg 5.3 mg 5000 mg 500 ml
FeSO4 .7H2O Na2 EDTA .2H2O
2.78 g 3.72 g
Fe- EDTA solution (100×)
Dissolve respectively in 200 ml H2O and slowly mix together, add H2O up to 500 ml and warm up to 60°C until turning yellow.
1.6. Apparatus
Alpha 1-5 freeze-dryer Christ, Osterode
Array robot GMS 417 Genetic Microsystems
AXON GenePix 4000 scanner Axon, CA, USA
Brucker ESP300 X-band spectrometer Brucker, Karlsruhe
Centrifuge 5415D Eppendorf, Hamburg
Centrifuge LL Universal Hittich, Tuttingen
Clark-type oxygen electrode cuvette Hansatech, Bachofer
HybChamberTM GeneMachines, California, USA
MicroGrid II Arrayer Apogent Discoveries, UK
Milli-Q Water System Millipore, Eschborn
PCR thermocycler Hybaid, Heidelberg
pH-Meter 743 Knick, Berlin
UV-Crosslinker Stratalinker Stratagene, Heidelberg
Vacuum manifold filtration system Millipore, Eschborn
Zeiss LSM 510 confocal laser microscope Zeiss, Oberkochen
Materials and Methods
27
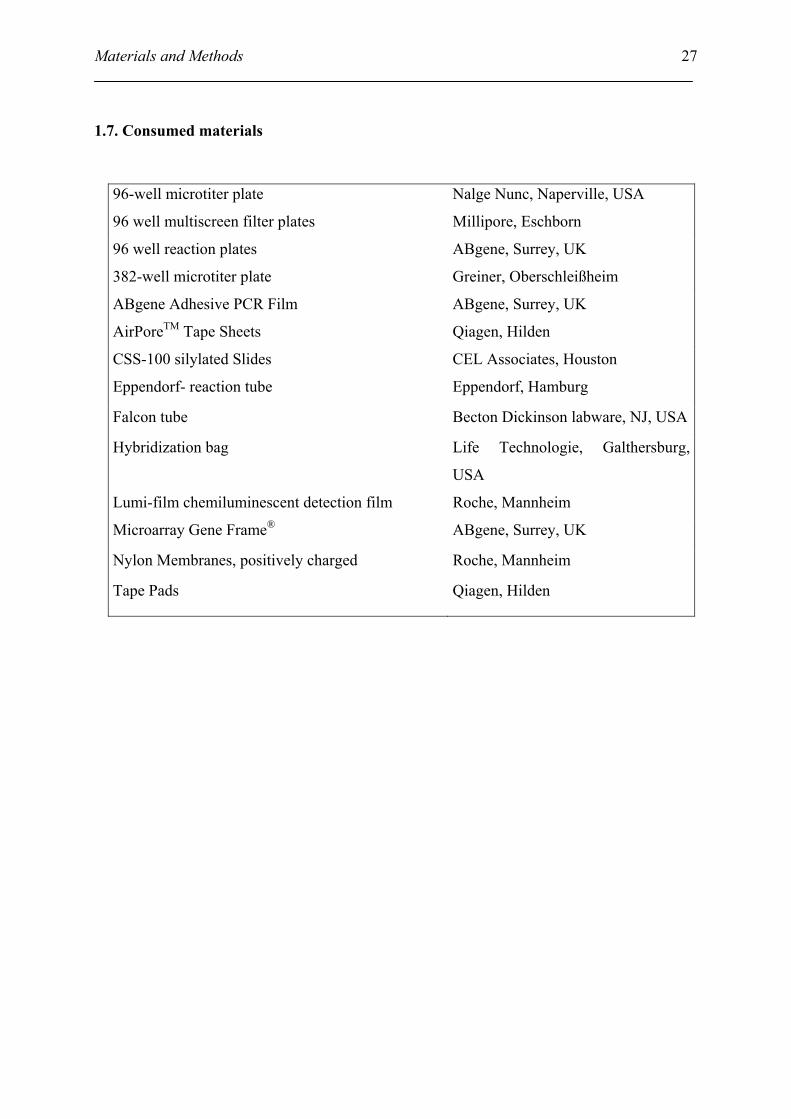
1.7. Consumed materials
96-well microtiter plate Nalge Nunc, Naperville, USA
96 well multiscreen filter plates Millipore, Eschborn
96 well reaction plates ABgene, Surrey, UK
382-well microtiter plate Greiner, Oberschleißheim
ABgene Adhesive PCR Film ABgene, Surrey, UK
AirPoreTM Tape Sheets Qiagen, Hilden
CSS-100 silylated Slides CEL Associates, Houston
Eppendorf- reaction tube Eppendorf, Hamburg
Falcon tube Becton Dickinson labware, NJ, USA
Hybridization bag Life Technologie, Galthersburg,
USA
Lumi-film chemiluminescent detection film Roche, Mannheim
Microarray Gene Frame® ABgene, Surrey, UK
Nylon Membranes, positively charged Roche, Mannheim
Tape Pads Qiagen, Hilden
Materials and Methods
28
2. Methods
2.1. Growth condition of Arabidopsis plants and treatment with NO
Seeds from plants (Arabidopsis thaliana, ecotype Columbia or, when indicated, ecotype
Nössen) were sown on potting compost and vernalized for 2 days at 4°C. Plants were grown
for 4 to 5 weeks in a growth chamber (at 69% relative humidity, 10 hr light) at 23°C during
the day and 18°C at night.
The experimental setups to study the effect of NO on whole plants consisted of controlled
environment cabinets as well as complete instrumentation to adjust and control gaseous NO
through an electrochemical sensor. In experiments, Arabidopsis plants were treated with NO
concentrations of 1250 ppm for 10 min. At this NO concentration, the plants did not show any
symptoms. After this treatment, the plants were maintained in growth chambers and harvested
at different time. Leaf material was quickly frozen in liquid nitrogen and stored at -80° until
further use.
2.2. Cell culture and NO treatment
Cell suspensions were cultured in liquid PS-medium (see 1.2.4.) at 27°C and stirred at 120
rpm in darkness. Cell culture was transferred to a new PS-medium weekly. A 7 days old cell
suspension was treated with the NO donor NOR3 ((E)-Ethyl-2-[(E)-hydroxyimino]-5-nitro-3-
hexene-amide) at final concentration of 0.5 mM. After treatment, cells were harvested by
filtration at various times. The cells were quickly frozen in liquid nitrogen and stored at -80°C
until further use.
2.3. Microarray
For the analysis of expression in most eukaryotes, expressed sequence tag (EST) data
represent the most extensive data for gene identification. ESTs are single-pass, partial
sequences of cDNA clones, and they have been used extensively for gene discovery in many
organisms. The EST approach has been widely adopted; more than 71% of all GenBank
entries and 40% of the individual nucleotides in the database are derived EST sequences
(Schuler, 1997). 330 EST of so called “stress genes” defense-related genes encoding PR-
Materials and Methods
29
proteins or proteins induced by pathogens, oxidative, cold, UV, ozone, or heavy metal stress.
(See Supplement Table S1) were assembled in BIOP by work groups headed by PD Dr.
Anthon Schaeffner and Dr. Dietrich Ernst. Most of them are cDNA clones (expressed
sequence tags [ESTs]) obtained from the Arabidopsis Biological Resource Center (Columbus,
OH). Some of them were cloned by Dr. Bern Heidenreich in his doctoral work (Heidenreich
et al., 2001). These genes were chosen for transcripts analysis after NO treatment.
2.3.1 PCR amplification and purification of target DNA
2.3.1.1 Amplification of the target DNA
cDNA clone inserts were amplified by PCR from plasmid DNA or directly from clones in
culture. In high-throughput applications, amplification of clones from culture has the
advantage of being both more cost efficient and less labor intensive with lower cross-
contamination rates than amplification from plasmid DNA. Clone inserts were amplified
using the following protocol:
A. Selected clones were inoculated in 96 well microtiter plate containing 100µl LB-glycerol
medium with ampicillin (100µg/ ml). Microtiter plates were covered with AirPoreTM Tape
Sheets and incubated for 16 hours at 37ºC. The bacteria suspension were directly used for
PCR or stored for future use at -80°C. Alternatively, plasmid DNAs were isolated by
using Qiagen Plasmid Mini Kit and 1:50 diluted with water. The diluted plasmid DNA
served as PCR template.
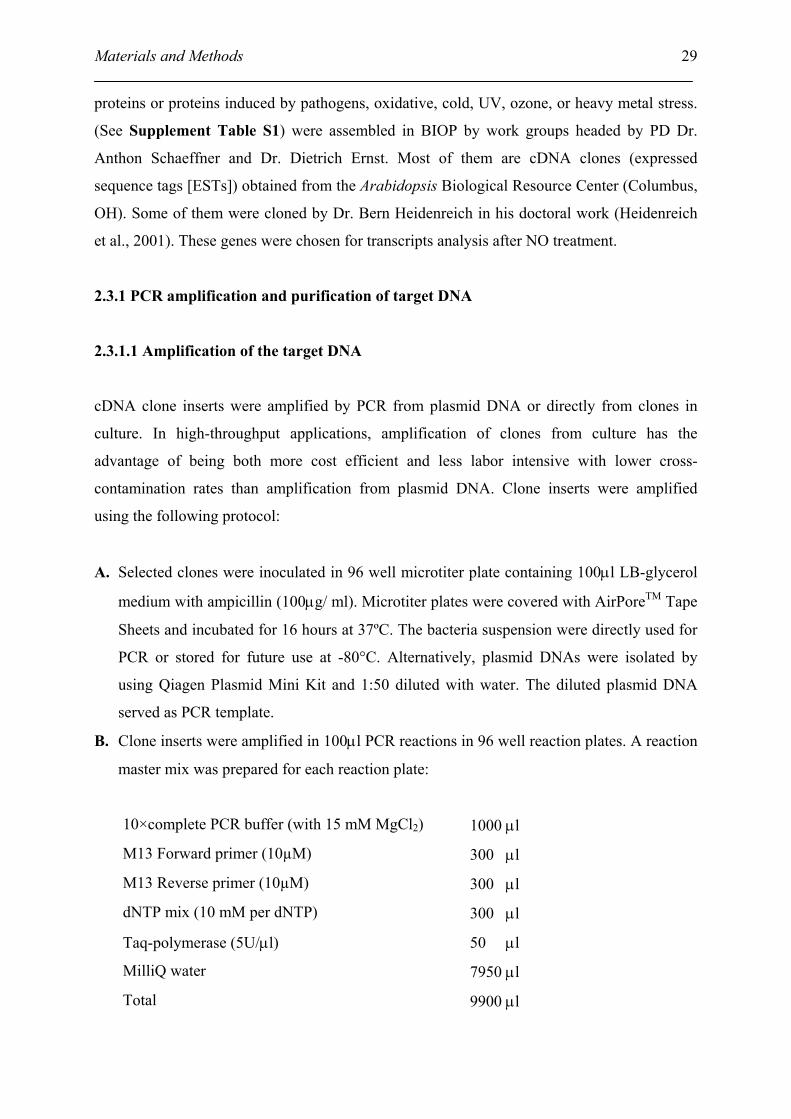
B. Clone inserts were amplified in 100µl PCR reactions in 96 well reaction plates. A reaction
master mix was prepared for each reaction plate:
10×complete PCR buffer (with 15 mM MgCl2) 1000 µl
M13 Forward primer (10µM) 300 µl
M13 Reverse primer (10µM) 300 µl
dNTP mix (10 mM per dNTP) 300 µl
Taq-polymerase (5U/µl) 50 µl
MilliQ water 7950 µl
Total 9900 µl
Materials and Methods
30
The amplification primers were M13 primers with C6 amino modification to the 5' end
(purchased from MWG, Ebersburg) with the following sequences:
M13 FWD: 5'- GTA AAA CGA CGG CCA GT -3'
M13 REV: 5'- GGA AAC AGC TAT GAC CAT G- 3'
C. For each reaction, 2µl of culture supernatant or 2 µl of diluted plasmid solution were
added to 98µl of master mix in 96 well PCR reaction plate with multi-pipette. The PCR
reaction plate was covered with ABgene Adhesive PCR Film.
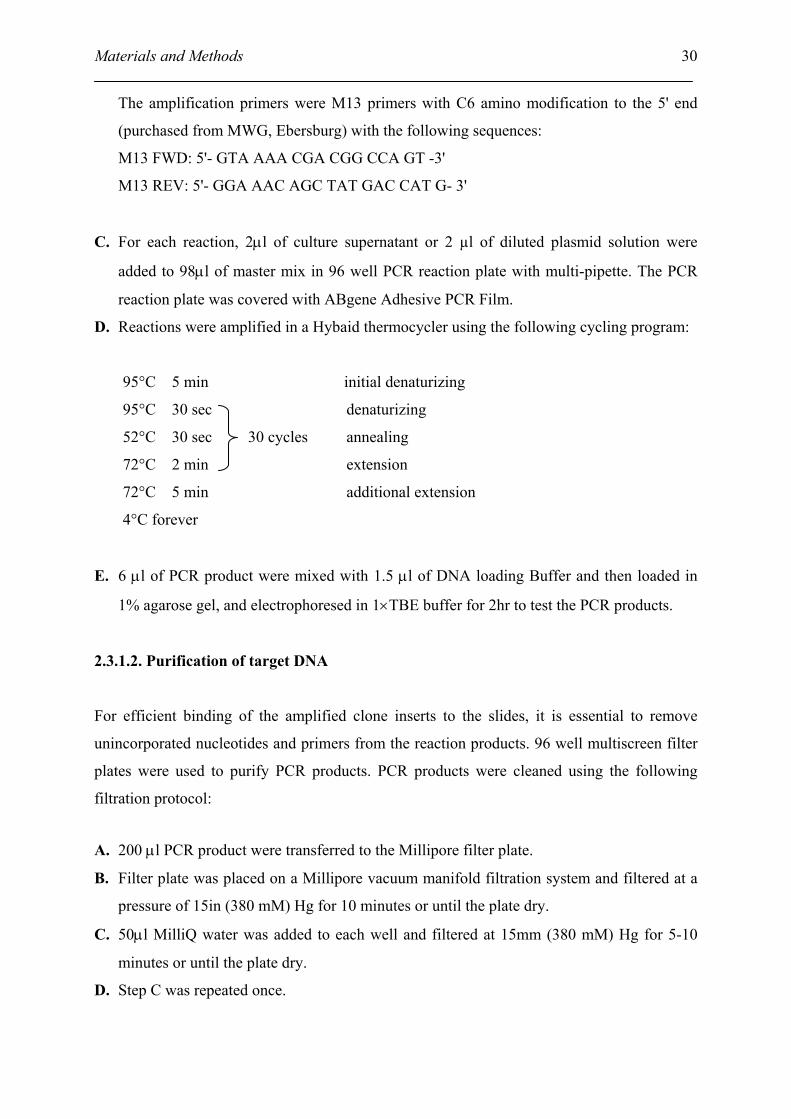
D. Reactions were amplified in a Hybaid thermocycler using the following cycling program:
95°C 5 min
95°C 30 sec
52°C 30 sec 30 cycles
72°C 2 min
72°C 5 min
4°C forever
initial denaturizing
denaturizing
annealing
extension
additional extension
E. 6 µl of PCR product were mixed with 1.5 µl of DNA loading Buffer and then loaded in
1% agarose gel, and electrophoresed in 1×TBE buffer for 2hr to test the PCR products.
2.3.1.2. Purification of target DNA
For efficient binding of the amplified clone inserts to the slides, it is essential to remove
unincorporated nucleotides and primers from the reaction products. 96 well multiscreen filter
plates were used to purify PCR products. PCR products were cleaned using the following
filtration protocol:
A. 200 µl PCR product were transferred to the Millipore filter plate.
B. Filter plate was placed on a Millipore vacuum manifold filtration system and filtered at a
pressure of 15in (380 mM) Hg for 10 minutes or until the plate dry.
C. 50µl MilliQ water was added to each well and filtered at 15mm (380 mM) Hg for 5-10
minutes or until the plate dry.
D. Step C was repeated once.
Materials and Methods
31
E. Filter plate was removed from the manifold filtration system. 50µl of MilliQ water were
added to each well. Filter plate was placed on a shaker and shaked vigorously for 10
minutes to resuspend the DNA.
F. The purified PCR products were manually pipetted into a new 96 well plate.
G. Plates containing the purified PCR products were then sealed using a Qiagen Tape Pads
and stored at 4°C for future arraying.
2.3.2 Array printing
50 µl purified amino-modified PCR products were dried by lyophylization in a Christ Alpha
1-5 freeze-dryer and suspended in 20 µl spotting solution (3×SSC supplemented with 1.5M
betaine). Using betaine can not only reduce evaporation, but improve the binding efficiency
and the homogeneity of spotted DNA (Diehl et al., 2001). PCR products were arrayed from
384-well microarray plates onto silylated microscope slides using a MicroGrid DNA arraying
robot. The printing robot is a x, y, z motion control unit equipped with a printing head
containing printing tips. The tips are dipped into the samples and then moved towards the
slides, where they touch the surface and deliver a small aliquot forming a dot with a diameter
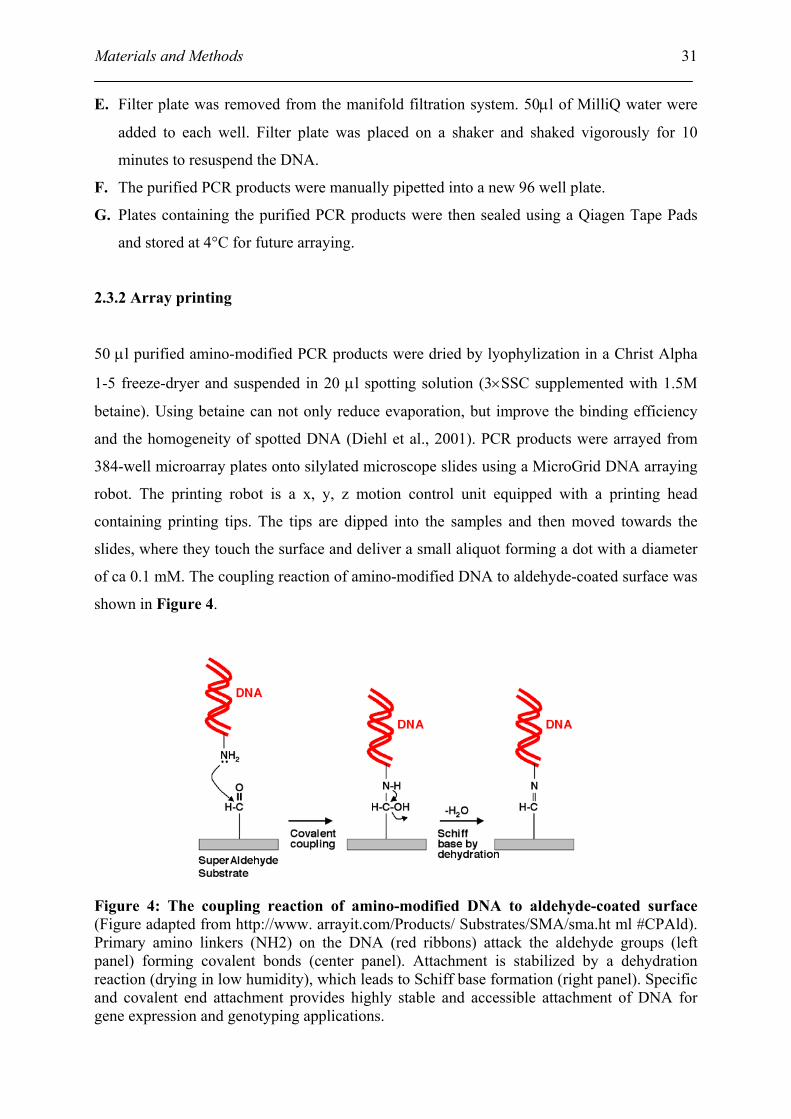
of ca 0.1 mM. The coupling reaction of amino-modified DNA to aldehyde-coated surface was
shown in Figure 4.
Figure 4: The coupling reaction of amino-modified DNA to aldehyde-coated surface (Figure adapted from http://www. arrayit.com/Products/ Substrates/SMA/sma.ht ml #CPAld). Primary amino linkers (NH2) on the DNA (red ribbons) attack the aldehyde groups (left panel) forming covalent bonds (center panel). Attachment is stabilized by a dehydration reaction (drying in low humidity), which leads to Schiff base formation (right panel). Specific and covalent end attachment provides highly stable and accessible attachment of DNA for gene expression and genotyping applications.
Materials and Methods
32
2.3.3. Post-washing and blocking
Following processes are indispensable to remove unbound material, and block unreacted
aldehyde groups to reduce non-specific binding of labeled reactants (Schena et al., 1996).
A. The spotted substrates were kept in solution form for at least one day and dried by
lyophilization.
B. The printed substrates were rinsed twice in 0.1% SDS and once in dH2O for 2 min at room
temperature (22-25°C) to remove unbound DNA.
C. The Substrates were rinsed once in dH2O for 2 min at room temperature with vigorous
agitation.
D. Treatment with sodium borohydride (NaBH4) reduces unreacted aldehyde groups to
alcohols, which lowers fluorescent background in assays. For sodium borohydride
reduction, the slides were immersed in sodium borohydride reducing solution [0.75g
NaBH4 were dissolved in 200 ml phosphate buffered saline (PBS), 75 ml 100% ethanol
were added to reduce the bubbles], and then reduced for 5 min with gentle mixing.
E. The slides were transferred into boiling dH2O at 100°C for 2 min to denature the DNA.
F. The slides were rinsed twice for 1 min in 0.1% SDS.
G. The slides were rinsed twice for 1 min in 500 ml dH2O, and dried the processed substrates
by centrifugation for 1 min at 500x g in a centrifuge (Hettich, Model LL Universal).
2.3.4 Probe labeling
2.3.4.1 RNA extraction
Microarray assay differential gene expression by co-hybridization of fluorescent labeled
probes prepared from different RNA sources. As with many other RNA-based assays, the
purity and quality of the starting RNA has a significant effect on the results of the assay.
Further, the products of the labeling reactions must be cleaned to remove unincorporated
labeled nucleotides that can produce a significant background on the substrate following
hybridization. I have found that TRIzol reagent gives consistently high quality RNA from cell
culture and many tissue samples. TRIzol extraction is quick and produces a high yield of total
RNA.
Materials and Methods
33
A. Homogenization
Ca. 100 mg tissue was homogenized in a plastic Eppendorf centrifuge tube containing 1 ml
TRIzol reagent. The tubes were shaked vigorously by hand and incubated for 5 min at room
temperature to permit the complete dissociation of nucleoprotein complexes.
B. Phase separation
0.2 ml of chloroform per 1 ml of TRIzol Reagent was added. Tubes were capped securely,
and shaked vigorously with vortex for 15 sec, and then incubated at room temperature for 2 to
3 minutes. Following centrifugation at 12,000×g for 15 minutes at 4°C, the mixture separates
into a lower red, phenol-chloroform phase, an interphase, and a colorless upper aqueous
phase. RNA remains exclusively in the aqueous phase.
C. RNA precipitation
Aqueous phase was carefully pipetted into a clean Eppendorf centrifuge tube. Interphase and
lower phase were discarded. The RNA was precipitated from the aqueous phase by mixing
0.5 ml of isopropyl alcohol per 1 ml of TRIzol Reagent used for initial homogenization. The
mixed solution was incubated at room temperature for 10 min, and then centrifugated at
12,000×g at 4°C for 15 min.
D. RNA wash
The supernatant was discarded. Pellet was washed with 1 ml of 75% ethanol by vortex briefly.
The tube was centrifugated at no more than 7,500×g at 4°C for 5 min. Supernatant was
discarded. The pellet was air dried for ca. 10 min and resuspended in 50 µl DEPC-H2O by
pipetting up and down a few times. The suspension was incubated at 55 -60 °C for 10 min to
dissolve the pellet completely. An aliquot was put into the spectrophotometer to determine
RNA concentration and quality. For optimal spectrophotometric measurements, RNA
aliquotes were 1:35 diluted with DEPC- H2O.
Materials and Methods
34
2.3.4.2. cDNA synthesis
Probes for microarray analysis were prepared from RNA templates by incorporation of
fluorescently labeled deoxyribonucleotides during first strand cDNA synthesis. Either total or
poly(A+) RNA can be used in the reverse transcription reaction, but oligo (dT) labeling of
total RNA provides consistently high-quality probes from smaller quantities of starting RNA
and without the expense of poly(A+) purification. I prepared labeled probes using indirect
aminoallyl labeling method, namely, cDNA synthesis and fluorescent labeling were divided
(Protocol was adapted from http://pga.tigr.org/sop/M004-1a.pdf, modified). This method was
proved to be high efficient and lower costing. cDNA were synthesized using the following
protocol:
A. 4 µl Poly-d(T)12-18 primers (0.5 mg/ ml) were added to 20µg of total RNA and the final
volume was adjusted up to 18.5 µl with RNase-free water.
B. The sample was well mixed by vortex and incubated at 70°C for 10 minutes, snap-frozen
in ice for 30 seconds, and then centrifugated briefly.
C. A reaction master mix with following components was added and mixed by vortex.
5X First Strand buffer 6 µl
0.1 M DTT 3 µl
10X aminoallyl-dNTP (aa-dNTP) mix 3 µl
SuperScript II RT (200U/ µl) 2 µl
D. The tube was incubated at 42°C for 3 hours to overnight.
E. To hydrolyze RNA, 10 µl of 1 M NaOH and 10 µl of 0.5 M EDTA were added and
incubated at 65°C for 15 minutes.
F. 10 µl of 1M HCl was added to neutralize pH.
2.3.4.3. Reaction Purification I: Removal of unincorporated aminoallyl-dUTP (aa-
dUTP) and freeamines
This purification protocol was modified from the Qiagen QIAquick PCR purification kit
protocol. The phosphate wash and elution buffers (see II 1.4.) were substituted for the Qiagen
supplied buffers because the Qiagen buffers contain free amines which compete with the Cy
dye coupling reaction.
Materials and Methods
35
A. aa-dUTP modified cDNA was mixed with 300 µl (5X reaction volume) buffer PB (Qiagen
supplied) and transfer to QIAquick column.
B. The column was placed in a 2 ml collection tube (Qiagen supplied) and centrifuged at
~13,000 rpm for 1 minute. Collection tube was emptied.
C. 750 µl phosphate wash buffer were added to the column and centrifuged at ~13,000 rpm
for 1 minute.
D. The collection tube was emptied and step (C) was repeated once.
E. The collection tube was emptied and the column was centrifuged for an additional 1
minute at maximum speed.
F. The column was transferred to a new 1.5 ml microfuge tube and 30 µl phosphate elution
buffer (see II 1.4.) were carefully added to the center of the column membrane.
G. Incubated for 1 minute at room temperature.
H. The cDNA was eluted by centrifugation at ~13,000 rpm for 1 minute.
I. The cDNA was eluted for a second time by repeating steps (F).
J. The final elution volume should be ~60 µl.
K. The sample was dried in a speed vac.
2.3.4.4. Coupling aminoallyl-labeled cDNA to Cyanine dye ester
NHS-ester Cyanine 3 dye (Cy3) and NHS-ester Cyanine dye Cyanine 5 (Cy5) are provided as
a dried product in 5 tubes. A tube of dye ester was resuspended in 73 µl of DMSO before use.
The reaction tubes was wrapped with foil and kept covered as much as possible in order to
prevent photo bleaching of the dyes. Dye esters were either used immediately or aliquoted and
stored at -80°C. Any introduced water to the dye esters will result in a lower coupling
efficiency due to the hydrolysis of the dye esters. Since DMSO is hygroscopic (absorbs water
from the atmosphere), it is well sealed in desiccant.
Aminoallyl-labeled cDNA was resuspended in 4.5 µl of 0.1 M sodium carbonate buffer
(Na2CO3), pH 9.0 (Carbonate buffer changes composition over time, it was made fresh every
couple of weeks to a month), and then added 4.5 µl of the NHS-ester Cy dye. To prevent
photo bleaching of the Cy dyes, all reaction tubes were wrapped in foil and kept sequestered
from light as much as possible. The reaction was incubated for 1 hour in dark at room
temperature and mixed by vortex briefly every 10 min.
Materials and Methods
36
2.3.4.5. Reaction purification II: removal of uncoupled dye
The uncoupled dye was removed by using Qiagen QIAquick PCR purification kit. This
protocol is modified from the Qiagen QIAquick Spin Handbook (04/2000, pg. 18).
A. 35 µl 100 mM NaOAc (pH 5.2) were mixed with the dye labeled cDNA and transferred to
a QIAquick spin column.
B. 250 µl PB buffer were added to the column.
C. The column was placed in a 2 ml collection tube and centrifuged at ~13,000 for 1 minute.
The collection tube was emptied.
D. To wash, 0.75 ml buffer PE were added to the column and centrifuged at ~13,000 for 1
minute.
E. The column was placed in a clean 1.5 ml microfuge tube. 30 µl Buffer EB were added to
the center of the column membrane.
F. Incubated for 1 minute at room temperature.
G. The cDNA was eluted by centrifugation at ~13,000 rpm for 1 minute.
H. The cDNA was eluted for a second time by repeating steps (E).
I. The final elution volume should be ~60 µl.
J. The sample was dried in a speed vacuum.
2.3.5. Pre-hybridization
The goal in any hybridization is to obtain high specificity while minimizing background.
Aldehyde slides bind DNA with high efficiency. Non-specific binding is prone to happen,
albeit, the free aldehyde groups on the slide have been inactivated chemically prior to
hybridization. Non-specific binding to slide would not only deplete cDNA, but enhance
background. Pre-hybridization in a solution containing 1% bovine serum albumin can
effectively eliminate nonspecific binding of the probe to the slide. Pre-hybridization has the
additional advantage of washing unbound DNA from the slide prior to the addition of the
probe. Any DNA that washes from the surface during hybridization competes with DNA
bound to the slide. As the kinetics of solution hybridization is much more favorable than
surface hybridization, this can dramatically decrease the measured fluorescence signal from
the microarray.
Materials and Methods
37
The slides were immersed into the pre-hybridization buffer (see II 1.4.) at 42°C for 45 min,
and then washed with water thoroughly, and then air-dried. Slides were used immediately
following pre-hybridization. It was found that hybridization efficiency decreases rapidly if the
slides were allowed to dry for more than one hour (Hegde et al., 2000).
2.3.6. Hybridization
The purified aa-dUTP labeled cDNA pair (control and treatment) were combined together and
dried by speed vacuum, and then resuspended with 100 µl hybridization buffer. Double-
stranded probe was denatured by heating for 2 min at 95°C, and then transferred to ice. The
supernatant was pipetted on the pre-hybridized slide. After covered with a slide cover, the
slide was incubated in HybChamberTM with shaking overnight at 42°C.
2.3.7. Post-washing and scanning
The slide was carefully removed from the chamber and quickly placed in the staining dish,
which contains 2×SSC and 0.2% SDS washing buffer. The cover slip was gently removed
while the slide was in solution. The slide was transferred into 50 ml Falcon tube, which
contained 2×SSC and 0.1% SDS washing buffer, and agitated vigorously for 10 min. The
slide was washed in 1×SSC washing buffer with 0.1% SDS and finally at high-stringency in
0.1×SSC washing buffer with 0.1% SDS for 5min each. After a brief washing in ddH2O, the
arrays were dried by spinning for 2min at 400×g at room temperature and scanned using an
AXON GenePix 4000 scanner that operating lasers at 633nm and 543nm to excite Cy5 and
Cy3, respectively. Separate images were acquired for each fluorophore at a resolution of 10
µm per pixel.
2.3.8. Data collection and analysis
Data from each fluorescence channel were collected and stored as a separate 16-bit TIFF
image. These images were analyzed to calculate the relative expression levels of each gene
and to identify differentially expressed genes by using the GenePix Pro4.0 software. The
analysis process could be divided into four steps.
First, the spots representing the arrayed genes must be identified and distinguished from
spurious signals that can arise due to precipitated probe or other hybridization artifacts or
Materials and Methods
38
contaminants such as dust on the surface of the slide. This task is simplified to a certain extent
because the robotic arraying systems used to construct the arrays produce a regular
arrangement of the spotted DNA fragments.
The second step is the estimation of background. For microarrays, it is important the
background be calculated locally for each spot, rather than globally for the entire image as
uneven background can often arise during the hybridization process.
Third, following spot identification and local background determination, the background-
subtracted hybridization intensities for each spot must be calculated. There are currently two
schools of thought regarding the calculation of intensities - the use of the median or the mean
intensity for each spot. As array analysis generally uses ratios of measured Cy3 to Cy5
intensities to identify differentially expressed genes, the mean intensity is easily fluctuated
due to precipitated probe. Therefore, I think that the median intensity reflects the integrated
intensities more objectively.
Fourth, following image processing, the data generated for the arrayed genes must be further
analyzed before differentially expressed genes can be identified. The first step in this process
is the normalization of the relative fluorescence intensities in each of the two scanned
channels. Normalization is necessary to adjust for differences in labeling and detection
efficiencies for the fluorescent labels and for differences in the quantity of starting RNA from
the two samples examined in the assay. These problems can cause a shift in the average ratio
of Cy5 to Cy3 and the intensities must be rescaled before an experiment can be properly
analyzed. Further details can be found in results.
2.4. Northern blotting
DNA Microarray technology allows quickly analysis the differential expression of a good
many of gene at one time. It has been extensively used in many research fields and proved to
be an efficient tool. But we don’t know how confident it is, so that the results from array must
be verified by a reliable method. Northern blotting is a classical detection method for gene
expression and is thought to be more dependable.
RNA for northern blotting is isolated as described in section II 2.3.3.1. The
gelelectrophoresis, blotting, relabeled probes preparation, hybridization and detection were
carried out using following protocols:
Materials and Methods
39
2.4.1 Agarose/formaldehyde gelelectrophoresis
A. Prepare gel
All vessels for northern blot were sprayed by Sigma RNaseZAP before using. 1.8 g agarose
were dissolved in 130 ml water by heating with microwave oven and cooled to 60°C in a
water bath. The flask was placed in ventilated case and added 15 ml of 10×MOPS buffer and
5 ml formaldehyde and well mixed by gentle shaking. Then the gel was poured and allowed to
set. After solidification, the comb was removed and the gel was placed in the gel tank with
sufficient 1×MOPS running buffer to cover the gel over ~ 1mm.
B. Prepare sample
The RNA sample (10µg) was adjusted to 10 µl with water, added 6 µl RNA denaturation mix
(0.8 volume probe buffer), mixed by vortex, incubated 10 min at 65°C, and then cooled on ice
for 2 min and microcentrifuged briefly to collect liquid.
C. Run gel
The RNA sample was loaded in gel and run in 1×MOPS running buffer at 100 volt for
120min.
2.4.2 Transfer of RNA from gel to membrane
A. The glass dish was filled with enough 20xSSC buffer.
B. Two pieces of Whatman 1MM paper were placed on the glass plate and wetted with
20xSSC buffer.
C. The gel was placed on the filter paper and squeezed out air bubble by rolling a glass pipet.
D. Four strips of plastic were wrapped and placed over the edges of the gel.
E. A piece of nylon membrane (Boehringer, Mannheim) was cut just large enough to cover
the gel and placed on the surface of the gel. Air bubbles under the membrane were
squeezed out.
Materials and Methods
40
F. The surface of the membrane was flooded with 20xSSC. Two sheets of Whatman 3MM
paper with the same size as membrane were placed on top of the membrane.
G. Paper towels were putted on top of the Whatman 3MM paper to a height of ~15 cm, added
a weight to hold everything in place, and then left overnight.
H. Preparation of membrane for hybridization: Paper towels and filter papers were removed.
The membrane was recovered and flattened. The position of the wells on the membrane
was marked in pencil to ensure that the up-down and back-front orientations were
recognizable. Membrane was placed RNA-side-up in a in the UV-Stratalinker 2400
(Stratagene) to ultraviolet irradiation using Auto-Crosslinking-Program.
I. The membrane was baked in incubator at 70°C for 1h.
2.4.3. Preparation of DIG-labeling DNA probe
DIG-labeling DNA probes were synthesized by PCR using DIG probe synthesis kit. The kit
contains all reagents required for the direct digoxigenin (DIG)-labeling of DNA fragments
generated by PCR. The PCR amplification parameters (cycling conditions, template
concentration, primer sequence and primer concentration) for each template and primer set in
absence of DIG-dUTP were optimized before attempting incorporation of DIG. According to
the length of the probe being labeled the concentration of DIG-dUTP has to be adapted: (1) <
1kb, use a 1:3 ratio of DIG-dUTP: dTTP (2) > 1kb, use a 1:6 ratio of DIG-dUTP: dTTP (3) >
3 kb, use a 1:6 ratio of DIG-dUTP: dTTP and substitute the expand long template enzyme mix
for the expand High Fidelity enzyme mix included in the kit. The unlabeled positive control is
always including in every experiment. It is required for evaluating probe-labeling efficiency.
To check the success of the reaction, a portion of 5 µl of each reaction were electrophoresed
on ethidum bromide (EtBr) containing gel. The presence of DIG in DNA make it run slower
in the gel than unlabeled DNA, so the labeled probe should migrate slower the unlabeled
control probe. The EtBr staining of the labeled DNA will be somewhat less than the unlabeled
control DNA, because the polymerase is slowed by the presence of the DIG hapten.
Materials and Methods
41
2.4.4. Hybridization
A. Pre-hybridization
The membrane was placed RNA-side-up in a hybridization bag (Life Technologie). 10 ml
Roche hybridization solution was added, and the bag was placed in the hybridization water
bath and incubated by shaking at least 1 hr at 50°C.
B. Hybridization
Double-stranded probe was denatured by heating in PCR machine for 2 min at 95°C, and then
transferred to ice. The desired volume of probe (usually 3 µl for 10 ml hybridization solution)
was diluted in 1 ml hybridization buffer and pipetted into the hybridization bag, and then the
incubation continued overnight at 50°C.
2.4.5. Washing, blocking and detection
The washing, blocking and detection buffers for the immunological detection of DIG-labeled
probes are provided from DIG Wash and Block buffer set. Before beginning, the stock
solutions were diluted into appropriate concentration.
A. The membrane was washed twice in a plastic container with 2× SSC buffer + 0.1% SDS
for 5 minutes at room temperature.
B. The membrane was washed twice in 0.1× SSC buffer + 0.1% SDS for 15 minutes with
stirring at 50°C.
C. The membrane was washed once with 100 ml Roche washing buffer for 2 min at room
temperature.
D. The membrane was incubated in 50 ml Roche blocking solution (1×Maleic acid buffer and
1× Blocking solution) for 30 min at room temperature.
E. The membrane was incubated in 50 ml Roche blocking solution with 0.01% (v/v) DIG-
antibody for 30 min at room temperature.
F. The membrane was washed twice with 100 ml Roche washing buffer for 15 min.
G. The membrane was equilibrated in 10 ml Roche detection buffer for 2-5 min.
Materials and Methods
42
H. The membrane was placed (with RNA side facing up) on a development folder (or
hybridization bag) and applied approx. 4 drops of CSPD solution. The membrane was
immediately covered with the second sheet of the folder to spread the substrate evenly and
without air bubbles over the membrane, and then incubated for 10 min at 37°C.
I. The edges of the development folder were sealed around the damp membrane. The
membrane was exposed to Roche Lumi-film for 10-60 min at 15-25° C and then
developed.
2.4.6. Designing specific primers for AOX genes and 12-oxo-phytodienoic acid reductase
(OPR3)
To distinguish between the four AOX genes in Arabidopsis, specific probes covering a region
upstream the initiation codon and a region within the first exon of each gene were generated
as described by Saisho (Saisho et al., 1997). The specific primer for OPR3 was designed
within an exon region. For PCR-based probe synthesis, the following oligonucleotides were
used:
AOX1a-fwd: CGTGTGAAGCGTATAAAGACGACAA,
AOX1a-rev: TCCTCCTTCATCGGAGTTTTCTC;
AOX1b-fwd: ATCCTAGAGTTCCGTAATTGCTA,
AOX1b-rev: TCTTCTCAAATGTCATCTTGCTG;
AOX1c-fwd: GAAGGCCTAATGAGCTAGTTGGA,
AOX1c-rev: CTTGCTGAAATCTCTCAGACCTC;
AOX2-fwd: AAGTCCGTATGAGATAACGGCAC,
AOX2-rev: CATCTTTGCTGTCTCTATTCCC.
OPR3-fwd: AAAACAGGTGGCGAGTTTTG;
OPR3-rev: CTCATCACTCCCTTGCCTTC.
2.5. Cellular respiration
Arabidopsis suspension cells were pretreated with 0.5 mM NOR3. At the different time
points, cyanide-sensitive and cyanide-resistant (SHAM-sensitive) respirations were
determined as oxygen uptake using an oxygen electrode. Suspension cells were placed in a
Clark-type oxygen electrode cuvette at a density of 15-20 mg fresh weight ml -1 in culture
medium at 25°C. Inhibitors of cytochrome oxidase (1 mM KCN) and AOX (10 mM
Materials and Methods
43
salicylhydroxamic acid [SHAM]) were then added. Steady rates of respiratory O2 uptake were
determined after about 3 min.
2.6. Cell death assay
Cell death, measured as the loss of plasma membrane integrity, was detected by staining
harvested suspension cells with Evans blue solution (0.025% [w/v] Evans blue in 0.1 mM
CaCl2, pH 5.6) for 10 min. Then stained cells were washed three times with 0.1 mM CaCl2
(pH 5.6), and counted under a microscope. Counting was done for 4 independent experiments.
A similar experiment to study cell as described for suspension cells was carried out in
Arabidopsis plants. Because plants could absorb SHAM through roots and showed AOX
inhibiting activity (Chivasa and Carr, 1998), 5 week old Arabidopsis plants were applied with
AOX inhibitors (SHAM, 10 mM) through roots for 1 day, and then treated with 1250ppm
gaseous NO for 10min. Pictures were taken 4 hours after NO treatment to indicate the cell
death.
2.7. Determination of SA, ethylene and JA
Determination of SA and ethylene were done in work group headed by PD Dr. Christian
Langebartels in BIOP. Extraction and quantization of free SA were performed by Wolfgang
Mayr basically according to described by Meuwly (Meuwly and Metraux, 1993). SA was
detected by using a Shimazu RF 535 fluorescence detector at excitation and emission
wavelengths of 305 and 407 nm, respectively.
Ethylene accumulation and accumulation of free 1-aminocyclopropane-1-carboxylate (ACC)
were measured by Rosina Ludwig with the use of a Perkin-Elmer Autosystem XL gas
chromatograph equipped with a Porapak Q column (Supelco) and a flame ionization detector
as described (Tuomainen et al., 1997).
Extraction and determination of JA was carried out by the Team of Dr. M. J. Mueller in
University of Wuerzburg as described (Mueller et al., 1993).
2.8. NO detected by fluorescent microscopes
To analyze NO production by fluorescence microscopy, epidermal sections from the abaxial
surface of leaves were peeled with a forceps and placed on a slide containing 30 µl of loading
Materials and Methods
44
buffer (10 mM Tris/KCl, pH 7.2) with DAF-2 DA at a final concentration of 10 µM (added
from a 10 mM stock in DMSO). For cPTIO treatment, the epidermis pieces were rinsed in
100µM cPTIO for 1 min, before transferred to the slide containing DAF-2-DA. After
overlaying the glass cover, the slides were placed under the microscope(s) and the images
were taken within 10 min. For confocal laser scanning microscopy a Zeiss Axiovert 100M
inverted microscope equipped with a confocal laser scanner was used in this study and
sections were excited with the 488 line of an argon laser. Dye emissions were recorded using
a 505-530 nm band pass filter, autofluorescence of chloroplasts was captured with a 585 nm
long pass filter. Microscope, laser and photomultiplier settings were held constant during the
course of an experiment in order to obtain comparable data. Images were processed and
analyzed using the Zeiss LSM 510 software
Conventional fluorescence pictures were taken with a Zeiss Axioskop equipped with a
standard FITC emission filter.
2.9. NO detection by electron paramagnetic resonance (EPR)
The rosette leaves were cut after treatment and frozen in liquid nitrogen at once. About 0.6g
frozen leaves were crushed with a mortar and pestle under liquid nitrogen and incubated in a
1.2 ml buffered solution (50 mM N-2-hydroxyethyl-piper-az-ine-N’-2-ethane-sulphonate
[HEPES]; 1 mM DTT and 1 mM MgCl2, pH7.6) for 2 min . The mixture was centrifuged at
13,200g for 2min. The supernatant was added 300 µl of fresh made [Fe(II)(DETC)2 ] solution
(2M Na2S2O4, 3.3 mM DETC, 3.3 mM FeSO4 and 33 mg/ ml BSA) (Tsuchiya et al., 1996),
incubated for 2 min at room temperature and frozen again in liquid nitrogen. ESR
measurements were performed on a Brucker ESP300 X-band spectrometer under following
conditions: room temperature; microwave power 20mW; modulation amplitude 3G; scan rate
~2.5G/S; time constant, 164 msec.
Results
45
III. Results
Currently, little is known about NO-responsive genes in Arabidopsis. To study the NO
dependent gene induction, transcriptional analysis was carried out in Arabidopsis suspension
cells by using a cDNA microarray that included about 330 defense-related genes encoding
PR-proteins or proteins induced by oxidative stress, cold, UV, ozone, or heavy metals.
Basically, the analytical methods are similar to published ones (Reymond et al., 2000; Wang
et al., 2000).
1. Preparation of the cDNA used for spotting
The cDNAs for microarray, which represent 330 stress genes (gene function, gene locus
number and EST accession number see Supplement Table S1), were cloned in E. coli and
cultivated in four different 96-well plates (signated with P0, D7, P1, and P2). The cDNA used
for spotting were amplified by PCR using E. coli culture supernatant or isolated plasmid as
template DNA.
200 µl PCR products of each gene are purified by 96 well multiscreen filter plates and
dissolved in 50 µl of ddH2O. 2 µl purified DNA were loaded on 1% agarose gel and
electrophoresed. PCR bands are shown in Figure 5. The aims of electrophoresis are not only
to detect the removing efficiency of unincorporated nucleotides and primers from the reaction
products, but also to verify whether the PCR products from two parallel PCRs are identical.
The success rate for single-band amplification is approximately 94.3% (313 genes); 5.7% of
reactions (19 genes) yielded multiple bands or fail to amplify (notified with red color).
Additional, there are obviously some weak bands on front of electrophoresis, which indicates
that the purification is not completely and the unincorporated nucleotides and primers can not
be fully removed by multiscreen filter plates.
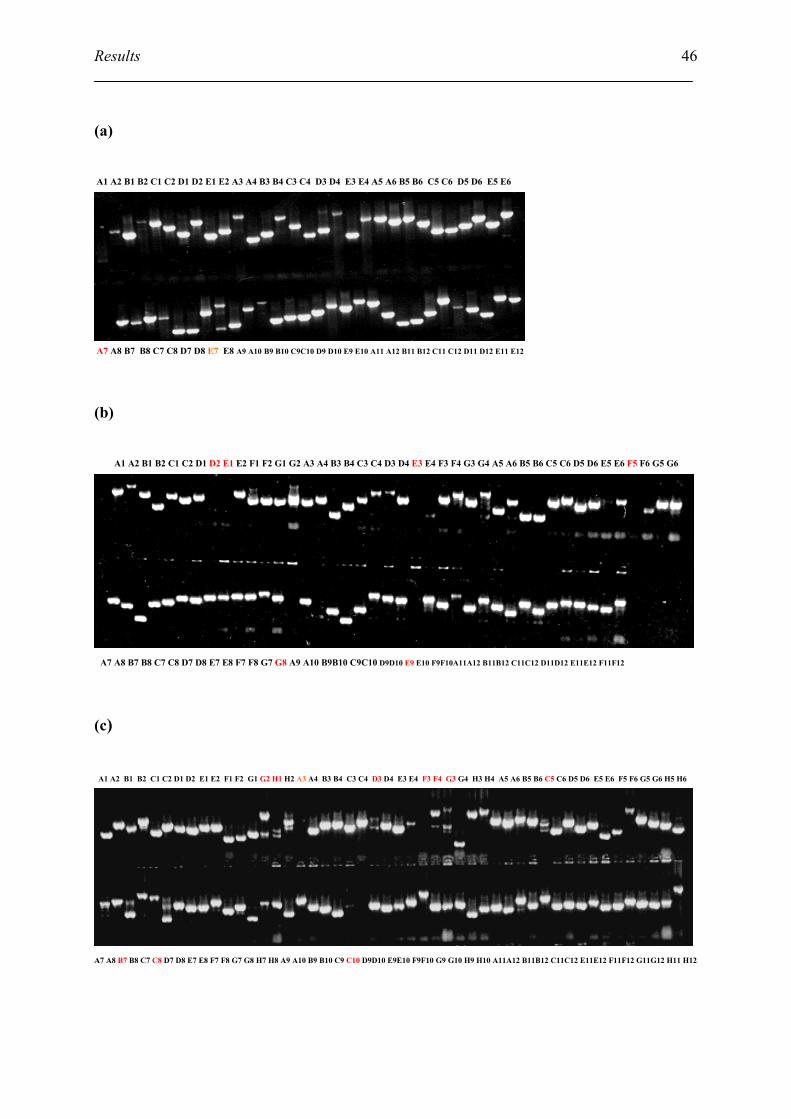
Results
46
(a)
A1 A2 B1 B2 C1 C2 D1 D2 E1 E2 A3 A4 B3 B4 C3 C4 D3 D4 E3 E4 A5 A6 B5 B6 C5 C6 D5 D6 E5 E6
A7 A8 B7 B8 C7 C8 D7 D8 E7 E8 A9 A10 B9 B10 C9C10 D9 D10 E9 E10 A11 A12 B11 B12 C11 C12 D11 D12 E11 E12
(b)
A1 A2 B1 B2 C1 C2 D1 D2 E1 E2 F1 F2 G1 G2 A3 A4 B3 B4 C3 C4 D3 D4 E3 E4 F3 F4 G3 G4 A5 A6 B5 B6 C5 C6 D5 D6 E5 E6 F5 F6 G5 G6
A7 A8 B7 B8 C7 C8 D7 D8 E7 E8 F7 F8 G7 G8 A9 A10 B9B10 C9C10 D9D10 E9 E10 F9F10A11A12 B11B12 C11C12 D11D12 E11E12 F11F12
(c)
A1 A2 B1 B2 C1 C2 D1 D2 E1 E2 F1 F2 G1 G2 H1 H2 A3 A4 B3 B4 C3 C4 D3 D4 E3 E4 F3 F4 G3 G4 H3 H4 A5 A6 B5 B6 C5 C6 D5 D6 E5 E6 F5 F6 G5 G6 H5 H6
A7 A8 B7 B8 C7 C8 D7 D8 E7 E8 F7 F8 G7 G8 H7 H8 A9 A10 B9 B10 C9 C10 D9D10 E9E10 F9F10 G9 G10 H9 H10 A11A12 B11B12 C11C12 E11E12 F11F12 G11G12 H11 H12
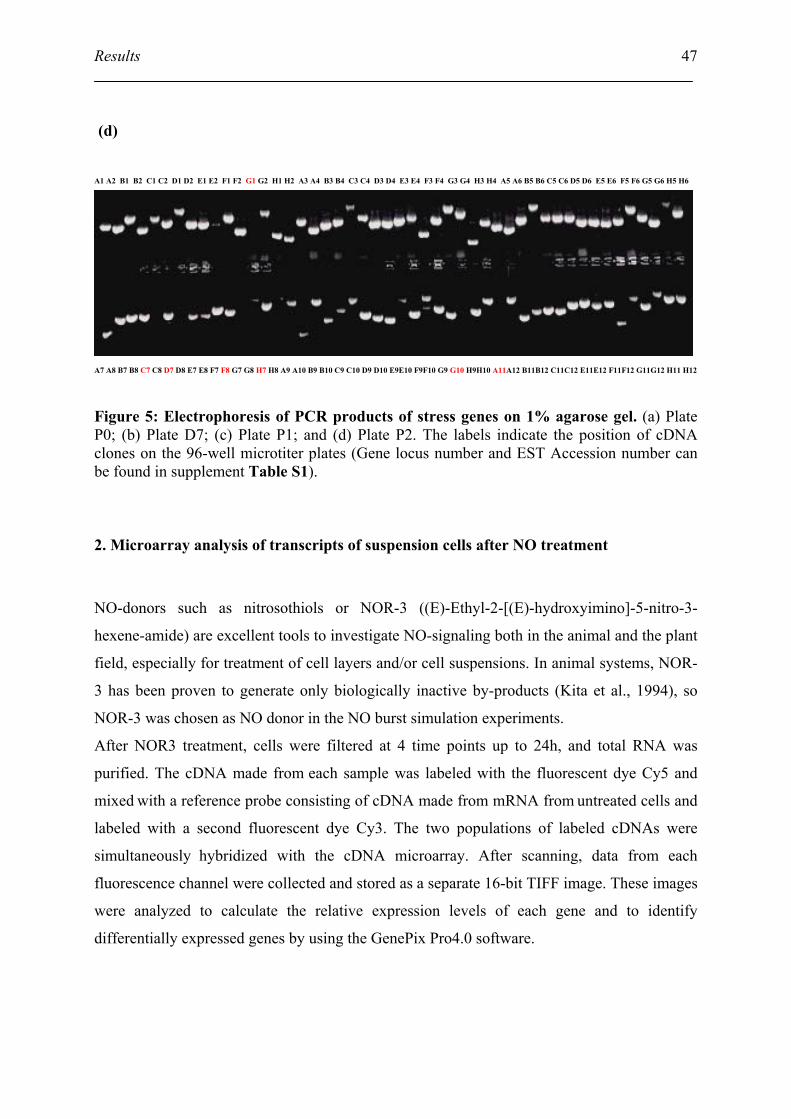
Results
47
(d)
A1 A2 B1 B2 C1 C2 D1 D2 E1 E2 F1 F2 G1 G2 H1 H2 A3 A4 B3 B4 C3 C4 D3 D4 E3 E4 F3 F4 G3 G4 H3 H4 A5 A6 B5 B6 C5 C6 D5 D6 E5 E6 F5 F6 G5 G6 H5 H6
A7 A8 B7 B8 C7 C8 D7 D8 E7 E8 F7 F8 G7 G8 H7 H8 A9 A10 B9 B10 C9 C10 D9 D10 E9E10 F9F10 G9 G10 H9H10 A11A12 B11B12 C11C12 E11E12 F11F12 G11G12 H11 H12
Figure 5: Electrophoresis of PCR products of stress genes on 1% agarose gel. (a) Plate P0; (b) Plate D7; (c) Plate P1; and (d) Plate P2. The labels indicate the position of cDNA clones on the 96-well microtiter plates (Gene locus number and EST Accession number can be found in supplement Table S1).
2. Microarray analysis of transcripts of suspension cells after NO treatment
NO-donors such as nitrosothiols or NOR-3 ((E)-Ethyl-2-[(E)-hydroxyimino]-5-nitro-3-
hexene-amide) are excellent tools to investigate NO-signaling both in the animal and the plant
field, especially for treatment of cell layers and/or cell suspensions. In animal systems, NOR-
3 has been proven to generate only biologically inactive by-products (Kita et al., 1994), so
NOR-3 was chosen as NO donor in the NO burst simulation experiments.
After NOR3 treatment, cells were filtered at 4 time points up to 24h, and total RNA was
purified. The cDNA made from each sample was labeled with the fluorescent dye Cy5 and
mixed with a reference probe consisting of cDNA made from mRNA from untreated cells and
labeled with a second fluorescent dye Cy3. The two populations of labeled cDNAs were
simultaneously hybridized with the cDNA microarray. After scanning, data from each
fluorescence channel were collected and stored as a separate 16-bit TIFF image. These images
were analyzed to calculate the relative expression levels of each gene and to identify
differentially expressed genes by using the GenePix Pro4.0 software.
Results
48
2.1 Data analysis and normalization
Data analysis was done as described in Section Method 2.3.7. Additionally, I have to
supplement some details to the data normalization. The essential importance of normalization
for microarray has been fully discussed (Chen et al., 2003; Edwards, 2003; Wilson et al.,
2003). The most favorite strategy of normalization is using some subset of the genes such as
housekeeping genes that are thought to be less regulated by the treatment in experiment. The
intensity and average ratio (Cy5/Cy3) of the analyzed genes are adjusted and rescaled based
on the calculation of fluorescent intensity and ratio of control genes. But NO is a multiple
signal molecule, which regulates diverse physiological processes. Moreover, few genes
activated by NO are known. It is difficult to designate the control genes for NO treatment.
Another simple strategy is uses total measured fluorescence intensity. The assumption
underlying this approach is that the total mass of RNA labeled with either Cy3 or Cy5 is
equal. While the intensity for any one spot may be higher in one channel than the other, when
averaged over thousands of spots in the array, these fluctuations should average out.
Consequently, the total integrated intensity across all the spots in the array should be equal for
both channels.
Additionally, care must be taken in handling genes expressed at low levels. Statistical
fluctuation in the measured levels can cause a significant variation in the ratios that are
calculated and inefficiencies in labeling for either of the two dyes can cause these low
intensity genes to disappear from the arrays. Typically, I only use spots in the final analysis
where the intensities in both channels are two standard deviations above background.
Following normalization, data are typically analyzed to identify genes that are differentially
expressed. Most published studies have used a post-normalization cutoff of two-fold up- or
down-regulation to define differential expression (Chen et al., 2002). But I used a stricter
standard: induction or repression of a gene was defined by a minimum 2.5 fold change in its
transcript level. In order to separate genes that are truly differentially expressed from
stochastic changes, I typically carried out three independent microarray assays starting from
independent mRNA isolations and define differential expression based on their consensus.
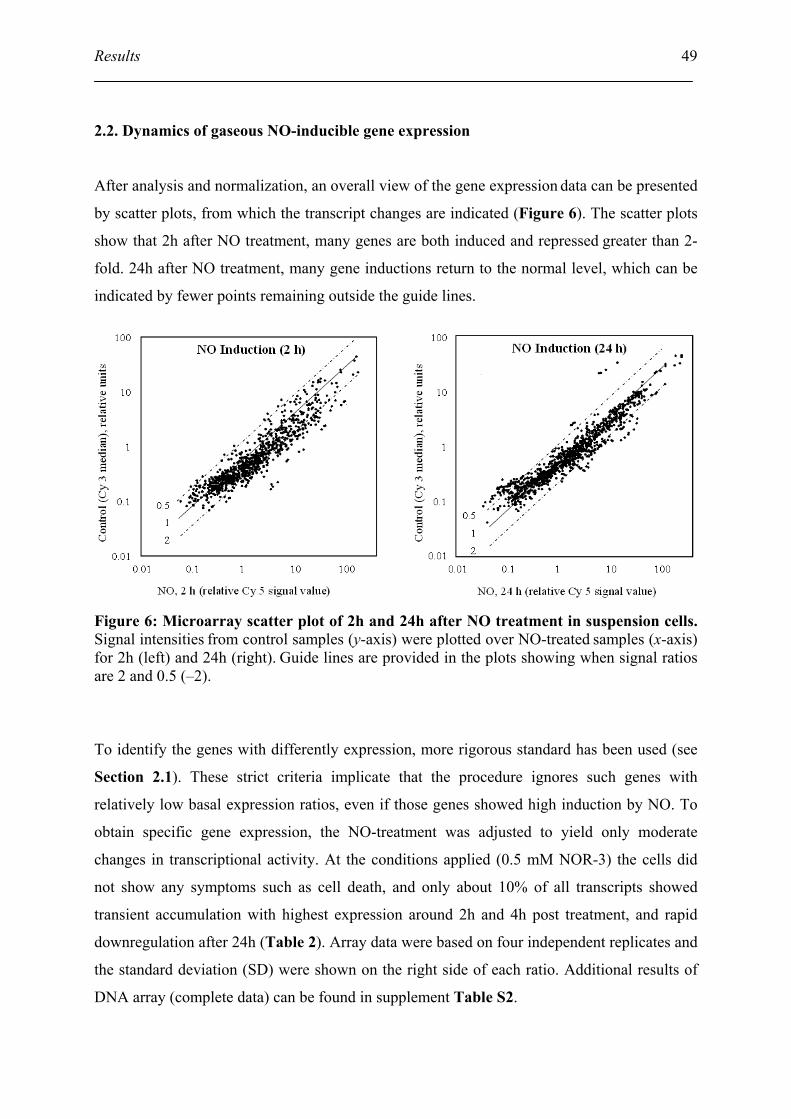
Results
49
2.2. Dynamics of gaseous NO-inducible gene expression
After analysis and normalization, an overall view of the gene expression data can be presented
by scatter plots, from which the transcript changes are indicated (Figure 6). The scatter plots
show that 2h after NO treatment, many genes are both induced and repressed greater than 2-
fold. 24h after NO treatment, many gene inductions return to the normal level, which can be
indicated by fewer points remaining outside the guide lines.
Figure 6: Microarray scatter plot of 2h and 24h after NO treatment in suspension cells. Signal intensities from control samples (y-axis) were plotted over NO-treated samples (x-axis) for 2h (left) and 24h (right). Guide lines are provided in the plots showing when signal ratios
are 2 and 0.5 (–2).
To identify the genes with differently expression, more rigorous standard has been used (see
Section 2.1). These strict criteria implicate that the procedure ignores such genes with
relatively low basal expression ratios, even if those genes showed high induction by NO. To
obtain specific gene expression, the NO-treatment was adjusted to yield only moderate
changes in transcriptional activity. At the conditions applied (0.5 mM NOR-3) the cells did
not show any symptoms such as cell death, and only about 10% of all transcripts showed
transient accumulation with highest expression around 2h and 4h post treatment, and rapid
downregulation after 24h (Table 2). Array data were based on four independent replicates and
the standard deviation (SD) were shown on the right side of each ratio. Additional results of
DNA array (complete data) can be found in supplement Table S2.
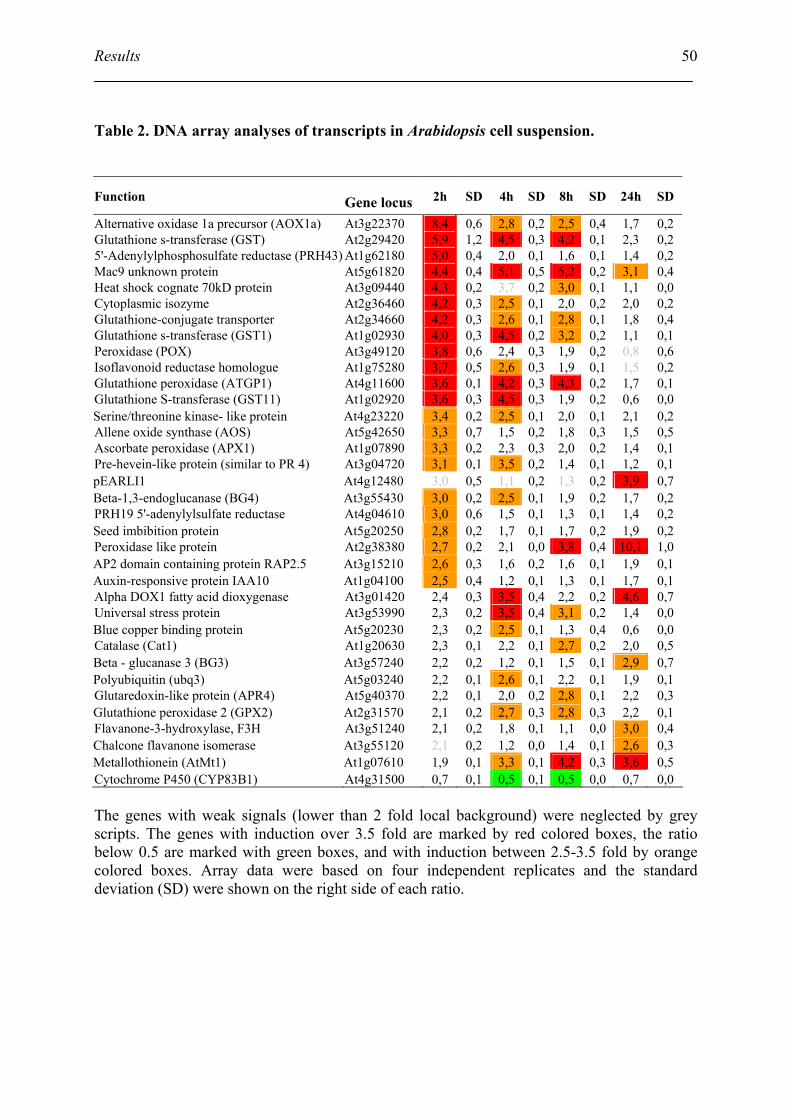
Results
50
Table 2. DNA array analyses of transcripts in Arabidopsis cell suspension.
Function Gene locus 2h SD 4h SD 8h SD 24h SD
Alternative oxidase 1a precursor (AOX1a) At3g22370 8,4 0,6 2,8 0,2 2,5 0,4 1,7 0,2 Glutathione s-transferase (GST) At2g29420 5,9 1,2 4,5 0,3 4,2 0,1 2,3 0,2 5'-Adenylylphosphosulfate reductase (PRH43) At1g62180 5,0 0,4 2,0 0,1 1,6 0,1 1,4 0,2 Mac9 unknown protein At5g61820 4,4 0,4 5,1 0,5 5,2 0,2 3,1 0,4 Heat shock cognate 70kD protein At3g09440 4,3 0,2 3,7 0,2 3,0 0,1 1,1 0,0 Cytoplasmic isozyme At2g36460 4,2 0,3 2,5 0,1 2,0 0,2 2,0 0,2 Glutathione-conjugate transporter At2g34660 4,2 0,3 2,6 0,1 2,8 0,1 1,8 0,4 Glutathione s-transferase (GST1) At1g02930 4,0 0,3 4,5 0,2 3,2 0,2 1,1 0,1 Peroxidase (POX) At3g49120 3,8 0,6 2,4 0,3 1,9 0,2 0,8 0,6 Isoflavonoid reductase homologue At1g75280 3,7 0,5 2,6 0,3 1,9 0,1 1,5 0,2 Glutathione peroxidase (ATGP1) At4g11600 3,6 0,1 4,2 0,3 4,3 0,2 1,7 0,1 Glutathione S-transferase (GST11) At1g02920 3,6 0,3 4,5 0,3 1,9 0,2 0,6 0,0 Serine/threonine kinase- like protein At4g23220 3,4 0,2 2,5 0,1 2,0 0,1 2,1 0,2 Allene oxide synthase (AOS) At5g42650 3,3 0,7 1,5 0,2 1,8 0,3 1,5 0,5 Ascorbate peroxidase (APX1) At1g07890 3,3 0,2 2,3 0,3 2,0 0,2 1,4 0,1 Pre-hevein-like protein (similar to PR 4) At3g04720 3,1 0,1 3,5 0,2 1,4 0,1 1,2 0,1 pEARLI1 At4g12480 3,0 0,5 1,1 0,2 1,3 0,2 3,9 0,7 Beta-1,3-endoglucanase (BG4) At3g55430 3,0 0,2 2,5 0,1 1,9 0,2 1,7 0,2 PRH19 5'-adenylylsulfate reductase At4g04610 3,0 0,6 1,5 0,1 1,3 0,1 1,4 0,2 Seed imbibition protein At5g20250 2,8 0,2 1,7 0,1 1,7 0,2 1,9 0,2 Peroxidase like protein At2g38380 2,7 0,2 2,1 0,0 3,8 0,4 10,1 1,0 AP2 domain containing protein RAP2.5 At3g15210 2,6 0,3 1,6 0,2 1,6 0,1 1,9 0,1 Auxin-responsive protein IAA10 At1g04100 2,5 0,4 1,2 0,1 1,3 0,1 1,7 0,1 Alpha DOX1 fatty acid dioxygenase At3g01420 2,4 0,3 3,5 0,4 2,2 0,2 4,6 0,7 Universal stress protein At3g53990 2,3 0,2 3,5 0,4 3,1 0,2 1,4 0,0 Blue copper binding protein At5g20230 2,3 0,2 2,5 0,1 1,3 0,4 0,6 0,0 Catalase (Cat1) At1g20630 2,3 0,1 2,2 0,1 2,7 0,2 2,0 0,5 Beta - glucanase 3 (BG3) At3g57240 2,2 0,2 1,2 0,1 1,5 0,1 2,9 0,7 Polyubiquitin (ubq3) At5g03240 2,2 0,1 2,6 0,1 2,2 0,1 1,9 0,1 Glutaredoxin-like protein (APR4) At5g40370 2,2 0,1 2,0 0,2 2,8 0,1 2,2 0,3 Glutathione peroxidase 2 (GPX2) At2g31570 2,1 0,2 2,7 0,3 2,8 0,3 2,2 0,1 Flavanone-3-hydroxylase, F3H At3g51240 2,1 0,2 1,8 0,1 1,1 0,0 3,0 0,4 Chalcone flavanone isomerase At3g55120 2,1 0,2 1,2 0,0 1,4 0,1 2,6 0,3 Metallothionein (AtMt1) At1g07610 1,9 0,1 3,3 0,1 4,2 0,3 3,6 0,5 Cytochrome P450 (CYP83B1) At4g31500 0,7 0,1 0,5 0,1 0,5 0,0 0,7 0,0 The genes with weak signals (lower than 2 fold local background) were neglected by grey scripts. The genes with induction over 3.5 fold are marked by red colored boxes, the ratio below 0.5 are marked with green boxes, and with induction between 2.5-3.5 fold by orange colored boxes. Array data were based on four independent replicates and the standard deviation (SD) were shown on the right side of each ratio.
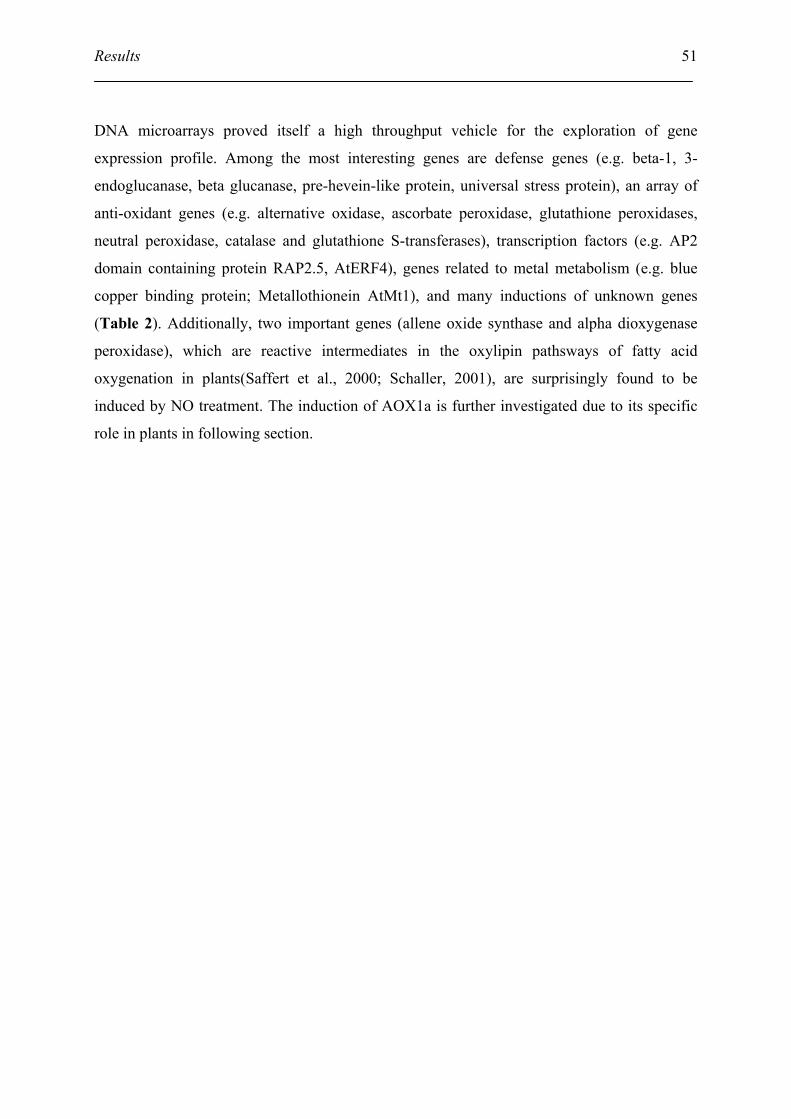
Results
51
DNA microarrays proved itself a high throughput vehicle for the exploration of gene
expression profile. Among the most interesting genes are defense genes (e.g. beta-1, 3-
endoglucanase, beta glucanase, pre-hevein-like protein, universal stress protein), an array of
anti-oxidant genes (e.g. alternative oxidase, ascorbate peroxidase, glutathione peroxidases,
neutral peroxidase, catalase and glutathione S-transferases), transcription factors (e.g. AP2
domain containing protein RAP2.5, AtERF4), genes related to metal metabolism (e.g. blue
copper binding protein; Metallothionein AtMt1), and many inductions of unknown genes
(Table 2). Additionally, two important genes (allene oxide synthase and alpha dioxygenase
peroxidase), which are reactive intermediates in the oxylipin pathsways of fatty acid
oxygenation in plants(Saffert et al., 2000; Schaller, 2001), are surprisingly found to be
induced by NO treatment. The induction of AOX1a is further investigated due to its specific
role in plants in following section.
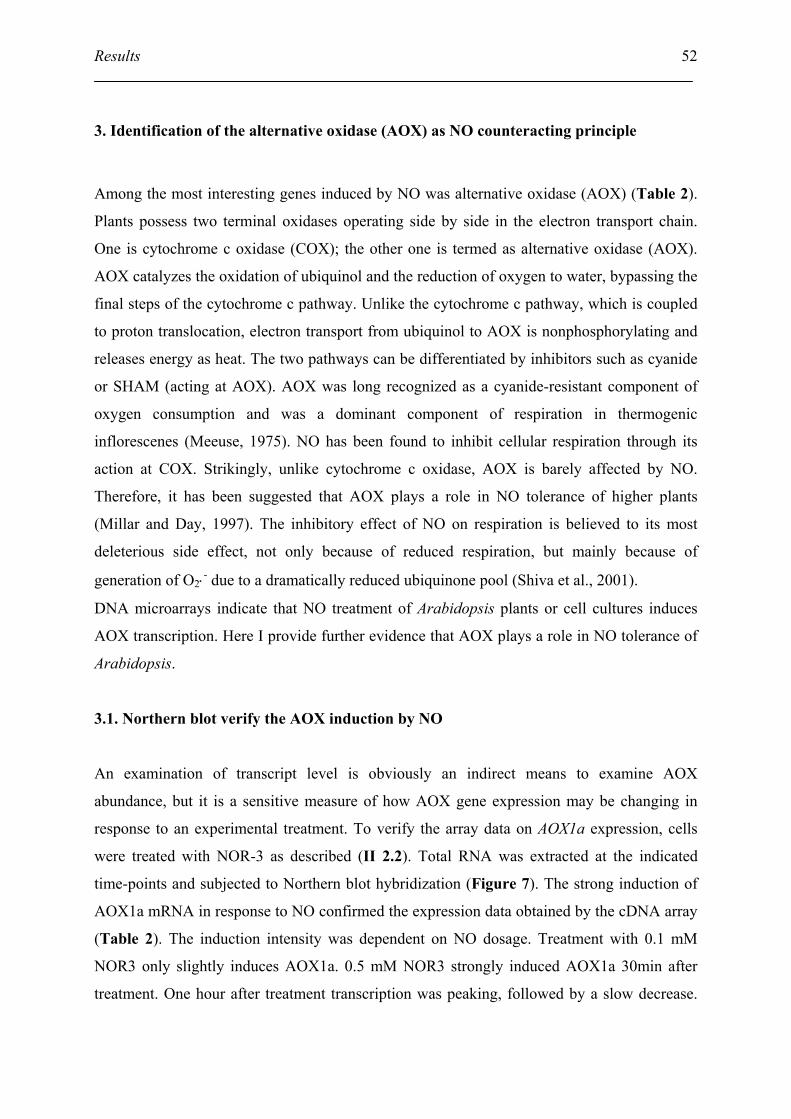
Results
52
3. Identification of the alternative oxidase (AOX) as NO counteracting principle
Among the most interesting genes induced by NO was alternative oxidase (AOX) (Table 2).
Plants possess two terminal oxidases operating side by side in the electron transport chain.
One is cytochrome c oxidase (COX); the other one is termed as alternative oxidase (AOX).
AOX catalyzes the oxidation of ubiquinol and the reduction of oxygen to water, bypassing the
final steps of the cytochrome c pathway. Unlike the cytochrome c pathway, which is coupled
to proton translocation, electron transport from ubiquinol to AOX is nonphosphorylating and
releases energy as heat. The two pathways can be differentiated by inhibitors such as cyanide
or SHAM (acting at AOX). AOX was long recognized as a cyanide-resistant component of
oxygen consumption and was a dominant component of respiration in thermogenic
inflorescenes (Meeuse, 1975). NO has been found to inhibit cellular respiration through its
action at COX. Strikingly, unlike cytochrome c oxidase, AOX is barely affected by NO.
Therefore, it has been suggested that AOX plays a role in NO tolerance of higher plants
(Millar and Day, 1997). The inhibitory effect of NO on respiration is believed to its most
deleterious side effect, not only because of reduced respiration, but mainly because of
generation of O2⋅- due to a dramatically reduced ubiquinone pool (Shiva et al., 2001).
DNA microarrays indicate that NO treatment of Arabidopsis plants or cell cultures induces
AOX transcription. Here I provide further evidence that AOX plays a role in NO tolerance of
Arabidopsis.
3.1. Northern blot verify the AOX induction by NO
An examination of transcript level is obviously an indirect means to examine AOX
abundance, but it is a sensitive measure of how AOX gene expression may be changing in
response to an experimental treatment. To verify the array data on AOX1a expression, cells
were treated with NOR-3 as described (II 2.2). Total RNA was extracted at the indicated
time-points and subjected to Northern blot hybridization (Figure 7). The strong induction of
AOX1a mRNA in response to NO confirmed the expression data obtained by the cDNA array
(Table 2). The induction intensity was dependent on NO dosage. Treatment with 0.1 mM
NOR3 only slightly induces AOX1a. 0.5 mM NOR3 strongly induced AOX1a 30min after
treatment. One hour after treatment transcription was peaking, followed by a slow decrease.
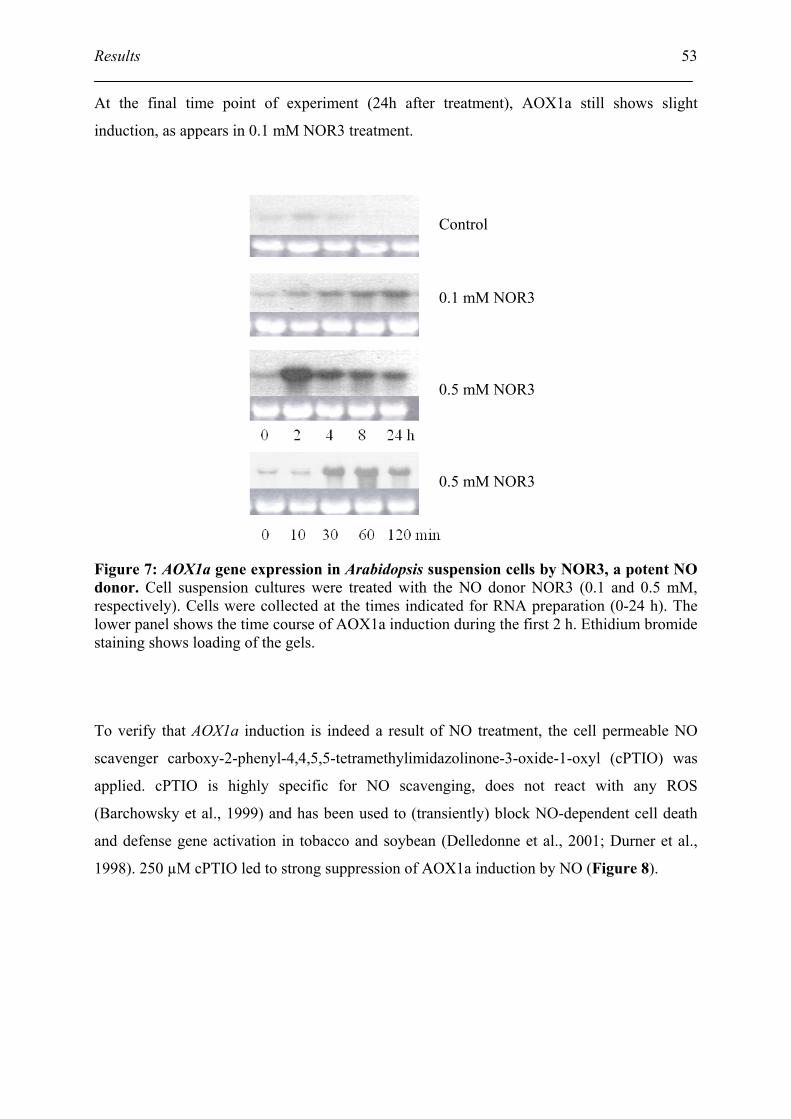
Results
53
At the final time point of experiment (24h after treatment), AOX1a still shows slight
induction, as appears in 0.1 mM NOR3 treatment.
Figure 7: AOX1a gene expression in Arabidopsis suspension cells by NOR3, a potent NO donor. Cell suspension cultures were treated with the NO donor NOR3 (0.1 and 0.5 mM, respectively). Cells were collected at the times indicated for RNA preparation (0-24 h). The lower panel shows the time course of AOX1a induction during the first 2 h. Ethidium bromide staining shows loading of the gels.
To verify that AOX1a induction is indeed a result of NO treatment, the cell permeable NO
scavenger carboxy-2-phenyl-4,4,5,5-tetramethylimidazolinone-3-oxide-1-oxyl (cPTIO) was
applied. cPTIO is highly specific for NO scavenging, does not react with any ROS
(Barchowsky et al., 1999) and has been used to (transiently) block NO-dependent cell death
and defense gene activation in tobacco and soybean (Delledonne et al., 2001; Durner et al.,
1998). 250 µM cPTIO led to strong suppression of AOX1a induction by NO (Figure 8).
Control 0.1 mM NOR3 0.5 mM NOR3 0.5 mM NOR3
Results
54
Figure 8: cPTIO suppresses NO-induced AOX gene expression in Arabidopsis suspension cells. Cell suspension cultures were treated with NOR-3 (0.5 mM) in presence or in absence of the NO-scavenger cPTIO (0.5 mM). Cells were harvested before addition of the chemicals or at the time-point with highest AOX1a induction (2h). Northern Blots were probed with cDNAs for AOX1a. Shown is the region between 1.8 and 1.0 kb. Ethidium bromide staining shows loading of the gels.
3.2. Identification of other AOX homolog in Arabidopsis
In Arabidopsis, AOX describes a small enzyme family consisting of 4 members. Identities
between the deduced amino acid sequences of the four AOX proteins are: AOX1a/AOX1b,
77%; AOX1a/AOX1c, 73%; AOX1a/AOX2, 70%; AOX1b/AOX1c, 81%; AOX1b/AOX2,
68%; AOX1c/AOX2, 67% (Saisho et al., 1997; Tsuji et al., 2000). Since cDNA arrays like
ours are highly sensitive, but also less specific compared with oligonucleotide based arrays,
we monitored transcript accumulation by Northern analysis using highly specific probes.
Saisho et al. showed that the 5’-untranslated regions, which were not highly conserved
amongst the different gene family members, could be used as copy-specific probes for
standard Northern analysis (Saisho et al., 1997). In order to identify the AOX genes in our cell
suspension cells, PCR was performed using gene-specific primers that correspond to the
region upstream of the putative initiation codon and the region downstream of the putative
termination codon of AOX1a, AOX1b, AOX1c and AOX2 (Saisho et al., 1997) (Figure 9). The
probes constructed for Northern hybridization were based on the forward primers used in
Figure 10 (AOX1a-fwd, AOX1b-fwd, AOX1c-fwd, AOX2-fwd) in combination with reverse
primers targeted to the coding regions within the first exon of each AOX gene (Primer
sequences are given in II 2.4.6). These primer sequences have been originally described by
Saisho et al. (Saisho et al., 1997).
C cPTIO NO+ NO
0 2 0 2 0 2 h
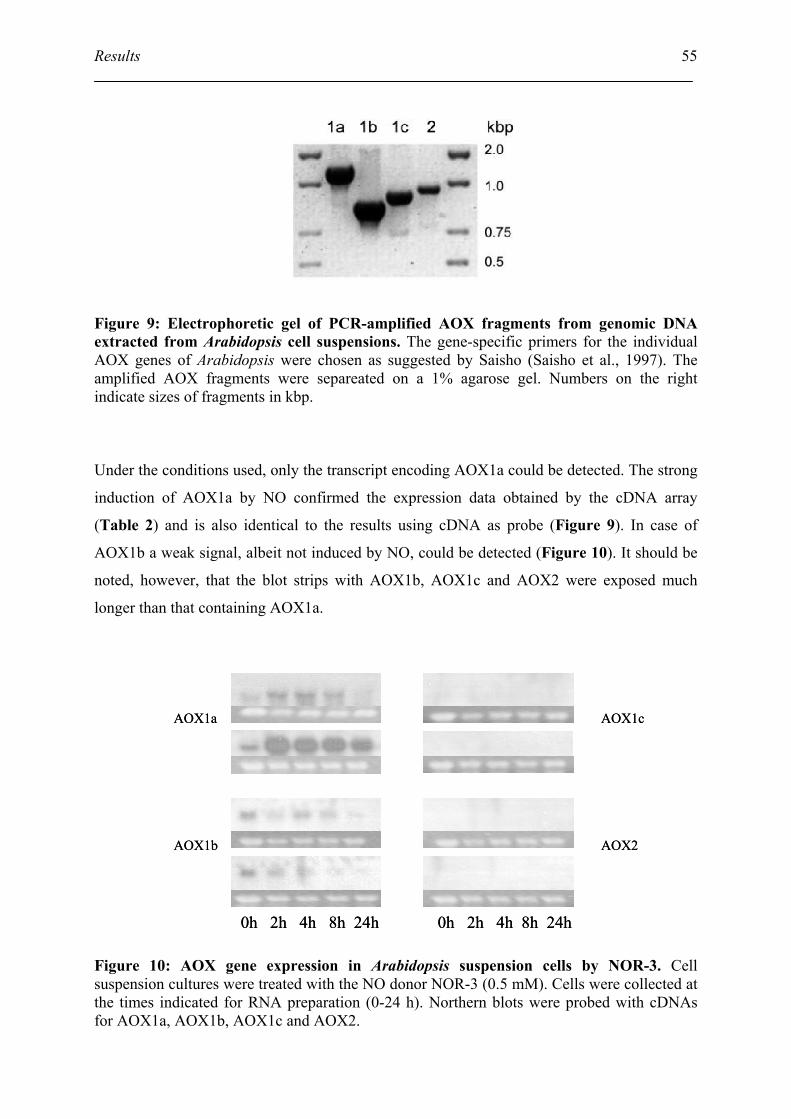
Results
55
Figure 9: Electrophoretic gel of PCR-amplified AOX fragments from genomic DNA extracted from Arabidopsis cell suspensions. The gene-specific primers for the individual AOX genes of Arabidopsis were chosen as suggested by Saisho (Saisho et al., 1997). The amplified AOX fragments were separeated on a 1% agarose gel. Numbers on the right indicate sizes of fragments in kbp.
Under the conditions used, only the transcript encoding AOX1a could be detected. The strong
induction of AOX1a by NO confirmed the expression data obtained by the cDNA array
(Table 2) and is also identical to the results using cDNA as probe (Figure 9). In case of
AOX1b a weak signal, albeit not induced by NO, could be detected (Figure 10). It should be
noted, however, that the blot strips with AOX1b, AOX1c and AOX2 were exposed much
longer than that containing AOX1a.
Figure 10: AOX gene expression in Arabidopsis suspension cells by NOR-3. Cell suspension cultures were treated with the NO donor NOR-3 (0.5 mM). Cells were collected at the times indicated for RNA preparation (0-24 h). Northern blots were probed with cDNAs for AOX1a, AOX1b, AOX1c and AOX2.
0h 2h 4h 8h 24h
AOX1b
0h 2h 4h 8h 24h
AOX2
AOX1cAOX1a
0h 2h 4h 8h 24h
AOX1b
0h 2h 4h 8h 24h
AOX2
AOX1cAOX1a
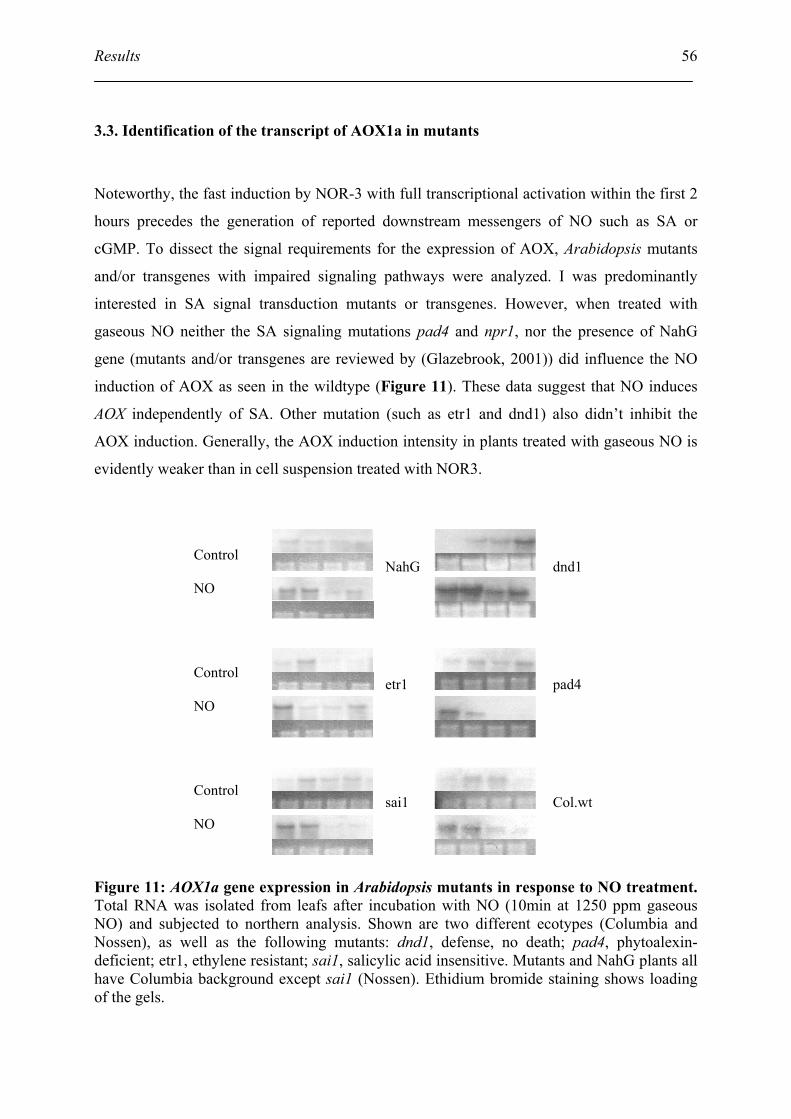
Results
56
3.3. Identification of the transcript of AOX1a in mutants
Noteworthy, the fast induction by NOR-3 with full transcriptional activation within the first 2
hours precedes the generation of reported downstream messengers of NO such as SA or
cGMP. To dissect the signal requirements for the expression of AOX, Arabidopsis mutants
and/or transgenes with impaired signaling pathways were analyzed. I was predominantly
interested in SA signal transduction mutants or transgenes. However, when treated with
gaseous NO neither the SA signaling mutations pad4 and npr1, nor the presence of NahG
gene (mutants and/or transgenes are reviewed by (Glazebrook, 2001)) did influence the NO
induction of AOX as seen in the wildtype (Figure 11). These data suggest that NO induces
AOX independently of SA. Other mutation (such as etr1 and dnd1) also didn’t inhibit the
AOX induction. Generally, the AOX induction intensity in plants treated with gaseous NO is
evidently weaker than in cell suspension treated with NOR3.
Figure 11: AOX1a gene expression in Arabidopsis mutants in response to NO treatment. Total RNA was isolated from leafs after incubation with NO (10min at 1250 ppm gaseous NO) and subjected to northern analysis. Shown are two different ecotypes (Columbia and Nossen), as well as the following mutants: dnd1, defense, no death; pad4, phytoalexin-deficient; etr1, ethylene resistant; sai1, salicylic acid insensitive. Mutants and NahG plants all have Columbia background except sai1 (Nossen). Ethidium bromide staining shows loading of the gels.
etr1
sai1
etr1
sai1
NahG etr1 sai1
dnd1 pad4 Col.wt
Control NO Control NO Control NO
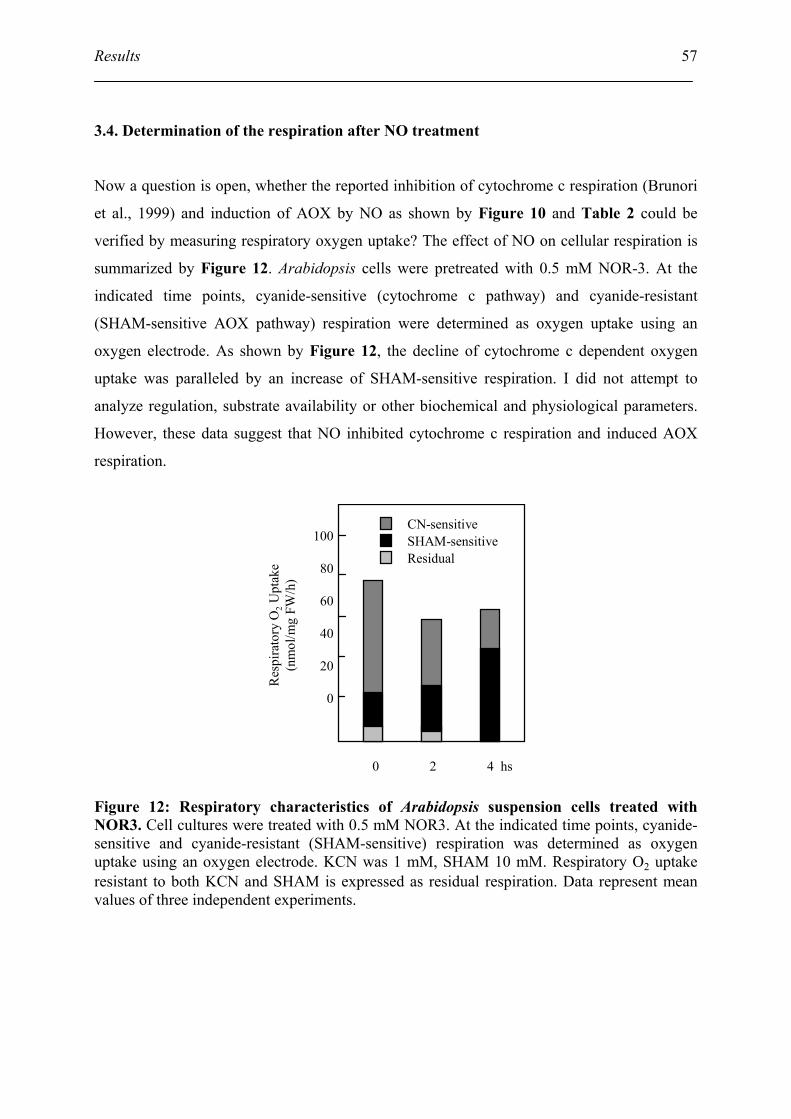
Results
57
3.4. Determination of the respiration after NO treatment
Now a question is open, whether the reported inhibition of cytochrome c respiration (Brunori
et al., 1999) and induction of AOX by NO as shown by Figure 10 and Table 2 could be
verified by measuring respiratory oxygen uptake? The effect of NO on cellular respiration is
summarized by Figure 12. Arabidopsis cells were pretreated with 0.5 mM NOR-3. At the
indicated time points, cyanide-sensitive (cytochrome c pathway) and cyanide-resistant
(SHAM-sensitive AOX pathway) respiration were determined as oxygen uptake using an
oxygen electrode. As shown by Figure 12, the decline of cytochrome c dependent oxygen
uptake was paralleled by an increase of SHAM-sensitive respiration. I did not attempt to
analyze regulation, substrate availability or other biochemical and physiological parameters.
However, these data suggest that NO inhibited cytochrome c respiration and induced AOX
respiration.
Figure 12: Respiratory characteristics of Arabidopsis suspension cells treated with NOR3. Cell cultures were treated with 0.5 mM NOR3. At the indicated time points, cyanide-sensitive and cyanide-resistant (SHAM-sensitive) respiration was determined as oxygen uptake using an oxygen electrode. KCN was 1 mM, SHAM 10 mM. Respiratory O2 uptake resistant to both KCN and SHAM is expressed as residual respiration. Data represent mean values of three independent experiments.
0 2 4 hs
CN-sensitiveSHAM-sensitiveResidual
Res
pira
tory
O2
Upt
ake
(nm
ol/m
g FW
/h)
100
80
60
40
20
0
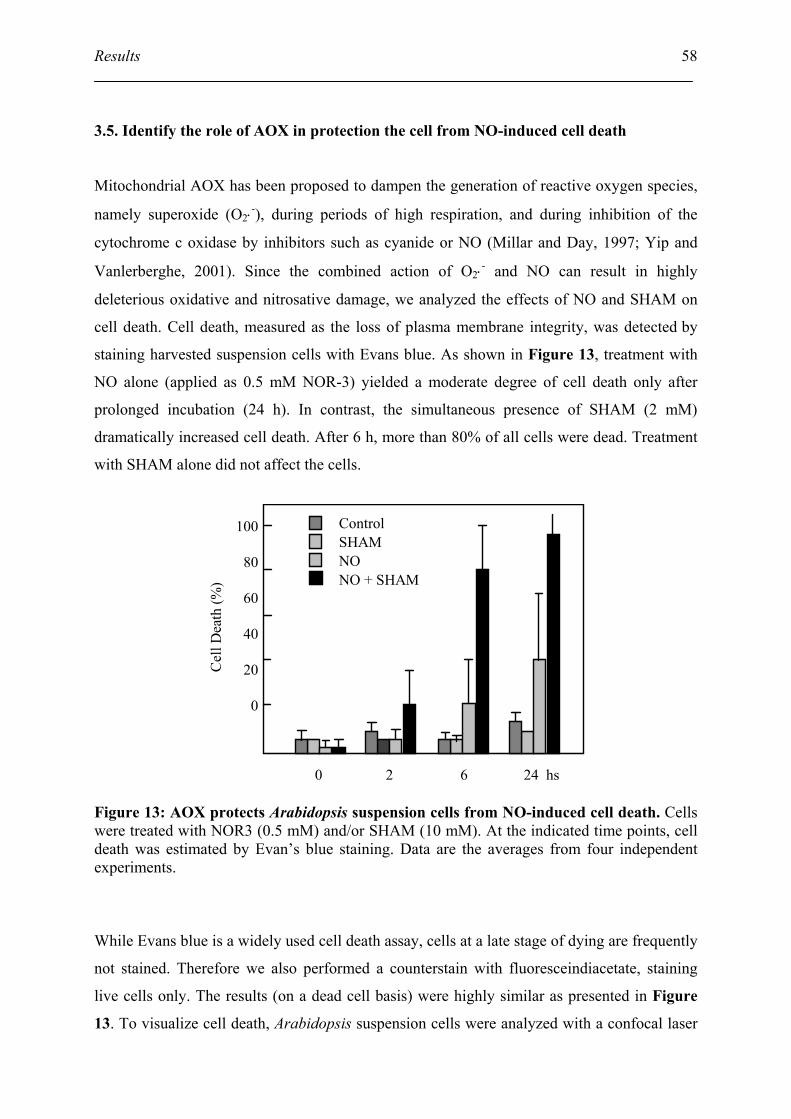
Results
58
3.5. Identify the role of AOX in protection the cell from NO-induced cell death
Mitochondrial AOX has been proposed to dampen the generation of reactive oxygen species,
namely superoxide (O2⋅-), during periods of high respiration, and during inhibition of the
cytochrome c oxidase by inhibitors such as cyanide or NO (Millar and Day, 1997; Yip and
Vanlerberghe, 2001). Since the combined action of O2⋅- and NO can result in highly
deleterious oxidative and nitrosative damage, we analyzed the effects of NO and SHAM on
cell death. Cell death, measured as the loss of plasma membrane integrity, was detected by
staining harvested suspension cells with Evans blue. As shown in Figure 13, treatment with
NO alone (applied as 0.5 mM NOR-3) yielded a moderate degree of cell death only after
prolonged incubation (24 h). In contrast, the simultaneous presence of SHAM (2 mM)
dramatically increased cell death. After 6 h, more than 80% of all cells were dead. Treatment
with SHAM alone did not affect the cells.
Figure 13: AOX protects Arabidopsis suspension cells from NO-induced cell death. Cells were treated with NOR3 (0.5 mM) and/or SHAM (10 mM). At the indicated time points, cell death was estimated by Evan’s blue staining. Data are the averages from four independent experiments.
While Evans blue is a widely used cell death assay, cells at a late stage of dying are frequently
not stained. Therefore we also performed a counterstain with fluoresceindiacetate, staining
live cells only. The results (on a dead cell basis) were highly similar as presented in Figure
13. To visualize cell death, Arabidopsis suspension cells were analyzed with a confocal laser
0 2 6 24 hs
ControlSHAMNONO + SHAM
Cel
l Dea
th (%
)
100
80
60
40
20
0
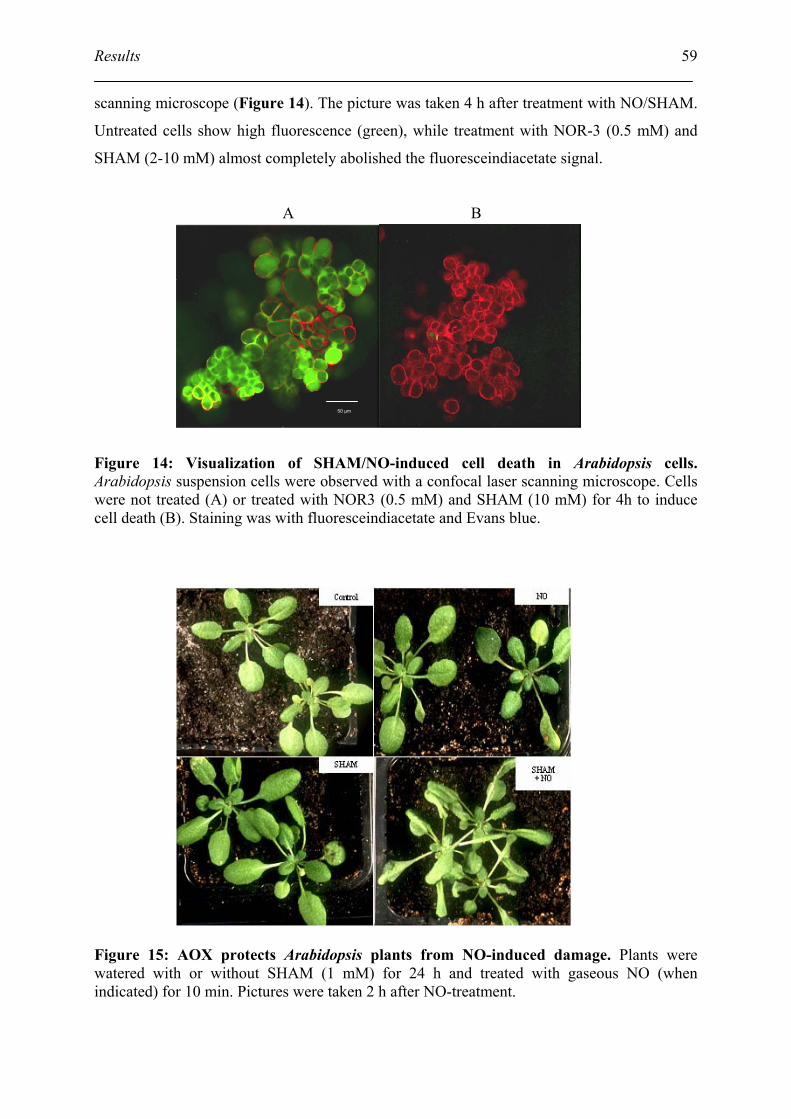
Results
59
scanning microscope (Figure 14). The picture was taken 4 h after treatment with NO/SHAM.
Untreated cells show high fluorescence (green), while treatment with NOR-3 (0.5 mM) and
SHAM (2-10 mM) almost completely abolished the fluoresceindiacetate signal.
A B
Figure 14: Visualization of SHAM/NO-induced cell death in Arabidopsis cells. Arabidopsis suspension cells were observed with a confocal laser scanning microscope. Cells were not treated (A) or treated with NOR3 (0.5 mM) and SHAM (10 mM) for 4h to induce cell death (B). Staining was with fluoresceindiacetate and Evans blue.
Figure 15: AOX protects Arabidopsis plants from NO-induced damage. Plants were watered with or without SHAM (1 mM) for 24 h and treated with gaseous NO (when indicated) for 10 min. Pictures were taken 2 h after NO-treatment.
50 µm50 µm

Results
60
SHAM could be absorbed by plants through the roots and showed its inhibition activity to
AOX (Chivasa and Carr, 1998). We watered the Arabidopsis plants with (or not with ) 1 mM
SHAM solution for 1 day as described by Chivasa and Carr (1998). Control plants, or plants
treated only with NO or SHAM did not show any symptoms or any visible injury even after 2
days. But treatment with NO and SHAM together dramatically induced strong cell death
(Figure15). The pictures were taken 1h after treatment of gaseous NO. Overall, these results
(Figures 13, 14, and 15) suggest that AOX might fulfill an important function for cellular
homeostasis under NO stress.
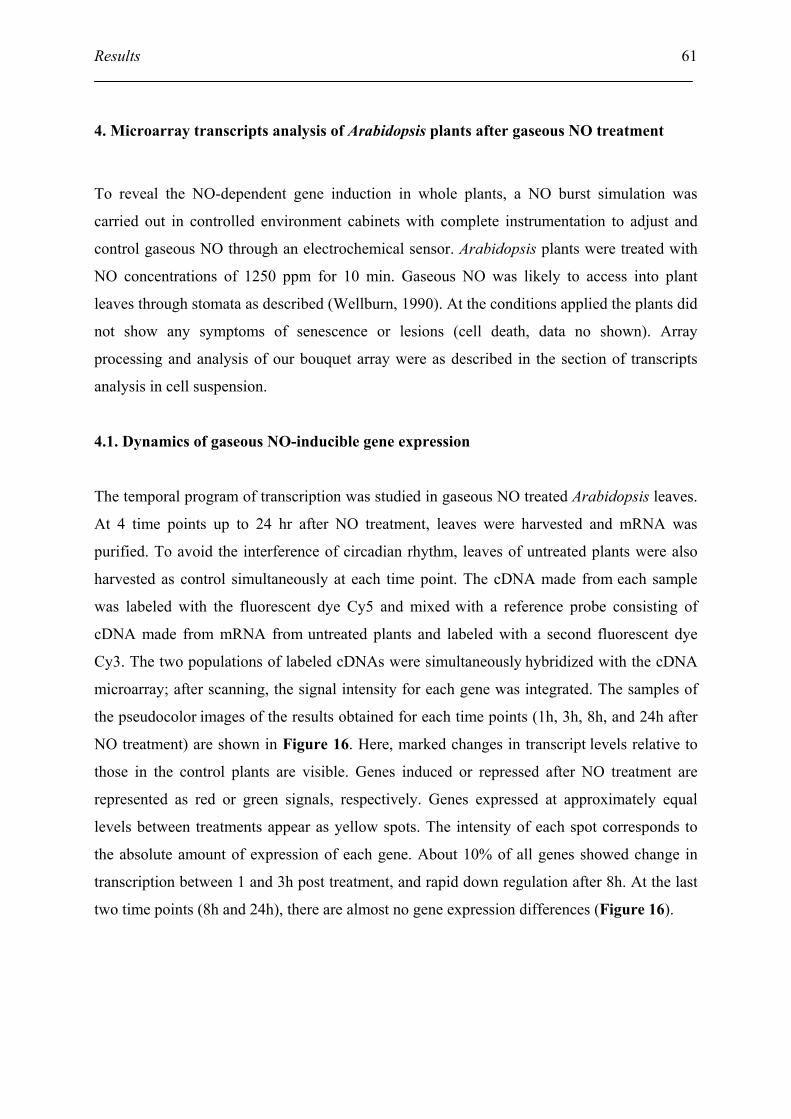
Results
61
4. Microarray transcripts analysis of Arabidopsis plants after gaseous NO treatment
To reveal the NO-dependent gene induction in whole plants, a NO burst simulation was
carried out in controlled environment cabinets with complete instrumentation to adjust and
control gaseous NO through an electrochemical sensor. Arabidopsis plants were treated with
NO concentrations of 1250 ppm for 10 min. Gaseous NO was likely to access into plant
leaves through stomata as described (Wellburn, 1990). At the conditions applied the plants did
not show any symptoms of senescence or lesions (cell death, data no shown). Array
processing and analysis of our bouquet array were as described in the section of transcripts
analysis in cell suspension.
4.1. Dynamics of gaseous NO-inducible gene expression
The temporal program of transcription was studied in gaseous NO treated Arabidopsis leaves.
At 4 time points up to 24 hr after NO treatment, leaves were harvested and mRNA was
purified. To avoid the interference of circadian rhythm, leaves of untreated plants were also
harvested as control simultaneously at each time point. The cDNA made from each sample
was labeled with the fluorescent dye Cy5 and mixed with a reference probe consisting of
cDNA made from mRNA from untreated plants and labeled with a second fluorescent dye
Cy3. The two populations of labeled cDNAs were simultaneously hybridized with the cDNA
microarray; after scanning, the signal intensity for each gene was integrated. The samples of
the pseudocolor images of the results obtained for each time points (1h, 3h, 8h, and 24h after
NO treatment) are shown in Figure 16. Here, marked changes in transcript levels relative to
those in the control plants are visible. Genes induced or repressed after NO treatment are
represented as red or green signals, respectively. Genes expressed at approximately equal
levels between treatments appear as yellow spots. The intensity of each spot corresponds to
the absolute amount of expression of each gene. About 10% of all genes showed change in
transcription between 1 and 3h post treatment, and rapid down regulation after 8h. At the last
two time points (8h and 24h), there are almost no gene expression differences (Figure 16).
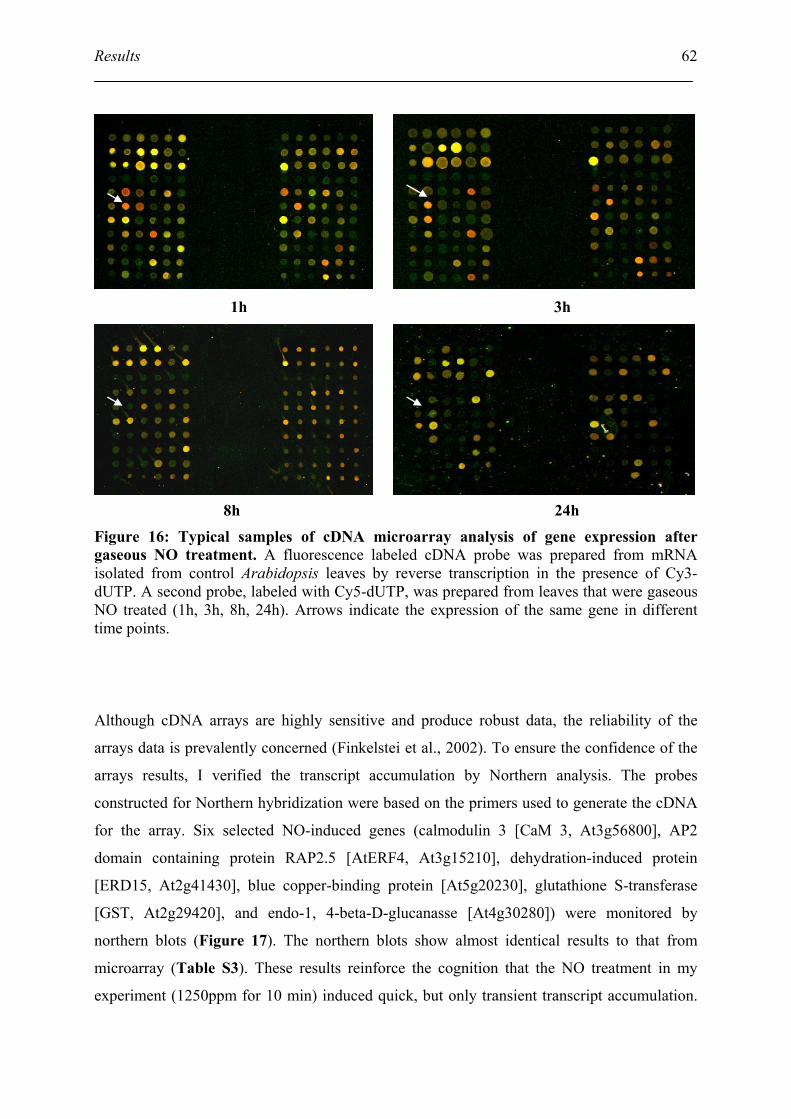
Results
62
Figure 16: Typical samples of cDNA microarray analysis of gene expression after gaseous NO treatment. A fluorescence labeled cDNA probe was prepared from mRNA isolated from control Arabidopsis leaves by reverse transcription in the presence of Cy3-dUTP. A second probe, labeled with Cy5-dUTP, was prepared from leaves that were gaseous NO treated (1h, 3h, 8h, 24h). Arrows indicate the expression of the same gene in different time points.
Although cDNA arrays are highly sensitive and produce robust data, the reliability of the
arrays data is prevalently concerned (Finkelstei et al., 2002). To ensure the confidence of the
arrays results, I verified the transcript accumulation by Northern analysis. The probes
constructed for Northern hybridization were based on the primers used to generate the cDNA
for the array. Six selected NO-induced genes (calmodulin 3 [CaM 3, At3g56800], AP2
domain containing protein RAP2.5 [AtERF4, At3g15210], dehydration-induced protein
[ERD15, At2g41430], blue copper-binding protein [At5g20230], glutathione S-transferase
[GST, At2g29420], and endo-1, 4-beta-D-glucanasse [At4g30280]) were monitored by
northern blots (Figure 17). The northern blots show almost identical results to that from
microarray (Table S3). These results reinforce the cognition that the NO treatment in my
experiment (1250ppm for 10 min) induced quick, but only transient transcript accumulation.
1h 3h
8h 24h
Results
63
In the following section, only results of 1h and 3h after NO treatment are shown, although all
the time points have been analyzed.
Cam3
Col-wt
AtERF4
Col-wt
ERD15
Col-wt
GST
Col-wt
Blue copper-binding protein
Col-wt
Endo-1, 4-beta-D-glucanase
Col-wt
0h 1h 3h 8h 24h 0h 1h 3h 8h 24h 0h 1h 3h 8h 24h
0h 1h 3h 8h 24h 0h 1h 3h 8h 24h 0h 1h 3h 8h 24h
Cam3
Col-wt
AtERF4
Col-wt
ERD15
Col-wt
GST
Col-wt
Blue copper-binding protein
Col-wt
Endo-1, 4-beta-D-glucanase
Col-wt
0h 1h 3h 8h 24h 0h 1h 3h 8h 24h 0h 1h 3h 8h 24h
0h 1h 3h 8h 24h 0h 1h 3h 8h 24h 0h 1h 3h 8h 24h Figure 17: Gene expression in Arabidopsis wt plants after NO treatment. Arabidopsis plants were treated with gaseous NO (1250ppm) for 10 min. Leaves were collected at the times indicated for RNA preparation (0-24 h). Northern blots were probed with cDNAs for calmodulin 3 [CaM 3, At3g56800], AP2 domain containing protein RAP2.5 [AtERF4, At3g15210], dehydration-induced protein [ERD15, At2g41430], blue copper-binding protein [At5g20230], glutathione S-transferase [GST, At2g29420], and endo-1, 4-beta-D-glucanase [At4g30280]).
4.2. Microarray analysis of NO-induced gene expression in wt, jar1 and NahG plants
Salicylic acid and jasmonic acid signaling pathway are thought to be two most important
pathways for plants defense response (Dong, 1998). NO is known to play a key role in plant
defense systems. However, how does NO exert its function? Which genes are induced by
NO? Moreover, how does NO cooperate with other signals to cope abiotic and biotic stresses?
There are still many open questions. To unravel the interaction and/or participation of NO
with known plant defense signaling pathways, gene expression dynamics was studied in NO
treated Arabidopsis thaliana (Col-wt) plants by cDNA microarray. Identical experiments were
carried out with NahG and jar1 plants. NahG plants contains bacterial salicylate hydroxylase
Control NO
Control
NO
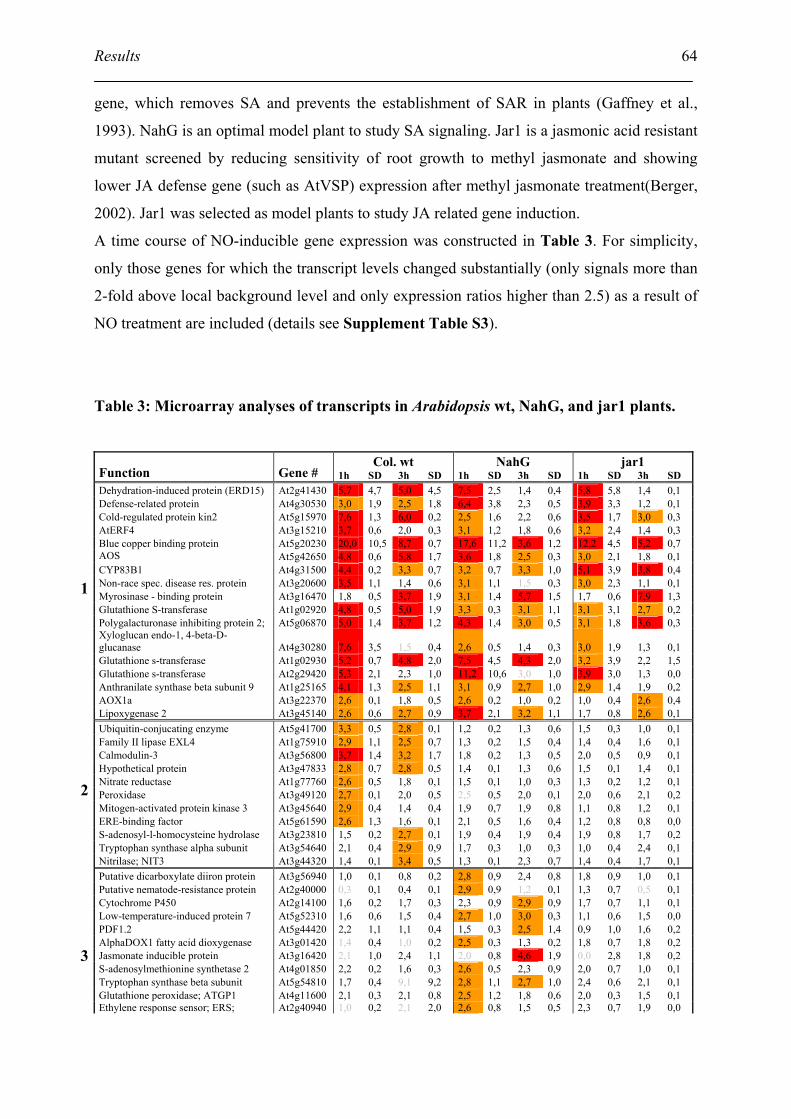
Results
64
gene, which removes SA and prevents the establishment of SAR in plants (Gaffney et al.,
1993). NahG is an optimal model plant to study SA signaling. Jar1 is a jasmonic acid resistant
mutant screened by reducing sensitivity of root growth to methyl jasmonate and showing
lower JA defense gene (such as AtVSP) expression after methyl jasmonate treatment(Berger,
2002). Jar1 was selected as model plants to study JA related gene induction.
A time course of NO-inducible gene expression was constructed in Table 3. For simplicity,
only those genes for which the transcript levels changed substantially (only signals more than
2-fold above local background level and only expression ratios higher than 2.5) as a result of
NO treatment are included (details see Supplement Table S3).
Table 3: Microarray analyses of transcripts in Arabidopsis wt, NahG, and jar1 plants.
Col. wt NahG jar1 Function Gene # 1h SD 3h SD 1h SD 3h SD 1h SD 3h SD Dehydration-induced protein (ERD15) At2g41430 5,7 4,7 5,0 4,5 7,5 2,5 1,4 0,4 5,8 5,8 1,4 0,1 Defense-related protein At4g30530 3,0 1,9 2,5 1,8 6,4 3,8 2,3 0,5 3,9 3,3 1,2 0,1 Cold-regulated protein kin2 At5g15970 7,6 1,3 6,0 0,2 2,5 1,6 2,2 0,6 3,5 1,7 3,0 0,3 AtERF4 At3g15210 3,7 0,6 2,0 0,3 3,1 1,2 1,8 0,6 3,2 2,4 1,4 0,3 Blue copper binding protein At5g20230 20,0 10,5 8,7 0,7 17,6 11,2 3,6 1,2 12,2 4,5 5,2 0,7 AOS At5g42650 4,8 0,6 5,8 1,7 3,6 1,8 2,5 0,3 3,0 2,1 1,8 0,1 CYP83B1 At4g31500 4,4 0,2 3,3 0,7 3,2 0,7 3,3 1,0 5,1 3,9 3,8 0,4 Non-race spec. disease res. protein At3g20600 3,5 1,1 1,4 0,6 3,1 1,1 1,5 0,3 3,0 2,3 1,1 0,1 Myrosinase - binding protein At3g16470 1,8 0,5 3,7 1,9 3,1 1,4 5,7 1,5 1,7 0,6 7,9 1,3 Glutathione S-transferase At1g02920 4,8 0,5 5,0 1,9 3,3 0,3 3,1 1,1 3,1 3,1 2,7 0,2 Polygalacturonase inhibiting protein 2; At5g06870 5,0 1,4 3,7 1,2 4,3 1,4 3,0 0,5 3,1 1,8 3,6 0,3 Xyloglucan endo-1, 4-beta-D-glucanase At4g30280 7,6 3,5 1,5 0,4 2,6 0,5 1,4 0,3 3,0 1,9 1,3 0,1 Glutathione s-transferase At1g02930 5,2 0,7 4,8 2,0 7,5 4,5 4,3 2,0 3,2 3,9 2,2 1,5 Glutathione s-transferase At2g29420 5,3 2,1 2,3 1,0 11,2 10,6 3,0 1,0 3,9 3,0 1,3 0,0 Anthranilate synthase beta subunit 9 At1g25165 4,1 1,3 2,5 1,1 3,1 0,9 2,7 1,0 2,9 1,4 1,9 0,2 AOX1a At3g22370 2,6 0,1 1,8 0,5 2,6 0,2 1,0 0,2 1,0 0,4 2,6 0,4 Lipoxygenase 2 At3g45140 2,6 0,6 2,7 0,9 3,7 2,1 3,2 1,1 1,7 0,8 2,6 0,1 Ubiquitin-conjucating enzyme At5g41700 3,3 0,5 2,8 0,1 1,2 0,2 1,3 0,6 1,5 0,3 1,0 0,1 Family II lipase EXL4 At1g75910 2,9 1,1 2,5 0,7 1,3 0,2 1,5 0,4 1,4 0,4 1,6 0,1 Calmodulin-3 At3g56800 3,7 1,4 3,2 1,7 1,8 0,2 1,3 0,5 2,0 0,5 0,9 0,1 Hypothetical protein At3g47833 2,8 0,7 2,8 0,5 1,4 0,1 1,3 0,6 1,5 0,1 1,4 0,1 Nitrate reductase At1g77760 2,6 0,5 1,8 0,1 1,5 0,1 1,0 0,3 1,3 0,2 1,2 0,1 Peroxidase At3g49120 2,7 0,1 2,0 0,5 2,5 0,5 2,0 0,1 2,0 0,6 2,1 0,2 Mitogen-activated protein kinase 3 At3g45640 2,9 0,4 1,4 0,4 1,9 0,7 1,9 0,8 1,1 0,8 1,2 0,1 ERE-binding factor At5g61590 2,6 1,3 1,6 0,1 2,1 0,5 1,6 0,4 1,2 0,8 0,8 0,0 S-adenosyl-l-homocysteine hydrolase At3g23810 1,5 0,2 2,7 0,1 1,9 0,4 1,9 0,4 1,9 0,8 1,7 0,2 Tryptophan synthase alpha subunit At3g54640 2,1 0,4 2,9 0,9 1,7 0,3 1,0 0,3 1,0 0,4 2,4 0,1 Nitrilase; NIT3 At3g44320 1,4 0,1 3,4 0,5 1,3 0,1 2,3 0,7 1,4 0,4 1,7 0,1 Putative dicarboxylate diiron protein At3g56940 1,0 0,1 0,8 0,2 2,8 0,9 2,4 0,8 1,8 0,9 1,0 0,1 Putative nematode-resistance protein At2g40000 0,3 0,1 0,4 0,1 2,9 0,9 1,2 0,1 1,3 0,7 0,5 0,1 Cytochrome P450 At2g14100 1,6 0,2 1,7 0,3 2,3 0,9 2,9 0,9 1,7 0,7 1,1 0,1 Low-temperature-induced protein 7 At5g52310 1,6 0,6 1,5 0,4 2,7 1,0 3,0 0,3 1,1 0,6 1,5 0,0 PDF1.2 At5g44420 2,2 1,1 1,1 0,4 1,5 0,3 2,5 1,4 0,9 1,0 1,6 0,2 AlphaDOX1 fatty acid dioxygenase At3g01420 1,4 0,4 1,0 0,2 2,5 0,3 1,3 0,2 1,8 0,7 1,8 0,2 Jasmonate inducible protein At3g16420 2,1 1,0 2,4 1,1 2,0 0,8 4,6 1,9 0,0 2,8 1,8 0,2 S-adenosylmethionine synthetase 2 At4g01850 2,2 0,2 1,6 0,3 2,6 0,5 2,3 0,9 2,0 0,7 1,0 0,1 Tryptophan synthase beta subunit At5g54810 1,7 0,4 9,1 9,2 2,8 1,1 2,7 1,0 2,4 0,6 2,1 0,1 Glutathione peroxidase; ATGP1 At4g11600 2,1 0,3 2,1 0,8 2,5 1,2 1,8 0,6 2,0 0,3 1,5 0,1 Ethylene response sensor; ERS; At2g40940 1,0 0,2 2,1 2,0 2,6 0,8 1,5 0,5 2,3 0,7 1,9 0,0
1 2 3
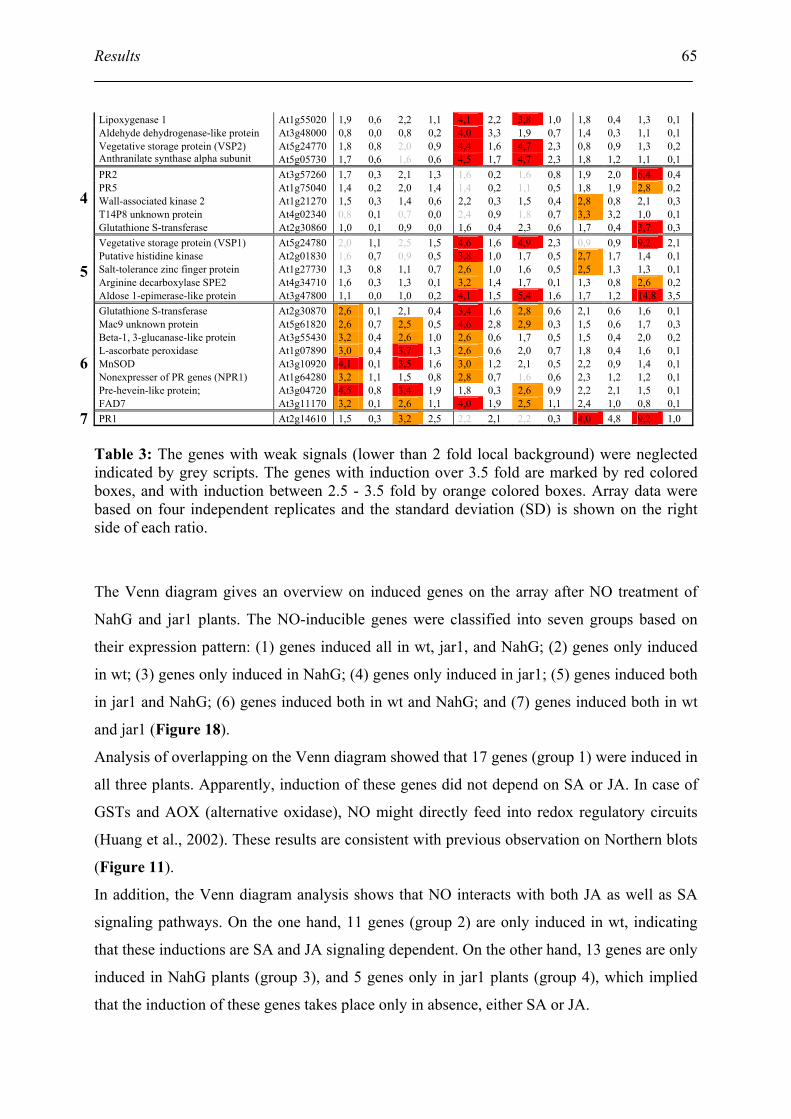
Results
65
Lipoxygenase 1 At1g55020 1,9 0,6 2,2 1,1 4,1 2,2 3,8 1,0 1,8 0,4 1,3 0,1 Aldehyde dehydrogenase-like protein At3g48000 0,8 0,0 0,8 0,2 4,0 3,3 1,9 0,7 1,4 0,3 1,1 0,1 Vegetative storage protein (VSP2) At5g24770 1,8 0,8 2,0 0,9 4,4 1,6 4,7 2,3 0,8 0,9 1,3 0,2 Anthranilate synthase alpha subunit At5g05730 1,7 0,6 1,6 0,6 4,5 1,7 4,7 2,3 1,8 1,2 1,1 0,1 PR2 At3g57260 1,7 0,3 2,1 1,3 1,6 0,2 1,6 0,8 1,9 2,0 6,4 0,4 PR5 At1g75040 1,4 0,2 2,0 1,4 1,4 0,2 1,1 0,5 1,8 1,9 2,8 0,2 Wall-associated kinase 2 At1g21270 1,5 0,3 1,4 0,6 2,2 0,3 1,5 0,4 2,8 0,8 2,1 0,3 T14P8 unknown protein At4g02340 0,8 0,1 0,7 0,0 2,4 0,9 1,8 0,7 3,3 3,2 1,0 0,1 Glutathione S-transferase At2g30860 1,0 0,1 0,9 0,0 1,6 0,4 2,3 0,6 1,7 0,4 3,7 0,3 Vegetative storage protein (VSP1) At5g24780 2,0 1,1 2,5 1,5 4,6 1,6 4,9 2,3 0,9 0,9 9,2 2,1 Putative histidine kinase At2g01830 1,6 0,7 0,9 0,5 3,8 1,0 1,7 0,5 2,7 1,7 1,4 0,1 Salt-tolerance zinc finger protein At1g27730 1,3 0,8 1,1 0,7 2,6 1,0 1,6 0,5 2,5 1,3 1,3 0,1 Arginine decarboxylase SPE2 At4g34710 1,6 0,3 1,3 0,1 3,2 1,4 1,7 0,1 1,3 0,8 2,6 0,2 Aldose 1-epimerase-like protein At3g47800 1,1 0,0 1,0 0,2 4,1 1,5 5,4 1,6 1,7 1,2 14,8 3,5 Glutathione S-transferase At2g30870 2,6 0,1 2,1 0,4 3,4 1,6 2,8 0,6 2,1 0,6 1,6 0,1 Mac9 unknown protein At5g61820 2,6 0,7 2,5 0,5 4,6 2,8 2,9 0,3 1,5 0,6 1,7 0,3 Beta-1, 3-glucanase-like protein At3g55430 3,2 0,4 2,6 1,0 2,6 0,6 1,7 0,5 1,5 0,4 2,0 0,2 L-ascorbate peroxidase At1g07890 3,0 0,4 3,7 1,3 2,6 0,6 2,0 0,7 1,8 0,4 1,6 0,1 MnSOD At3g10920 4,1 0,1 3,5 1,6 3,0 1,2 2,1 0,5 2,2 0,9 1,4 0,1 Nonexpresser of PR genes (NPR1) At1g64280 3,2 1,1 1,5 0,8 2,8 0,7 1,6 0,6 2,3 1,2 1,2 0,1 Pre-hevein-like protein; At3g04720 4,5 0,8 3,4 1,9 1,8 0,3 2,6 0,9 2,2 2,1 1,5 0,1 FAD7 At3g11170 3,2 0,1 2,6 1,1 4,0 1,9 2,5 1,1 2,4 1,0 0,8 0,1 PR1 At2g14610 1,5 0,3 3,2 2,5 2,2 2,1 2,2 0,3 4,0 4,8 9,2 1,0
Table 3: The genes with weak signals (lower than 2 fold local background) were neglected indicated by grey scripts. The genes with induction over 3.5 fold are marked by red colored boxes, and with induction between 2.5 - 3.5 fold by orange colored boxes. Array data were based on four independent replicates and the standard deviation (SD) is shown on the right side of each ratio.
The Venn diagram gives an overview on induced genes on the array after NO treatment of
NahG and jar1 plants. The NO-inducible genes were classified into seven groups based on
their expression pattern: (1) genes induced all in wt, jar1, and NahG; (2) genes only induced
in wt; (3) genes only induced in NahG; (4) genes only induced in jar1; (5) genes induced both
in jar1 and NahG; (6) genes induced both in wt and NahG; and (7) genes induced both in wt
and jar1 (Figure 18).
Analysis of overlapping on the Venn diagram showed that 17 genes (group 1) were induced in
all three plants. Apparently, induction of these genes did not depend on SA or JA. In case of
GSTs and AOX (alternative oxidase), NO might directly feed into redox regulatory circuits
(Huang et al., 2002). These results are consistent with previous observation on Northern blots
(Figure 11).
In addition, the Venn diagram analysis shows that NO interacts with both JA as well as SA
signaling pathways. On the one hand, 11 genes (group 2) are only induced in wt, indicating
that these inductions are SA and JA signaling dependent. On the other hand, 13 genes are only
induced in NahG plants (group 3), and 5 genes only in jar1 plants (group 4), which implied
that the induction of these genes takes place only in absence, either SA or JA.
4 5 6 7
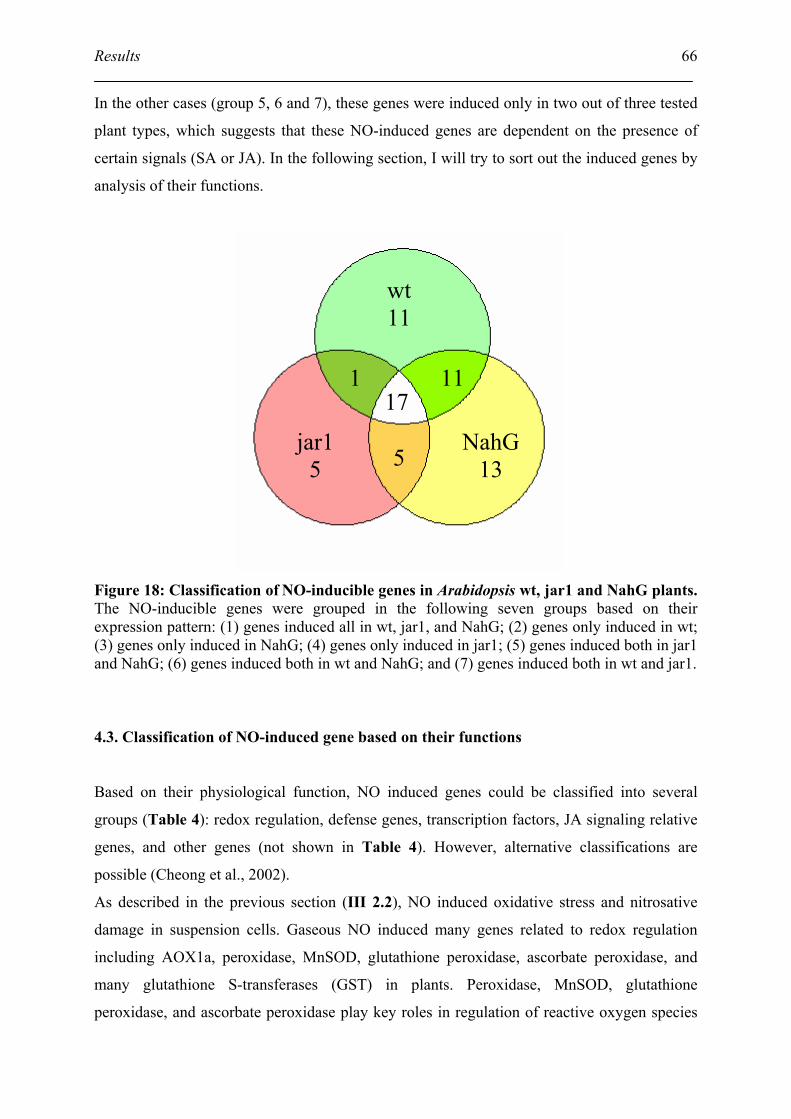
Results
66
In the other cases (group 5, 6 and 7), these genes were induced only in two out of three tested
plant types, which suggests that these NO-induced genes are dependent on the presence of
certain signals (SA or JA). In the following section, I will try to sort out the induced genes by
analysis of their functions.
Figure 18: Classification of NO-inducible genes in Arabidopsis wt, jar1 and NahG plants. The NO-inducible genes were grouped in the following seven groups based on their expression pattern: (1) genes induced all in wt, jar1, and NahG; (2) genes only induced in wt; (3) genes only induced in NahG; (4) genes only induced in jar1; (5) genes induced both in jar1 and NahG; (6) genes induced both in wt and NahG; and (7) genes induced both in wt and jar1.
4.3. Classification of NO-induced gene based on their functions
Based on their physiological function, NO induced genes could be classified into several
groups (Table 4): redox regulation, defense genes, transcription factors, JA signaling relative
genes, and other genes (not shown in Table 4). However, alternative classifications are
possible (Cheong et al., 2002).
As described in the previous section (III 2.2), NO induced oxidative stress and nitrosative
damage in suspension cells. Gaseous NO induced many genes related to redox regulation
including AOX1a, peroxidase, MnSOD, glutathione peroxidase, ascorbate peroxidase, and
many glutathione S-transferases (GST) in plants. Peroxidase, MnSOD, glutathione
peroxidase, and ascorbate peroxidase play key roles in regulation of reactive oxygen species
wt 11
jar1 5
NahG13 5
17 1 11
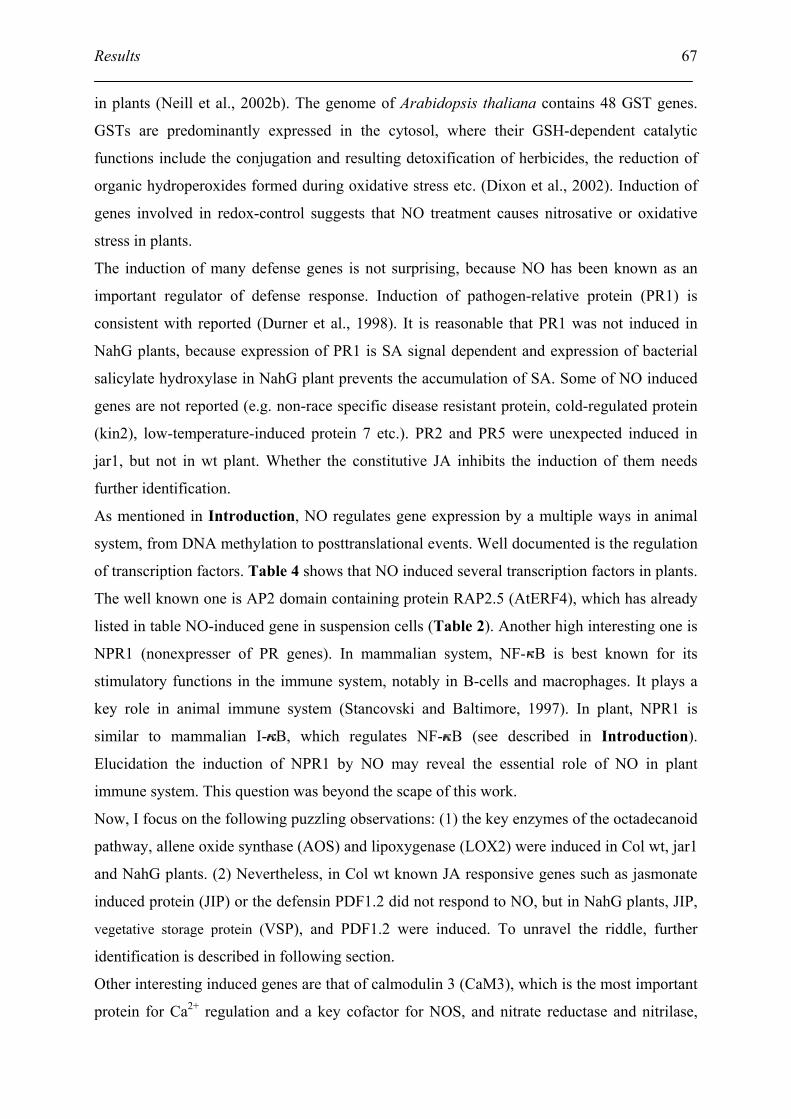
Results
67
in plants (Neill et al., 2002b). The genome of Arabidopsis thaliana contains 48 GST genes.
GSTs are predominantly expressed in the cytosol, where their GSH-dependent catalytic
functions include the conjugation and resulting detoxification of herbicides, the reduction of
organic hydroperoxides formed during oxidative stress etc. (Dixon et al., 2002). Induction of
genes involved in redox-control suggests that NO treatment causes nitrosative or oxidative
stress in plants.
The induction of many defense genes is not surprising, because NO has been known as an
important regulator of defense response. Induction of pathogen-relative protein (PR1) is
consistent with reported (Durner et al., 1998). It is reasonable that PR1 was not induced in
NahG plants, because expression of PR1 is SA signal dependent and expression of bacterial
salicylate hydroxylase in NahG plant prevents the accumulation of SA. Some of NO induced
genes are not reported (e.g. non-race specific disease resistant protein, cold-regulated protein
(kin2), low-temperature-induced protein 7 etc.). PR2 and PR5 were unexpected induced in
jar1, but not in wt plant. Whether the constitutive JA inhibits the induction of them needs
further identification.
As mentioned in Introduction, NO regulates gene expression by a multiple ways in animal
system, from DNA methylation to posttranslational events. Well documented is the regulation
of transcription factors. Table 4 shows that NO induced several transcription factors in plants.
The well known one is AP2 domain containing protein RAP2.5 (AtERF4), which has already
listed in table NO-induced gene in suspension cells (Table 2). Another high interesting one is
NPR1 (nonexpresser of PR genes). In mammalian system, NF- B is best known for its
stimulatory functions in the immune system, notably in B-cells and macrophages. It plays a
key role in animal immune system (Stancovski and Baltimore, 1997). In plant, NPR1 is
similar to mammalian I- B, which regulates NF- B (see described in Introduction).
Elucidation the induction of NPR1 by NO may reveal the essential role of NO in plant
immune system. This question was beyond the scape of this work.
Now, I focus on the following puzzling observations: (1) the key enzymes of the octadecanoid
pathway, allene oxide synthase (AOS) and lipoxygenase (LOX2) were induced in Col wt, jar1
and NahG plants. (2) Nevertheless, in Col wt known JA responsive genes such as jasmonate
induced protein (JIP) or the defensin PDF1.2 did not respond to NO, but in NahG plants, JIP,
vegetative storage protein (VSP), and PDF1.2 were induced. To unravel the riddle, further
identification is described in following section.
Other interesting induced genes are that of calmodulin 3 (CaM3), which is the most important
protein for Ca2+ regulation and a key cofactor for NOS, and nitrate reductase and nitrilase,
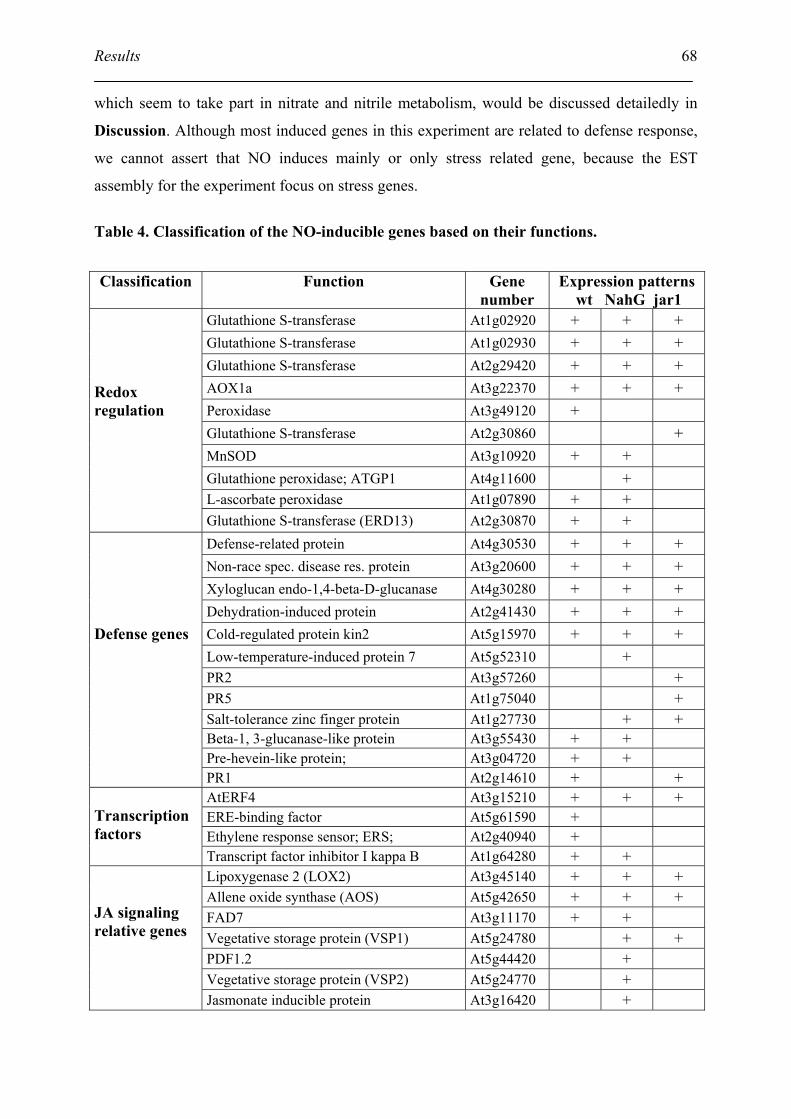
Results
68
which seem to take part in nitrate and nitrile metabolism, would be discussed detailedly in
Discussion. Although most induced genes in this experiment are related to defense response,
we cannot assert that NO induces mainly or only stress related gene, because the EST
assembly for the experiment focus on stress genes.
Table 4. Classification of the NO-inducible genes based on their functions.
Classification Function Gene number
Expression patterns wt NahG jar1
Glutathione S-transferase At1g02920 + + + Glutathione S-transferase At1g02930 + + + Glutathione S-transferase At2g29420 + + + AOX1a At3g22370 + + + Peroxidase At3g49120 + Glutathione S-transferase At2g30860 + MnSOD At3g10920 + + Glutathione peroxidase; ATGP1 At4g11600 + L-ascorbate peroxidase At1g07890 + +
Redox regulation
Glutathione S-transferase (ERD13) At2g30870 + + Defense-related protein At4g30530 + + + Non-race spec. disease res. protein At3g20600 + + + Xyloglucan endo-1,4-beta-D-glucanase At4g30280 + + + Dehydration-induced protein At2g41430 + + + Cold-regulated protein kin2 At5g15970 + + + Low-temperature-induced protein 7 At5g52310 + PR2 At3g57260 + PR5 At1g75040 + Salt-tolerance zinc finger protein At1g27730 + + Beta-1, 3-glucanase-like protein At3g55430 + + Pre-hevein-like protein; At3g04720 + +
Defense genes
PR1 At2g14610 + + AtERF4 At3g15210 + + + ERE-binding factor At5g61590 + Ethylene response sensor; ERS; At2g40940 +
Transcription factors
Transcript factor inhibitor I kappa B At1g64280 + + Lipoxygenase 2 (LOX2) At3g45140 + + + Allene oxide synthase (AOS) At5g42650 + + + FAD7 At3g11170 + + Vegetative storage protein (VSP1) At5g24780 + + PDF1.2 At5g44420 + Vegetative storage protein (VSP2) At5g24770 +
JA signaling relative genes
Jasmonate inducible protein At3g16420 +
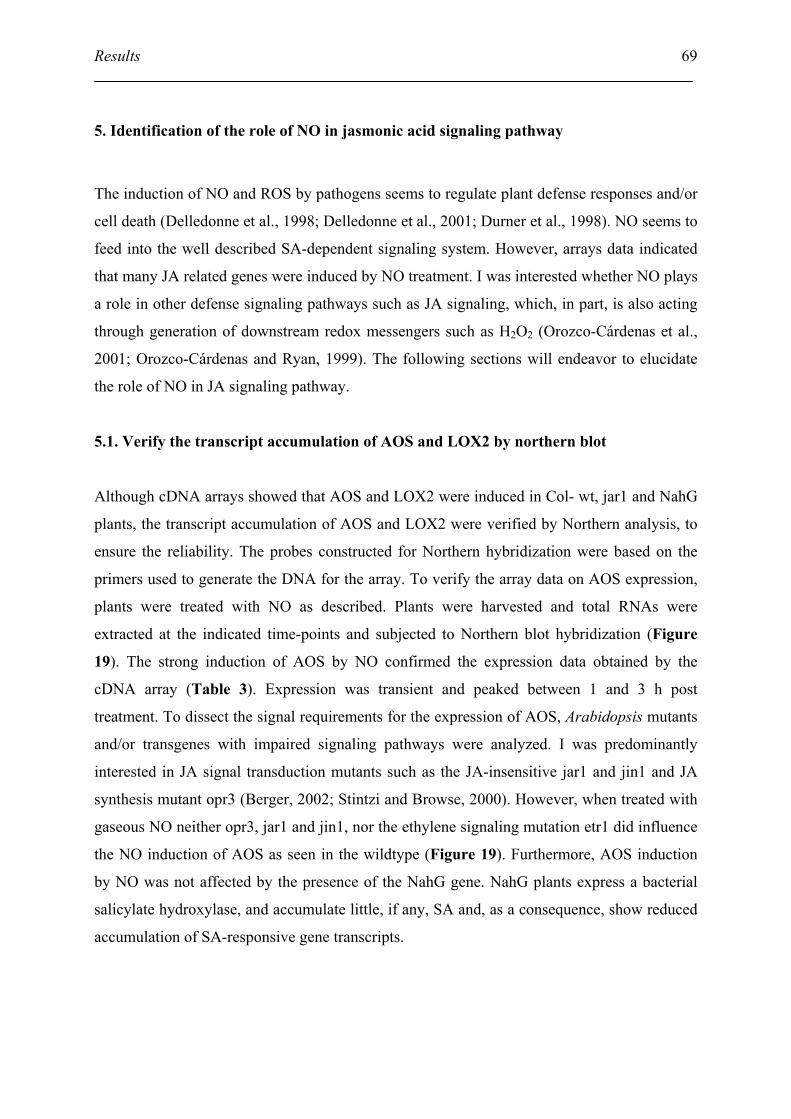
Results
69
5. Identification of the role of NO in jasmonic acid signaling pathway
The induction of NO and ROS by pathogens seems to regulate plant defense responses and/or
cell death (Delledonne et al., 1998; Delledonne et al., 2001; Durner et al., 1998). NO seems to
feed into the well described SA-dependent signaling system. However, arrays data indicated
that many JA related genes were induced by NO treatment. I was interested whether NO plays
a role in other defense signaling pathways such as JA signaling, which, in part, is also acting
through generation of downstream redox messengers such as H2O2 (Orozco-Cárdenas et al.,
2001; Orozco-Cárdenas and Ryan, 1999). The following sections will endeavor to elucidate
the role of NO in JA signaling pathway.
5.1. Verify the transcript accumulation of AOS and LOX2 by northern blot
Although cDNA arrays showed that AOS and LOX2 were induced in Col- wt, jar1 and NahG
plants, the transcript accumulation of AOS and LOX2 were verified by Northern analysis, to
ensure the reliability. The probes constructed for Northern hybridization were based on the
primers used to generate the DNA for the array. To verify the array data on AOS expression,
plants were treated with NO as described. Plants were harvested and total RNAs were
extracted at the indicated time-points and subjected to Northern blot hybridization (Figure
19). The strong induction of AOS by NO confirmed the expression data obtained by the
cDNA array (Table 3). Expression was transient and peaked between 1 and 3 h post
treatment. To dissect the signal requirements for the expression of AOS, Arabidopsis mutants
and/or transgenes with impaired signaling pathways were analyzed. I was predominantly
interested in JA signal transduction mutants such as the JA-insensitive jar1 and jin1 and JA
synthesis mutant opr3 (Berger, 2002; Stintzi and Browse, 2000). However, when treated with
gaseous NO neither opr3, jar1 and jin1, nor the ethylene signaling mutation etr1 did influence
the NO induction of AOS as seen in the wildtype (Figure 19). Furthermore, AOS induction
by NO was not affected by the presence of the NahG gene. NahG plants express a bacterial
salicylate hydroxylase, and accumulate little, if any, SA and, as a consequence, show reduced
accumulation of SA-responsive gene transcripts.
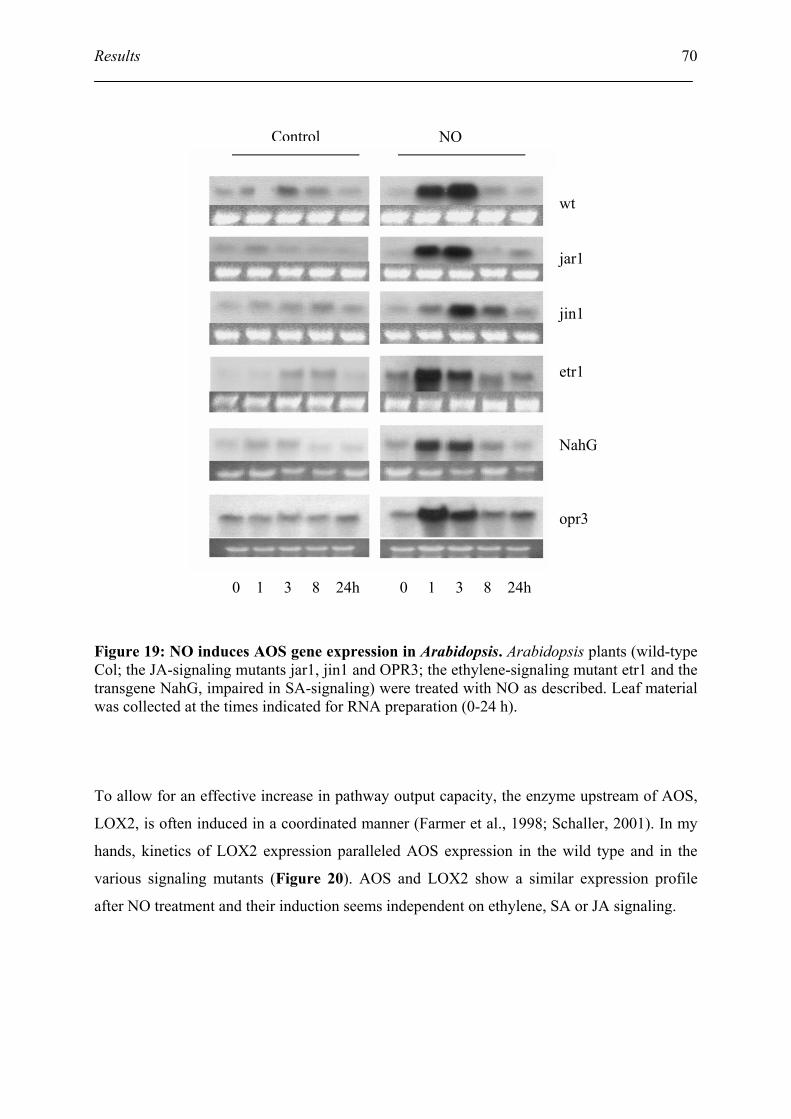
Results
70
Figure 19: NO induces AOS gene expression in Arabidopsis. Arabidopsis plants (wild-type Col; the JA-signaling mutants jar1, jin1 and OPR3; the ethylene-signaling mutant etr1 and the transgene NahG, impaired in SA-signaling) were treated with NO as described. Leaf material was collected at the times indicated for RNA preparation (0-24 h).
To allow for an effective increase in pathway output capacity, the enzyme upstream of AOS,
LOX2, is often induced in a coordinated manner (Farmer et al., 1998; Schaller, 2001). In my
hands, kinetics of LOX2 expression paralleled AOS expression in the wild type and in the
various signaling mutants (Figure 20). AOS and LOX2 show a similar expression profile
after NO treatment and their induction seems independent on ethylene, SA or JA signaling.
wt jar1 jin1 etr1 NahG opr3
0 1 3 8 24h 0 1 3 8 24h
NO Control
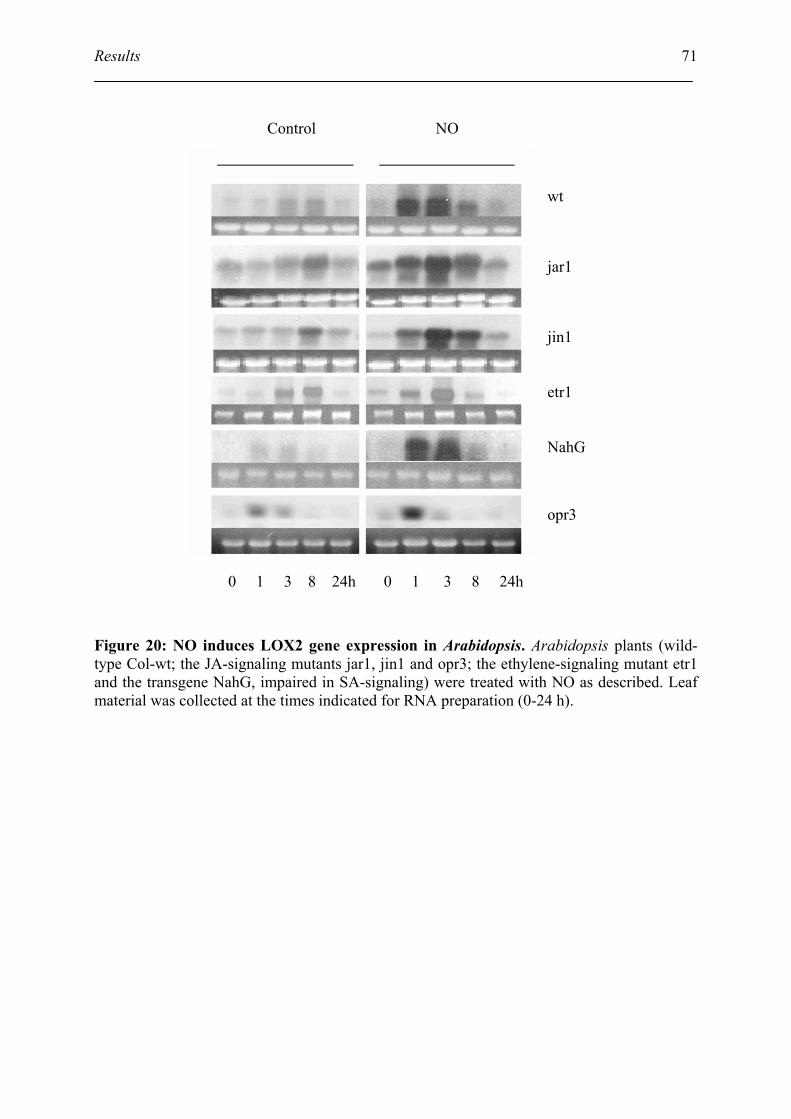
Results
71
Figure 20: NO induces LOX2 gene expression in Arabidopsis. Arabidopsis plants (wild-type Col-wt; the JA-signaling mutants jar1, jin1 and opr3; the ethylene-signaling mutant etr1 and the transgene NahG, impaired in SA-signaling) were treated with NO as described. Leaf material was collected at the times indicated for RNA preparation (0-24 h).
wt jar1 jin1 etr1 NahG
opr3
0 1 3 8 24h 0 1 3 8 24h
Control NO
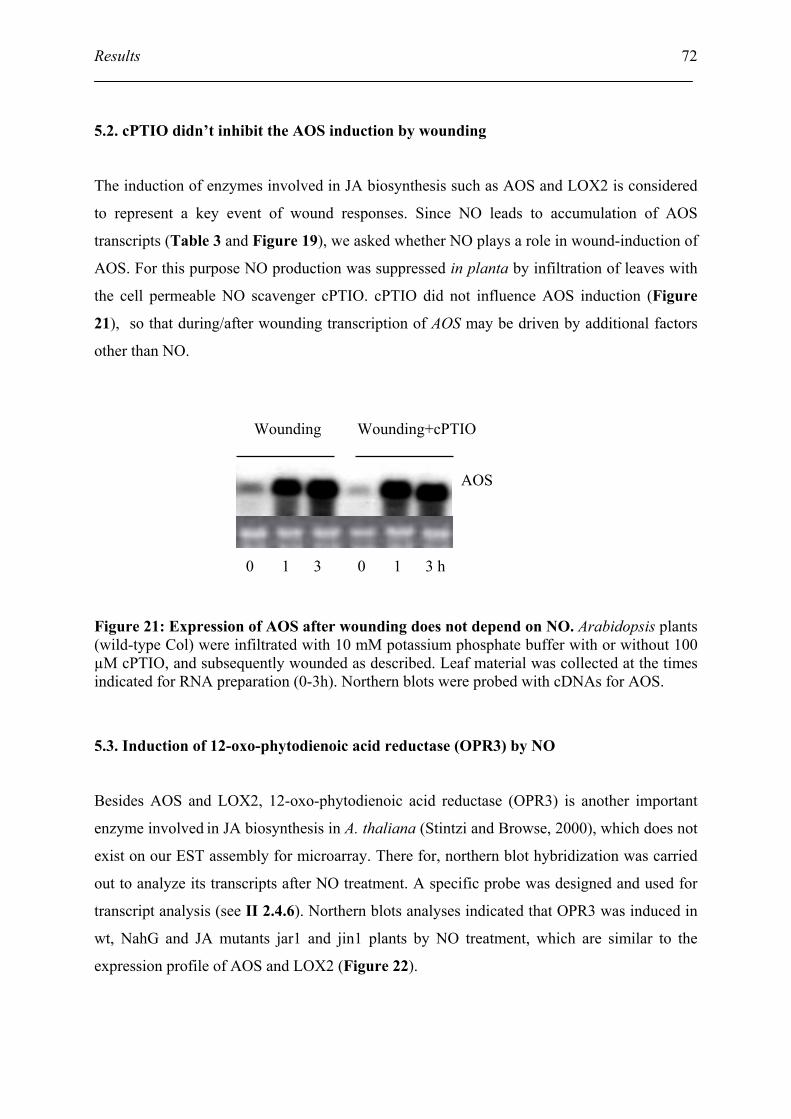
Results
72
5.2. cPTIO didn’t inhibit the AOS induction by wounding
The induction of enzymes involved in JA biosynthesis such as AOS and LOX2 is considered
to represent a key event of wound responses. Since NO leads to accumulation of AOS
transcripts (Table 3 and Figure 19), we asked whether NO plays a role in wound-induction of
AOS. For this purpose NO production was suppressed in planta by infiltration of leaves with
the cell permeable NO scavenger cPTIO. cPTIO did not influence AOS induction (Figure
21), so that during/after wounding transcription of AOS may be driven by additional factors
other than NO.
Figure 21: Expression of AOS after wounding does not depend on NO. Arabidopsis plants (wild-type Col) were infiltrated with 10 mM potassium phosphate buffer with or without 100 µM cPTIO, and subsequently wounded as described. Leaf material was collected at the times indicated for RNA preparation (0-3h). Northern blots were probed with cDNAs for AOS.
5.3. Induction of 12-oxo-phytodienoic acid reductase (OPR3) by NO
Besides AOS and LOX2, 12-oxo-phytodienoic acid reductase (OPR3) is another important
enzyme involved in JA biosynthesis in A. thaliana (Stintzi and Browse, 2000), which does not
exist on our EST assembly for microarray. There for, northern blot hybridization was carried
out to analyze its transcripts after NO treatment. A specific probe was designed and used for
transcript analysis (see II 2.4.6). Northern blots analyses indicated that OPR3 was induced in
wt, NahG and JA mutants jar1 and jin1 plants by NO treatment, which are similar to the
expression profile of AOS and LOX2 (Figure 22).
0 1 3 0 1 3 h
AOS
Wounding Wounding+cPTIO
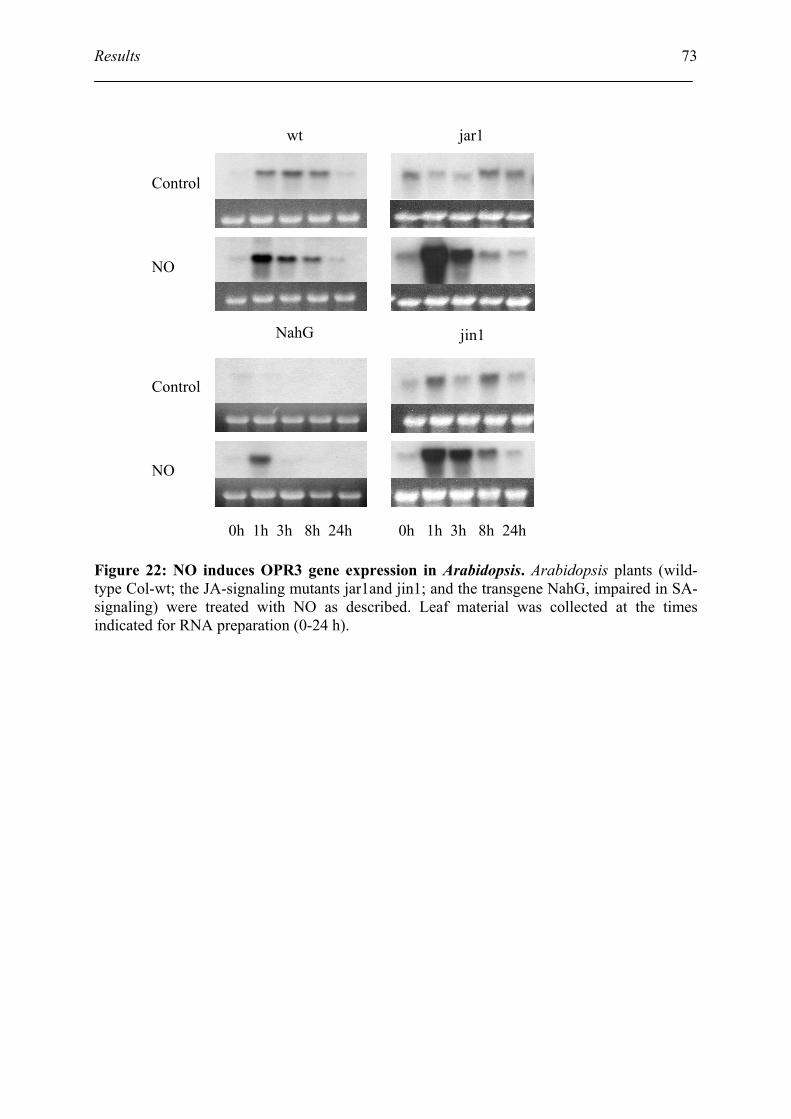
Results
73
Figure 22: NO induces OPR3 gene expression in Arabidopsis. Arabidopsis plants (wild-type Col-wt; the JA-signaling mutants jar1and jin1; and the transgene NahG, impaired in SA-signaling) were treated with NO as described. Leaf material was collected at the times indicated for RNA preparation (0-24 h).
wt jar1
jin1
Control
NO
0h 1h 3h 8h 24h 0h 1h 3h 8h 24h
NahG
Control
NO
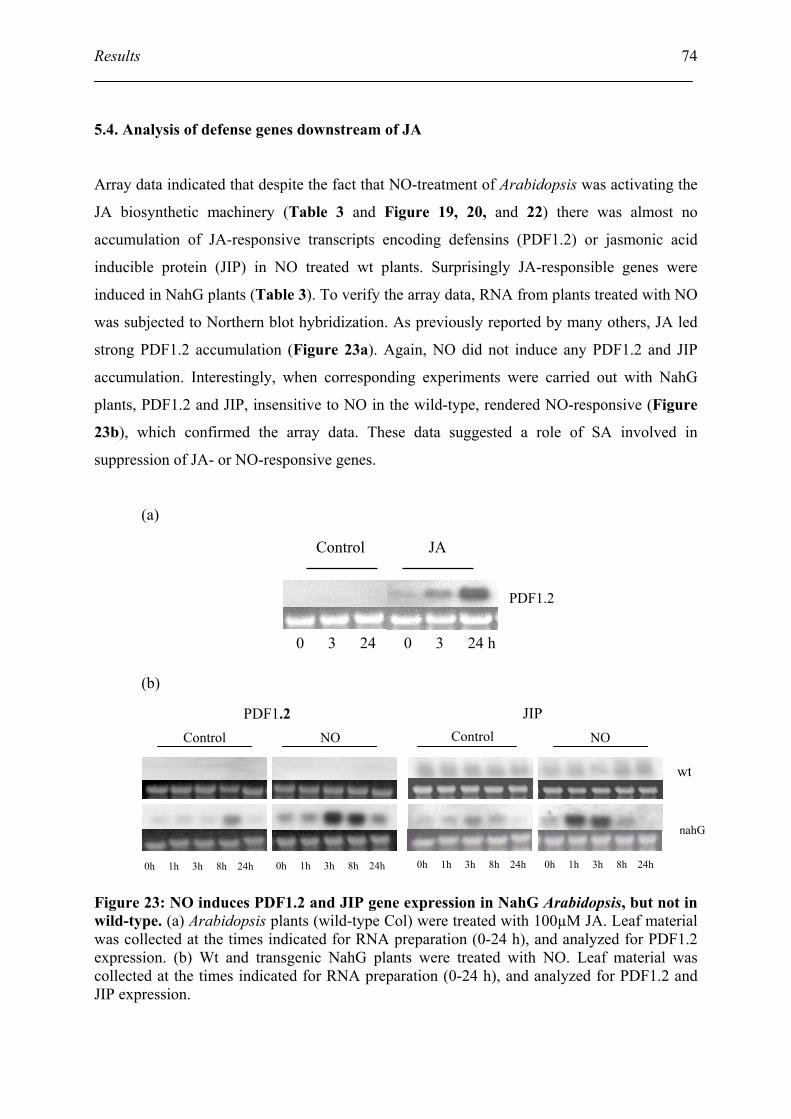
Results
74
5.4. Analysis of defense genes downstream of JA
Array data indicated that despite the fact that NO-treatment of Arabidopsis was activating the
JA biosynthetic machinery (Table 3 and Figure 19, 20, and 22) there was almost no
accumulation of JA-responsive transcripts encoding defensins (PDF1.2) or jasmonic acid
inducible protein (JIP) in NO treated wt plants. Surprisingly JA-responsible genes were
induced in NahG plants (Table 3). To verify the array data, RNA from plants treated with NO
was subjected to Northern blot hybridization. As previously reported by many others, JA led
strong PDF1.2 accumulation (Figure 23a). Again, NO did not induce any PDF1.2 and JIP
accumulation. Interestingly, when corresponding experiments were carried out with NahG
plants, PDF1.2 and JIP, insensitive to NO in the wild-type, rendered NO-responsive (Figure
23b), which confirmed the array data. These data suggested a role of SA involved in
suppression of JA- or NO-responsive genes.
(a)
(b)
Figure 23: NO induces PDF1.2 and JIP gene expression in NahG Arabidopsis, but not in wild-type. (a) Arabidopsis plants (wild-type Col) were treated with 100µM JA. Leaf material was collected at the times indicated for RNA preparation (0-24 h), and analyzed for PDF1.2 expression. (b) Wt and transgenic NahG plants were treated with NO. Leaf material was collected at the times indicated for RNA preparation (0-24 h), and analyzed for PDF1.2 and JIP expression.
wt
0h 1h 3h 8h 24h 0h 1h 3h 8h 24h 0h 1h 3h 8h 24h 0h 1h 3h 8h 24h
PDF1.2 JIP
nahG
Control NO Control NO
0 3 24 0 3 24 h
Control JA
PDF1.2
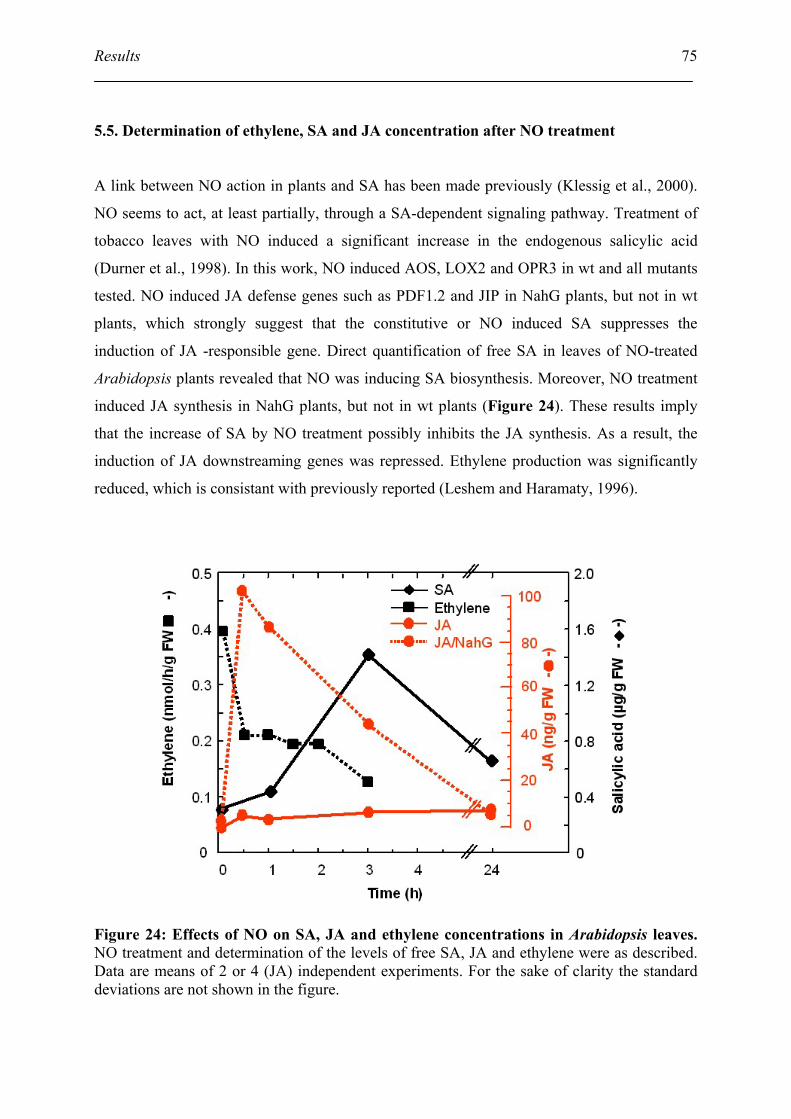
Results
75
5.5. Determination of ethylene, SA and JA concentration after NO treatment
A link between NO action in plants and SA has been made previously (Klessig et al., 2000).
NO seems to act, at least partially, through a SA-dependent signaling pathway. Treatment of
tobacco leaves with NO induced a significant increase in the endogenous salicylic acid
(Durner et al., 1998). In this work, NO induced AOS, LOX2 and OPR3 in wt and all mutants
tested. NO induced JA defense genes such as PDF1.2 and JIP in NahG plants, but not in wt
plants, which strongly suggest that the constitutive or NO induced SA suppresses the
induction of JA -responsible gene. Direct quantification of free SA in leaves of NO-treated
Arabidopsis plants revealed that NO was inducing SA biosynthesis. Moreover, NO treatment
induced JA synthesis in NahG plants, but not in wt plants (Figure 24). These results imply
that the increase of SA by NO treatment possibly inhibits the JA synthesis. As a result, the
induction of JA downstreaming genes was repressed. Ethylene production was significantly
reduced, which is consistant with previously reported (Leshem and Haramaty, 1996).
Figure 24: Effects of NO on SA, JA and ethylene concentrations in Arabidopsis leaves. NO treatment and determination of the levels of free SA, JA and ethylene were as described. Data are means of 2 or 4 (JA) independent experiments. For the sake of clarity the standard deviations are not shown in the figure.
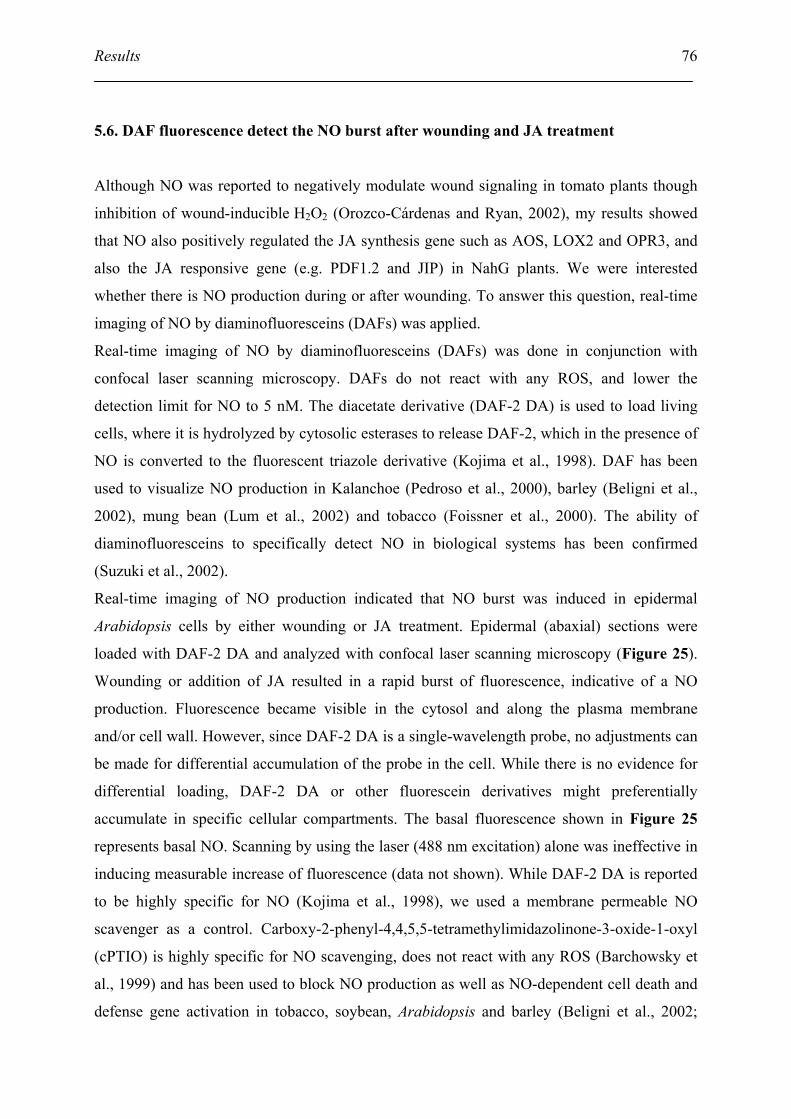
Results
76
5.6. DAF fluorescence detect the NO burst after wounding and JA treatment
Although NO was reported to negatively modulate wound signaling in tomato plants though
inhibition of wound-inducible H2O2 (Orozco-Cárdenas and Ryan, 2002), my results showed
that NO also positively regulated the JA synthesis gene such as AOS, LOX2 and OPR3, and
also the JA responsive gene (e.g. PDF1.2 and JIP) in NahG plants. We were interested
whether there is NO production during or after wounding. To answer this question, real-time
imaging of NO by diaminofluoresceins (DAFs) was applied.
Real-time imaging of NO by diaminofluoresceins (DAFs) was done in conjunction with
confocal laser scanning microscopy. DAFs do not react with any ROS, and lower the
detection limit for NO to 5 nM. The diacetate derivative (DAF-2 DA) is used to load living
cells, where it is hydrolyzed by cytosolic esterases to release DAF-2, which in the presence of
NO is converted to the fluorescent triazole derivative (Kojima et al., 1998). DAF has been
used to visualize NO production in Kalanchoe (Pedroso et al., 2000), barley (Beligni et al.,
2002), mung bean (Lum et al., 2002) and tobacco (Foissner et al., 2000). The ability of
diaminofluoresceins to specifically detect NO in biological systems has been confirmed
(Suzuki et al., 2002).
Real-time imaging of NO production indicated that NO burst was induced in epidermal
Arabidopsis cells by either wounding or JA treatment. Epidermal (abaxial) sections were
loaded with DAF-2 DA and analyzed with confocal laser scanning microscopy (Figure 25).
Wounding or addition of JA resulted in a rapid burst of fluorescence, indicative of a NO
production. Fluorescence became visible in the cytosol and along the plasma membrane
and/or cell wall. However, since DAF-2 DA is a single-wavelength probe, no adjustments can
be made for differential accumulation of the probe in the cell. While there is no evidence for
differential loading, DAF-2 DA or other fluorescein derivatives might preferentially
accumulate in specific cellular compartments. The basal fluorescence shown in Figure 25
represents basal NO. Scanning by using the laser (488 nm excitation) alone was ineffective in
inducing measurable increase of fluorescence (data not shown). While DAF-2 DA is reported
to be highly specific for NO (Kojima et al., 1998), we used a membrane permeable NO
scavenger as a control. Carboxy-2-phenyl-4,4,5,5-tetramethylimidazolinone-3-oxide-1-oxyl
(cPTIO) is highly specific for NO scavenging, does not react with any ROS (Barchowsky et
al., 1999) and has been used to block NO production as well as NO-dependent cell death and
defense gene activation in tobacco, soybean, Arabidopsis and barley (Beligni et al., 2002;
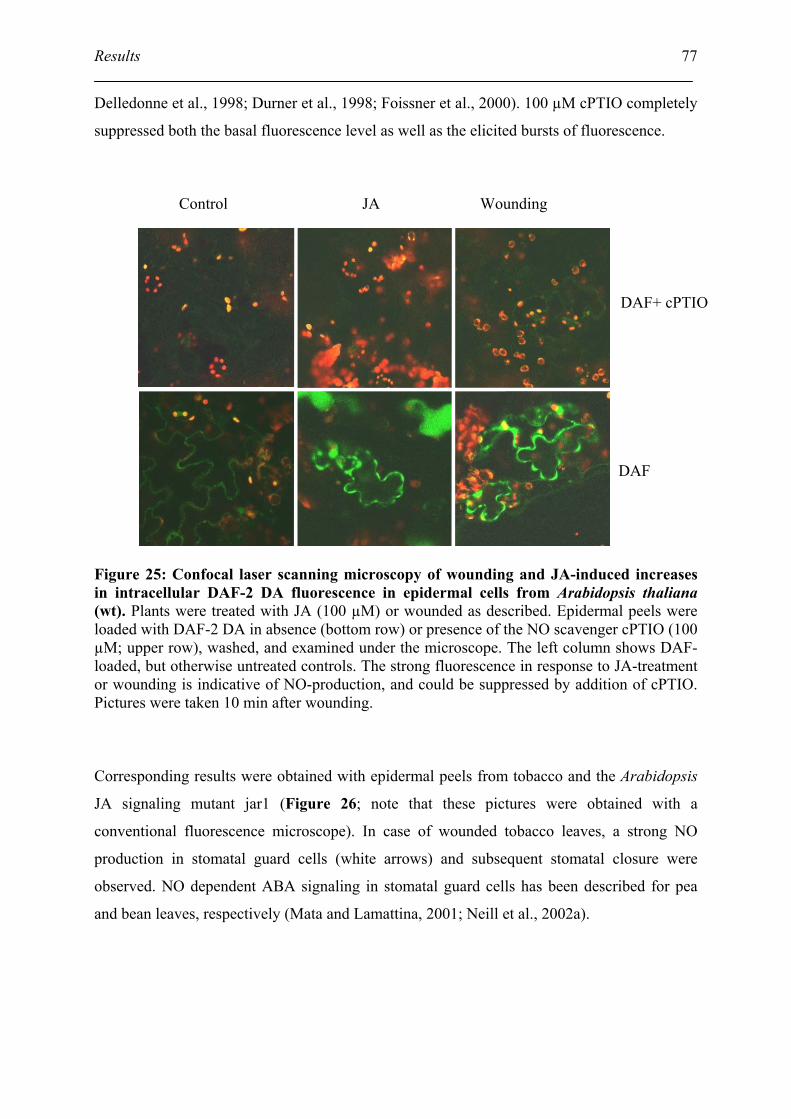
Results
77
Delledonne et al., 1998; Durner et al., 1998; Foissner et al., 2000). 100 µM cPTIO completely
suppressed both the basal fluorescence level as well as the elicited bursts of fluorescence.
Figure 25: Confocal laser scanning microscopy of wounding and JA-induced increases in intracellular DAF-2 DA fluorescence in epidermal cells from Arabidopsis thaliana (wt). Plants were treated with JA (100 µM) or wounded as described. Epidermal peels were loaded with DAF-2 DA in absence (bottom row) or presence of the NO scavenger cPTIO (100 µM; upper row), washed, and examined under the microscope. The left column shows DAF-loaded, but otherwise untreated controls. The strong fluorescence in response to JA-treatment or wounding is indicative of NO-production, and could be suppressed by addition of cPTIO. Pictures were taken 10 min after wounding.
Corresponding results were obtained with epidermal peels from tobacco and the Arabidopsis
JA signaling mutant jar1 (Figure 26; note that these pictures were obtained with a
conventional fluorescence microscope). In case of wounded tobacco leaves, a strong NO
production in stomatal guard cells (white arrows) and subsequent stomatal closure were
observed. NO dependent ABA signaling in stomatal guard cells has been described for pea
and bean leaves, respectively (Mata and Lamattina, 2001; Neill et al., 2002a).
DAF
DAF+ cPTIO
Control JA Wounding
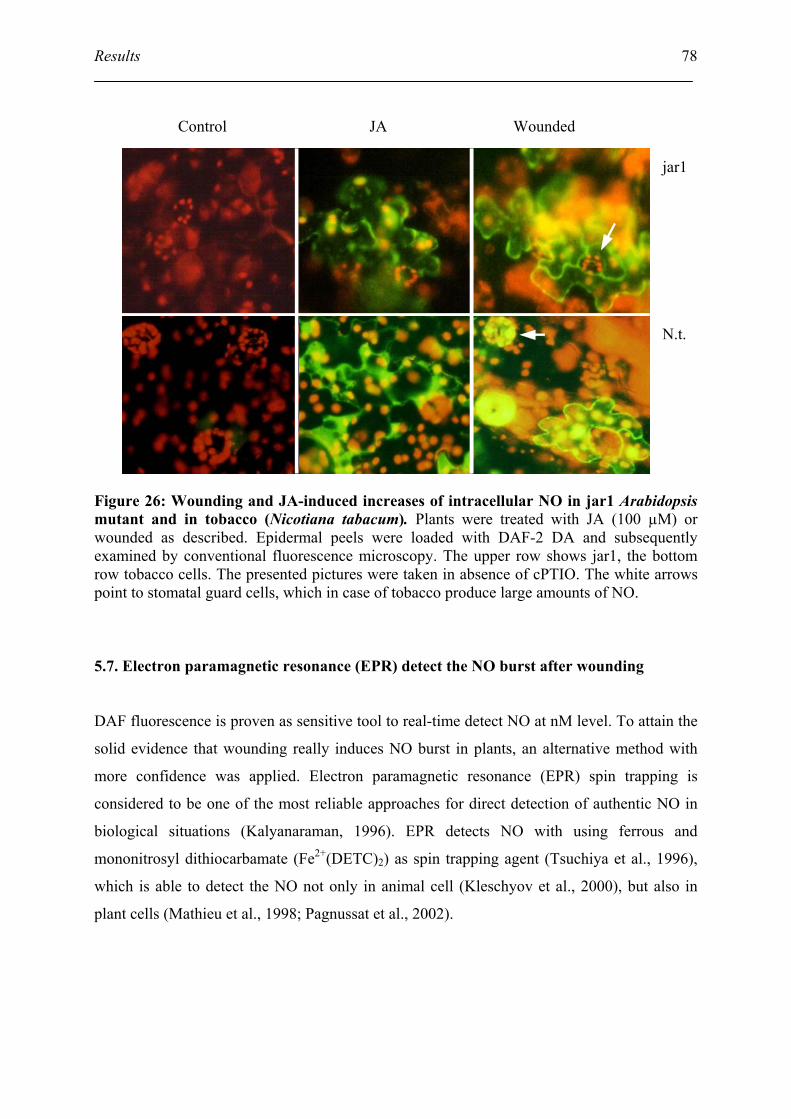
Results
78
Figure 26: Wounding and JA-induced increases of intracellular NO in jar1 Arabidopsis mutant and in tobacco (Nicotiana tabacum). Plants were treated with JA (100 µM) or wounded as described. Epidermal peels were loaded with DAF-2 DA and subsequently examined by conventional fluorescence microscopy. The upper row shows jar1, the bottom row tobacco cells. The presented pictures were taken in absence of cPTIO. The white arrows point to stomatal guard cells, which in case of tobacco produce large amounts of NO.
5.7. Electron paramagnetic resonance (EPR) detect the NO burst after wounding
DAF fluorescence is proven as sensitive tool to real-time detect NO at nM level. To attain the
solid evidence that wounding really induces NO burst in plants, an alternative method with
more confidence was applied. Electron paramagnetic resonance (EPR) spin trapping is
considered to be one of the most reliable approaches for direct detection of authentic NO in
biological situations (Kalyanaraman, 1996). EPR detects NO with using ferrous and
mononitrosyl dithiocarbamate (Fe2+(DETC)2) as spin trapping agent (Tsuchiya et al., 1996),
which is able to detect the NO not only in animal cell (Kleschyov et al., 2000), but also in
plant cells (Mathieu et al., 1998; Pagnussat et al., 2002).
Control JA Wounded
jar1
N.t.
Results
79
Figure 27: Wounding induces increase of endogenous NO in Arabidopsis plants determined by EPR. (a) Spectrum of NO donor SNP; (b) of controlled plant materials; (c) of controlled plants materials and 2 µM SNP; (d) of the plants materials harvested 30 min after wounding. Spin trapping reagent: 2M Na2S2O4, 3.3 mM DETC, 3.3 mM FeSO4 and 33 mg/ ml BSA.
Incubation of 10 µM NO donor SNP with spin trapping reagent exhibits the characteristic
spectrum features of NO-Fe(DETC)2 signal (Figure 27 a). No large amount, but basal NO
production was detected in untreated plant materials (Figure 27 b). The EPR feature of
control material with 2 µM SNP was largely, but not completely overlapped by EPR feature
of SNP (Figure 27 c). An obvious spectrum peak could be found in all features with plants
materials, which suggest that it is possibly a plant material specific spectrum peak. Wounding
induced endogenous NO burst was detected by EPR in wounded plants materials with typical
spectrum features of NO-Fe(DETC)2 (Figure 27 d), which verified the detected signal using
the permeable and specific NO-sensitive fluorophore 4,5-diamino-fluorescein diacetate
(Figure 25).
|-------| 10G
(a) NO donor (SNP) (b) Control
(c) Control+2 µM SNP (d) Wounding 30 min
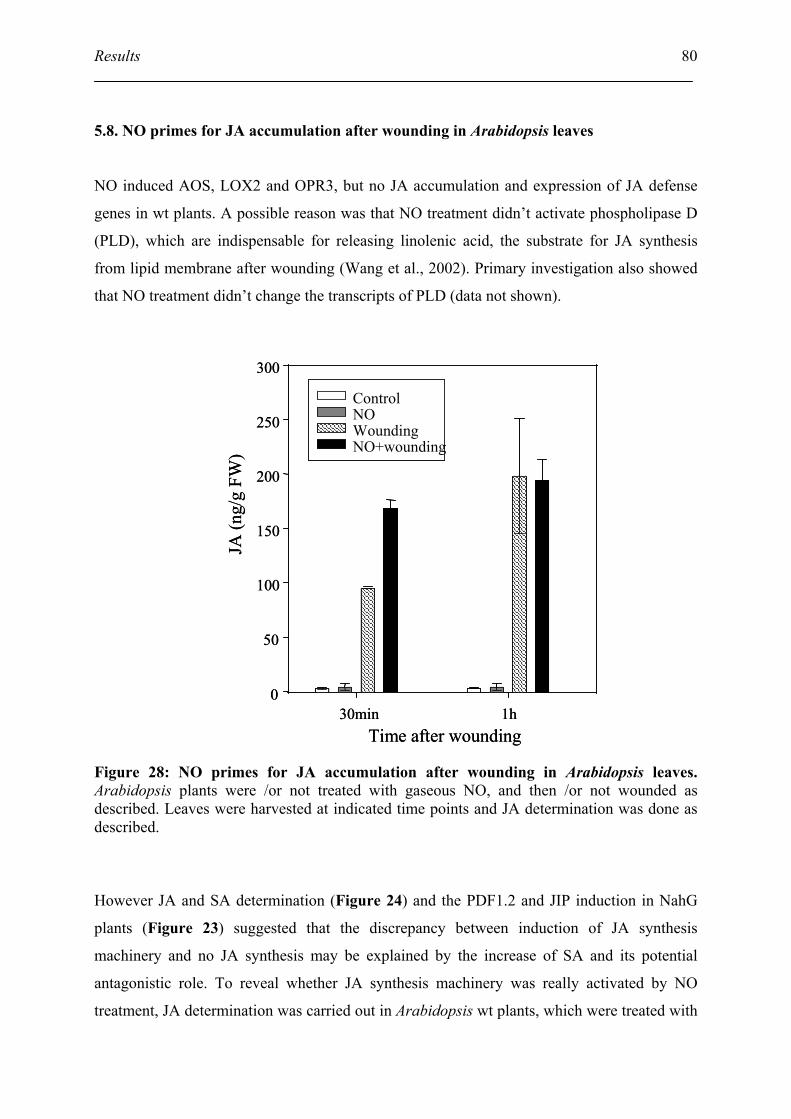
Results
80
5.8. NO primes for JA accumulation after wounding in Arabidopsis leaves
NO induced AOS, LOX2 and OPR3, but no JA accumulation and expression of JA defense
genes in wt plants. A possible reason was that NO treatment didn’t activate phospholipase D
(PLD), which are indispensable for releasing linolenic acid, the substrate for JA synthesis
from lipid membrane after wounding (Wang et al., 2002). Primary investigation also showed
that NO treatment didn’t change the transcripts of PLD (data not shown).
Figure 28: NO primes for JA accumulation after wounding in Arabidopsis leaves. Arabidopsis plants were /or not treated with gaseous NO, and then /or not wounded as described. Leaves were harvested at indicated time points and JA determination was done as described.
However JA and SA determination (Figure 24) and the PDF1.2 and JIP induction in NahG
plants (Figure 23) suggested that the discrepancy between induction of JA synthesis
machinery and no JA synthesis may be explained by the increase of SA and its potential
antagonistic role. To reveal whether JA synthesis machinery was really activated by NO
treatment, JA determination was carried out in Arabidopsis wt plants, which were treated with
Time after wounding30min 1h
JA (n
g/g
FW)
0
50
100
150
200
250
300
ControlNO WoundingNO+wounding
Time after wounding30min 1h
JA (n
g/g
FW)
0
50
100
150
200
250
300
ControlNO WoundingNO+wounding

Results
81
NO, and then wounded 1h later. JA determination showed that NO treatment alone didn’t
induce JA accumulation. However, about 50% more JA accumulation was found in NO
treated and wounded plants than in plants wounded alone at 0.5 h after wounding (Figure 28).
It should be noted that the determination time point precedes the generation of reported
downstream messengers of NO such as SA (Figure 24). Thus NO primes for JA accumulation
after wounding, which suggests that the JA synthesis machinery was at least partly induced by
NO treatment.
Discussion
82
IV. Discussion
Nitric oxide (NO) is a multifunctional effector in numerous mammalian physiological
processes, including the relaxation of smooth muscle, inhibition of platelet aggregation,
neural communication and immune regulation. NO has also been associated with plant
defense responses during microbial attack, and with induction and/or regulation of
programmed cell death. In this work, I will try to reveal which genes could be induced in
Arabidopsis thaliana by NO by using cDNA microarray.
1. DNA microarray
Before the beginning of this work, a working process and related protocols for filter-based
radioactive labeling cDNA microarray have been set up in BIOP by work groups headed by
PD Dr. Anthon Schaeffner and Dr. Dietrich Ernst. What encourages and prompts me to
develop fluorescent labeling microarray were not only health concerns, but also the prominent
advantages of fluorescent microarray.
1.1. Comparision of fluorescent and filter-based microarray
Compared to the macroscopie format of filter-based assays, the miniaturized biochip format
represents a fundamental revolution in biological analysis. One advantage of the chip formats
is that the solid surface is non-porous and thus enables the deposition small amounts of
biochemical material in a precisely defined location. Porous substrates such as nylon and
nitrocelluloses allow diffusion of applied material and are not amenable to microarray
preparation. A non-porous substrate also prevents the absorption of reagents and sample into
the substrate matrix, allowing the rapid removal of organic and fluorescent compounds during
biochip fabrication and use. A non-porous surface permits the use of small sample volumes,
enabling high sample concentrations and rapid hybridization kinetics. A solid substrate also
provides uniform attachment surface, which increases the quality of the array elements. The
inherent flatness of the microarray format permits true parallelism, which is lacking in all
filter-based assays. Parallel analysis provides a significant increase in the accuracy of the
assay data (Schena et al., 1996).
Discussion
83
1.2. The nonlinearity in cDNA microarray expression measurements
Nylon membrane microarrays are hybridized with 32P or 33P-labeled cDNA targets, and the
microarrays on glass are hybridized with fluorescent dye-labeled cDNA targets. After
hybridization the radioactive or fluorescent signal intensities are measured using a
phosphorimager or laser scanner, respectively. The signal intensities are surrogates for the
expression levels of the genes in the samples under testing and are used to make biological
interference. A key assumption in analysis of microarray data is that the quantified signal
intensities are linearly related to the expression levels of the expression levels of the
corresponding genes. At facts, both of the microarrays systems are not linearly. The first,
which led to discrepancies in analysis affecting the fluorescent signals, was signal quenching
associated with excessive dye concentration. The second, affecting the radioactive signals,
was a nonlinear transformation of the raw data introduced by the scanner. Investigation of two
types of nonlinearities showed that the second one is more troublesome (Ramdas et al., 2001).
1.3. Data analysis and normalization
The probes of nylon membrane microarray are 32P or 33P-labeled cDNA, which have to
hybridize on two different membranes. How to ensure the same cDNA amount on two
membranes is a prominent problem. A favorite strategy is hybridizing the membranes with 32P
or 33P-labeled primer sequence to determinate and to normalize the amount of spotted cDNA
(Thimm et al., 2001). However, the radioactive labeled primer for reference hybridization is
not easily washed off completely, which results in radioactive residue on the membrane. In
fluorescent labeled microarray, two probes (Cy3 and Cy5) can be hybridized to a glass slide
and be detected by scanning with two wavelength (550 and 650 nm), that avoids the
difference of DNA amount between two compared membranes.
As mentioned in Methods and Results, normalization is a key step in data analysis. Because
NO is a multiple regulator of gene induction and NO-regulated genes are still less known, it is
impossible to designate reference genes for NO treatment. Total fluorescence intensity was
applied to data normalization. The shortcoming of this normalization is in bold relief. On the
one hand, the 330 genes chosen for the experiments are not randomly selected, because I pay
my attention on stress genes. On the other hand, the amount of genes is not large enough to
ensure the up- and down- regulation in an approximate balance. The array results have
Discussion
84
confirmed this consideration not surplus. Most of NO induced genes are up- regulated
(Tables 2 and 3). I would suggest for future array analyses of NO treatment, to choose the
control genes for normalization from Table S2 and S3, which show lower regulation by NO
treatment.
1.4. Confidence of the fluorescent labeling cDNA microarray
The filter-based radioactive labeling and glass-based fluorescent labeling cDNA microarrays
were compared and the advantages of glass-based array were discussed. However, the most
concerned is the confidence of the results. Fluorescent labeled arrays were introduced in
BIOP for the first time, for which reason its reliability was payed much attention to. To ensure
the confidence of the result, a strict standard was used for data analyses (see Methods) and a
high number of northern blots were applied to verify the array results (Figures 7, 11, 17, 19,
20, and 22). All northern blots confirmed the results obtained by microarray analyses. Solid
evidences indicated that the arrays data are reliable.
2. Microarray analyses of gene regulation by NO
The basic research strategy of this work could be drawn by an “input” and “output” system.
NO treatment was designated as the “input” factor. Plants or cell culture react to treatment by
changing their gene expression levels, which were revealed by microarrays analysis. As
“output” information, transcription changes indicate the hints of plant physiological and
biochemical regulation. NO treatment initiated important and dynamic changes in gene
expression. In this study, cDNA microarrays identified a number of Arabidopis genes for
which I was unable to find reports of NO induction in the literature. The data also confirmed
previous studies of other genes for which activation by NO was described (Durner et al.,
1998). In response to NOR3 and gaseous NO, the transcript levels for many genes increased
to maximum values 1 to 3h after treatment and then began to subside toward the baseline
(Figures 6 and 16). The gene induction pattern in the suspension cell system was obviously
different from that in the plant system.
Discussion
85
2.1. Gene induction after NOR3 treatment in suspension cells
Table 2 exhibits all NO induced genes in suspension cells, which were revealed by DNA
microarrays. DNA microarrays proved itself a high throughput vehicle for the exploration of
gene expression profile.
Among the most interesting induced genes are several genes encoding for pathogenesis-
related proteins (e.g. beta-1, 3-endoglucanase, and pre-hevein-like protein) and a number of
enzymes involved in antioxidant processes (e.g. Glutathione peroxidase, catalases and GSTs).
These inductions are interesting but not surprising. NO plays a key role in defense gene
induction (Durner et al., 1998) and these antioxidant gene are important components in
connection with reactive oxygen species (ROS). NO and ROS have important roles in the
activation of defense responses against pathogen attack (Beligni and Lamattina, 2001;
Bolwell, 1999; Durner and Klessig, 1999). The induction of pathogenesis-related genes by
NO treatment implied that NO is an upstream signal for many defense genes. Coordinated
induction of so many redox-related genes suggests that NO is involved in the complex redox
regulation system in cell culture.
Metallothionein (AtMt1) and blue copper binding protein are another interesting NO induced
gene group. Metallothionein is an important heavy metal-binding ligands and plays a key role
in heavy metal detoxification and homeostasis in plant cells (Cobbett, 2002). Blue copper
binding protein is an aluminum (Al) induced gene (Richards et al., 1998) and its induction
ameliorate Al toxicity in Arabidopsis (Ezaki et al., 2001). As described in section
Introduction, one of NO’s functional chemical basics is that NO reacts with transition
metals, which leads to the formation of metal-nitrosyl complexes and subsequent conversion
of protein activity.
AP2 domain containing protein RAP2.5 (AtERF4) belongs to AP2/EREBP family of
transcription factors. Proteins of this family contain a plant-unique DNA-binding domain
called the AP2 domain, so named because it was first found in the Arabidopsis protein AP2
(APETALLA2) (Jofuku et al., 1994). In tomato, transcription factors of AP2/EREBP family
(Pti4, Pti5, and Pti6) activate defense responses when they are expressed in Arabidopsis (Gu
et al., 2002). AP2 element induction by NO may imply that NO possibly regulates the gene
induction through AP2 family transcription factors.
Discussion
86
2.2. Gene induction by gaseous NO treatment in plants
The identical microarray has been used to analyze the gene induction in wt, NahG and jar1
plants. The use of the jar1 and NahG mutants yielded several broad categories of NO-
inducible genes (Figure 18). It is important to note that a gene defined as jar1- or NahG-
dependent or -independent in this study might be controlled differently under other conditions,
and I used these several categories only for the present study. Use of NahG transgenic plants
and jar1 mutant enabled us to insight which gene inductions are SA- or JA-signaling
dependent, thereby make it possible to sort out the route of NO signaling.
Venn diagram analyses indicate the gene expression pattern in wt and mutants plants. The
expression of many genes is obviously altered by a direct or indirect effect of the loss of a
functional jar1 gene or of expression of NahG gene. Concretely, the category of NahG-
independent genes contains genes that were induced both in wild-type and NahG plants (e.g.
AOS, AOX1a). Some genes were induced in NahG, but not in wt plants (e.g. PR1, MAP
kinase). Some genes were induced only in NahG, but not in wt plants (e.g. PDF1.2. and
jasmonate induced gene). The similar categories can also be found in jar1 mutant (e.g. PR2
and PR5 are only induced in jar1). Furthermore, some genes were induced in NahG and jar1,
but not in wt plants (e.g. salt-tolerance zinc finger protein and arginine decarboxylatase
SPE2), whereas, some genes were only induced in wt plants (e.g. calmodulin 3). These results
merit further attention because they indicate that jar1 or NahG might play subtle roles as a
positive or negative regulator of other signal pathways controlling NO-inducible gene
expression. The different induction profiles by NO treatment in NahG and jar1 plants also
imply the direct or indirect effects of SA and/or JA signals on NO signaling.
Next to the signaling-dependent arrangement, NO-induced genes could be classified into
several categories by their physiological function (Table 4). Similar as described in
suspension cell analysis (section IV 2.1), many defense genes and redox relative genes were
also induced in plants by NO treatment, which implied the same meaning that NO plays a key
role in plants defense response and that NO participates in redox regulation.
The list of NO-induced genes contains many previously reported genes. Besides PR1 (Durner
et al., 1998; Huang et al., 2002), the induction of nitrate reductase (NaR) by NO is consistent
with early report in tomato (Murray and Wellburn, 1985). Another important NO inducible
plant defense gene is phenylalanine ammonia lyase (PAL) (Durner et al., 1998), which was
not induced in my experiment. A possible explanation may be the different treatment
Discussion
87
conditions, or too strict analyses standards which neglected the induced gene due to its weak
signal intensity.
Interestingly, the transcript levels of NPR1 (Table 3) was induced in wt and NahG plants but
not in jar1 plants. NPR1 gene has been implicated in the signaling pathway that leads to
resistance against bacterial and fungal pathogens (Cao et al., 1997). Another interesting NO
induced gene is calmodulin 3. A vast amount of cellular responses to external stimuli in
eukaryotes involve second messenger Ca2+ signals. Transducing these signals, integrating
their effects with those of other signaling pathways, and maintaining a homeostatic balance of
Ca2+ to minimize its cytotoxic effects are initiated by a specialized group of cellular proteins,
the EF-hand calcium-modulated proteins. Calmodulin (CaM) is the most widely distributed
member of this protein family and is thought to be a primary intracellular Ca2+ receptor in all
eukaryotes. The hallmark of CaM’s mechanism of action is that it transduces second
messenger Ca2+ signals by binding to and altering the activity of a variety of other proteins
(Zielinski, 1998). CaM is also important cofactor for either mammalian or plants NOSs.
Activity of constitutive NOSs is strictly dependent on the elevation of intracellular free Ca2+
and resultant binding of the Ca2+-CaM complex (see Introduction 2.1). Moreover, NO has
been proposed to induce defense response through a Ca2+ dependent second messenger
pathway (Durner and Klessig, 1999). Up-regulation of CaM 3 by NO is either NahG or jar1
dependent (Table 3) and Northern blot also verified the array results (Figure 17). This
finding confirms that NO is involved in Ca2+ regulation possibly through control calmodulin
gene expression.
Another interesting group of genes encoding for enzymes responsible for JA synthesis
(FAD7, LOX2, and AOS) are coordinately induced by NO treatment (Table 4). Moreover, JA
downstream gene such as defensin (PDF1.2), vegetative storage protein (VSP), jasmonate
inducible protein, were induced in NahG plants, but not in wt plants. All these results implied
the subtle role of NO in the complex correlation with JA and SA signaling. Additionally, the
concerted induction of a metabolic cassette implies tight control of expression among genes
with potentially related functions and opens the door for further studies using other
biochemical and physiological methods (further discussion see section IV 4).
Discussion
88
2.3. Comparison of NO-dependent gene induction in suspension cells and in plants
Tables 2 and 3 show the gene induction by NO in suspension cells and in plants, respectively.
The two biological systems show different gene expression profile after NO treatment. The
gene induction in cell culture indicates intracellular, rather than intercellular signaling. NO is
known as a freely diffusible inter- and intracellular messenger produced by a variety of
mammalian cells (Aslan and Freeman, 2002) and no evidences indicate that NO is only a
intracellular signal in plants. To study NO’s intercellular role, transcripts analysis in whole
plants is indispensable. In order to clarify which gene inductions are induced in cell culture
alone and which gene inductions are intercellular signaling dependent, the NO induced genes
in suspension cells and in plants (wt) were divided into three groups: (1) genes induced in cell
cultures and plants, (2) only in cell culture, and (3) only in plants (Table 5).
The different expression patterns are possibly due to distinct manner of NO treatments (NO
donor and gaseous NO). However, difference of expression pattern in cell culture and in
plants may reflect the intracellular- and/or intercellular-signaling dependency. The arranged
data show that most of the genes induced both in cell culture and in plants are redox
regulation related (e.g. GSTs, peroxidase, and AOX1a). Evidently, some other redox related
genes are induced only in plants or in cell culture.
The inductions of defense genes are also scattered. Some of them (pre-hevein-like protein,
bata-1, 3-glucanase-like protein, blue copper binding protein) are induced both in cell cultures
and plants, whereas, defense-related protein and non-race specific disease resistant protein
were induced in plants and beta–glucanase 3 was induced in cell culture. This phenomena
suggest that some defense genes and redox related genes seem to be intracellular inducible
and some of them are intercellular signaling required.
Interestingly, AOS was induced in cell culture and in plants, whereas LOX2 and FAD7 were
only induced in plants, which implies that the genes in the same signaling pathway may be
regulated in a different manner. One could be regulated by intracellular pattern, whereas
others by intercellular pattern. The different expression profiles may also be explained by
different manner of NO treatment.
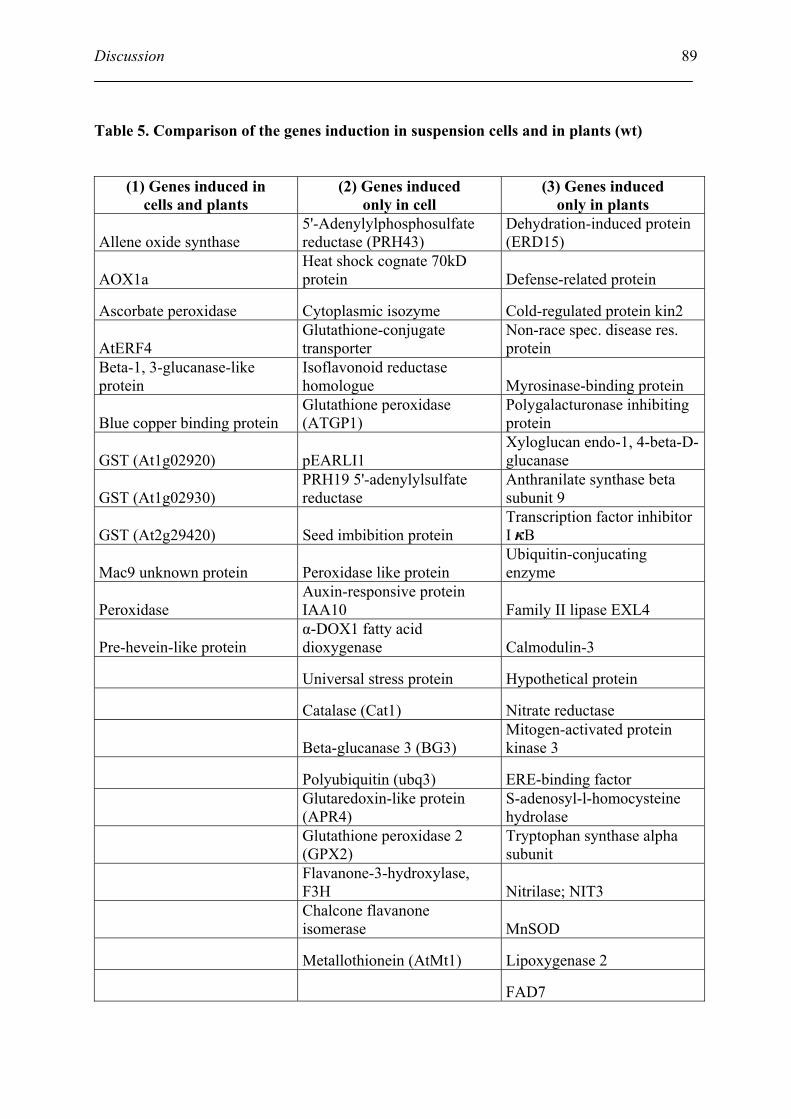
Discussion
89
Table 5. Comparison of the genes induction in suspension cells and in plants (wt)
(1) Genes induced in cells and plants
(2) Genes induced only in cell
(3) Genes induced only in plants
Allene oxide synthase 5'-Adenylylphosphosulfate reductase (PRH43)
Dehydration-induced protein (ERD15)
AOX1a Heat shock cognate 70kD protein Defense-related protein
Ascorbate peroxidase Cytoplasmic isozyme Cold-regulated protein kin2
AtERF4 Glutathione-conjugate transporter
Non-race spec. disease res. protein
Beta-1, 3-glucanase-like protein
Isoflavonoid reductase homologue Myrosinase-binding protein
Blue copper binding protein Glutathione peroxidase (ATGP1)
Polygalacturonase inhibiting protein
GST (At1g02920) pEARLI1 Xyloglucan endo-1, 4-beta-D-glucanase
GST (At1g02930) PRH19 5'-adenylylsulfate reductase
Anthranilate synthase beta subunit 9
GST (At2g29420) Seed imbibition protein Transcription factor inhibitor I B
Mac9 unknown protein Peroxidase like protein Ubiquitin-conjucating enzyme
Peroxidase Auxin-responsive protein IAA10 Family II lipase EXL4
Pre-hevein-like protein α-DOX1 fatty acid dioxygenase Calmodulin-3
Universal stress protein Hypothetical protein
Catalase (Cat1) Nitrate reductase
Beta-glucanase 3 (BG3) Mitogen-activated protein kinase 3
Polyubiquitin (ubq3) ERE-binding factor
Glutaredoxin-like protein (APR4)
S-adenosyl-l-homocysteine hydrolase
Glutathione peroxidase 2 (GPX2)
Tryptophan synthase alpha subunit
Flavanone-3-hydroxylase, F3H Nitrilase; NIT3
Chalcone flavanone isomerase MnSOD
Metallothionein (AtMt1) Lipoxygenase 2
FAD7
Discussion
90
3. Identification the role of alternative oxidase (AOX1a) as NO counteracting principle
Most of the work on NO action in plant cells has focused on its ability to act in the same
direction as reactive oxygen species (ROS). This concept explains NO participation in the
hypersensitive response (Van Camp et al., 1998), and in the regulation of the expression of
defense genes (Delledonne et al., 1998). However, in animals, where knowledge about NO
biochemistry is more advanced than in plants, a toxic or protective role for NO has been
widely described (Lipton et al., 1993). The presence of an unpaired electron within the NO
molecule makes it a reactive species, and is also the origin of its duality. The combination of
NO with ROS is described as either toxic or protective, depending on the circumstances
(Beligni and Lamattina, 1999a). Induction of AOX1a by NO may relate to ROS and the toxic
effect of NO.
3.1. Detrimental effect of NO
NO features an unmatched diversity of physiological functions and general ubiquity. Under
pathological conditions, high concentrations of NO can be either beneficial (e.g. it activates
defense responses or, together with ROS, it directly kills the pathogen) or detrimental. Among
the deleterious effects are lipid peroxidation, oxidation of tyrosine as well as S-nitrosylation.
Nitrosative stress can be linked to inhibition of cell growth and apoptosis, and thus may be
widely implicated in NO pathogenesis. NO can therefore be considered a double-edged sword
(Eu et al., 2000).
A key contribution to NO’s toxicity and/or signaling properties is the fact that NO is a potent
inhibitor of cellular respiration. NO’s interaction with cytochrome c oxidase has dramatic
biological consequences such as the induction of apoptosis (Brunori et al., 1999). The cause is
not a shut down of respiration per se. In mitochondria, maintaining the ubiquinone pool at low
steady state poise (i.e. avoiding over-reduction) is vital for minimizing the production of
ROS. NO as an inhibitor of the cytochrome oxidase greatly enhances this thread, not only
through inducing higher ROS production, but also because of NO’s direct interaction with
ROS. Many harmful effects of NO are actually mediated by peroxynitrite (ONOO-), which is
formed from NO and O2. (Brüne et al., 1998; Hippeli and Elstner, 1996). Thus, it is no
surprise that not only animal cells, but also Arabidopsis suspension cells react to NO
treatment with induction of an array of antioxidant genes (Table 2). In kidney cells,
Discussion
91
inactivation of glutathione peroxidase (GPX) by NO triggers a signal for inducing GPX gene
expression in cells, thereby restoring the intracellular level of this indispensable enzyme
(Dobashi et al., 2001). Strong induction of GPX, GSTs, glutaredoxins and other antioxidant
genes could be seen. Surprisingly, neither catalases nor SODs were among the strongest
induced genes (Table 2). The results point to a direct interaction between NO and the
glutathione system as described for animals and discussed for plants (Durner and Klessig,
1999; Liu et al., 2001; Stamler et al., 1992).
3.2. The role of AOX in plant physiology
One of the most interesting genes induced by NO is AOX. In addition to enhance ROS
scavenging principles upon NO treatment, plants may be able to reduce ROS-generation via
induction of AOX. The plant cytochrome pathway is as sensitive to NO as its animal
counterpart (Yamasaki et al., 2001). However, in addition to cytochrome oxidase, plant
mitochondria possess AOX. Unlike the cytochrome pathway, which is coupled to oxidative
phosphorylation via proton translocation, electron transport from ubiquinol to AOX is non-
phosphorylating and releases energy as heat. These two terminal oxidases compete for
electrons in plant mitochondria, and can be differentiated by inhibitors such as cyanide (acting
on the cytochrome c oxidase) or SHAM (acting on AOX). Strikingly, it has been reported that
AOX from mung bean and soybean, unlike cytochrome c oxidase, is also resistant to NO.
Consequently, it has been hypothesized that AOX may play a role in the observed nitric oxide
tolerancance of higher plants (Caro and Puntarulo, 1999; Durner and Klessig, 1999; Millar
and Day, 1997; Yamasaki et al., 2001). Figure 29 represents the plant respiratory chain in
inner mitochondrial membrane and the possible role of AOX in maintaining the ubiquinone
pool in a more oxidized state and preventing the generation of reactive oxygen radicals during
nitrosative damage induced by NO.
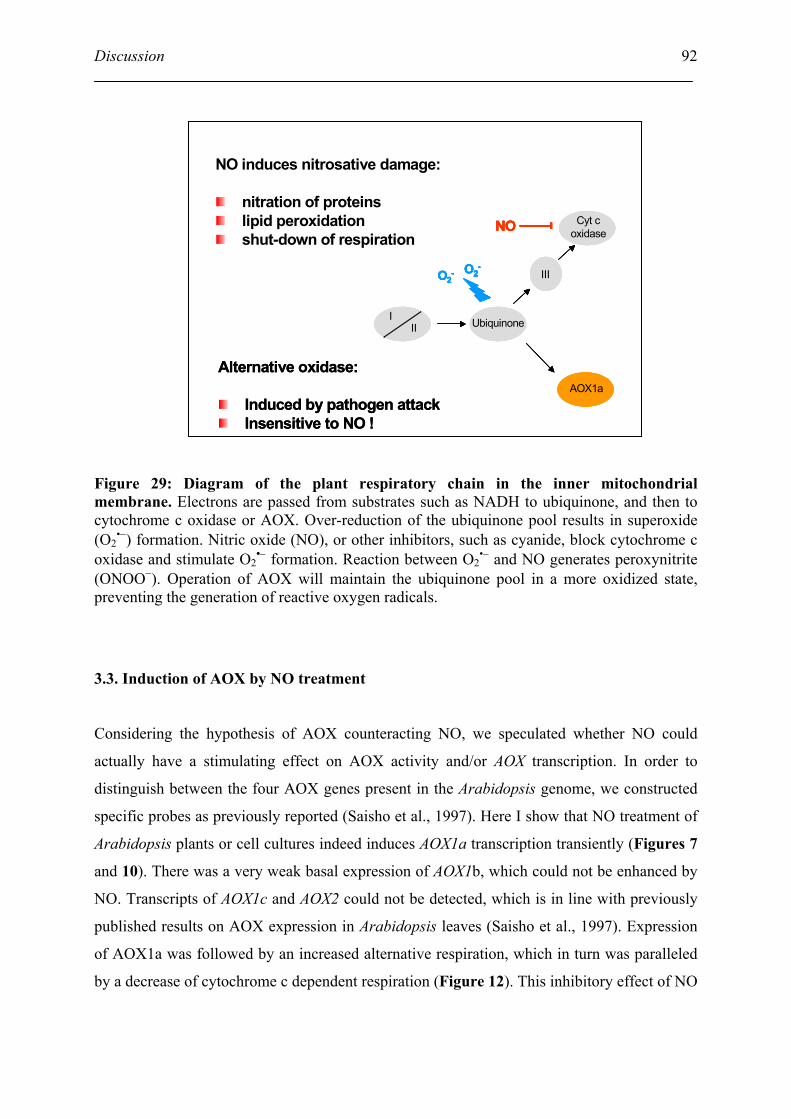
Discussion
92
Figure 29: Diagram of the plant respiratory chain in the inner mitochondrial membrane. Electrons are passed from substrates such as NADH to ubiquinone, and then to cytochrome c oxidase or AOX. Over-reduction of the ubiquinone pool results in superoxide (O2
•−) formation. Nitric oxide (NO), or other inhibitors, such as cyanide, block cytochrome c oxidase and stimulate O2
•− formation. Reaction between O2•− and NO generates peroxynitrite
(ONOO−). Operation of AOX will maintain the ubiquinone pool in a more oxidized state, preventing the generation of reactive oxygen radicals.
3.3. Induction of AOX by NO treatment
Considering the hypothesis of AOX counteracting NO, we speculated whether NO could
actually have a stimulating effect on AOX activity and/or AOX transcription. In order to
distinguish between the four AOX genes present in the Arabidopsis genome, we constructed
specific probes as previously reported (Saisho et al., 1997). Here I show that NO treatment of
Arabidopsis plants or cell cultures indeed induces AOX1a transcription transiently (Figures 7
and 10). There was a very weak basal expression of AOX1b, which could not be enhanced by
NO. Transcripts of AOX1c and AOX2 could not be detected, which is in line with previously
published results on AOX expression in Arabidopsis leaves (Saisho et al., 1997). Expression
of AOX1a was followed by an increased alternative respiration, which in turn was paralleled
by a decrease of cytochrome c dependent respiration (Figure 12). This inhibitory effect of NO
NO induces nitrosative damage:
nitration of proteinslipid peroxidationshut-down of respiration
+SHAM
AOX1a
50 µm
III Ubiquinone
Cyt coxidase
III
NO
O2- O2
-
Alternative oxidase:
Induced by pathogen attackInsensitive to NO !
+SHAM
AOX1a
50 µm
III Ubiquinone
Cyt coxidase
III
NO
O2- O2
-
+SHAM
AOX1aAOX1a
50 µm
III Ubiquinone
Cyt coxidase
III
50 µm
III Ubiquinone
Cyt coxidase
III
NONO
O2- O2
-O2
- O2-
Alternative oxidase:
Induced by pathogen attackInsensitive to NO !
Discussion
93
on cytochrome c oxidase has been described for soybean and mung bean mitochondria (Millar
and Day, 1996; Yamasaki et al., 2001).
We were interested in the signal requirements for the expression of AOX1a. Two lines of
evidence pointed to salicylic acid (SA) as a signal involved in NO-mediated AOX induction:
(i) the suggested cross talk between NO and SA signaling (Durner et al., 1998) and, (ii) SA
has been demonstrated to induce expression of AOX in several plant species including
voodoo lily and tobacco (Lennon et al., 1997; Raskin et al., 1987; Rhoads and McIntosh,
1993). It should be noted, however, that developmental regulation of AOX may not be solely
dependent on SA (Lennon et al., 1997; Rhoads and McIntosh, 1992). To elucidate the
potential participation of SA in AOX induction, I used Arabidopsis mutants which are not
able transduce SA signals (pad4 or npr1) or a transgenic plant that degrades any
endogenously produced or applied SA (NahG). However, neither the SA signaling mutations
pad4 and sai1, nor the presence of NahG gene did influence NO induction of AOX (Figure
11). These data suggest that NO induces AOX1a independently of SA. These results are in
line with recent data on expression activation of AOX1a in Arabidopsis after Pseudomonas
infection, which has been found to be independent of SA (Simons et al., 1999). It has been
suggested that at least the coarse control of AOX1a seems to be directly connected to
mitochondrial respiration, i.e. inhibition of cytochrome c respiration. How the status of
mitochondrial respiration is perceived and transformed into AOX1a transcription and
increased alternative respiration is unknown (Vanlerberghe and McIntosh, 1997).
3.4. The biological context of NO- induction of AOX
What might be the biological context in which NO-induction of AOX plays a role? In general,
the alternative pathway may dampen the generation of active oxygen species during periods
of rapid respiration (Maxwell et al., 1999). A most critical situation seems to be inhibition of
respiration through NO, resulting not only in enhanced ROS pressure, but in simultaneous
presence of NO and ROS. Most recently the combined action of NO and ROS during
induction of cell death in soybean cells has been demonstrated (Delledonne et al., 2001). It
has been suggested that such a scenario requires active AOX to maintain cellular function
(Millar and Day, 1997) and Figures 13, 14 and 15 demonstrate that while Arabidopsis cell
suspensions can handle NO pressure or AOX inactivation, they don’t tolerate NO without
AOX. I am aware of the limits of pharmacological approaches. SHAM as well as other
inhibitors such as n-propyl gallate may inhibit other enzymes involved in redox regulation
Discussion
94
and/or alter the redox balance of the cell. On the other hand, I use AOX inhibitors within the
documented concentration ranges, and without simultaneous application of NO no change in
cell death or gene induction could be observed (Figure 13).
Conditions where NO is overproduced are nitrogen assimilation and pathogen attack. NO is a
byproduct of assimilatory nitrogen metabolism, and NO production has been linked to the
accumulation of NO2 which is converted to NO by nitrate reductases or related enzymes
(Kaiser and Huber, 2001; Stöhr et al., 2001; Yamasaki et al., 2001). AOX is closely linked to
nitrate assimilation and, in Chlamydomonas reinhardtii, AOX was first identified as a nitrate
assimilation gene (Nar5) (Quesada et al., 2000). AOX is resistant to NR-produced NO,
supporting the hypothesis that AOX can play an important role in avoiding ROS accumulation
during nitrate assimilation (Yamasaki et al., 2001).
AOX is also frequently induced during plant-pathogen interactions and plant defense, a
situation in which NO is produced and plays an important role (Clarke et al., 2000; Corpas et
al., 2001; Delledonne et al., 1998; Durner et al., 1998; Pedroso et al., 2000). NO is involved in
cell death and defense gene activation where it acts together with ROS (Delledonne et al.,
2001). The participation of peroxynitrite in plant defense and/or cell death has been shown
(Alamillo and García-Olmedo, 2001). Others, however, reported on a protective role of NO
counteracting ROS (Beligni and Lamattina, 1999b). AOX induction is coupled to plant
defense, at least in many cases (Chivasa and Carr, 1998; Chivasa et al., 1997). Infection of
Arabidopsis with Pseudomonas syringae pv tomato resulted in enhanced expression and
activation of the AOX (Simons et al., 1999). After TMV infection of tobacco, AOX protein
increased significantly (although electron-flow partitioning did not) (Lennon et al., 1997).
AOX seems to play a role in containment of lesions and control of initial plant defense
reactions (Chivasa and Carr, 1998). In all these cases, the induction of AOX seems be an
integral part of defense responses. NO seems to be a good candidate for AOX induction. The
balance between ROS generated in mitochondria and NO might be an important factor in cell
death induction, and together with the induction of antioxidant genes (Table 2), NO-regulated
AOX1a induction might be part of NO’s redox-regulating properties.
In conclusion, NO and ROS play important roles in animal immunity and pathogenesis. A
growing body of evidence suggests that NO and ROS also control plant development, growth
and pathogen resistance. While many targets and/or effector molecules of NO might be
identical in animals and plants, only plants counteract NO through the induction of AOX
genes. NO-induced AOX induction might play a role during situations of enhanced NO-
production such as nitrogen assimilation and pathogen attack. Ironically, AOX is found not

Discussion
95
only in plants, but also in plant and animal pathogens such as Trypanosoma brucei,
Plasmodium falciparum and Septoria tritici (Chaudhuri and Hill, 1996; Clarkson et al., 1989;
Joseph-Horne et al., 2001). AOX in parasites or fungi may be important for the ability of the
pathogens to avoid the host’s NO-mediated immune response (Millar and Day, 1996).
Discussion
96
4. Identification the role of NO in JA signaling pathway
4.1. Plants defense signaling pathways
SA has long been known to play a central role in plant defense response against pathogens.
SA levels increase in plant tissue following pathogen infection, and exogenous application of
SA results in enhanced resistance to a broad range of pathogens (Ryals et al., 1996). SA is
required for SAR. But characterization of SAR in a variety of plant species has suggested the
existence of a complex signaling network that involves many factors affecting various aspects
of general disease resistance. It has become evident that SA-mediated SAR is not the only
pathway that can lead to broad-spectrum disease resistance. Besides SA-mediated SAR, both
jasmonic acid (JA) and ethylene have been shown to be important for these alternative
responses, e.g. against wounding and insect attack (Doares et al., 1995). The wounding-
induced octadecanoid pathway results in the synthesis of signal molecule JA and subsequent
activation of defense gene (e.g. proteinase inhibitor gene) (León et al., 2001; Schaller, 2001).
The role of ethylene in plant defense is somewhat controversial as it contributes to resistance
in some interaction (Norman-Setterblad et al., 2000; Thomma et al., 1999) but promotes
disease production in others (Bent et al., 1992; Hoffman et al., 1999; Lund et al., 1998). JA
and ethylene signaling pathway are both required for induction of induced systemic resistance
(ISR) (Pieterse and Van Loon, 1999).
4.2. Interaction of plants defense signaling pathways
Plant defense responses are regulated through a network of signaling pathways that are known
to involve at least three endogenous plant signaling molecules: SA, JA and ethylene. There is
growing body of literature suggests that these signaling pathways do not function
independently. Rather, they are involved in a complex signaling network in which the
different pathways influence each other through positive and negative regulatory interactions
(Kunkel and Brooks, 2002). The cross-talk between signaling pathways leading to inducible
defense gene expression has been and is still a topic of intense research. The regulators SA,
JA and ethylene affect and control each other. The well known example is the mutual
antagonistic relationship between SA and JA pathways. Aspirin and related hydroxybenzonic
acids inhibit wound response and wound-induced gene expression in tomato plants (Doherty
Discussion
97
et al., 1988; Pena-Cortés et al., 1993). Studies in tobacco reveal that JA inhibits the expression
of SA-defendant genes (Niki et al., 1998). This antagonistic action has been proposed to be
central to the plant’s ability to fine-tune the induction of plant defenses in response to
different plants pest and pathogens (Kunkel and Brooks, 2002). There is also limited evidence
for positive interaction between the SA and JA signaling pathway. Results from early
experiments with tobacco indicate that SA and JA act synergistically to induce PR1b
expression (Xu et al., 1994).
4.3. The role of NO in JA signaling pathway
JA and SA are now regarded as global signals for defense gene activataion (Reymond and
Farmer, 1998). Another current opinion is that SA and ethylene activate the cell death
pathway induced by microbial attack or abiotic stress such as ozone, and that JA is necessary
for proper lesion containment and modulation of SA-mediated cell-death. It has been
suggested that NO and ROS play a major regulatory and/or executive role in these cell death
events (McDowell and Dangl, 2000; Van Camp et al., 1998). ROS and JA are also
messengers in wound responses. In tomato, H2O2 generated in response to wounding can be
detected at wound sites and in distal leaf veins within 1 hr after wounding (Orozco-Cárdenas
and Ryan, 1999). The close interaction of NO with defense-associated ROS induced by
microbial attack prompted us to ask for a possible cross-talk of NO with wounding and JA
signaling. My data obviously extent the field of vision of NO’s role in wounding and JA
signaling pathway.
4.3.1. Wounding induces NO burst in plants
First, using NO sensitive fluorophore DAF-2 DA in conjunction with confocal laser scanning
microscopy, the NO burst was detected in epidermal cells of wounded Arabidopsis and
tobacco leaves. This observation was verified by electron paramagnetic resonance (EPR)
analysis (Figure 27). The kinetic of NO production was similar to an elicitor-induced NO
burst in tobacco or mechanical stress of various gymnosperms (Foissner et al., 2000; Pedroso
et al., 2000). Thus, the induction of NO seems to be an extremely early wounding response.
While H2O2 generated in response to wounding can be detected at wound sites and in distal
leaf veins of tomato within 1 hr after wounding, the response maximizes at about 4-6 hr in
both wounded and unwounded leaves, and then declines. The time course of wound-inducible
Discussion
98
H2O2 in Arabidopsis thaliana leaves was similar to that found in tomato (Orozco-Cárdenas
and Ryan, 1999). Since methyl jasmonate (MJ) as well as JA-inducing signals such as
systemin, chitosan, and all induce the accumulation of H2O2 in leaves (and possibly also NO),
we asked whether JA treatment could trigger the NO burst. JA treatment resulted in strong
NO production, even in mutants defective in JA signaling (Figures 25 and 26). NO
production as response to wounding is not limited to Arabidopsis, but can be also observed in
tobacco (Figure 26), and possibly other plants species.
4.3.2. NO induced JA signaling related genes
To elucidate NO’s integration into or interaction with known signaling pathways (namely SA
and JA signaling), gene expression dynamics in NO treated Arabidopsis thaliana plants were
studied by using a bouquet array that included about 330 defense-related genes.
In wild-type plants, NO induced (not unexpectedly) several pathogenesis-related proteins and
an array of anti-oxidant genes (Tables 3 and 4). The strong influence on the redox-regulating
systems might be due to the fact that many harmful effects of NO are actually mediated by
peroxynitrite (ONOO-), which is formed from NO and O2. (Brüne et al., 1994; Hippeli and
Elstner, 1996). Strong induction of ascorbate peroxidase, SOD’s, and many GSTs could be
found.
One of the most interesting genes induced by NO was allene oxide synthase (AOS). AOS is of
particular importance in biosynthesis of JA. The enzyme catalyzes the first reaction specific to
the pathway, the dehydration of 13(S)-hydroperoxylinolenic acid to 12,13-epoxy-linolenic
acid. AOS transcript levels as well as AOS polypeptide levels rise after mechanical
stimulation, elicitation or wounding (Schaller, 2001). Thus, AOS is regarded as a central point
of control of the octadecanoid biosynthetic pathway. In addition, NO did also induce
lipoxygenase, LOX2, which is also involved in the wound-induced biosynthesis of JA
(Schaller, 2001). However, induction of AOS (and LOX2) during wounding does not depend
on NO (Figure 21). NO does not seem to be a key player during wounding responses, but a
modulator (see below).
Surprisingly, despite the strong activation of the biosynthetic enzymes for jasmonates typical
JA-inducible genes such as defensins or JIP’s were not induced in wild-type Arabidopsis.
Although cDNA arrays have become a robust and reliable tool, transcript accumulation of
AOS, LOX2, PDF1.2 and JIP were monitored by Northern analysis. The Northern results
confirmed the array data: no PDF1.2 and JIP despite high levels of AOS, LOX2 (Figures 19,
Discussion
99
20 and 23). Analyses of signaling molecules in NO treated Arabidopsis provided a likely
answer. NO treatment did not result in elevated JA levels (Figure 24). These results are
consistent with published data that suggested, it was that the output of the jasmonate pathway
appears to be strictly limited by substrate availability. Overexpression as well as knock-outs
of AOS do not alter the basal level of JA in unwounded plants (Laudert et al., 2000; Park et
al., 2002). In my hands, NO-treatment did not alter the expression of phospholipase (D), the
key enzyme feeding lipids into the LOX2/AOS pathway. It was speculated that rather than
inducing JA itself, NO might prime plants for faster JA production and/or JA-dependent gene
induction. In preliminary experiments, NO-treated plants showed a only a slightly faster JA
accumulation after wounding. The biological significance of such a priming effect remains to
be determined.
4.3.3. SA plays a role in inhibition of JA synthesis
In addition to substrate limitation, JA biosynthesis seems to be under control of other factors
such as SA. The relationship between the SA and the JA/ethylene defense response pathways
is not well understood. Some studies have demonstrated that these signals work
synergistically to induce defense responses. However, other evidence suggests that these
pathways function antagonistically (Farmer et al., 1998; Glazebrook, 2001). Plants responding
to a given pathogen usually do not activate both SA-associated and JA/ethylene-dependent
defenses. SA and JA have been shown to antagonize the activation of each other's defense
responses, and SA can inhibit JA biosynthesis (Doares et al., 1995). Both pathways share
signaling components that are involved in the positive and/or negative cross-regulation of their
activities (Glazebrook, 2001; Van Loon et al., 1998). Since NO has been shown to induce SA
biosynthesis in tobacco (Durner et al., 1998), I was interested in whether NO-treatment was
activating SA biosynthesis in Arabidopsis. Figure 24 demonstrates a significant increase of
SA in plants exposed to NO. Furthermore, NO-treatment of NahG plants resulted in activation
of PDF1.2 and JIP (Figure 23). These result are in contrast to observation made in tomato,
where NO was still effective in proteinase inhibitor suppression after wounding even in NahG
plants and where NO did not elevate endogenous SA levels of wild-type plants (Orozco-
Cárdenas and Ryan, 2002). On the other hand, there are several reports on principal
differences of signals involved in wounding responses between Arabidopsis and solanaceae
(León et al., 2001; Ryan, 2000). In addition, Ryan and coworkers fed SNP through petioles of
tomato, a compound that releases a downstream product of NO with different modes of
Discussion
100
action, nitrosonium anion (NO+) (Wendehenne et al., 2001). It is certainly possible, that
nitrosonium acts as an antioxidant as suggested for other experimental systems (Beligni et al.,
2002). If this is the case, NO (or NO+) could suppress the H2O2-induced activation of
proteinase inhibitor genes as suggested (Orozco-Cárdenas and Ryan, 2002). Nevertheless,
these data confirm that NO is a negative regulator of JA-responsive genes such as defensins,
albeit through a different mechanism, namely elevated levels of SA. Considering the
pleiotropic nature of NO in biological systems, additional mechanisms (apparently operative
in tomato) cannot be excluded.
4.3.4. Cross-talk among NO, JA-, and SA- signaling
Evidence has been provided for a cross-talk of NO with jasmonate signaling. This interaction
might play a role in two different biological contexts. Several recent publications all
demonstrate the participation of NO or peroxynitrite in programmed cell death, gene
regulation and defense responses during microbial attack (Alamillo and García-Olmedo,
2001; Delledonne et al., 2001). In some hypothetical models H2O2, SA, NO and cell death are
linked in a self-amplifying process, termed the oxidative cell death cycle (Van Breusegem et
al., 2001). If NO regulates the JA/ethylene system, the model of an oxidative cell death cycle
(cell death induced by NO and ROS) needs to be modified. Ethylene, the death-promoting
signal, is downregulated by NO (Figure 24), and JA is regarded to be an inhibitor of cell
death (Beers and McDowell, 2001). If NO works together with ROS towards induction of cell
death, and at the very same time NO has the potential to stimulate the death inhibiting JA
synthesis, NO would occupy a central role in the apoptosis regulating machinery just as
reported for animals.
In case of wounding, NO seems to act as a dual modulator of JA-signaling. NO is certainly no
key player of wound responses (Figure 21). However, I would like to extend the suggestion
of Ryan and coworkers who regard NO as a negative regulator of wound signaling (Orozco-
Cárdenas and Ryan, 2002). To put all results in a good order, NO’s effects on JA signaling
pathway were schematically represented (Figure 30). Both wounding and JA induce a NO-
burst, and NO stimulates AOS, LOX2 and OPR3 activation, which encode the key enzymes
for JA synthesis. Nevertheless, JA defense gene such as PDF1.2 and JIP were not induced by
NO in wt plants, but in NahG plant, suggesting that JA-production is under control of SA.
This hypothesis could be confirmed by the determination of SA accumulation in wt plants,
and JA accumulation in NahG plants but not in wt plants after NO treatment (Figure 24). SA
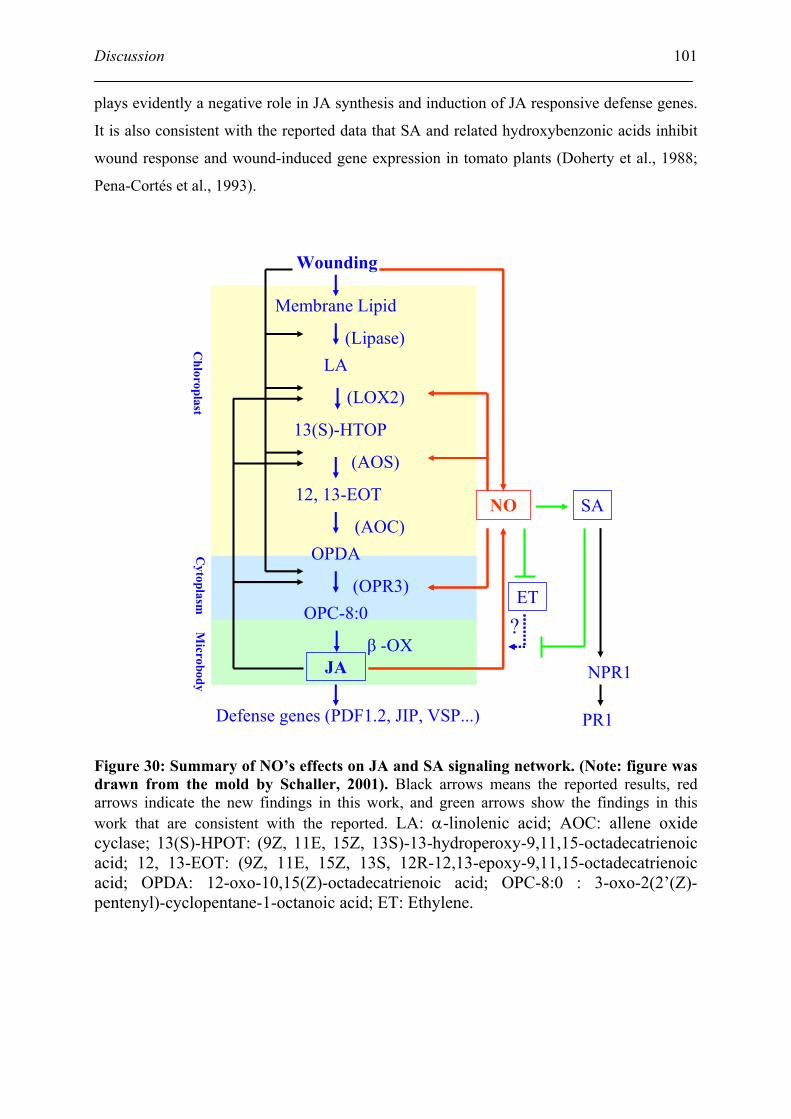
Discussion
101
plays evidently a negative role in JA synthesis and induction of JA responsive defense genes.
It is also consistent with the reported data that SA and related hydroxybenzonic acids inhibit
wound response and wound-induced gene expression in tomato plants (Doherty et al., 1988;
Pena-Cortés et al., 1993).
Figure 30: Summary of NO’s effects on JA and SA signaling network. (Note: figure was drawn from the mold by Schaller, 2001). Black arrows means the reported results, red arrows indicate the new findings in this work, and green arrows show the findings in this work that are consistent with the reported. LA: α-linolenic acid; AOC: allene oxide cyclase; 13(S)-HPOT: (9Z, 11E, 15Z, 13S)-13-hydroperoxy-9,11,15-octadecatrienoic acid; 12, 13-EOT: (9Z, 11E, 15Z, 13S, 12R-12,13-epoxy-9,11,15-octadecatrienoic acid; OPDA: 12-oxo-10,15(Z)-octadecatrienoic acid; OPC-8:0 : 3-oxo-2(2’(Z)-pentenyl)-cyclopentane-1-octanoic acid; ET: Ethylene.
Wounding
Membrane Lipid
(Lipase)LA
(LOX2)
13(S)-HTOP
(AOS)
12, 13-EOT
(AOC)OPDA
(OPR3)OPC-8:0
β -OXJA
Defense genes (PDF1.2, JIP, VSP...)
NO SA
NPR1
PR1
Ch loroplas t
Cytoplasm
Microbody
ET
?
Discussion
102
Considering that the antagonistic action between SA and JA signaling has been proposed to
be central to the plant’s ability to fine-tune the induction of plant defenses in response to
different plants pest and pathogens (Kunkel and Brooks, 2002), NO seems to have dual
effects on JA signaling pathway. On one hand, as Orozco-Cárdenas and Ryan suggested, NO
is a negative regulator of wounding. This negative regulation is very possibly through SA
signaling pathway (Figures 23 and 24). On the other hand, as data shown in this work
(Figures 19, 20 and 22), NO induces JA synthesis machinery. NO seems to be a center factor
of this fine-turning gene regulation, but how does NO exactly exert its effects is still less
known. The discrepancy as observed in different works, e.g. SA accumulation by NO
treatment was observed in tobacco by (Durner and Klessig, 1999) and in Arabidopsis (this
work), but not in tobacco as reported by Orozco-Cárdenas and Ryan (2002), was very
possible due to using different NO sources.
Conclusion
103
V. Conclusion
In the first stage of this work, protocols for fluorescent labeling cDNA microarray were set up
and optimized. The process includes PCR amplification and purification of cDNA, slide
fabrication (spotting and post process), probe cDNA synthesis and fluorescent labeling,
hybridization and post washing, scanning, and data analysis. Using a cDNA microarray
containing 330 stress genes, the transcripts of Arabidopsis suspension cells and plants treated
with NO donor NOR3 and gaseous NO were analyzed, respectively. In response to NOR3 and
gaseous NO, the transcript levels for many genes increased to maximum values 1 to 3h after
treatment and then began to subside toward the baseline. This tendency was visible either on
scatter plots or pseudocolor images. The array data have been proven to be reliable by
northern blots. About 10 % of the tested genes were regulated by NO treatment and almost all
of them are up-regulated. A lot of defense genes and anti-oxidant genes were up-regulated in
suspension cells as well as in plants.
The most interesting gene induced by NO treatment in suspension cell is alternative oxidase
(AOX1a). Only plants possess the alternative respiration pathway with AOX as a terminal
electron acceptor. AOX has been suggested to be barely affected by NO. Data in this work
show that NO affects cytochrome dependent respiration in Arabidopsis thaliana.
Additionally, NO-treatment of Arabidopsis cell cultures strongly induced AOX1a
transcription as determined cDNA microarray and Northern blot analyses. In accordance with
transcript accumulation, NO treatment of suspension cells resulted in increased respiration
through the alternative pathway. Addition of an AOX inhibitor to Arabidopsis cell cultures
resulted in dramatically increased NO-sensitivity and cell death. In sum, these data suggest
that NO induces the AOX1a gene and that AOX may participate to counteract the toxicity of
NO.
Array data reveal that many genes related to JA signaling pathway were regulated by NO
treatment Arabidopsis thaliana plants. Further investigation show, that NO interacts in a dual
way with JA signaling. Real-time imaging by confocal laser scanning microscopy in
conjunction with the NO-selective fluorescence indicator DAF-2 DA uncovered a strong NO
burst after wounding or after treatment with jasmonic acid. Electron paramagnetic resonance
(EPR) data confirmed this finding. The NO-burst was triggered within minutes, reminescent
of the oxidative burst during hypersensitive responses. Expression profiling by cDNA
microarray analyses of NO treated Arabidopsis leaves as well as Northern analyses revealed

Conclusion
104
that NO strongly induces key enzymes of JA biosynthesis such as allene oxide synthase and
lipoxygenase. On the other hand, NO did not induce JA-responsive genes such as defensin.
Gene expression analyses in the JA signaling mutant jar1 as well as in transgenic NahG
plants, together with determination of signaling substances (JA, SA and ethylene) suggested
that NO is a dual modulator of JA signaling. NO can act supportive through activation of
biosynthetic enzymes, and retarding through accumulation of SA, an inhibitor of JA signaling.
In sum, my data show that many genes are responsive to NO treatment, and they provide
some ideas how NO might be integrated within the signaling pathways of plants.
References
105
VI. References
Adams, M. D., Kelley, J. M., Gocayne, J. D., Dubnick, M., Polymeropoulos, M. H., Xiao, H., Merril, C. R., Wu, A., Olde, B., Moreno, R. F., and et al. (1991). Complementary DNA sequencing: expressed sequence tags and human genome project. Science 252, 1651-1656. Alamillo, J. M., and García-Olmedo, F. (2001). Effects of urate, a natural inhibitor of peroxynitrite-mediated toxicity, in the response of Arabidopsis thaliana to the bacterial pathogen Pseudomonas syringae. Plant J 25, 529-540. Alvarez, M. E., Pennell, R. I., Meijer, P.-J., Ishikawa, A., Dixon, R. A., and Lamb, C. (1998). Reactive oxygen intermediates mediate a systemic signal network in the establishment of plant immunity. Cell 92, 773-784. Alwine, J. C., Kemp, D. J., and Stark, G. R. (1977). Method for detection of specific RNAs in agarose gels by transfer to diazobenzyloxymethyl-paper and hybridization with DNA probes. Proc Natl Acad Sci U S A 74, 5350-5354. Aslan, M., and Freeman, B. A. (2002). Oxidases and oxygenases in regulation of vascular nitric oxide signaling and inflammatory responses. Immunol Res 26, 107-118. Barchowsky, A., Klei, L. R., Dudek, E. J., Swartz, H. M., and James, P. E. (1999). Stimulation of reactive oxygen, but not reactive nirtogen species in vascular endothelial cells exposed to low levels of arsenite. Free Radic Biol Med 27, 1405-1412. Barroso, J. B., Corpas, F. J., Carreras, A., Sandalio, L. M., Valderrama, R., Palma, J. M., Lupianez, J. A., and del Rio, L. A. (1999). Localization of nitric-oxide synthase in plant peroxisomes. J Biol Chem 274, 36729-36733. Beers, E. P., and McDowell, J. M. (2001). Regulation and execution of programmed cell death in response to pathogens, stress and developmental cues. Curr Opin Plant Biol 4, 561-567. Beligni, M., and Lamattina, L. (1999a). Is nitric oxide toxic or protective? Trends Plant Sci 4, 299-300. Beligni, M. V., Fath, A., Bethke, P. C., Lamattina, L., and Jones, R. L. (2002). Nitric oxide acts as an antioxidant and delays programmed cell death in barley aleurone layers. Plant Physiol 129, 1642-1650. Beligni, M. V., and Lamattina, L. (1999b). Nitric oxide counteracts cytotoxic processes mediated by reactive oxygen species in plant tissues. Planta 208, 337-344. Beligni, M. V., and Lamattina, L. (2000). Nitric oxide stimulates seed germination and de-etiolation, and inhibits hypocotyl elongation, three light-inducible responses in plants. Planta 210, 215-221.
References
106
Beligni, M. V., and Lamattina, L. (2001). Nitric oxide in plants: The history is just beginning. Plant Cell Environ 24, 267-278. Bellamy, T. C., Wood, J., Goodwin, D. A., and Garthwaite, J. (2000). Rapid desensitization of the nitric oxide receptor, soluble guanylyl cyclase, underlies diversity of cellular cGMP responses. Proc Natl Acad Sci U S A 97, 2928-2933. Bent, A. F., Innes, R. W., Ecker, J. R., and Staskawicz, B. J. (1992). Disease development in ethylene-insensitive Arabidopsis thaliana infected with virulent and avirulent Pseudomonas and Xanthomonas pathogens. Mol Plant Microbe Interact 5, 372-378. Berger, S. (2002). Jasmonate-related mutants of Arabidopsis as tools for studying stress signaling. Planta 214, 497-504. Berk, A. J., and Sharp, P. A. (1977). Sizing and mapping of early adenovirus mRNAs by gel electrophoresis of S1 endonuclease-digested hybrids. Cell 12, 721-732. Bird, A. (1992). The essentials of DNA methylation. Cell 70, 5-8. Bogdan, C. (2001a). Nitric oxide and the immune response. Nat Immunol 2, 907-916. Bogdan, C. (2001b). Nitric oxide and the regulation of gene expression. Trends Cell Biol 11, 66-75. Bolwell, G. P. (1999). Role of active oxygen species and NO in plant defence responses. Curr Opinion Plant Biol 2, 287-294. Brüne, B., Dimmler, S., Molina y Vedia, L., and Lapatina, E. G. (1994). Nitric oxide: a signal for ADP ribosylation of proteins. Life Sci 54, 61-70. Brüne, B., von Knethen, A., and Sandau, K. B. (1998). Nitric oxide and its role in apoptosis. Eur J Pharmacol 351, 261-272. Brunori, M., Giuffre, A., Sarti, P., Stubauer, G., and Wilson, M. T. (1999). Nitric oxide and cellular respiration. Cell Mol Life Sci 56, 549-557. Butt, Y. K., Lum, J. H., and Lo, S. C. (2003). Proteomic identification of plant proteins probed by mammalian nitric oxide synthase antibodies. Planta 216, 762-771. Cao, H., Glazebrook, J., Clarke, J. D., Volko, S., and Dong, X. (1997). The Arabidopsis NPR1 gene that controls systemic acquired resistance encodes a novel protein containing ankyrin repeats. Cell 88, 57-63. Caro, A., and Puntarulo, S. (1999). Nitric oxide generation by soybean embryonic axes. Possible effect of mitochondrial function. Free Red Res 31, 205-212. Chandok, M. R., Ytterberg, A. J., van Wijk, K. L., and Klessig, D. F. (2003). The pathogen-inducible nitric oxide synthase (iNOS) in plants is a variant of the P protein of the glycine decarboxylase complex. Cell 113, 469-482.

References
107
Chang, C., Kwok, S. F., Bleecker, A. B., and Meyerowitz, E. M. (1993). Arabidopsis ethylene-response gene ETR1: similarity of product to two-component regulators. Science 262, 539-544. Chaudhuri, M., and Hill, G. C. (1996). Cloning, sequencing, and functional activity of Trypanosoma brucei brucei alternative oxidase. Mol Biochem Parasitol 83, 125–129. Chen, Y., Kamat, V., Dougherty, E. R., Bittner, M. L., Meltzer, P. S., and Trent, J. M. (2002). Ratio statistics of gene expression levels and applications to microarray data analysis. Bioinformatics 18, 1207-1215. Chen, Y. J., Kodell, R., Sistare, F., Thompson, K. L., Morris, S., and Chen, J. J. (2003). Normalization methods for analysis of microarray gene-expression data. J Biopharm Stat 13, 57-74. Cheong, Y. H., Chang, H.-S., Gupta, R., Wang, X., Zhu, T., and Luan, S. (2002). Transcriptional Profiling Reveals Novel Interactions between Wounding, Pathogen, Abiotic Stress, and Hormonal Responses in Arabidopsis. Plant Physiol 129, 661–677. Chivasa, S., and Carr, J. P. (1998). Cyanide restores N gene-mediated resistance to tobacco mosaic virus in transgenic tobacco expressing salicylic acid hydroxylase. Plant Cell 10, 1489-1498. Chivasa, S., Murphy, A. M., Naylor, M., and Carr, J. P. (1997). Salicylic acid interferes with tobacco mosaic virus replication via a novel salicylhydroxamic acid-sensitive mechanism. Plant Cell 9, 547-557. Clark, D., Durner, J., Navarre, D. A., and Klessig, D. F. (2000). Nitric oxide inhibition of tobacco catalase and ascorbate peroxidase. Mol Plant Microbe Interact 13, 1380-1384. Clarke, A., Desikan, R., Hurst, R. D., Hancock, J. T., and Neill, S. J. (2000). NO way back: nitric oxide and programmed cell death in Arabidopsis thaliana suspension cultures. Plant J 24, 667-677. Clarkson, A. B., Bienen, E. J., Pollakis, G., and Grady, R. W. (1989). Nitric oxide of blood stream forms of the parasite Trypanosoma brucei brucei is dependent on a plant-like alternative oxidase. J Biol Chem 264, 17770–17776. Clough, S. J., Fengler, K. A., Yu, I. C., Lippok, B., Smith, R. K., Jr., and Bent, A. F. (2000). The Arabidopsis dnd1 "defense, no death" gene encodes a mutated cyclic nucleotide-gated ion channel. Proc Natl Acad Sci U S A 97, 9323-9328. Cobbett, C., Goldsbrough, P. (2002). Phytochelatins and metallothioneins: roles in heavy metal detoxification and homeostasis. Annu Rev Plant Biol 53, 159-182. Cohn, J., Sessa, G., and Martin, G. B. (2001). Innate immunity in plants. Curr Opin Immunol 13, 55-62. Cooney, R. V., Harwood, P. J., Custer, L. J., and Franke, A. A. (1994). Light-mediated conversion of nitrogen dioxide to nitric oxide by carotenoids. Environ Health Perspect 102, 460-462.
References
108
Corpas, F. J., Barroso, J. B., and del Rio, L. A. (2001). Peroxisomes as a source of reactive oxygen species and nitric oxide signal molecules in plant cells. Trends Plant Sci 6, 145-150. Cueto, M., Hernandéz-Perera, O., Martin, R., Bentura, M. L., Rodrigo, J., Lamas, S., and Golvano, M. P. (1996). Presence of nitric oxide synthase activity in roots and nodules of Lupinus albus. FEBS Lett 398, 159-164. Dangl, J. L., and Jones, J. D. (2001). Plant pathogens and integrated defence responses to infection. Nature 411, 826-833. Delledonne, M., Xia, Y., Dixon, R. A., and Lamb, C. (1998). Nitric oxide functions as a signal in plant disease resistance. Nature 394, 585-588. Delledonne, M., Zeier, J., Marocco, A., and Lamb, C. (2001). Signal interactions between nitric oxide and reactive oxygen intermediates in the plant hypersensitive disease resistance response. Proc Natl Acad Sci U S A 98, 13454-13459. Deora, A. A., Win, T., Vanhaesebroeck, B., and Lander, H. M. (1998). A redox-triggered ras-effector interaction. Recruitment of phosphatidylinositol 3'-kinase to Ras by redox stress. J Biol Chem 273, 29923-29928. Desikan, R., Griffiths, R., Hancock, J., and Neill, S. (2002). A new role for an old enzyme: nitrate reductase-mediated nitric oxide generation is required for abscisic acid-induced stomatal closure in Arabidopsis thaliana. Proc Natl Acad Sci U S A 99, 16314-16318. Despres, C., DeLong, C., Glaze, S., Liu, E., and Fobert, P. R. (2000). The Arabidopsis NPR1/NIM1 protein enhances the DNA binding activity of a subgroup of the TGA family of bZIP transcription factors. Plant Cell 12, 279-290. Diehl, F., Grahlmann, S., Beier, M., and Hoheisel, J. D. (2001). Manufacturing DNA microarrays of high spot homogeneity and reduced background signal. Nucleic Acids Res 29, E38. Ding, H., and Demple, B. (2000). Direct nitric oxide signal transduction via nitrosylation of iron-sulfur centers in the SoxR transcription activator. Proc Natl Acad Sci U S A 97, 5146-5150. Dixon, D. P., Lapthorn, A., and Edwards, R. (2002). Plant glutathione transferases. Genome Biol 3, Reviews3004. Doares, S. H., Narvaez-Vasquez, J., Conconi, A., and Ryan, C. A. (1995). Salicylic acid inhibits synthesis of proteinase inhibitors in tomato leaves induced by systemin and jasmonic acid. Plant Physiol 108, 1741-1746. Dobashi, K., Asayama, K., Nakane, T., Kodera, K., Hayashibe, H., and Nakazawa, S. (2001). Induction of glutathione peroxidase in response to inactivation by nitric oxide. Free Radic Res 35, 319-327.
References
109
Doherty, H. M., Selvendran , R. R., and Bowles, D. J. (1988). The wound response of tomato plants can be inhibited by aspirin and related hydroxy-benzoic acids. Physiol Mol Plant Pathol 33, 377–384. Dong, X. (1998). SA, JA, ethylene, and disease resistance in plants. Curr Opin Plant Biol 1, 316-323. Durner, J., Gow, A. J., Stamler, J. S., and Glazebrook, J. (1999). Ancient origins of nitric oxide signaling in biological systems. Proc Natl Acad Sci U S A 96, 14206-14207. Durner, J., and Klessig, D. F. (1999). Nitric oxide as a signal in plants. Curr Opinion Plant Biol 2, 369-372. Durner, J., Wendehenne, D., and Klessig, D. F. (1998). Defense gene induction in tobacco by nitric oxide, cyclic GMP, and cyclic ADP-ribose. Proc Natl Acad Sci U S A 95, 10328-10333. Edwards, D. (2003). Non-linear normalization and background correction in one-channel cDNA microarray studies. Bioinformatics 19, 825-833. Eu, J. P., Liu, L., Zeng, M., and Stamler, J. S. (2000). An apoptotic model for nitrosative stress. Biochemistry 39, 1040 -1047. Ezaki, B., Katsuhara, M., Kawamura, M., and Matsumoto, H. (2001). Different mechanisms of four aluminum (Al)-resistant transgenes for Al toxicity in Arabidopsis. Plant Physiol 127, 918-927. Farmer, E. E., Weber, H., and Vollenweider, S. (1998). Fatty acid signaling in Arabidopsis. Planta 206, 167-174. Finkelstei, D., Ewing, R., Gollub, J., Sterky, F., Cherry, J. M., and Somerville, S. (2002). Microarray data quality analysis: lessons from the AFGC project. Arabidopsis Functional Genomics Consortium. Plant Mol Biol 48, 119-131. Flor, H. H. (1971). Current status of the gene-for-gene concept. Annu Rev Phytopathol 9, 275-296. Foissner, I., Wendehenne, D., Langebartels, C., and Durner, J. (2000). In vivo imaging of an elicitor-induced nitric oxide burst in tobacco. Plant J 23, 817-824. Gaffney, T., Friedrich, L., Vernooij, B., Negrotto, D., Nye, G., Uknes, S., Ward, E., Kessmann, H., and Ryals, J. (1993). Requirement of salicylic acid for the induction of systemic acquired resistance. Science 261, 754-756. Glazebrook, J. (2001). Genes controlling expression of defense responses in Arabidopsis - 2001 status. Curr Opin Plant Biol 4, 301-308. Glazebrook, J., Zook, M., Mert, F., Kagan, I., Rogers, E. E., Crute, I. R., Holub, E. B., Hammerschmidt, R., and Ausubel, F. M. (1997). Phytoalexin-deficient mutants of Arabidopsis reveal that PAD4 encodes a regulatory factor and that four PAD genes contribute to downy mildew resistance. Genetics 146, 381-392.
References
110
Gow, A. J., Luchsinger, B. P., Pawloski, J. R., Singel, D. J., and Stamler, J. S. (1999). The oxyhemoglobin reaction of nitric oxide. Proc Natl Acad Sci U S A 96, 9027-9032. Graziano, M., Beligni, M. V., and Lamattina, L. (2002). Nitric oxide improves internal iron availability in plants. Plant Physiol 130, 1852-1859. Gu, Y. Q., Wildermuth, M. C., Chakravarthy, S., Loh, Y. T., Yang, C., He, X., Han, Y., and Martin, G. B. (2002). Tomato transcription factors pti4, pti5, and pti6 activate defense responses when expressed in Arabidopsis. Plant Cell 14, 817-831. Hausladen, A., Privalle, C. T., Keng, T., DeAngelo, J., and Stamler, J. S. (1996). Nitrosative stress: activaton of the transcription factor OxyR. Cell 86, 719-729. Hegde, P., Qi, R., Abernathy, K., Gay, C., Dharap, S., Gaspard, R., Earle-Hughes, J., Snesrud, E., and Quackenbush, J. (2000). A Concise Guide to cDNA Microarray Analysis. Biotechniques 29, 548-562. Heidenreich, B., Mayer, K., Sandermann JR, H., and Ernst, D. (2001). Mercury-induced genes in Arabidopsis thaliana: identification of induced genes upon lon-term mercuric ion exposure. Plant Cell and Environment 24, 1227-1234. Hentze, M. W., and Kuhn, L. C. (1996). Molecular control of vertebrate iron metabolism: mRNA-based regulatory circuits operated by iron, nitric oxide, and oxidative stress. Proc Natl Acad Sci U S A 93, 8175-8182. Hippeli, S., and Elstner, E. F. (1996). Mechanisms of oxygen activation during plant stress: Biochemical effects of air pollutants. J Plant Physiol 148, 249-257. Hmadcha, A., Bedoya, F. J., Sobrino, F., and Pintado, E. (1999). Methylation-dependent gene silencing induced by interleukin 1beta via nitric oxide production. J Exp Med 190, 1595-1604. Hoffman, T., Schmidt, J. S., Zheng, X. Y., and Bent, A. F. (1999). Isolation of ethylene-insensitive soybean mutants that are altered in pathogen susceptibility and gene-for-gene disease resistance. Plant Physiol 119, 935-949. Howard, C. J. (1980). Stratospheric chemistry and the ozone problem. In: Rodgers, M. and Powers E. (eds.), Oxygen and Oxy Radicals in Chemistry and Biology. Academic Press, New York, 535-589. Huang, X., von Rad, U., and Durner, J. (2002). Nitric oxide induces the nitric oxide-tolerant alternative oxidase in Arabidopsis suspension cells. Planta 215, 914-923. Jofuku, K. D., den Boer, B. G., Van Montagu, M., and Okamuro, J. K. (1994). Control of Arabidopsis flower and seed development by the homeotic gene APETALA2. Plant Cell 6, 1211-1225. Joseph-Horne, T., Hollomon, D. W., and Wood, P. M. (2001). Fungal respiration: a fusion of standard and alternative components. Biochim Biophys Acta 1504, 179-195.
References
111
Kaiser, W. M., and Huber, S. C. (2001). Post-translational regulation of nitrate reductase: Mechanism, physiological relevance and environmental triggers. J Exp Bot 52, 1981-1989. Kaiser, W. M., Weiner, H., Kandlbinder, A., Tsai, C. B., Rockel, P., Sonoda, M., and Planchet, E. (2002). Modulation of nitrate reductase: some new insights, an unusual case and a potentially important side reaction. J Exp Bot 53, 875-882. Kalyanaraman, B. (1996). Detection of nitric oxide by electron spin resonance in chemical, photochemical, cellular, physiological, and pathophysiological systems. Methods Enzymol 268, 168-187. Kaptain, S., Downey, W. E., Tang, C., Philpott, C., Haile, D., Orloff, D. G., Harford, J. B., Rouault, T. A., and Klausner, R. D. (1991). A regulated RNA binding protein also possesses aconitase activity. Proc Natl Acad Sci U S A 88, 10109-10113. Kita, Y., Ozaki, R., Sakai, S., Sugimoto, T., Hirasawa, Y., Ohtsuka, M., Senoh, H., Yoshida, K., and Maeda, K. (1994). Antianginal effects of FK409, a new spontaneous NO releaser. Br J Pharmacol 113, 1137-1140. Klepper, L. (1991). NOx evolution by soybean leaves treated with salicylic acid and selected derivatives. Pest Biochem Physiol 39, 43-48. Kleschyov, A. L., Mollnau, H., Oelze, M., Meinertz, T., Huang, Y., Harrison, D. G., and Munzel, T. (2000). Spin trapping of vascular nitric oxide using colloid Fe(II)-diethyldithiocarbamate. Biochem Biophys Res Commun 275, 672-677. Klessig, D. F., Durner, J., Noad, R., Navarre, D. A., Wendehenne, D., Kumar, D., Zhou, J. M., Shah, J., Zhang, S., Kachroo, P., et al. (2000). Nitric oxide and salicylic acid signaling in plant defense. Proc Natl Acad Sci U S A 97, 8849-8855. Kojima, H., Nakatsubo, N., Kikuchi, K., Kawahara, S., Kirino, Y., Nagoshi, H., Hirata, Y., and Nagano, T. (1998). Detection and Imaging of nitric oxide with novel fluorescent indicators: Diaminofluoresceins. Anal Chem 70, 2446-2453. Kunkel, B. N., and Brooks, D. M. (2002). Cross talk between signaling pathways in pathogen defense. Curr Opin Plant Biol 5, 325-331. Laudert, D., Schaller, F., and Weiler, E. W. (2000). Transgenic Nicotiana tabacum and Arabidopsis thaliana plants overexpressing allene oxide synthase. Planta 211, 163-165. Lennon, A. M., Neuenschwander, U., Ribas-Carbo, M., Giles, L., Ryals, J. A., and Siedow, J. N. (1997). The effects of salicylic acid and tobacco mosaic virus infection on the alternative oxidase of tobacco. Plant Physiol 115, 783-791. León, J., Rojo, E., and Sanchez-Serrano, J. J. (2001). Wound signalling in plants. J Exp Bot 52, 1-9. Leshem, Y., and Haramaty, E. (1996). The characterization and contrasting effects of the nitric oxide free radical in vegetative stress and senescence of Pisum sativum Linn. foliage. J Plant Physiol 148, 258-263.
References
112
Leshem, Y. Y., Wills, R. B. H., and Ku, V. V. (1998). Evidence for the function of the free reduced gas – nitric oxide (NO·) as an endogenous maturation and senescence regulating factor in higher plants. Plant Physiol Biochem 36, 825-826. Liang, P., and Pardee, A. B. (1992). Differential Display of Eukaryotic Messenger-Rna By Means of the Polymerase Chain-Reaction. Science 257, 967-971. Lipton, S. A., Choi, Y. B., Pan, Z. H., Lei, S. Z., Chen, H. S., Sucher, N. J., Loscalzo, J., Singel, D. J., and Stamler, J. S. (1993). A redox-based mechanism for the neuroprotective and neurodestructive effects of nitric oxide and related nitroso-compounds. Nature 364, 626-632. Liu, L., Hausladen, A., Zeng, M., Que, L., Heitman, J., and Stamler, J. S. (2001). A metabolic enzyme for S-nitrosothiol conserved from bacteria to humans. Nature 410, 490-494. Lum, H. K., Butt, Y. K. C., and Lo, S. C. L. (2002). Hydrogen Peroxide Induces a Rapid Production of Nitric Oxide in Mung Bean (Phaseolus aureus). Nitric Oxide 6, 205-213. Lund, S. T., Stall, R. E., and Klee, H. J. (1998). Ethylene regulates the susceptible response to pathogen infection in tomato. Plant Cell 10, 371-382. Mata, C. G., and Lamattina, L. (2001). Nitric Oxide Induces Stomatal Closure and Enhances the Adaptive Plant Responses against Drought Stress. Plant Physiol 126, 1196-1204. Mathieu, C., Moreau, S., Frendo, P., Puppo, A., and Davies, M. J. (1998). Direct detection of radicals in intact soybean nodules: presence of nitric oxide-leghemoglobin complexes. Free Radic Biol Med 24, 1242-1249. Matthews, J. R., Botting, C. H., Panico, M., Morris, H. R., and Hay, R. T. (1996). Inhibition of NF-kappaB DNA binding by nitric oxide. Nucleic Acids Res 24, 2236-2242. Maxwell, D. P., Wang, Y., and McIntosh, L. (1999). The alternative oxidase lowers mitochondrial reactive oxygen production in plant cells. Proc Natl Acad Sci U S A 96, 8271-8276. Mayer, B., and Hemmens, B. (1997). Biosynthesis and action of nitric oxide in mammalian cells. Trends Biochem Sci 22, 477-481. McDowell, J. M., and Dangl, J. L. (2000). Signal transduction in the plant immune response. Trends Biochem Sci 25, 79-82. Meeuse, B. J. D. (1975). Thermogenic respiration in aroids. Annu Rev Plant Physiol 26, 117-126. Meuwly, P., and Metraux, J. P. (1993). Ortho-anisic acid as internal standard for the simultaneous quantitation of salicylic acid and its putative biosynthetic precursors in cucumber leaves. Anal Biochem 214, 500-505. Millar, A. H., and Day, D. A. (1996). Nitric oxide inhibits the cytochrome oxidase but not the alternative oxidase of plant mitochondria. FEBS Lett 398, 155-158.
References
113
Millar, A. H., and Day, D. A. (1997). Alternative solutions to radical problems. Trends Plant Sci 2, 289-290. Mueller, M. J., Brodschelm, W., Spannagl, E., and Zenk, M. H. (1993). Signaling in the elicitation process is mediated through the octadecanoid pathway leading to jasmonic acid. Proc Natl Acad Sci U S A 90, 7490-7494. Murray, A. J. S., and Wellburn, A. R. (1985). Differences in nitrogen metabolism between cultivars of tomato and pepper during exposure to glasshouse atmospheres containing oxides of nitrogen. Environ Pollution 39, 303-316. Nappi, A. J., Vass, E., Frey, F., and Carton, Y. (2000). Nitric oxide involvement in Drosophila immunity. Nitric Oxide 4, 423-430. Nathan, C. (1992). Nitric oxide as a secretory product of mammalian cells. Faseb J 6, 3051-3064. Nathan, C., and Shiloh, M. U. (2000). Reactive oxygen and nitrogen intermediates in the relationship between mammalian hosts and microbial pathogens. Proc Natl Acad Sci U S A 97, 8841-8848. Nathan, C., and Xie, Q.-W. (1994). Nitric oxide synthases: Roles, tolls, and controls. Cell 78, 915-918. Navarre, D. A., Wendehenne, D., Durner, J., Noad, R., and Klessig, D. F. (2000). Nitric oxide modulates the activity of two tobacco enzymes aconitase. Plant Physiol 122, 573-582. Neill, S. J., Desikan, R., Clarke, A., and Hancock, J. T. (2002a). Nitric oxide is a novel component of abscisic Acid signaling in stomatal guard cells. Plant Physiol 128, 13-16. Neill, S. J., Desikan, R., Clarke, A., Hurst, R. D., and Hancock, J. T. (2002b). Hydrogen peroxide and nitric oxide as signalling molecules in plants. J Exp Bot 53, 1237-1247. Niki, T., Mitsuhara, I., Seo, S., Ohtsubo, N., and Ohashi, Y. (1998). Antagonistic effect of salicylic acid and jasmonic acid on the expression of pathogenesis-related (PR) protein genes in wounded mature tobacco leaves. Plant Cell Physiol 39, 500–507. Nishimura, I., Hayamizu, T., and Yanagisawa, Y. (1986). Reduction of NO2 to NO by rush and other plants. Environ Sci Technol 20, 413-416. Norman-Setterblad, C., Vidal, S., and Palva, E. T. (2000). Interacting signal pathways control defense gene expression in Arabidopsis in response to cell wall-degrading enzymes from Erwinia carotovora. Mol Plant Microbe Interact 13, 430-438. Okubo, K., Hori, N., Matoba, R., Niiyama, T., Fukushima, A., Kojima, Y., and Matsubara, K. (1992). Large scale cDNA sequencing for analysis of quantitative and qualitative aspects of gene expression. Nat Genet 2, 173-179. Orozco-Cárdenas, M., Nárvaez-Vásquez, J., and Ryan, C. (2001). Hydrogen peroxide acts as a second messenger for the induction of defense genes in tomato plants in response to wounding, systemin, and methyl jasmonate. Plant Cell 13, 179-191.
References
114
Orozco-Cárdenas, M., and Ryan, C. A. (1999). Hydrogen peroxide is generated systemically in plant leaves by wounding and systemin via the octadecanoid pathway. Proc Natl Acad Sci U S A 96, 6553-6557. Orozco-Cárdenas, M. L., and Ryan, C. (2002). Nitric oxide negatively modulates wound signaling in tomato plants. Plant Physiol 130, 487-493. Pagnussat, G. C., Simontacchi, M., Puntarulo, S., and Lamattina, L. (2002). Nitric oxide is required for root organogenesis. Plant Physiol 129, 954-956. Palmer, R. M., Ferrige, A. G., and Moncada, S. (1987). Nitric oxide release accounts for the biological activity of endothelium-derived relaxing factor. Nature 327, 524-526. Park, J. H., Halitschke, R., Kim, H. B., Baldwin, I. T., Feldmann, K. A., and Feyereisen, R. (2002). A knock-out mutation in allene oxide synthase results in male sterility and defective wound signal transduction in Arabidopsis due to a block in jasmonic acid biosynthesis. Plant J 31, 1-12. Pedroso, M. C., Magalhaes, J. R., and Durzan, D. (2000). A nitric oxide burst precedes apoptosis in angiosperm and gymnosperm callus cells and foliar tissues. J Exp Bot 51, 1027-1036. Pena-Cortés, H., Albrecht, T., Prat, S., Weiler, E. W., and Willmitzer, L. (1993). Aspirin prevents wound-induced gene expression in tomato leaves by blocking jasmonic acid biosynthesis. Planta 191, 123-138. Pieterse, C. M. J., and Van Loon, L. C. (1999). Salicylic acid-independent plant defence pathways. Trends Plant Sci 4, 52-58. Quesada, A., Goméz-García, I., and Fernandéz, E. (2000). Involvement of chloroplast and mitochondria redox valves in nitrate assimilation. Trends Plant Sci 5, 463-464. Ramdas, L., Coombes, K. R., Baggerly, K., Abruzzo, L., Highsmith, W. E., Krogmann, T., Hamilton, S. R., and Zhang, W. (2001). Sources of nonlinearity in cDNA microarray expression measurements. Genome Biol 2, RESEARCH0047. Raskin, I., Ehmann, A., Melander, W. R., and Meeuse, B. J. D. (1987). Salicylic acid - a natural inducer of heat production in Arum lilies. Science 237, 1601-1602. Reiter, C. D., Teng, R. J., and Beckman, J. S. (2000). Superoxide reacts with nitric oxide to nitrate tyrosine at physiological pH via peroxynitrite. J Biol Chem 275, 32460-32466. Reymond, P., and Farmer, E. E. (1998). Jasmonate and salicylate as global signals for defense gene expression. Curr Opin Plant Biol 1, 404-411. Reymond, P., Weber, H., Damond, M., and Farmer, E. E. (2000). Differential gene expression in response to mechanical wounding and insect feeding in Arabidopsis. Plant Cell 12, 707-720.
References
115
Rhoads, D. M., and McIntosh, L. (1992). Salicylic acid regulation of respiration in higher plants: alternative oxidase expression. Plant Cell 4, 1131-1139. Rhoads, D. M., and McIntosh, L. (1993). Cytochrome and alternative pathway respiration in tobacco; effects of salicylic acid. Plant Physiol 103, 877-883. Ribeiro, E. A., Cunha, F. Q., Tamashiro, W. M. S. C., and Martins, I. S. (1999). Growth phase-dependent subcellular localization of nitric oxide synthase in maize cells. FEBS Lett 445, 283-286. Richards, K. D., Schott, E. J., Sharma, Y. K., Davis, K. R., and Gardner, R. C. (1998). Aluminum induces oxidative stress genes in Arabidopsis thaliana. Plant Physiol 116, 409-418. Rockel, P., Strube, F., Rockel, A., Wildt, J., and Kaiser, W. M. (2002). Regulation of nitric oxide (NO) production by plant nitrate reductase in vivo and in vitro. J Exp Bot 53, 103-110. Ryals, J. A., Neuenschwander, U. H., Willits, M. G., Molina, A., Steiner, H.-Y., and Hunt, M. D. (1996). Systemic acquired resistance. Plant Cell 8, 1809-1819. Ryan, C. A. (2000). The systemin signaling pathway: differential activation of plant defensive genes. Biochim Biophys Acta 1477, 112-121. Saffert, A., Hartmann-Schreier, J., Schon, A., and Schreier, P. (2000). A dual function alpha-dioxygenase-peroxidase and NAD(+) oxidoreductase active enzyme from germinating pea rationalizing alpha-oxidation of fatty acids in plants. Plant Physiol 123, 1545-1552. Saisho, D., Nambara, E., Naito, S., Tsutsumi, N., Hirai, A., and Nakazono, M. (1997). Characterization of the gene family for alternative oxidase from Arabidopsis thaliana. Plant Mol Biol 35, 585-596. Sandermann, H. (2001) Ozon Entstehung, Wirkung, Risiken. Verlag C. H. Beck oHG, München, 23-28. Schaller, F. (2001). Enzymes of the biosynthesis of octadecanoid-derived signalling molecules. J Exp Bot 52, 11-23. Schena, M., Shalon, D., Davis, R. W., and Brown, P. O. (1995). Quantitative monitoring of gene expression patterns with a complementary DNA microarray. Science 270, 467-470. Schena, M., Shalon, D., Heller, R., Chai, A., Brown, P. O., and Davis, R. W. (1996). Parallel human genome analysis: microarray-based expression monitoring of 1000 genes. Proc Natl Acad Sci U S A 93, 10614-10619. Schmidt, H. H., and Walter, U. (1994). NO at work. Cell 78, 919-925. Schuler, G. D. (1997). Pieces of the puzzle: expressed sequence tags and the catalog of human genes. J Mol Med 75, 694-698.
References
116
Shah, J., Tsui, F., and Klessig, D. F. (1997). Characterization of a Salicylic Acid-insensitive mutant (sai1) of Arabidopsis thaliana, identified in a selective screen utilizing the SA-Inducible expression of the tms2 gene. Mol Plant Microbe Interact 10, 69-78. Shalon, D., Smith, S. J., and Brown, P. O. (1996). A DNA microarray system for analyzing complex DNA samples using two-color fluorescent probe hybridization. Genome Res 6, 639-645. Shinyashiki, M., Chiang, K. T., Switzer, C. H., Gralla, E. B., Valentine, J. S., Thiele, D. J., and Fukuto, J. M. (2000). The interaction of nitric oxide (NO) with the yeast transcription factor Ace1: A model system for NO-protein thiol interactions with implications to metal metabolism. Proc Natl Acad Sci U S A 97, 2491-2496. Shirasu, K., and Schulze-Lefert, P. (2000). Regulators of cell death in disease resistance. Plant Mol Biol 44, 371-385. Shiva, S., Brookes, P. S., Patel, R. P., Anderson, P. G., and Darley-Usmar, V. M. (2001). Nitric oxide partitioning into mitochondrial membranes and the control of respiration at cytochrome c oxidase. Proc Natl Acad Sci U S A 98, 7212-7217. Simon-Plas, F., Elmayan, T., and Blein, J.-P. (2002). The plasma membrane oxidase NtrbohD is responsible for AOS production in elicited tobacco cells. Plant J 31, 137-148. Simons, B. H., Millenaar, F. F., Mulder, L., Van Loon, L. C., and Lambers, H. (1999). Enhanced expression and activation of the alternative oxidase during infection of Arabidopsis with Pseudomonas syringae pv tomato. Plant Physiol 120, 529-538. Spiecker, M., Peng, H. B., and Liao, J. K. (1997). Inhibition of endothelial vascular cell adhesion molecule-1 expression by nitric oxide involves the induction and nuclear translocation of IkappaBalpha. J Biol Chem 272, 30969-30974. Stamler, J. S. (1994). Redox signaling: nitrosylation and related target interactions of nitric oxide. Cell 78, 931-936. Stamler, J. S., and Hausladen, A. (1998). Oxidative modifications in nitrosative stress. Nat Struct Biol 5, 247-249. Stamler, J. S., Singel, D. L., and Loscalzo, J. (1992). Biochemistry of nitric oxide and its redox-activated forms. Science 258, 18981902. Stancovski, I., and Baltimore, D. (1997). NF-kappaB activation: the I kappaB kinase revealed? Cell 91, 299-302. Sticher, L., Mauch-Mani, B., and Metreaux, J. P. (1997). Systemic acquired resistance. Annu Rev Phytopathol 35, 235-270. Stintzi, A., and Browse, J. (2000). The Arabidopsis male-sterile mutant, opr3, lacks the 12-oxophytodienoic acid reductase required for jasmonate synthesis. Proc Natl Acad Sci U S A 97, 10625-10630.
References
117
Stöhr, C., Strube, F., Marx, G., Ullrich, W. R., and Rockel, P. (2001). A plasma membrane-bound enzyme of tobacco roots catalyses the formation of nitric oxide from nitrite. Planta 212, 835-841. Stuehr, D. J. (1999). Mammalian nitric oxide synthases. Biochim Biophys Acta 1411, 217-230. Suzuki, N., Kojima, H., Urano, Y., Kikuchi, K., Hirata, Y., and Nagano, T. (2002). Orthogonality of calcium concentration and ability of 4,5- diaminofluorescein to detect NO. J Biol Chem 277, 47-49. Tatoyan, A., and Giulivi, C. (1998). Purification and characterization of a nitric-oxide synthase from rat liver mitochondria. J Biol Chem 273, 11044-11048. Thimm, O., Essigmann, B., Kloska, S., Altmann, T., and Buckhout, T. J. (2001). Response of Arabidopsis to iron deficiency stress as revealed by microarray analysis. Plant Physiol 127, 1030-1043. Thomma, B., Eggermont, K., Tierens, K., and Broekaert, W. F. (1999). Requirement of functional ethylene-insensitive 2 gene for efficient resistance of Arabidopsis to infection by Botrytis cinerea. Plant Physiol 121, 1093-1101. Tsuchiya, K., Takasugi, M., Minakuchi, K., and Fukuzawa, K. (1996). Sensitive quantitation of nitric oxide by EPR spectroscopy. Free Radic Biol Med 21, 733-737. Tsuji, H., Nakazono, M., Saisho, D., Tsutsumi, N., and Hirai, A. (2000). Transcript levels of the nuclear-encoded respiratory genes in rice decrease by oxygen deprivation: evidence for involvement of calcium in expression of the alternative oxidase 1a gene. FEBS Lett 471, 201-204. Tuomainen, J., Betz, C., Kangasjarvi, J., Ernst, D., Yin, Z. H., Langebartels, C., and Sandermann, H. (1997). Ozone induction of ethylene emission in tomato plants: regulation by differential accumulation of transcripts for the biosynthetic enzymes. Plant J 12, 1151-1162. Umansky, V., Hehner, S. P., Dumont, A., Hofmann, T. G., Schirrmacher, V., Droge, W., and Schmitz, M. L. (1998). Co-stimulatory effect of nitric oxide on endothelial NF-kappaB implies a physiological self-amplifying mechanism. Eur J Immunol 28, 2276-2282. Van Breusegem, F., Vranová, E., Dat, J. F., and Inzé, D. (2001). The role of active oxygen species in plant signal transduction. Plant Sci 161, 405-414. Van Camp, W., Van Montagu, M., and Inzé, D. (1998). H2O2 and NO: redox signals in disease resistance. Trends Plant Sci 3, 330-334. Van Loon, L. C. (1999). Occurrence and properties of plant pathogenesis-related proteins. In Pathogenesis-related proteins in plants., S. K. Datta, and S. Muthukrishnan, eds. (Boca Raton, CRC Press), pp. 1-19. Van Loon, L. C., Bakker, P. A. H. M., and Pieterse, C. M. J. (1998). Systemic resistance induced by rhizosphere bacteria. Annu Rev Phytopathol 36, 453-483.
References
118
Vanlerberghe, G. C., and McIntosh, L. (1997). Alternative Oxidase: From Gene to Function. Annu Rev Plant Physiol Plant Mol Biol 48, 703-734. Velculescu, V. E., Zhang, L., Vogelstein, B., and Kinzler, K. W. (1995). Serial analysis of gene expression. Science 270, 484-487. Verma, I. M., Stevenson, J. K., Schwarz, E. M., Van Antwerp, D., and Miyamoto, S. (1995). Rel/NF-kappa B/I kappa B family: intimate tales of association and dissociation. Genes Dev 9, 2723-2735. Vodovotz, Y., Chesler, L., Chong, H., Kim, S. J., Simpson, J. T., DeGraff, W., Cox, G. W., Roberts, A. B., Wink, D. A., and Barcellos-Hoff, M. H. (1999). Regulation of transforming growth factor beta1 by nitric oxide. Cancer Res 59, 2142-2149. Wang, C., Zien, C. A., Afitlhile, M., Welti, R., Hildebrand, D. F., and Wang, X. (2002). Involvement of Phospholipase D in Wound-Induced Accumulation of Jasmonic Acid in Arabidopsis. Plant Cell 12, 2237-2246. Wang, R., Guegler, K., LaBrie, S. T., and Crawford, N. M. (2000). Genomic analysis of a nutrient response in Arabidopsis reveals diverse expression patterns and novel metabolic and potential regulatory genes induced by nitrate. Plant Cell 12, 1491-1509. Wellburn, A. R. (1990). Why are atmospheric oxides of nitrogen usually phytotoxic and not alternative fertilizers? New Phytol 115, 395-429. Wendehenne, D., Pugin, A., Klessig, D. F., and Durner, J. (2001). Nitric oxide: comparative synthesis and signaling in animal and plant cells. Trends Plant Sci 6, 177-183. Wilson, D. L., Buckley, M. J., Helliwell, C. A., and Wilson, I. W. (2003). New normalization methods for cDNA microarray data. Bioinformatics 19, 1325-1332. Wojtaszek, P. (2000). Nitric oxide in plants. To NO or not to NO. Phytochemistry 54, 1-4. Xu, Y., Chang, P., Liu, D., Narasimhan, M., Raghothama, K., Hasegawa, P., and Bressan, R. (1994). Plant defense genes are synergistically induced by ethylene and methyl jasmonate. Plant Cell 6, 1077-1085. Yamamoto, T., Yuyama, K., Nakamura, K., Kato, T., and Yamamoto, H. (2000). Kinetic characterization of the nitric oxide toxicity for PC12 cells: effect of half-life time of NO release. Eur J Pharmacol 397, 25-33. Yamasaki, H. (2000). Nitrite-dependent nitric oxide production pathway: implications for involvement of active nitrogen species in photoinhibition in vivo. Philos Trans R Soc Lond B Biol Sci 355, 1477-1488. Yamasaki, H., and Sakihama, Y. (2000). Simultaneous production of nitric oxide and peroxynitrite by plant nitrate reductase: in vitro evidence for the NR-dependent formation of active nitrogen species. FEBS Lett 468, 89-92. Yamasaki, H., Sakihama, Y., and Takahashi, A. (1999). An alternative pathway for nitric oxide production in plants: new features of an old enzyme. Trends Plant Sci 4, 128-129.
References
119
Yamasaki, H., Shimoji, H., Ohshiro, Y., and Sakihama, Y. (2001). Inhibitory effects of nitric oxide on oxidative phosphorylation in plant mitochondria. Nitric Oxide 5, 261-270. Yip, J. Y., and Vanlerberghe, G. C. (2001). Mitochondrial alternative oxidase acts to dampen the generation of active oxygen species during a period of rapid respiration induced to support a high rate of nutrient uptake. Physiol Plant 112, 327-333. Yu, I. C., Parker, J., and Bent, A. F. (1998). Gene-for-gene disease resistance without the hypersensitive response in Arabidopsis dnd1 mutant. Proc Natl Acad Sci U S A 95, 7819-7824. Zhao, Y., Brandish, P. E., Ballou, D. P., and Marletta, M. A. (1999). A molecular basis for nitric oxide sensing by soluble guanylate cyclase. Proc Natl Acad Sci U S A 96, 14753-14758. Zielinski, R. E. (1998). Calmodulin and calmodulin-binding proteins in plants. Annu Rev Plant Physiol Plant Mol Biol 49, 697–725.
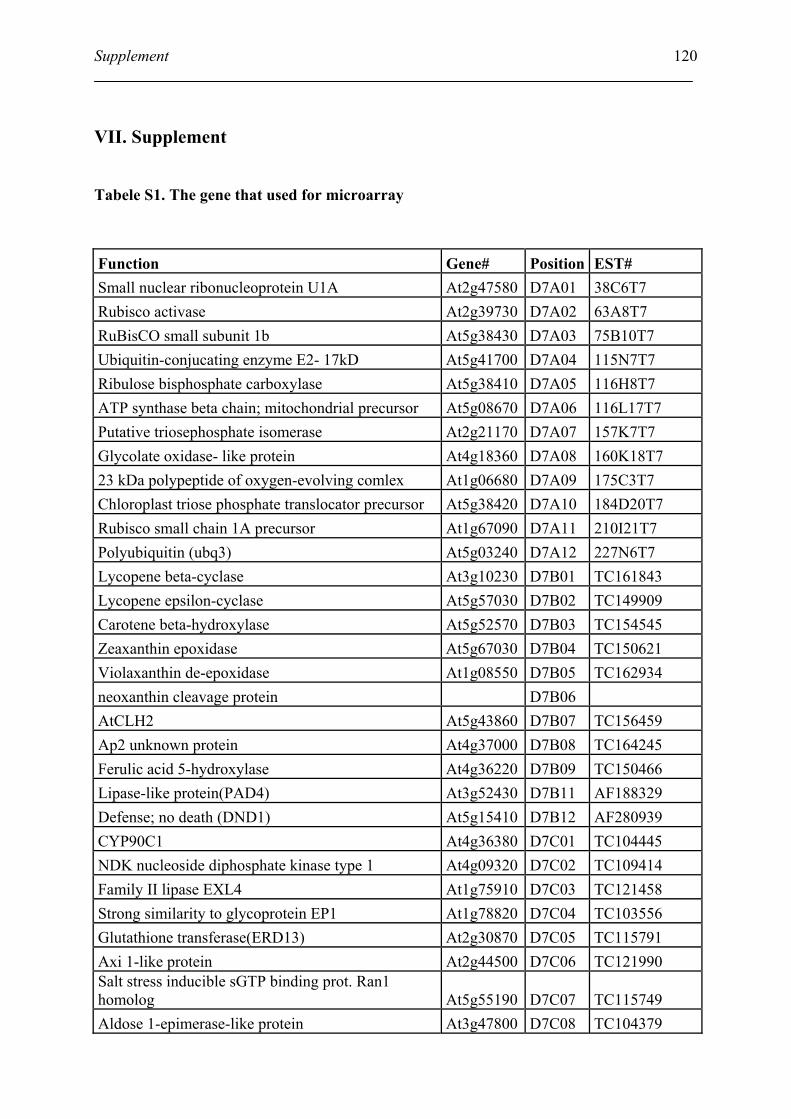
Supplement
120
VII. Supplement
Tabele S1. The gene that used for microarray
Function Gene# Position EST# Small nuclear ribonucleoprotein U1A At2g47580 D7A01 38C6T7 Rubisco activase At2g39730 D7A02 63A8T7 RuBisCO small subunit 1b At5g38430 D7A03 75B10T7 Ubiquitin-conjucating enzyme E2- 17kD At5g41700 D7A04 115N7T7 Ribulose bisphosphate carboxylase At5g38410 D7A05 116H8T7 ATP synthase beta chain; mitochondrial precursor At5g08670 D7A06 116L17T7 Putative triosephosphate isomerase At2g21170 D7A07 157K7T7 Glycolate oxidase- like protein At4g18360 D7A08 160K18T7 23 kDa polypeptide of oxygen-evolving comlex At1g06680 D7A09 175C3T7 Chloroplast triose phosphate translocator precursor At5g38420 D7A10 184D20T7 Rubisco small chain 1A precursor At1g67090 D7A11 210I21T7 Polyubiquitin (ubq3) At5g03240 D7A12 227N6T7 Lycopene beta-cyclase At3g10230 D7B01 TC161843 Lycopene epsilon-cyclase At5g57030 D7B02 TC149909 Carotene beta-hydroxylase At5g52570 D7B03 TC154545 Zeaxanthin epoxidase At5g67030 D7B04 TC150621 Violaxanthin de-epoxidase At1g08550 D7B05 TC162934 neoxanthin cleavage protein D7B06 AtCLH2 At5g43860 D7B07 TC156459 Ap2 unknown protein At4g37000 D7B08 TC164245 Ferulic acid 5-hydroxylase At4g36220 D7B09 TC150466 Lipase-like protein(PAD4) At3g52430 D7B11 AF188329 Defense; no death (DND1) At5g15410 D7B12 AF280939 CYP90C1 At4g36380 D7C01 TC104445 NDK nucleoside diphosphate kinase type 1 At4g09320 D7C02 TC109414 Family II lipase EXL4 At1g75910 D7C03 TC121458 Strong similarity to glycoprotein EP1 At1g78820 D7C04 TC103556 Glutathione transferase(ERD13) At2g30870 D7C05 TC115791 Axi 1-like protein At2g44500 D7C06 TC121990 Salt stress inducible sGTP binding prot. Ran1 homolog At5g55190 D7C07 TC115749 Aldose 1-epimerase-like protein At3g47800 D7C08 TC104379
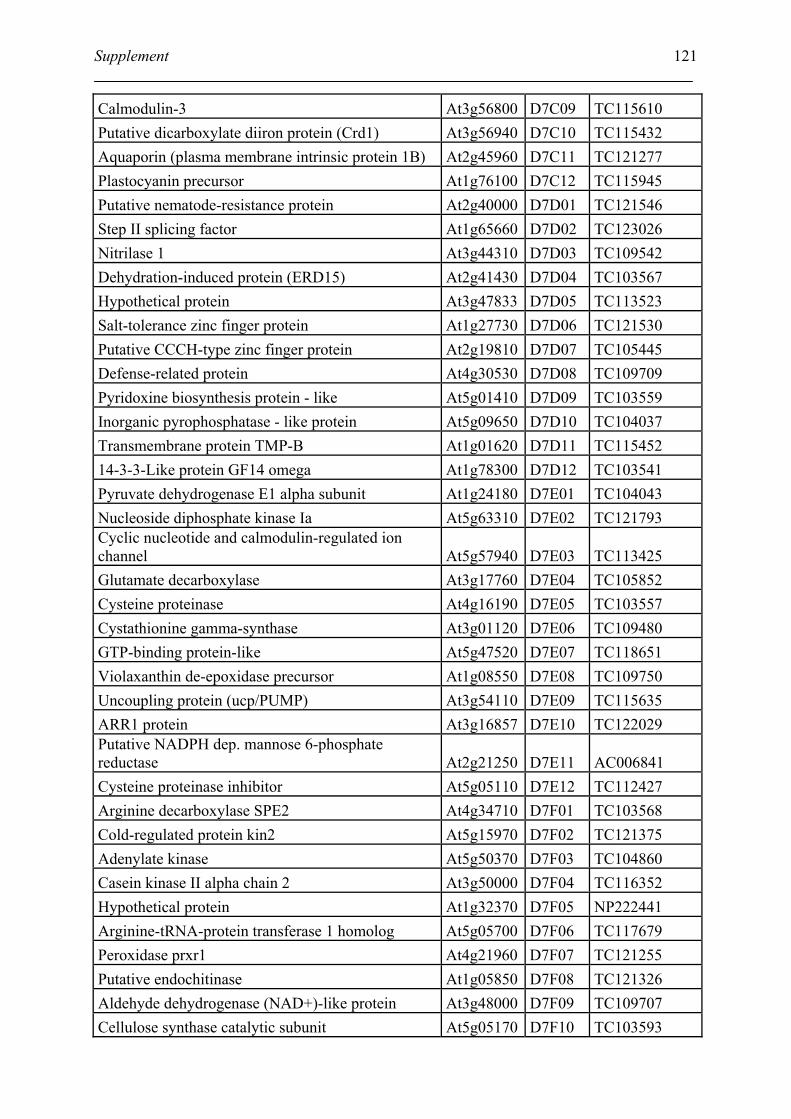
Supplement
121
Calmodulin-3 At3g56800 D7C09 TC115610 Putative dicarboxylate diiron protein (Crd1) At3g56940 D7C10 TC115432 Aquaporin (plasma membrane intrinsic protein 1B) At2g45960 D7C11 TC121277 Plastocyanin precursor At1g76100 D7C12 TC115945 Putative nematode-resistance protein At2g40000 D7D01 TC121546 Step II splicing factor At1g65660 D7D02 TC123026 Nitrilase 1 At3g44310 D7D03 TC109542 Dehydration-induced protein (ERD15) At2g41430 D7D04 TC103567 Hypothetical protein At3g47833 D7D05 TC113523 Salt-tolerance zinc finger protein At1g27730 D7D06 TC121530 Putative CCCH-type zinc finger protein At2g19810 D7D07 TC105445 Defense-related protein At4g30530 D7D08 TC109709 Pyridoxine biosynthesis protein - like At5g01410 D7D09 TC103559 Inorganic pyrophosphatase - like protein At5g09650 D7D10 TC104037 Transmembrane protein TMP-B At1g01620 D7D11 TC115452 14-3-3-Like protein GF14 omega At1g78300 D7D12 TC103541 Pyruvate dehydrogenase E1 alpha subunit At1g24180 D7E01 TC104043 Nucleoside diphosphate kinase Ia At5g63310 D7E02 TC121793 Cyclic nucleotide and calmodulin-regulated ion channel At5g57940 D7E03 TC113425 Glutamate decarboxylase At3g17760 D7E04 TC105852 Cysteine proteinase At4g16190 D7E05 TC103557 Cystathionine gamma-synthase At3g01120 D7E06 TC109480 GTP-binding protein-like At5g47520 D7E07 TC118651 Violaxanthin de-epoxidase precursor At1g08550 D7E08 TC109750 Uncoupling protein (ucp/PUMP) At3g54110 D7E09 TC115635 ARR1 protein At3g16857 D7E10 TC122029 Putative NADPH dep. mannose 6-phosphate reductase At2g21250 D7E11 AC006841 Cysteine proteinase inhibitor At5g05110 D7E12 TC112427 Arginine decarboxylase SPE2 At4g34710 D7F01 TC103568 Cold-regulated protein kin2 At5g15970 D7F02 TC121375 Adenylate kinase At5g50370 D7F03 TC104860 Casein kinase II alpha chain 2 At3g50000 D7F04 TC116352 Hypothetical protein At1g32370 D7F05 NP222441 Arginine-tRNA-protein transferase 1 homolog At5g05700 D7F06 TC117679 Peroxidase prxr1 At4g21960 D7F07 TC121255 Putative endochitinase At1g05850 D7F08 TC121326 Aldehyde dehydrogenase (NAD+)-like protein At3g48000 D7F09 TC109707 Cellulose synthase catalytic subunit At5g05170 D7F10 TC103593
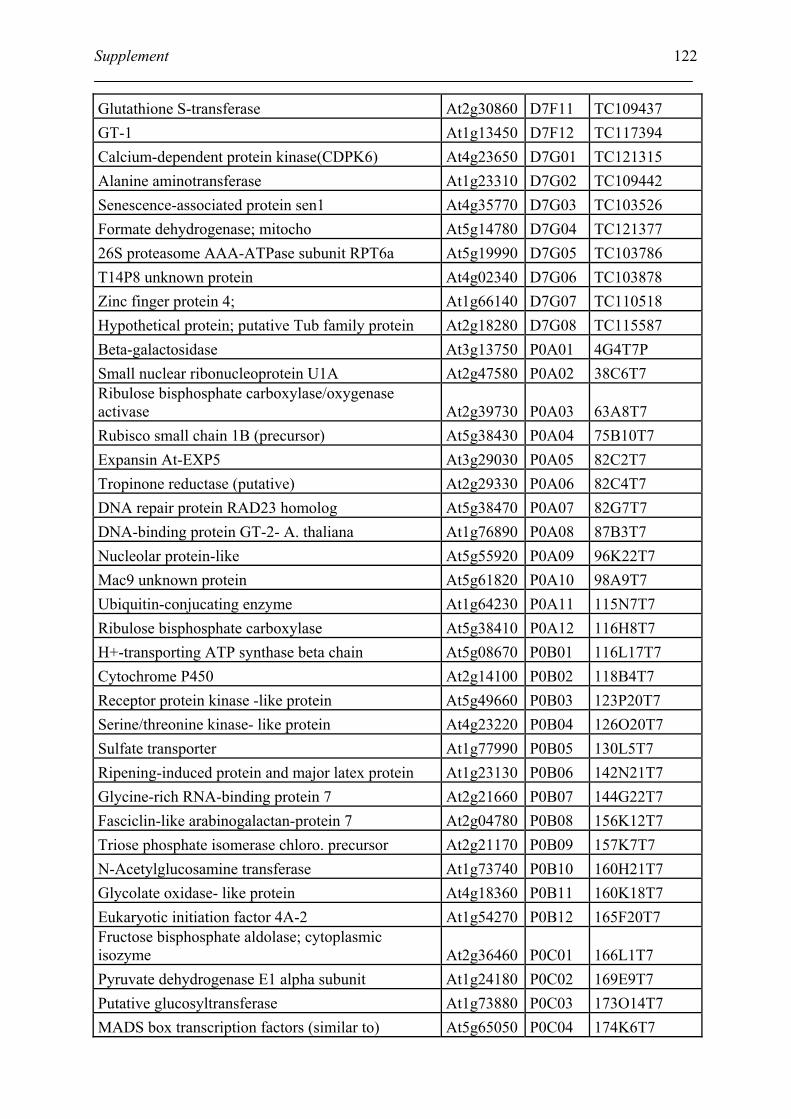
Supplement
122
Glutathione S-transferase At2g30860 D7F11 TC109437 GT-1 At1g13450 D7F12 TC117394 Calcium-dependent protein kinase(CDPK6) At4g23650 D7G01 TC121315 Alanine aminotransferase At1g23310 D7G02 TC109442 Senescence-associated protein sen1 At4g35770 D7G03 TC103526 Formate dehydrogenase; mitocho At5g14780 D7G04 TC121377 26S proteasome AAA-ATPase subunit RPT6a At5g19990 D7G05 TC103786 T14P8 unknown protein At4g02340 D7G06 TC103878 Zinc finger protein 4; At1g66140 D7G07 TC110518 Hypothetical protein; putative Tub family protein At2g18280 D7G08 TC115587 Beta-galactosidase At3g13750 P0A01 4G4T7P Small nuclear ribonucleoprotein U1A At2g47580 P0A02 38C6T7 Ribulose bisphosphate carboxylase/oxygenase activase At2g39730 P0A03 63A8T7 Rubisco small chain 1B (precursor) At5g38430 P0A04 75B10T7 Expansin At-EXP5 At3g29030 P0A05 82C2T7 Tropinone reductase (putative) At2g29330 P0A06 82C4T7 DNA repair protein RAD23 homolog At5g38470 P0A07 82G7T7 DNA-binding protein GT-2- A. thaliana At1g76890 P0A08 87B3T7 Nucleolar protein-like At5g55920 P0A09 96K22T7 Mac9 unknown protein At5g61820 P0A10 98A9T7 Ubiquitin-conjucating enzyme At1g64230 P0A11 115N7T7 Ribulose bisphosphate carboxylase At5g38410 P0A12 116H8T7 H+-transporting ATP synthase beta chain At5g08670 P0B01 116L17T7 Cytochrome P450 At2g14100 P0B02 118B4T7 Receptor protein kinase -like protein At5g49660 P0B03 123P20T7 Serine/threonine kinase- like protein At4g23220 P0B04 126O20T7 Sulfate transporter At1g77990 P0B05 130L5T7 Ripening-induced protein and major latex protein At1g23130 P0B06 142N21T7 Glycine-rich RNA-binding protein 7 At2g21660 P0B07 144G22T7 Fasciclin-like arabinogalactan-protein 7 At2g04780 P0B08 156K12T7 Triose phosphate isomerase chloro. precursor At2g21170 P0B09 157K7T7 N-Acetylglucosamine transferase At1g73740 P0B10 160H21T7 Glycolate oxidase- like protein At4g18360 P0B11 160K18T7 Eukaryotic initiation factor 4A-2 At1g54270 P0B12 165F20T7 Fructose bisphosphate aldolase; cytoplasmic isozyme At2g36460 P0C01 166L1T7 Pyruvate dehydrogenase E1 alpha subunit At1g24180 P0C02 169E9T7 Putative glucosyltransferase At1g73880 P0C03 173O14T7 MADS box transcription factors (similar to) At5g65050 P0C04 174K6T7
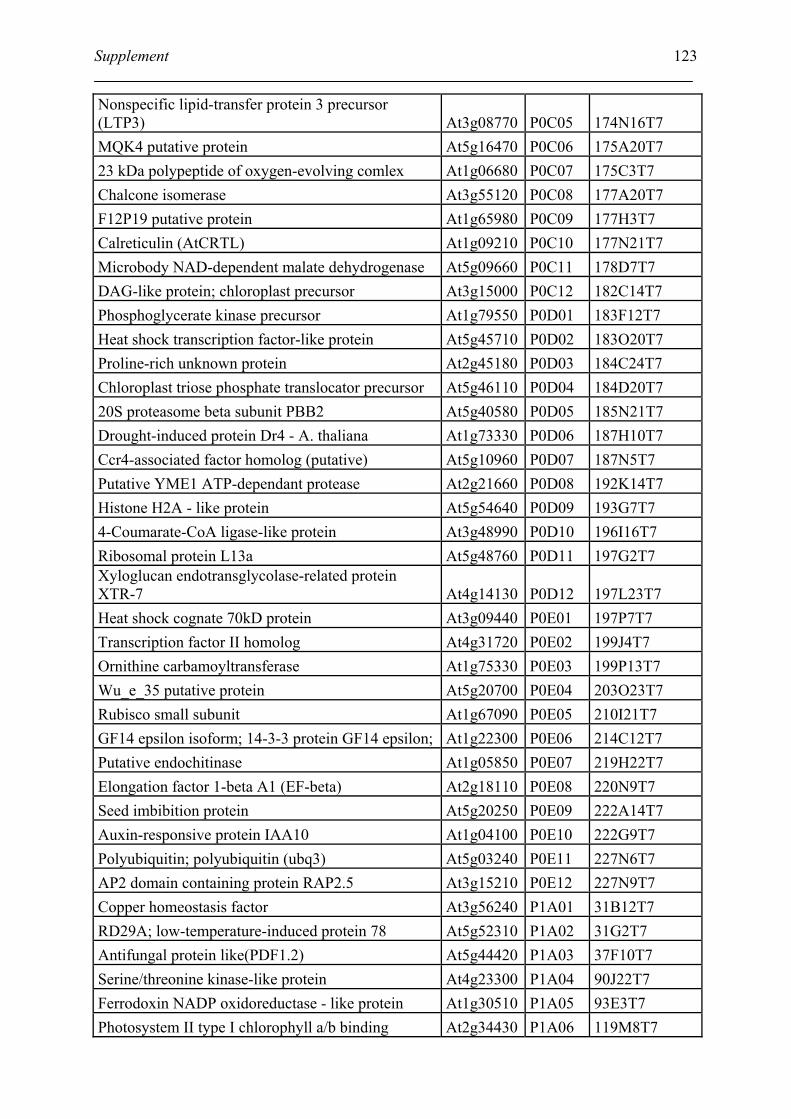
Supplement
123
Nonspecific lipid-transfer protein 3 precursor (LTP3) At3g08770 P0C05 174N16T7 MQK4 putative protein At5g16470 P0C06 175A20T7 23 kDa polypeptide of oxygen-evolving comlex At1g06680 P0C07 175C3T7 Chalcone isomerase At3g55120 P0C08 177A20T7 F12P19 putative protein At1g65980 P0C09 177H3T7 Calreticulin (AtCRTL) At1g09210 P0C10 177N21T7 Microbody NAD-dependent malate dehydrogenase At5g09660 P0C11 178D7T7 DAG-like protein; chloroplast precursor At3g15000 P0C12 182C14T7 Phosphoglycerate kinase precursor At1g79550 P0D01 183F12T7 Heat shock transcription factor-like protein At5g45710 P0D02 183O20T7 Proline-rich unknown protein At2g45180 P0D03 184C24T7 Chloroplast triose phosphate translocator precursor At5g46110 P0D04 184D20T7 20S proteasome beta subunit PBB2 At5g40580 P0D05 185N21T7 Drought-induced protein Dr4 - A. thaliana At1g73330 P0D06 187H10T7 Ccr4-associated factor homolog (putative) At5g10960 P0D07 187N5T7 Putative YME1 ATP-dependant protease At2g21660 P0D08 192K14T7 Histone H2A - like protein At5g54640 P0D09 193G7T7 4-Coumarate-CoA ligase-like protein At3g48990 P0D10 196I16T7 Ribosomal protein L13a At5g48760 P0D11 197G2T7 Xyloglucan endotransglycolase-related protein XTR-7 At4g14130 P0D12 197L23T7 Heat shock cognate 70kD protein At3g09440 P0E01 197P7T7 Transcription factor II homolog At4g31720 P0E02 199J4T7 Ornithine carbamoyltransferase At1g75330 P0E03 199P13T7 Wu_e_35 putative protein At5g20700 P0E04 203O23T7 Rubisco small subunit At1g67090 P0E05 210I21T7 GF14 epsilon isoform; 14-3-3 protein GF14 epsilon; At1g22300 P0E06 214C12T7 Putative endochitinase At1g05850 P0E07 219H22T7 Elongation factor 1-beta A1 (EF-beta) At2g18110 P0E08 220N9T7 Seed imbibition protein At5g20250 P0E09 222A14T7 Auxin-responsive protein IAA10 At1g04100 P0E10 222G9T7 Polyubiquitin; polyubiquitin (ubq3) At5g03240 P0E11 227N6T7 AP2 domain containing protein RAP2.5 At3g15210 P0E12 227N9T7 Copper homeostasis factor At3g56240 P1A01 31B12T7 RD29A; low-temperature-induced protein 78 At5g52310 P1A02 31G2T7 Antifungal protein like(PDF1.2) At5g44420 P1A03 37F10T7 Serine/threonine kinase-like protein At4g23300 P1A04 90J22T7 Ferrodoxin NADP oxidoreductase - like protein At1g30510 P1A05 93E3T7 Photosystem II type I chlorophyll a/b binding At2g34430 P1A06 119M8T7
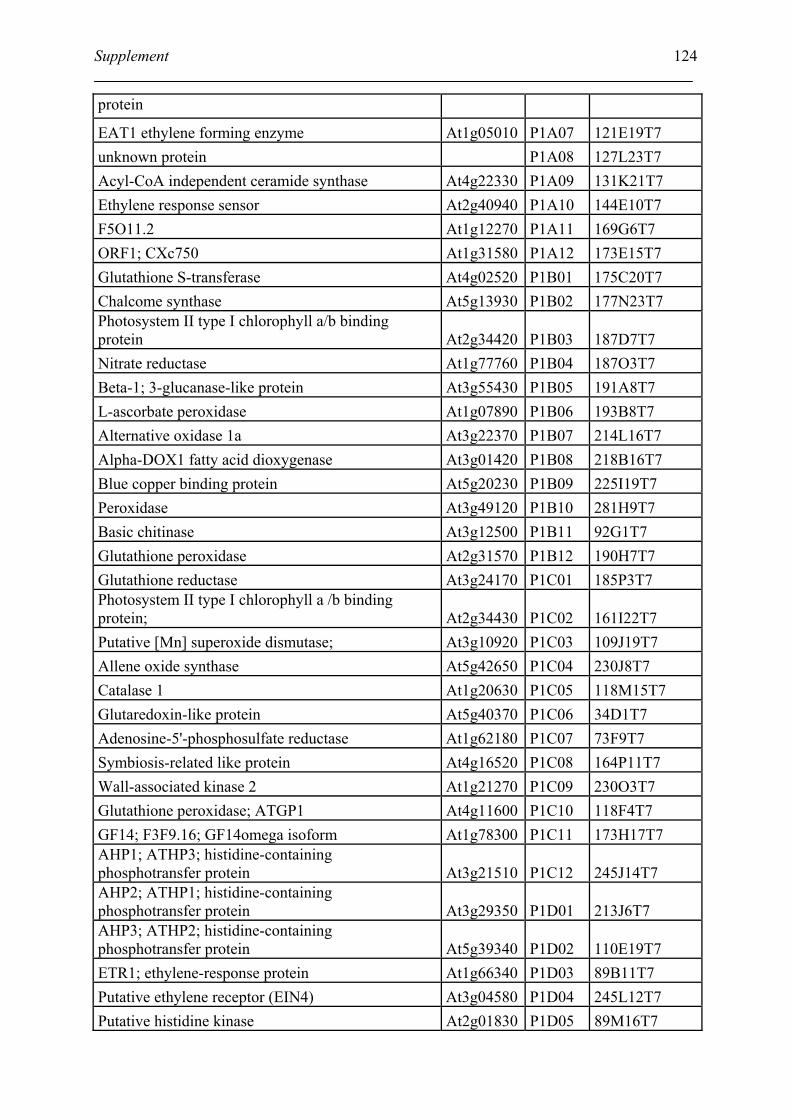
Supplement
124
protein
EAT1 ethylene forming enzyme At1g05010 P1A07 121E19T7 unknown protein P1A08 127L23T7 Acyl-CoA independent ceramide synthase At4g22330 P1A09 131K21T7 Ethylene response sensor At2g40940 P1A10 144E10T7 F5O11.2 At1g12270 P1A11 169G6T7 ORF1; CXc750 At1g31580 P1A12 173E15T7 Glutathione S-transferase At4g02520 P1B01 175C20T7 Chalcome synthase At5g13930 P1B02 177N23T7 Photosystem II type I chlorophyll a/b binding protein At2g34420 P1B03 187D7T7 Nitrate reductase At1g77760 P1B04 187O3T7 Beta-1; 3-glucanase-like protein At3g55430 P1B05 191A8T7 L-ascorbate peroxidase At1g07890 P1B06 193B8T7 Alternative oxidase 1a At3g22370 P1B07 214L16T7 Alpha-DOX1 fatty acid dioxygenase At3g01420 P1B08 218B16T7 Blue copper binding protein At5g20230 P1B09 225I19T7 Peroxidase At3g49120 P1B10 281H9T7 Basic chitinase At3g12500 P1B11 92G1T7 Glutathione peroxidase At2g31570 P1B12 190H7T7 Glutathione reductase At3g24170 P1C01 185P3T7 Photosystem II type I chlorophyll a /b binding protein; At2g34430 P1C02 161I22T7 Putative [Mn] superoxide dismutase; At3g10920 P1C03 109J19T7 Allene oxide synthase At5g42650 P1C04 230J8T7 Catalase 1 At1g20630 P1C05 118M15T7 Glutaredoxin-like protein At5g40370 P1C06 34D1T7 Adenosine-5'-phosphosulfate reductase At1g62180 P1C07 73F9T7 Symbiosis-related like protein At4g16520 P1C08 164P11T7 Wall-associated kinase 2 At1g21270 P1C09 230O3T7 Glutathione peroxidase; ATGP1 At4g11600 P1C10 118F4T7 GF14; F3F9.16; GF14omega isoform At1g78300 P1C11 173H17T7 AHP1; ATHP3; histidine-containing phosphotransfer protein At3g21510 P1C12 245J14T7 AHP2; ATHP1; histidine-containing phosphotransfer protein At3g29350 P1D01 213J6T7 AHP3; ATHP2; histidine-containing phosphotransfer protein At5g39340 P1D02 110E19T7 ETR1; ethylene-response protein At1g66340 P1D03 89B11T7 Putative ethylene receptor (EIN4) At3g04580 P1D04 245L12T7 Putative histidine kinase At2g01830 P1D05 89M16T7
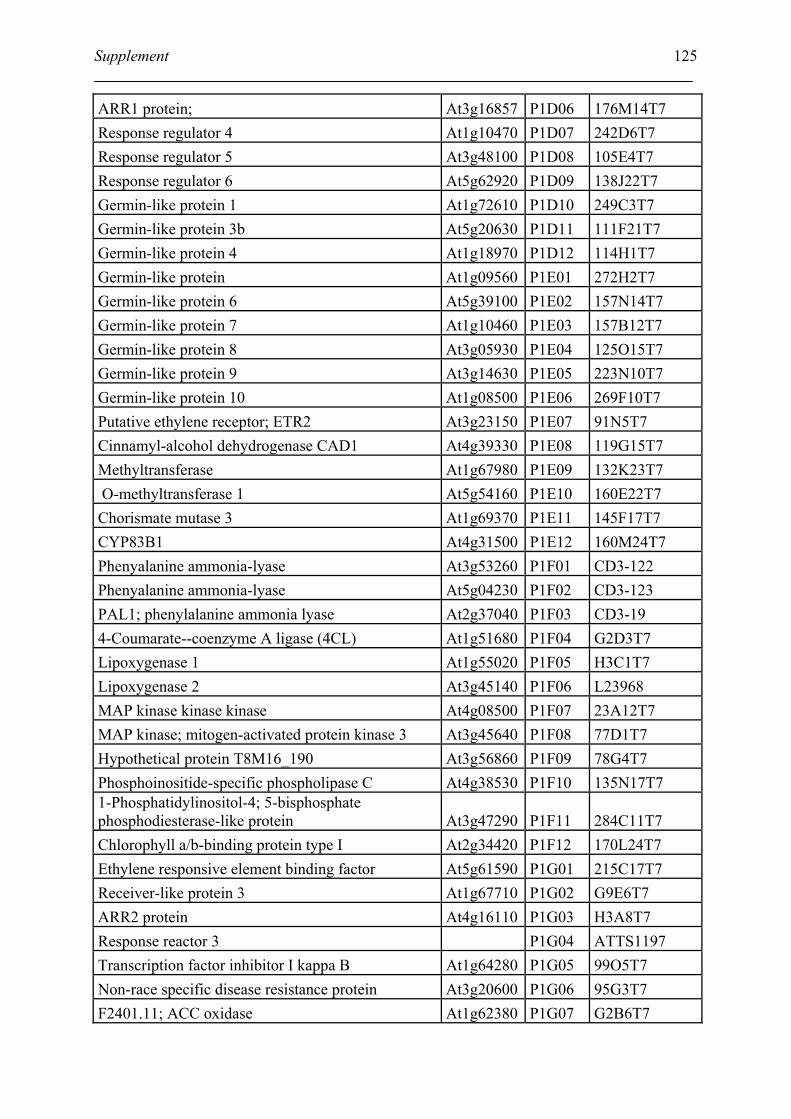
Supplement
125
ARR1 protein; At3g16857 P1D06 176M14T7 Response regulator 4 At1g10470 P1D07 242D6T7 Response regulator 5 At3g48100 P1D08 105E4T7 Response regulator 6 At5g62920 P1D09 138J22T7 Germin-like protein 1 At1g72610 P1D10 249C3T7 Germin-like protein 3b At5g20630 P1D11 111F21T7 Germin-like protein 4 At1g18970 P1D12 114H1T7 Germin-like protein At1g09560 P1E01 272H2T7 Germin-like protein 6 At5g39100 P1E02 157N14T7 Germin-like protein 7 At1g10460 P1E03 157B12T7 Germin-like protein 8 At3g05930 P1E04 125O15T7 Germin-like protein 9 At3g14630 P1E05 223N10T7 Germin-like protein 10 At1g08500 P1E06 269F10T7 Putative ethylene receptor; ETR2 At3g23150 P1E07 91N5T7 Cinnamyl-alcohol dehydrogenase CAD1 At4g39330 P1E08 119G15T7 Methyltransferase At1g67980 P1E09 132K23T7 O-methyltransferase 1 At5g54160 P1E10 160E22T7 Chorismate mutase 3 At1g69370 P1E11 145F17T7 CYP83B1 At4g31500 P1E12 160M24T7 Phenyalanine ammonia-lyase At3g53260 P1F01 CD3-122 Phenyalanine ammonia-lyase At5g04230 P1F02 CD3-123 PAL1; phenylalanine ammonia lyase At2g37040 P1F03 CD3-19 4-Coumarate--coenzyme A ligase (4CL) At1g51680 P1F04 G2D3T7 Lipoxygenase 1 At1g55020 P1F05 H3C1T7 Lipoxygenase 2 At3g45140 P1F06 L23968 MAP kinase kinase kinase At4g08500 P1F07 23A12T7 MAP kinase; mitogen-activated protein kinase 3 At3g45640 P1F08 77D1T7 Hypothetical protein T8M16_190 At3g56860 P1F09 78G4T7 Phosphoinositide-specific phospholipase C At4g38530 P1F10 135N17T7 1-Phosphatidylinositol-4; 5-bisphosphate phosphodiesterase-like protein At3g47290 P1F11 284C11T7 Chlorophyll a/b-binding protein type I At2g34420 P1F12 170L24T7 Ethylene responsive element binding factor At5g61590 P1G01 215C17T7 Receiver-like protein 3 At1g67710 P1G02 G9E6T7 ARR2 protein At4g16110 P1G03 H3A8T7 Response reactor 3 P1G04 ATTS1197 Transcription factor inhibitor I kappa B At1g64280 P1G05 99O5T7 Non-race specific disease resistance protein At3g20600 P1G06 95G3T7 F2401.11; ACC oxidase At1g62380 P1G07 G2B6T7
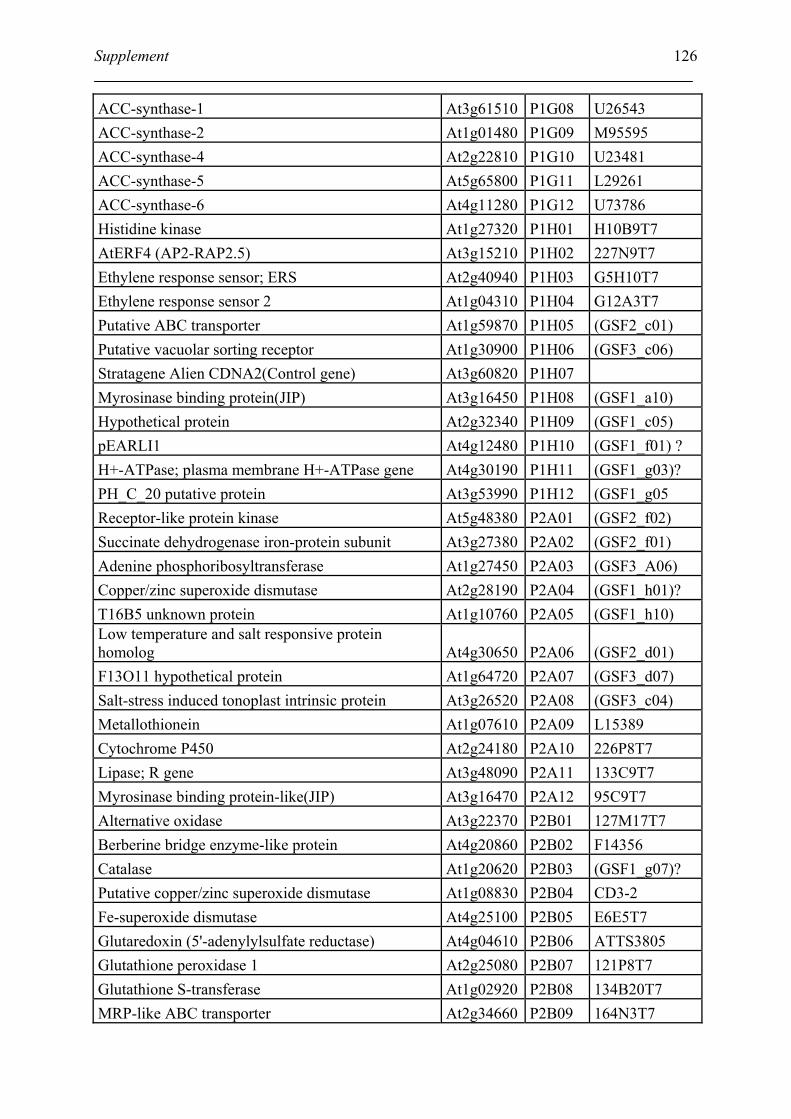
Supplement
126
ACC-synthase-1 At3g61510 P1G08 U26543 ACC-synthase-2 At1g01480 P1G09 M95595 ACC-synthase-4 At2g22810 P1G10 U23481 ACC-synthase-5 At5g65800 P1G11 L29261 ACC-synthase-6 At4g11280 P1G12 U73786 Histidine kinase At1g27320 P1H01 H10B9T7 AtERF4 (AP2-RAP2.5) At3g15210 P1H02 227N9T7 Ethylene response sensor; ERS At2g40940 P1H03 G5H10T7 Ethylene response sensor 2 At1g04310 P1H04 G12A3T7 Putative ABC transporter At1g59870 P1H05 (GSF2_c01) Putative vacuolar sorting receptor At1g30900 P1H06 (GSF3_c06) Stratagene Alien CDNA2(Control gene) At3g60820 P1H07 Myrosinase binding protein(JIP) At3g16450 P1H08 (GSF1_a10) Hypothetical protein At2g32340 P1H09 (GSF1_c05) pEARLI1 At4g12480 P1H10 (GSF1_f01) ? H+-ATPase; plasma membrane H+-ATPase gene At4g30190 P1H11 (GSF1_g03)? PH_C_20 putative protein At3g53990 P1H12 (GSF1_g05 Receptor-like protein kinase At5g48380 P2A01 (GSF2_f02) Succinate dehydrogenase iron-protein subunit At3g27380 P2A02 (GSF2_f01) Adenine phosphoribosyltransferase At1g27450 P2A03 (GSF3_A06) Copper/zinc superoxide dismutase At2g28190 P2A04 (GSF1_h01)? T16B5 unknown protein At1g10760 P2A05 (GSF1_h10) Low temperature and salt responsive protein homolog At4g30650 P2A06 (GSF2_d01) F13O11 hypothetical protein At1g64720 P2A07 (GSF3_d07) Salt-stress induced tonoplast intrinsic protein At3g26520 P2A08 (GSF3_c04) Metallothionein At1g07610 P2A09 L15389 Cytochrome P450 At2g24180 P2A10 226P8T7 Lipase; R gene At3g48090 P2A11 133C9T7 Myrosinase binding protein-like(JIP) At3g16470 P2A12 95C9T7 Alternative oxidase At3g22370 P2B01 127M17T7 Berberine bridge enzyme-like protein At4g20860 P2B02 F14356 Catalase At1g20620 P2B03 (GSF1_g07)? Putative copper/zinc superoxide dismutase At1g08830 P2B04 CD3-2 Fe-superoxide dismutase At4g25100 P2B05 E6E5T7 Glutaredoxin (5'-adenylylsulfate reductase) At4g04610 P2B06 ATTS3805 Glutathione peroxidase 1 At2g25080 P2B07 121P8T7 Glutathione S-transferase At1g02920 P2B08 134B20T7 MRP-like ABC transporter At2g34660 P2B09 164N3T7
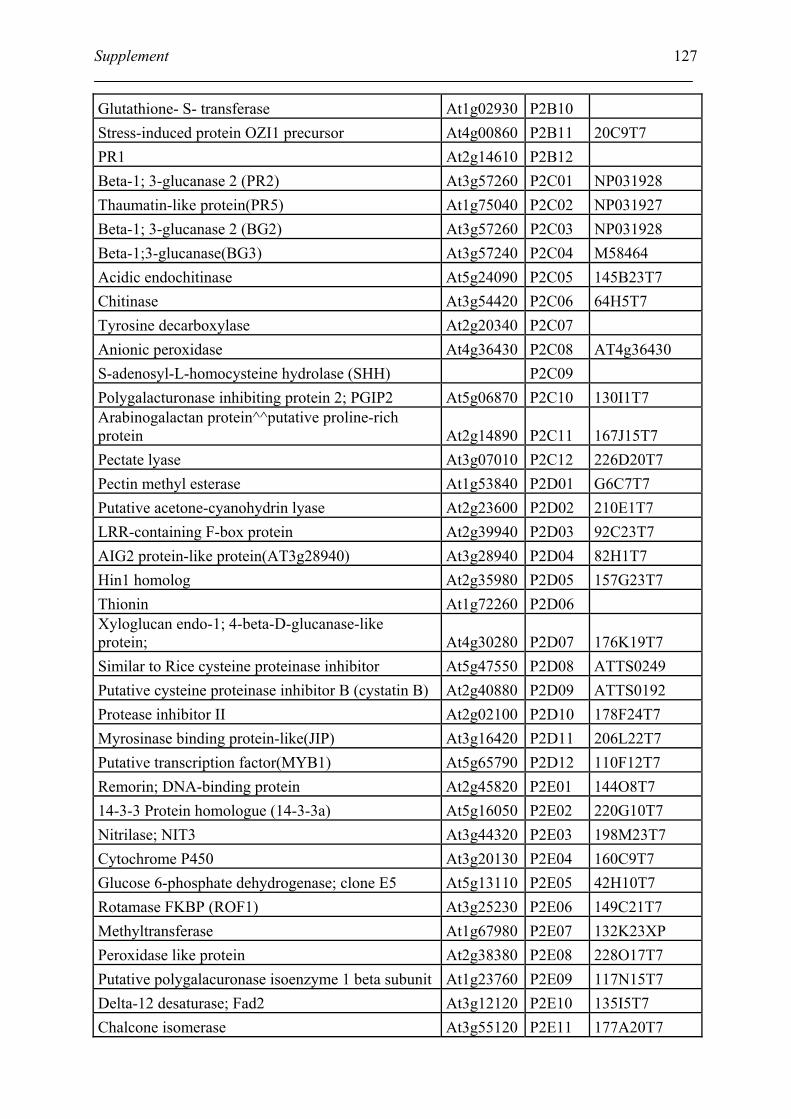
Supplement
127
Glutathione- S- transferase At1g02930 P2B10 Stress-induced protein OZI1 precursor At4g00860 P2B11 20C9T7 PR1 At2g14610 P2B12 Beta-1; 3-glucanase 2 (PR2) At3g57260 P2C01 NP031928 Thaumatin-like protein(PR5) At1g75040 P2C02 NP031927 Beta-1; 3-glucanase 2 (BG2) At3g57260 P2C03 NP031928 Beta-1;3-glucanase(BG3) At3g57240 P2C04 M58464 Acidic endochitinase At5g24090 P2C05 145B23T7 Chitinase At3g54420 P2C06 64H5T7 Tyrosine decarboxylase At2g20340 P2C07 Anionic peroxidase At4g36430 P2C08 AT4g36430 S-adenosyl-L-homocysteine hydrolase (SHH) P2C09 Polygalacturonase inhibiting protein 2; PGIP2 At5g06870 P2C10 130I1T7 Arabinogalactan protein^^putative proline-rich protein At2g14890 P2C11 167J15T7 Pectate lyase At3g07010 P2C12 226D20T7 Pectin methyl esterase At1g53840 P2D01 G6C7T7 Putative acetone-cyanohydrin lyase At2g23600 P2D02 210E1T7 LRR-containing F-box protein At2g39940 P2D03 92C23T7 AIG2 protein-like protein(AT3g28940) At3g28940 P2D04 82H1T7 Hin1 homolog At2g35980 P2D05 157G23T7 Thionin At1g72260 P2D06 Xyloglucan endo-1; 4-beta-D-glucanase-like protein; At4g30280 P2D07 176K19T7 Similar to Rice cysteine proteinase inhibitor At5g47550 P2D08 ATTS0249 Putative cysteine proteinase inhibitor B (cystatin B) At2g40880 P2D09 ATTS0192 Protease inhibitor II At2g02100 P2D10 178F24T7 Myrosinase binding protein-like(JIP) At3g16420 P2D11 206L22T7 Putative transcription factor(MYB1) At5g65790 P2D12 110F12T7 Remorin; DNA-binding protein At2g45820 P2E01 144O8T7 14-3-3 Protein homologue (14-3-3a) At5g16050 P2E02 220G10T7 Nitrilase; NIT3 At3g44320 P2E03 198M23T7 Cytochrome P450 At3g20130 P2E04 160C9T7 Glucose 6-phosphate dehydrogenase; clone E5 At5g13110 P2E05 42H10T7 Rotamase FKBP (ROF1) At3g25230 P2E06 149C21T7 Methyltransferase At1g67980 P2E07 132K23XP Peroxidase like protein At2g38380 P2E08 228O17T7 Putative polygalacuronase isoenzyme 1 beta subunit At1g23760 P2E09 117N15T7 Delta-12 desaturase; Fad2 At3g12120 P2E10 135I5T7 Chalcone isomerase At3g55120 P2E11 177A20T7
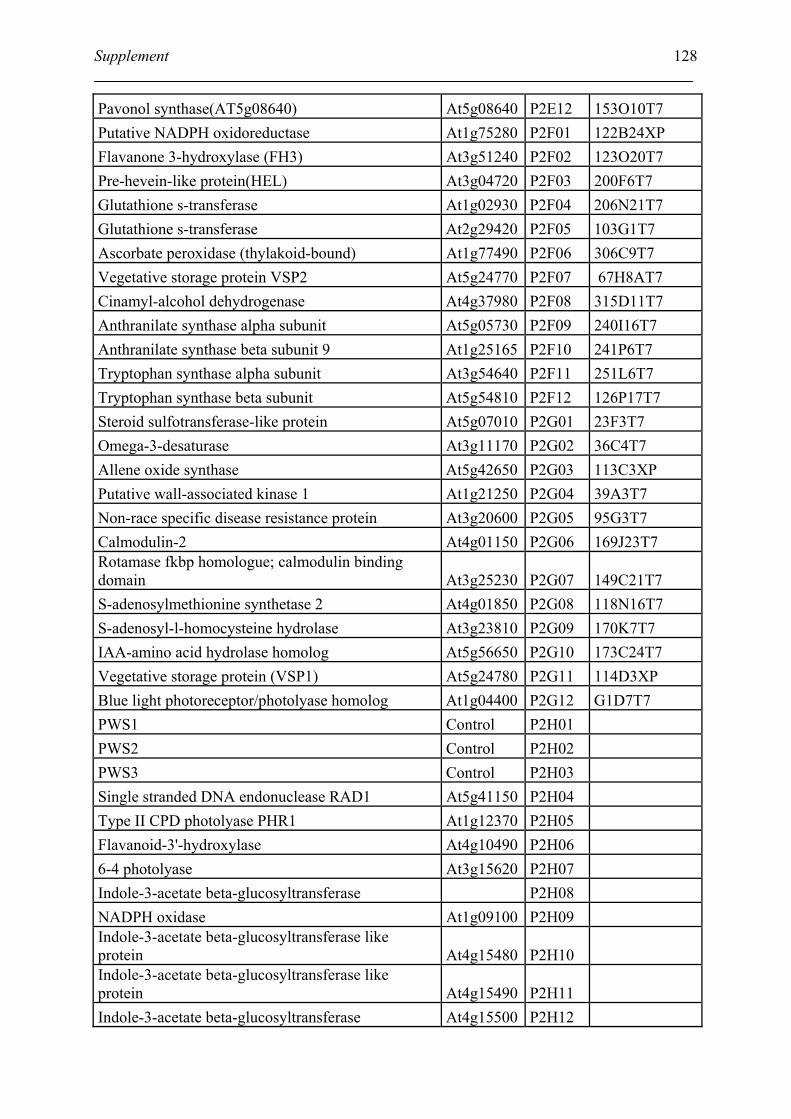
Supplement
128
Pavonol synthase(AT5g08640) At5g08640 P2E12 153O10T7 Putative NADPH oxidoreductase At1g75280 P2F01 122B24XP Flavanone 3-hydroxylase (FH3) At3g51240 P2F02 123O20T7 Pre-hevein-like protein(HEL) At3g04720 P2F03 200F6T7 Glutathione s-transferase At1g02930 P2F04 206N21T7 Glutathione s-transferase At2g29420 P2F05 103G1T7 Ascorbate peroxidase (thylakoid-bound) At1g77490 P2F06 306C9T7 Vegetative storage protein VSP2 At5g24770 P2F07 67H8AT7 Cinamyl-alcohol dehydrogenase At4g37980 P2F08 315D11T7 Anthranilate synthase alpha subunit At5g05730 P2F09 240I16T7 Anthranilate synthase beta subunit 9 At1g25165 P2F10 241P6T7 Tryptophan synthase alpha subunit At3g54640 P2F11 251L6T7 Tryptophan synthase beta subunit At5g54810 P2F12 126P17T7 Steroid sulfotransferase-like protein At5g07010 P2G01 23F3T7 Omega-3-desaturase At3g11170 P2G02 36C4T7 Allene oxide synthase At5g42650 P2G03 113C3XP Putative wall-associated kinase 1 At1g21250 P2G04 39A3T7 Non-race specific disease resistance protein At3g20600 P2G05 95G3T7 Calmodulin-2 At4g01150 P2G06 169J23T7 Rotamase fkbp homologue; calmodulin binding domain At3g25230 P2G07 149C21T7 S-adenosylmethionine synthetase 2 At4g01850 P2G08 118N16T7 S-adenosyl-l-homocysteine hydrolase At3g23810 P2G09 170K7T7 IAA-amino acid hydrolase homolog At5g56650 P2G10 173C24T7 Vegetative storage protein (VSP1) At5g24780 P2G11 114D3XP Blue light photoreceptor/photolyase homolog At1g04400 P2G12 G1D7T7 PWS1 Control P2H01 PWS2 Control P2H02 PWS3 Control P2H03 Single stranded DNA endonuclease RAD1 At5g41150 P2H04 Type II CPD photolyase PHR1 At1g12370 P2H05 Flavanoid-3'-hydroxylase At4g10490 P2H06 6-4 photolyase At3g15620 P2H07 Indole-3-acetate beta-glucosyltransferase P2H08 NADPH oxidase At1g09100 P2H09 Indole-3-acetate beta-glucosyltransferase like protein At4g15480 P2H10 Indole-3-acetate beta-glucosyltransferase like protein At4g15490 P2H11 Indole-3-acetate beta-glucosyltransferase At4g15500 P2H12
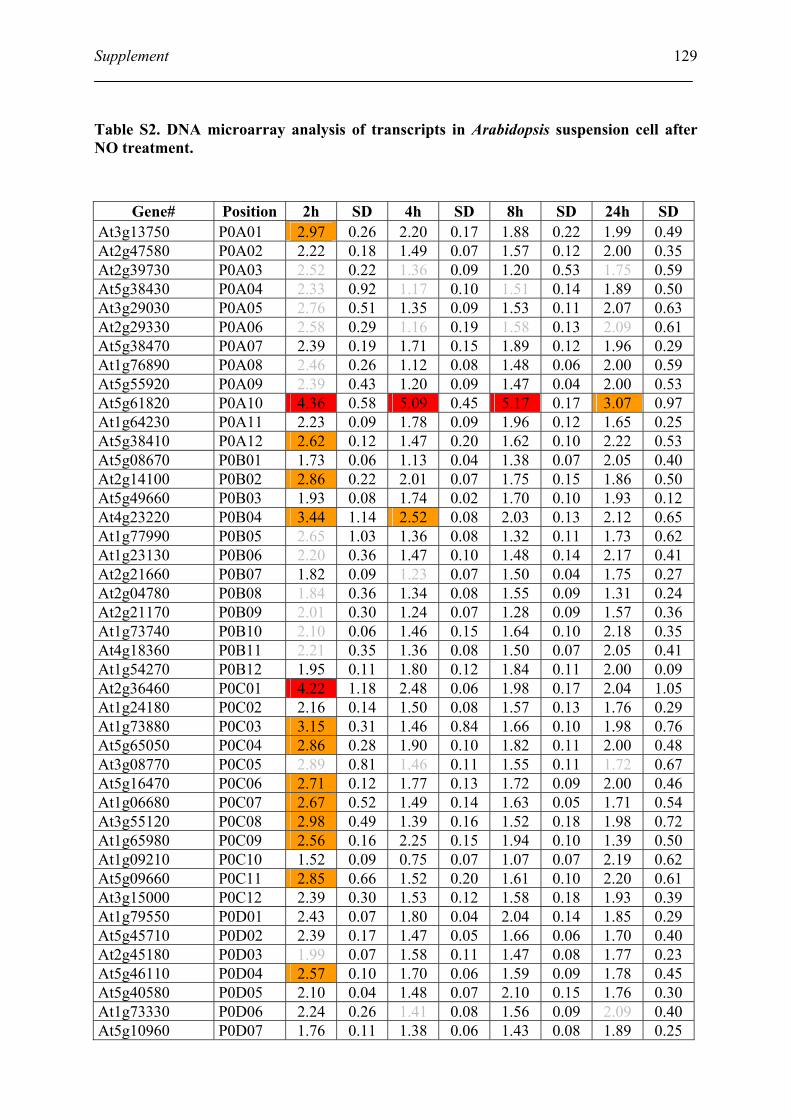
Supplement
129
Table S2. DNA microarray analysis of transcripts in Arabidopsis suspension cell after NO treatment.
Gene# Position 2h SD 4h SD 8h SD 24h SD At3g13750 P0A01 2.97 0.26 2.20 0.17 1.88 0.22 1.99 0.49 At2g47580 P0A02 2.22 0.18 1.49 0.07 1.57 0.12 2.00 0.35 At2g39730 P0A03 2.52 0.22 1.36 0.09 1.20 0.53 1.75 0.59 At5g38430 P0A04 2.33 0.92 1.17 0.10 1.51 0.14 1.89 0.50 At3g29030 P0A05 2.76 0.51 1.35 0.09 1.53 0.11 2.07 0.63 At2g29330 P0A06 2.58 0.29 1.16 0.19 1.58 0.13 2.09 0.61 At5g38470 P0A07 2.39 0.19 1.71 0.15 1.89 0.12 1.96 0.29 At1g76890 P0A08 2.46 0.26 1.12 0.08 1.48 0.06 2.00 0.59 At5g55920 P0A09 2.39 0.43 1.20 0.09 1.47 0.04 2.00 0.53 At5g61820 P0A10 4.36 0.58 5.09 0.45 5.17 0.17 3.07 0.97 At1g64230 P0A11 2.23 0.09 1.78 0.09 1.96 0.12 1.65 0.25 At5g38410 P0A12 2.62 0.12 1.47 0.20 1.62 0.10 2.22 0.53 At5g08670 P0B01 1.73 0.06 1.13 0.04 1.38 0.07 2.05 0.40 At2g14100 P0B02 2.86 0.22 2.01 0.07 1.75 0.15 1.86 0.50 At5g49660 P0B03 1.93 0.08 1.74 0.02 1.70 0.10 1.93 0.12 At4g23220 P0B04 3.44 1.14 2.52 0.08 2.03 0.13 2.12 0.65 At1g77990 P0B05 2.65 1.03 1.36 0.08 1.32 0.11 1.73 0.62 At1g23130 P0B06 2.20 0.36 1.47 0.10 1.48 0.14 2.17 0.41 At2g21660 P0B07 1.82 0.09 1.23 0.07 1.50 0.04 1.75 0.27 At2g04780 P0B08 1.84 0.36 1.34 0.08 1.55 0.09 1.31 0.24 At2g21170 P0B09 2.01 0.30 1.24 0.07 1.28 0.09 1.57 0.36 At1g73740 P0B10 2.10 0.06 1.46 0.15 1.64 0.10 2.18 0.35 At4g18360 P0B11 2.21 0.35 1.36 0.08 1.50 0.07 2.05 0.41 At1g54270 P0B12 1.95 0.11 1.80 0.12 1.84 0.11 2.00 0.09 At2g36460 P0C01 4.22 1.18 2.48 0.06 1.98 0.17 2.04 1.05 At1g24180 P0C02 2.16 0.14 1.50 0.08 1.57 0.13 1.76 0.29 At1g73880 P0C03 3.15 0.31 1.46 0.84 1.66 0.10 1.98 0.76 At5g65050 P0C04 2.86 0.28 1.90 0.10 1.82 0.11 2.00 0.48 At3g08770 P0C05 2.89 0.81 1.46 0.11 1.55 0.11 1.72 0.67 At5g16470 P0C06 2.71 0.12 1.77 0.13 1.72 0.09 2.00 0.46 At1g06680 P0C07 2.67 0.52 1.49 0.14 1.63 0.05 1.71 0.54 At3g55120 P0C08 2.98 0.49 1.39 0.16 1.52 0.18 1.98 0.72 At1g65980 P0C09 2.56 0.16 2.25 0.15 1.94 0.10 1.39 0.50 At1g09210 P0C10 1.52 0.09 0.75 0.07 1.07 0.07 2.19 0.62 At5g09660 P0C11 2.85 0.66 1.52 0.20 1.61 0.10 2.20 0.61 At3g15000 P0C12 2.39 0.30 1.53 0.12 1.58 0.18 1.93 0.39 At1g79550 P0D01 2.43 0.07 1.80 0.04 2.04 0.14 1.85 0.29 At5g45710 P0D02 2.39 0.17 1.47 0.05 1.66 0.06 1.70 0.40 At2g45180 P0D03 1.99 0.07 1.58 0.11 1.47 0.08 1.77 0.23 At5g46110 P0D04 2.57 0.10 1.70 0.06 1.59 0.09 1.78 0.45 At5g40580 P0D05 2.10 0.04 1.48 0.07 2.10 0.15 1.76 0.30 At1g73330 P0D06 2.24 0.26 1.41 0.08 1.56 0.09 2.09 0.40 At5g10960 P0D07 1.76 0.11 1.38 0.06 1.43 0.08 1.89 0.25
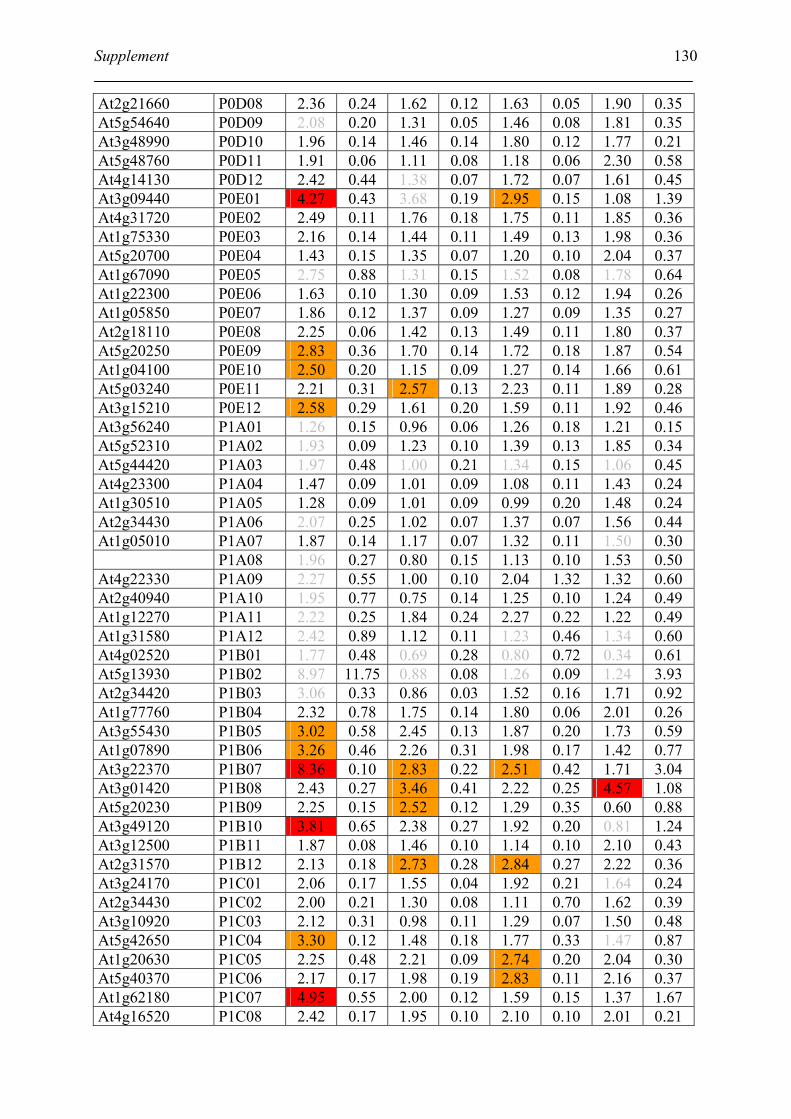
Supplement
130
At2g21660 P0D08 2.36 0.24 1.62 0.12 1.63 0.05 1.90 0.35 At5g54640 P0D09 2.08 0.20 1.31 0.05 1.46 0.08 1.81 0.35 At3g48990 P0D10 1.96 0.14 1.46 0.14 1.80 0.12 1.77 0.21 At5g48760 P0D11 1.91 0.06 1.11 0.08 1.18 0.06 2.30 0.58 At4g14130 P0D12 2.42 0.44 1.38 0.07 1.72 0.07 1.61 0.45 At3g09440 P0E01 4.27 0.43 3.68 0.19 2.95 0.15 1.08 1.39 At4g31720 P0E02 2.49 0.11 1.76 0.18 1.75 0.11 1.85 0.36 At1g75330 P0E03 2.16 0.14 1.44 0.11 1.49 0.13 1.98 0.36 At5g20700 P0E04 1.43 0.15 1.35 0.07 1.20 0.10 2.04 0.37 At1g67090 P0E05 2.75 0.88 1.31 0.15 1.52 0.08 1.78 0.64 At1g22300 P0E06 1.63 0.10 1.30 0.09 1.53 0.12 1.94 0.26 At1g05850 P0E07 1.86 0.12 1.37 0.09 1.27 0.09 1.35 0.27 At2g18110 P0E08 2.25 0.06 1.42 0.13 1.49 0.11 1.80 0.37 At5g20250 P0E09 2.83 0.36 1.70 0.14 1.72 0.18 1.87 0.54 At1g04100 P0E10 2.50 0.20 1.15 0.09 1.27 0.14 1.66 0.61 At5g03240 P0E11 2.21 0.31 2.57 0.13 2.23 0.11 1.89 0.28 At3g15210 P0E12 2.58 0.29 1.61 0.20 1.59 0.11 1.92 0.46 At3g56240 P1A01 1.26 0.15 0.96 0.06 1.26 0.18 1.21 0.15 At5g52310 P1A02 1.93 0.09 1.23 0.10 1.39 0.13 1.85 0.34 At5g44420 P1A03 1.97 0.48 1.00 0.21 1.34 0.15 1.06 0.45 At4g23300 P1A04 1.47 0.09 1.01 0.09 1.08 0.11 1.43 0.24 At1g30510 P1A05 1.28 0.09 1.01 0.09 0.99 0.20 1.48 0.24 At2g34430 P1A06 2.07 0.25 1.02 0.07 1.37 0.07 1.56 0.44 At1g05010 P1A07 1.87 0.14 1.17 0.07 1.32 0.11 1.50 0.30 P1A08 1.96 0.27 0.80 0.15 1.13 0.10 1.53 0.50 At4g22330 P1A09 2.27 0.55 1.00 0.10 2.04 1.32 1.32 0.60 At2g40940 P1A10 1.95 0.77 0.75 0.14 1.25 0.10 1.24 0.49 At1g12270 P1A11 2.22 0.25 1.84 0.24 2.27 0.22 1.22 0.49 At1g31580 P1A12 2.42 0.89 1.12 0.11 1.23 0.46 1.34 0.60 At4g02520 P1B01 1.77 0.48 0.69 0.28 0.80 0.72 0.34 0.61 At5g13930 P1B02 8.97 11.75 0.88 0.08 1.26 0.09 1.24 3.93 At2g34420 P1B03 3.06 0.33 0.86 0.03 1.52 0.16 1.71 0.92 At1g77760 P1B04 2.32 0.78 1.75 0.14 1.80 0.06 2.01 0.26 At3g55430 P1B05 3.02 0.58 2.45 0.13 1.87 0.20 1.73 0.59 At1g07890 P1B06 3.26 0.46 2.26 0.31 1.98 0.17 1.42 0.77 At3g22370 P1B07 8.36 0.10 2.83 0.22 2.51 0.42 1.71 3.04 At3g01420 P1B08 2.43 0.27 3.46 0.41 2.22 0.25 4.57 1.08 At5g20230 P1B09 2.25 0.15 2.52 0.12 1.29 0.35 0.60 0.88 At3g49120 P1B10 3.81 0.65 2.38 0.27 1.92 0.20 0.81 1.24 At3g12500 P1B11 1.87 0.08 1.46 0.10 1.14 0.10 2.10 0.43 At2g31570 P1B12 2.13 0.18 2.73 0.28 2.84 0.27 2.22 0.36 At3g24170 P1C01 2.06 0.17 1.55 0.04 1.92 0.21 1.64 0.24 At2g34430 P1C02 2.00 0.21 1.30 0.08 1.11 0.70 1.62 0.39 At3g10920 P1C03 2.12 0.31 0.98 0.11 1.29 0.07 1.50 0.48 At5g42650 P1C04 3.30 0.12 1.48 0.18 1.77 0.33 1.47 0.87 At1g20630 P1C05 2.25 0.48 2.21 0.09 2.74 0.20 2.04 0.30 At5g40370 P1C06 2.17 0.17 1.98 0.19 2.83 0.11 2.16 0.37 At1g62180 P1C07 4.95 0.55 2.00 0.12 1.59 0.15 1.37 1.67 At4g16520 P1C08 2.42 0.17 1.95 0.10 2.10 0.10 2.01 0.21
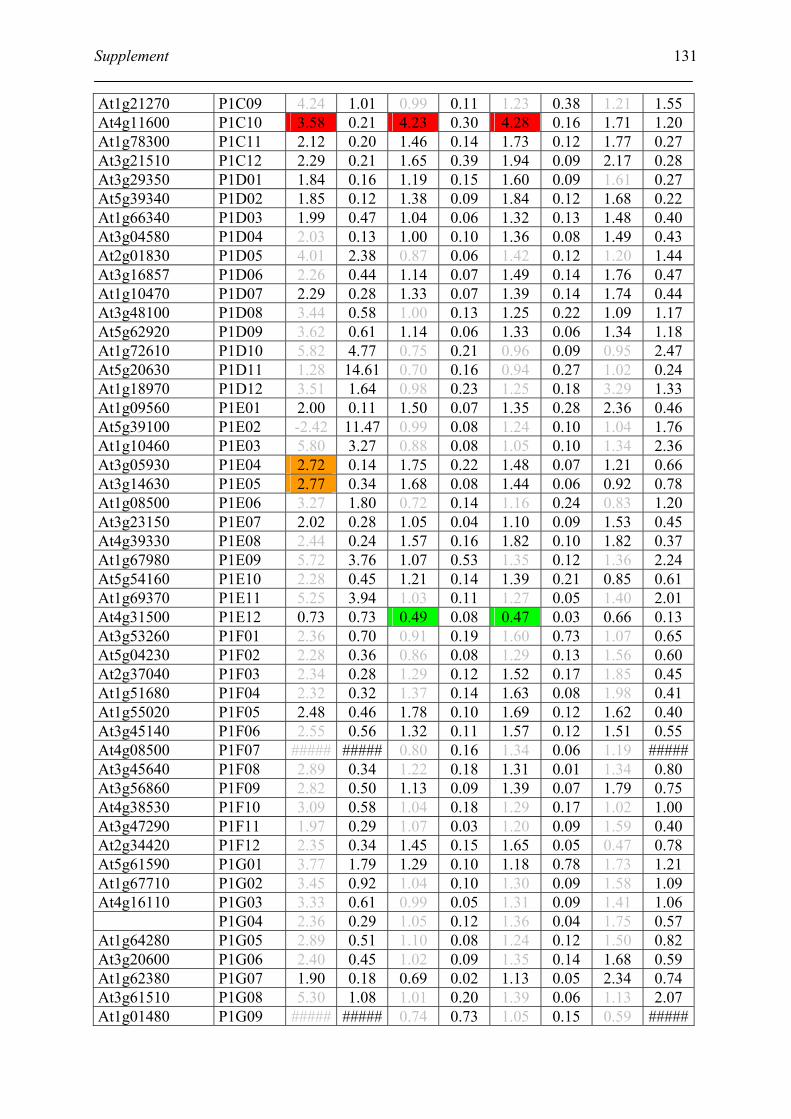
Supplement
131
At1g21270 P1C09 4.24 1.01 0.99 0.11 1.23 0.38 1.21 1.55 At4g11600 P1C10 3.58 0.21 4.23 0.30 4.28 0.16 1.71 1.20 At1g78300 P1C11 2.12 0.20 1.46 0.14 1.73 0.12 1.77 0.27 At3g21510 P1C12 2.29 0.21 1.65 0.39 1.94 0.09 2.17 0.28 At3g29350 P1D01 1.84 0.16 1.19 0.15 1.60 0.09 1.61 0.27 At5g39340 P1D02 1.85 0.12 1.38 0.09 1.84 0.12 1.68 0.22 At1g66340 P1D03 1.99 0.47 1.04 0.06 1.32 0.13 1.48 0.40 At3g04580 P1D04 2.03 0.13 1.00 0.10 1.36 0.08 1.49 0.43 At2g01830 P1D05 4.01 2.38 0.87 0.06 1.42 0.12 1.20 1.44 At3g16857 P1D06 2.26 0.44 1.14 0.07 1.49 0.14 1.76 0.47 At1g10470 P1D07 2.29 0.28 1.33 0.07 1.39 0.14 1.74 0.44 At3g48100 P1D08 3.44 0.58 1.00 0.13 1.25 0.22 1.09 1.17 At5g62920 P1D09 3.62 0.61 1.14 0.06 1.33 0.06 1.34 1.18 At1g72610 P1D10 5.82 4.77 0.75 0.21 0.96 0.09 0.95 2.47 At5g20630 P1D11 1.28 14.61 0.70 0.16 0.94 0.27 1.02 0.24 At1g18970 P1D12 3.51 1.64 0.98 0.23 1.25 0.18 3.29 1.33 At1g09560 P1E01 2.00 0.11 1.50 0.07 1.35 0.28 2.36 0.46 At5g39100 P1E02 -2.42 11.47 0.99 0.08 1.24 0.10 1.04 1.76 At1g10460 P1E03 5.80 3.27 0.88 0.08 1.05 0.10 1.34 2.36 At3g05930 P1E04 2.72 0.14 1.75 0.22 1.48 0.07 1.21 0.66 At3g14630 P1E05 2.77 0.34 1.68 0.08 1.44 0.06 0.92 0.78 At1g08500 P1E06 3.27 1.80 0.72 0.14 1.16 0.24 0.83 1.20 At3g23150 P1E07 2.02 0.28 1.05 0.04 1.10 0.09 1.53 0.45 At4g39330 P1E08 2.44 0.24 1.57 0.16 1.82 0.10 1.82 0.37 At1g67980 P1E09 5.72 3.76 1.07 0.53 1.35 0.12 1.36 2.24 At5g54160 P1E10 2.28 0.45 1.21 0.14 1.39 0.21 0.85 0.61 At1g69370 P1E11 5.25 3.94 1.03 0.11 1.27 0.05 1.40 2.01 At4g31500 P1E12 0.73 0.73 0.49 0.08 0.47 0.03 0.66 0.13 At3g53260 P1F01 2.36 0.70 0.91 0.19 1.60 0.73 1.07 0.65 At5g04230 P1F02 2.28 0.36 0.86 0.08 1.29 0.13 1.56 0.60 At2g37040 P1F03 2.34 0.28 1.29 0.12 1.52 0.17 1.85 0.45 At1g51680 P1F04 2.32 0.32 1.37 0.14 1.63 0.08 1.98 0.41 At1g55020 P1F05 2.48 0.46 1.78 0.10 1.69 0.12 1.62 0.40 At3g45140 P1F06 2.55 0.56 1.32 0.11 1.57 0.12 1.51 0.55 At4g08500 P1F07 ##### ##### 0.80 0.16 1.34 0.06 1.19 #####At3g45640 P1F08 2.89 0.34 1.22 0.18 1.31 0.01 1.34 0.80 At3g56860 P1F09 2.82 0.50 1.13 0.09 1.39 0.07 1.79 0.75 At4g38530 P1F10 3.09 0.58 1.04 0.18 1.29 0.17 1.02 1.00 At3g47290 P1F11 1.97 0.29 1.07 0.03 1.20 0.09 1.59 0.40 At2g34420 P1F12 2.35 0.34 1.45 0.15 1.65 0.05 0.47 0.78 At5g61590 P1G01 3.77 1.79 1.29 0.10 1.18 0.78 1.73 1.21 At1g67710 P1G02 3.45 0.92 1.04 0.10 1.30 0.09 1.58 1.09 At4g16110 P1G03 3.33 0.61 0.99 0.05 1.31 0.09 1.41 1.06 P1G04 2.36 0.29 1.05 0.12 1.36 0.04 1.75 0.57 At1g64280 P1G05 2.89 0.51 1.10 0.08 1.24 0.12 1.50 0.82 At3g20600 P1G06 2.40 0.45 1.02 0.09 1.35 0.14 1.68 0.59 At1g62380 P1G07 1.90 0.18 0.69 0.02 1.13 0.05 2.34 0.74 At3g61510 P1G08 5.30 1.08 1.01 0.20 1.39 0.06 1.13 2.07 At1g01480 P1G09 ##### ##### 0.74 0.73 1.05 0.15 0.59 #####
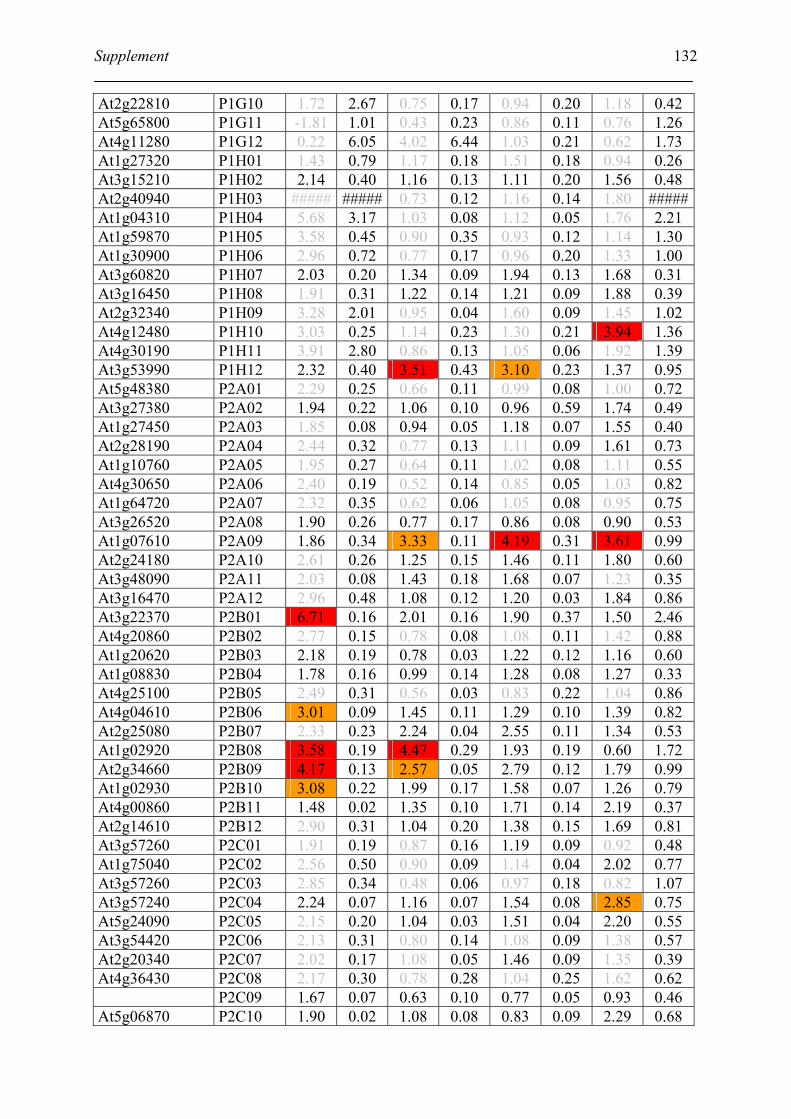
Supplement
132
At2g22810 P1G10 1.72 2.67 0.75 0.17 0.94 0.20 1.18 0.42 At5g65800 P1G11 -1.81 1.01 0.43 0.23 0.86 0.11 0.76 1.26 At4g11280 P1G12 0.22 6.05 4.02 6.44 1.03 0.21 0.62 1.73 At1g27320 P1H01 1.43 0.79 1.17 0.18 1.51 0.18 0.94 0.26 At3g15210 P1H02 2.14 0.40 1.16 0.13 1.11 0.20 1.56 0.48 At2g40940 P1H03 ##### ##### 0.73 0.12 1.16 0.14 1.80 #####At1g04310 P1H04 5.68 3.17 1.03 0.08 1.12 0.05 1.76 2.21 At1g59870 P1H05 3.58 0.45 0.90 0.35 0.93 0.12 1.14 1.30 At1g30900 P1H06 2.96 0.72 0.77 0.17 0.96 0.20 1.33 1.00 At3g60820 P1H07 2.03 0.20 1.34 0.09 1.94 0.13 1.68 0.31 At3g16450 P1H08 1.91 0.31 1.22 0.14 1.21 0.09 1.88 0.39 At2g32340 P1H09 3.28 2.01 0.95 0.04 1.60 0.09 1.45 1.02 At4g12480 P1H10 3.03 0.25 1.14 0.23 1.30 0.21 3.94 1.36 At4g30190 P1H11 3.91 2.80 0.86 0.13 1.05 0.06 1.92 1.39 At3g53990 P1H12 2.32 0.40 3.51 0.43 3.10 0.23 1.37 0.95 At5g48380 P2A01 2.29 0.25 0.66 0.11 0.99 0.08 1.00 0.72 At3g27380 P2A02 1.94 0.22 1.06 0.10 0.96 0.59 1.74 0.49 At1g27450 P2A03 1.85 0.08 0.94 0.05 1.18 0.07 1.55 0.40 At2g28190 P2A04 2.44 0.32 0.77 0.13 1.11 0.09 1.61 0.73 At1g10760 P2A05 1.95 0.27 0.64 0.11 1.02 0.08 1.11 0.55 At4g30650 P2A06 2.40 0.19 0.52 0.14 0.85 0.05 1.03 0.82 At1g64720 P2A07 2.32 0.35 0.62 0.06 1.05 0.08 0.95 0.75 At3g26520 P2A08 1.90 0.26 0.77 0.17 0.86 0.08 0.90 0.53 At1g07610 P2A09 1.86 0.34 3.33 0.11 4.19 0.31 3.61 0.99 At2g24180 P2A10 2.61 0.26 1.25 0.15 1.46 0.11 1.80 0.60 At3g48090 P2A11 2.03 0.08 1.43 0.18 1.68 0.07 1.23 0.35 At3g16470 P2A12 2.96 0.48 1.08 0.12 1.20 0.03 1.84 0.86 At3g22370 P2B01 6.71 0.16 2.01 0.16 1.90 0.37 1.50 2.46 At4g20860 P2B02 2.77 0.15 0.78 0.08 1.08 0.11 1.42 0.88 At1g20620 P2B03 2.18 0.19 0.78 0.03 1.22 0.12 1.16 0.60 At1g08830 P2B04 1.78 0.16 0.99 0.14 1.28 0.08 1.27 0.33 At4g25100 P2B05 2.49 0.31 0.56 0.03 0.83 0.22 1.04 0.86 At4g04610 P2B06 3.01 0.09 1.45 0.11 1.29 0.10 1.39 0.82 At2g25080 P2B07 2.33 0.23 2.24 0.04 2.55 0.11 1.34 0.53 At1g02920 P2B08 3.58 0.19 4.47 0.29 1.93 0.19 0.60 1.72 At2g34660 P2B09 4.17 0.13 2.57 0.05 2.79 0.12 1.79 0.99 At1g02930 P2B10 3.08 0.22 1.99 0.17 1.58 0.07 1.26 0.79 At4g00860 P2B11 1.48 0.02 1.35 0.10 1.71 0.14 2.19 0.37 At2g14610 P2B12 2.90 0.31 1.04 0.20 1.38 0.15 1.69 0.81 At3g57260 P2C01 1.91 0.19 0.87 0.16 1.19 0.09 0.92 0.48 At1g75040 P2C02 2.56 0.50 0.90 0.09 1.14 0.04 2.02 0.77 At3g57260 P2C03 2.85 0.34 0.48 0.06 0.97 0.18 0.82 1.07 At3g57240 P2C04 2.24 0.07 1.16 0.07 1.54 0.08 2.85 0.75 At5g24090 P2C05 2.15 0.20 1.04 0.03 1.51 0.04 2.20 0.55 At3g54420 P2C06 2.13 0.31 0.80 0.14 1.08 0.09 1.38 0.57 At2g20340 P2C07 2.02 0.17 1.08 0.05 1.46 0.09 1.35 0.39 At4g36430 P2C08 2.17 0.30 0.78 0.28 1.04 0.25 1.62 0.62 P2C09 1.67 0.07 0.63 0.10 0.77 0.05 0.93 0.46 At5g06870 P2C10 1.90 0.02 1.08 0.08 0.83 0.09 2.29 0.68
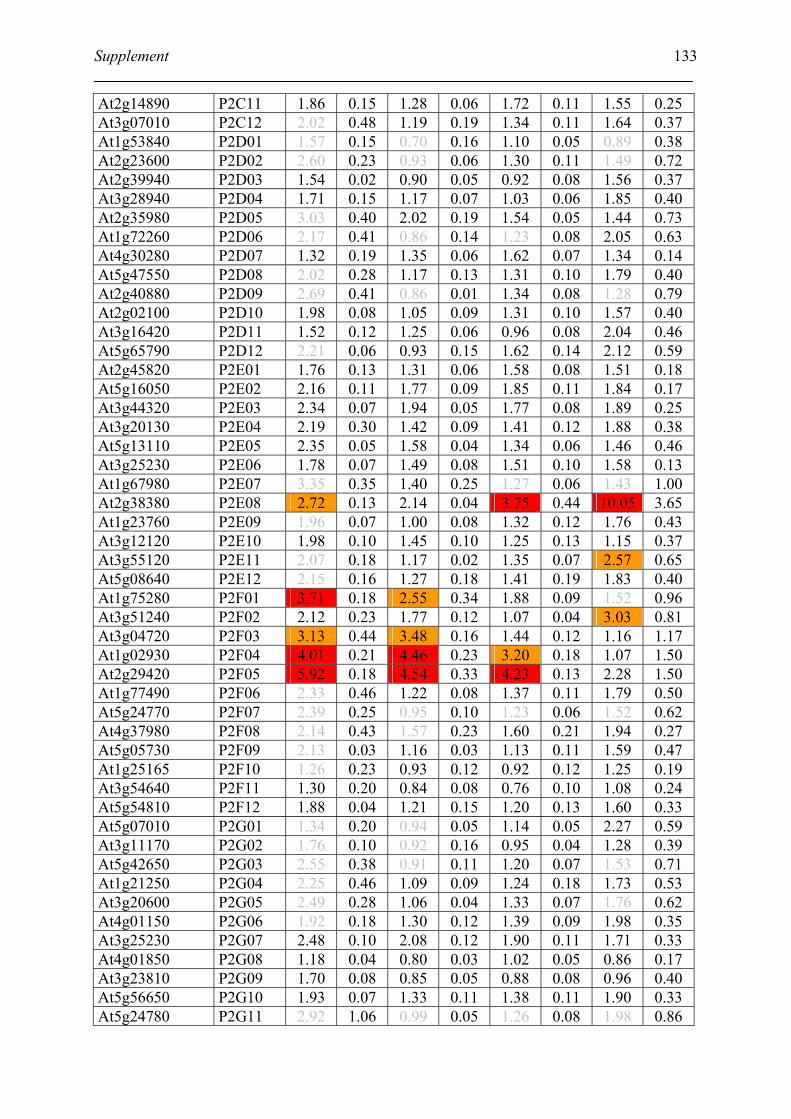
Supplement
133
At2g14890 P2C11 1.86 0.15 1.28 0.06 1.72 0.11 1.55 0.25 At3g07010 P2C12 2.02 0.48 1.19 0.19 1.34 0.11 1.64 0.37 At1g53840 P2D01 1.57 0.15 0.70 0.16 1.10 0.05 0.89 0.38 At2g23600 P2D02 2.60 0.23 0.93 0.06 1.30 0.11 1.49 0.72 At2g39940 P2D03 1.54 0.02 0.90 0.05 0.92 0.08 1.56 0.37 At3g28940 P2D04 1.71 0.15 1.17 0.07 1.03 0.06 1.85 0.40 At2g35980 P2D05 3.03 0.40 2.02 0.19 1.54 0.05 1.44 0.73 At1g72260 P2D06 2.17 0.41 0.86 0.14 1.23 0.08 2.05 0.63 At4g30280 P2D07 1.32 0.19 1.35 0.06 1.62 0.07 1.34 0.14 At5g47550 P2D08 2.02 0.28 1.17 0.13 1.31 0.10 1.79 0.40 At2g40880 P2D09 2.69 0.41 0.86 0.01 1.34 0.08 1.28 0.79 At2g02100 P2D10 1.98 0.08 1.05 0.09 1.31 0.10 1.57 0.40 At3g16420 P2D11 1.52 0.12 1.25 0.06 0.96 0.08 2.04 0.46 At5g65790 P2D12 2.21 0.06 0.93 0.15 1.62 0.14 2.12 0.59 At2g45820 P2E01 1.76 0.13 1.31 0.06 1.58 0.08 1.51 0.18 At5g16050 P2E02 2.16 0.11 1.77 0.09 1.85 0.11 1.84 0.17 At3g44320 P2E03 2.34 0.07 1.94 0.05 1.77 0.08 1.89 0.25 At3g20130 P2E04 2.19 0.30 1.42 0.09 1.41 0.12 1.88 0.38 At5g13110 P2E05 2.35 0.05 1.58 0.04 1.34 0.06 1.46 0.46 At3g25230 P2E06 1.78 0.07 1.49 0.08 1.51 0.10 1.58 0.13 At1g67980 P2E07 3.35 0.35 1.40 0.25 1.27 0.06 1.43 1.00 At2g38380 P2E08 2.72 0.13 2.14 0.04 3.75 0.44 10.05 3.65 At1g23760 P2E09 1.96 0.07 1.00 0.08 1.32 0.12 1.76 0.43 At3g12120 P2E10 1.98 0.10 1.45 0.10 1.25 0.13 1.15 0.37 At3g55120 P2E11 2.07 0.18 1.17 0.02 1.35 0.07 2.57 0.65 At5g08640 P2E12 2.15 0.16 1.27 0.18 1.41 0.19 1.83 0.40 At1g75280 P2F01 3.71 0.18 2.55 0.34 1.88 0.09 1.52 0.96 At3g51240 P2F02 2.12 0.23 1.77 0.12 1.07 0.04 3.03 0.81 At3g04720 P2F03 3.13 0.44 3.48 0.16 1.44 0.12 1.16 1.17 At1g02930 P2F04 4.01 0.21 4.46 0.23 3.20 0.18 1.07 1.50 At2g29420 P2F05 5.92 0.18 4.54 0.33 4.23 0.13 2.28 1.50 At1g77490 P2F06 2.33 0.46 1.22 0.08 1.37 0.11 1.79 0.50 At5g24770 P2F07 2.39 0.25 0.95 0.10 1.23 0.06 1.52 0.62 At4g37980 P2F08 2.14 0.43 1.57 0.23 1.60 0.21 1.94 0.27 At5g05730 P2F09 2.13 0.03 1.16 0.03 1.13 0.11 1.59 0.47 At1g25165 P2F10 1.26 0.23 0.93 0.12 0.92 0.12 1.25 0.19 At3g54640 P2F11 1.30 0.20 0.84 0.08 0.76 0.10 1.08 0.24 At5g54810 P2F12 1.88 0.04 1.21 0.15 1.20 0.13 1.60 0.33 At5g07010 P2G01 1.34 0.20 0.94 0.05 1.14 0.05 2.27 0.59 At3g11170 P2G02 1.76 0.10 0.92 0.16 0.95 0.04 1.28 0.39 At5g42650 P2G03 2.55 0.38 0.91 0.11 1.20 0.07 1.53 0.71 At1g21250 P2G04 2.25 0.46 1.09 0.09 1.24 0.18 1.73 0.53 At3g20600 P2G05 2.49 0.28 1.06 0.04 1.33 0.07 1.76 0.62 At4g01150 P2G06 1.92 0.18 1.30 0.12 1.39 0.09 1.98 0.35 At3g25230 P2G07 2.48 0.10 2.08 0.12 1.90 0.11 1.71 0.33 At4g01850 P2G08 1.18 0.04 0.80 0.03 1.02 0.05 0.86 0.17 At3g23810 P2G09 1.70 0.08 0.85 0.05 0.88 0.08 0.96 0.40 At5g56650 P2G10 1.93 0.07 1.33 0.11 1.38 0.11 1.90 0.33 At5g24780 P2G11 2.92 1.06 0.99 0.05 1.26 0.08 1.98 0.86
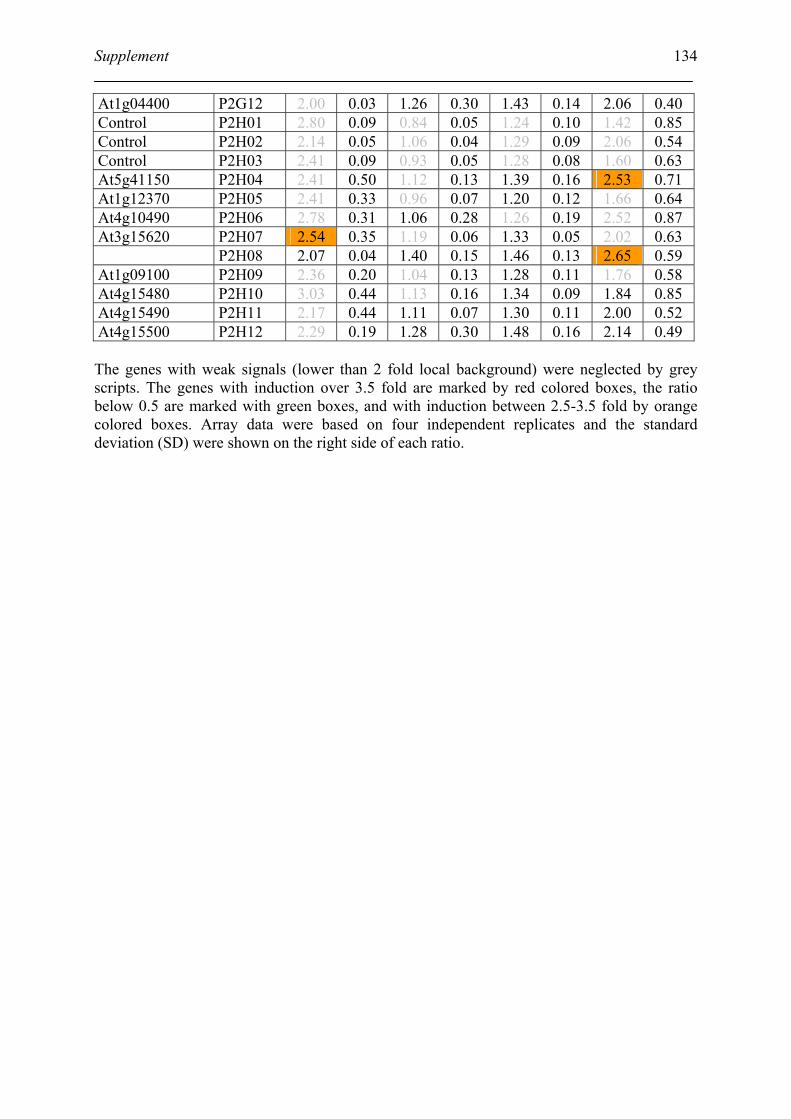
Supplement
134
At1g04400 P2G12 2.00 0.03 1.26 0.30 1.43 0.14 2.06 0.40 Control P2H01 2.80 0.09 0.84 0.05 1.24 0.10 1.42 0.85 Control P2H02 2.14 0.05 1.06 0.04 1.29 0.09 2.06 0.54 Control P2H03 2.41 0.09 0.93 0.05 1.28 0.08 1.60 0.63 At5g41150 P2H04 2.41 0.50 1.12 0.13 1.39 0.16 2.53 0.71 At1g12370 P2H05 2.41 0.33 0.96 0.07 1.20 0.12 1.66 0.64 At4g10490 P2H06 2.78 0.31 1.06 0.28 1.26 0.19 2.52 0.87 At3g15620 P2H07 2.54 0.35 1.19 0.06 1.33 0.05 2.02 0.63 P2H08 2.07 0.04 1.40 0.15 1.46 0.13 2.65 0.59 At1g09100 P2H09 2.36 0.20 1.04 0.13 1.28 0.11 1.76 0.58 At4g15480 P2H10 3.03 0.44 1.13 0.16 1.34 0.09 1.84 0.85 At4g15490 P2H11 2.17 0.44 1.11 0.07 1.30 0.11 2.00 0.52 At4g15500 P2H12 2.29 0.19 1.28 0.30 1.48 0.16 2.14 0.49 The genes with weak signals (lower than 2 fold local background) were neglected by grey scripts. The genes with induction over 3.5 fold are marked by red colored boxes, the ratio below 0.5 are marked with green boxes, and with induction between 2.5-3.5 fold by orange colored boxes. Array data were based on four independent replicates and the standard deviation (SD) were shown on the right side of each ratio.
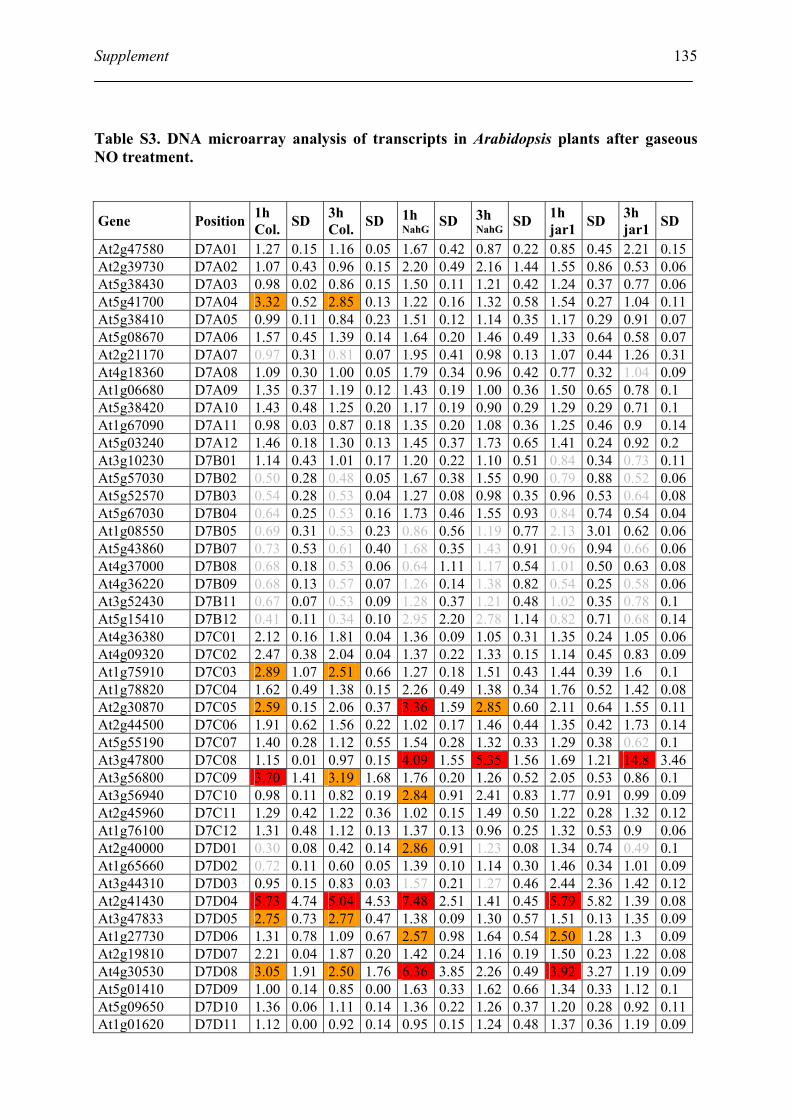
Supplement
135
Table S3. DNA microarray analysis of transcripts in Arabidopsis plants after gaseous NO treatment.
Gene Position 1h Col. SD 3h
Col. SD 1h NahG
SD 3h NahG
SD 1h jar1 SD 3h
jar1 SD
At2g47580 D7A01 1.27 0.15 1.16 0.05 1.67 0.42 0.87 0.22 0.85 0.45 2.21 0.15At2g39730 D7A02 1.07 0.43 0.96 0.15 2.20 0.49 2.16 1.44 1.55 0.86 0.53 0.06At5g38430 D7A03 0.98 0.02 0.86 0.15 1.50 0.11 1.21 0.42 1.24 0.37 0.77 0.06At5g41700 D7A04 3.32 0.52 2.85 0.13 1.22 0.16 1.32 0.58 1.54 0.27 1.04 0.11At5g38410 D7A05 0.99 0.11 0.84 0.23 1.51 0.12 1.14 0.35 1.17 0.29 0.91 0.07At5g08670 D7A06 1.57 0.45 1.39 0.14 1.64 0.20 1.46 0.49 1.33 0.64 0.58 0.07At2g21170 D7A07 0.97 0.31 0.81 0.07 1.95 0.41 0.98 0.13 1.07 0.44 1.26 0.31At4g18360 D7A08 1.09 0.30 1.00 0.05 1.79 0.34 0.96 0.42 0.77 0.32 1.04 0.09At1g06680 D7A09 1.35 0.37 1.19 0.12 1.43 0.19 1.00 0.36 1.50 0.65 0.78 0.1 At5g38420 D7A10 1.43 0.48 1.25 0.20 1.17 0.19 0.90 0.29 1.29 0.29 0.71 0.1 At1g67090 D7A11 0.98 0.03 0.87 0.18 1.35 0.20 1.08 0.36 1.25 0.46 0.9 0.14At5g03240 D7A12 1.46 0.18 1.30 0.13 1.45 0.37 1.73 0.65 1.41 0.24 0.92 0.2 At3g10230 D7B01 1.14 0.43 1.01 0.17 1.20 0.22 1.10 0.51 0.84 0.34 0.73 0.11At5g57030 D7B02 0.50 0.28 0.48 0.05 1.67 0.38 1.55 0.90 0.79 0.88 0.52 0.06At5g52570 D7B03 0.54 0.28 0.53 0.04 1.27 0.08 0.98 0.35 0.96 0.53 0.64 0.08At5g67030 D7B04 0.64 0.25 0.53 0.16 1.73 0.46 1.55 0.93 0.84 0.74 0.54 0.04At1g08550 D7B05 0.69 0.31 0.53 0.23 0.86 0.56 1.19 0.77 2.13 3.01 0.62 0.06At5g43860 D7B07 0.73 0.53 0.61 0.40 1.68 0.35 1.43 0.91 0.96 0.94 0.66 0.06At4g37000 D7B08 0.68 0.18 0.53 0.06 0.64 1.11 1.17 0.54 1.01 0.50 0.63 0.08At4g36220 D7B09 0.68 0.13 0.57 0.07 1.26 0.14 1.38 0.82 0.54 0.25 0.58 0.06At3g52430 D7B11 0.67 0.07 0.53 0.09 1.28 0.37 1.21 0.48 1.02 0.35 0.78 0.1 At5g15410 D7B12 0.41 0.11 0.34 0.10 2.95 2.20 2.78 1.14 0.82 0.71 0.68 0.14At4g36380 D7C01 2.12 0.16 1.81 0.04 1.36 0.09 1.05 0.31 1.35 0.24 1.05 0.06At4g09320 D7C02 2.47 0.38 2.04 0.04 1.37 0.22 1.33 0.15 1.14 0.45 0.83 0.09At1g75910 D7C03 2.89 1.07 2.51 0.66 1.27 0.18 1.51 0.43 1.44 0.39 1.6 0.1 At1g78820 D7C04 1.62 0.49 1.38 0.15 2.26 0.49 1.38 0.34 1.76 0.52 1.42 0.08At2g30870 D7C05 2.59 0.15 2.06 0.37 3.36 1.59 2.85 0.60 2.11 0.64 1.55 0.11At2g44500 D7C06 1.91 0.62 1.56 0.22 1.02 0.17 1.46 0.44 1.35 0.42 1.73 0.14At5g55190 D7C07 1.40 0.28 1.12 0.55 1.54 0.28 1.32 0.33 1.29 0.38 0.62 0.1 At3g47800 D7C08 1.15 0.01 0.97 0.15 4.09 1.55 5.35 1.56 1.69 1.21 14.8 3.46At3g56800 D7C09 3.70 1.41 3.19 1.68 1.76 0.20 1.26 0.52 2.05 0.53 0.86 0.1 At3g56940 D7C10 0.98 0.11 0.82 0.19 2.84 0.91 2.41 0.83 1.77 0.91 0.99 0.09At2g45960 D7C11 1.29 0.42 1.22 0.36 1.02 0.15 1.49 0.50 1.22 0.28 1.32 0.12At1g76100 D7C12 1.31 0.48 1.12 0.13 1.37 0.13 0.96 0.25 1.32 0.53 0.9 0.06At2g40000 D7D01 0.30 0.08 0.42 0.14 2.86 0.91 1.23 0.08 1.34 0.74 0.49 0.1 At1g65660 D7D02 0.72 0.11 0.60 0.05 1.39 0.10 1.14 0.30 1.46 0.34 1.01 0.09At3g44310 D7D03 0.95 0.15 0.83 0.03 1.57 0.21 1.27 0.46 2.44 2.36 1.42 0.12At2g41430 D7D04 5.73 4.74 5.04 4.53 7.48 2.51 1.41 0.45 5.79 5.82 1.39 0.08At3g47833 D7D05 2.75 0.73 2.77 0.47 1.38 0.09 1.30 0.57 1.51 0.13 1.35 0.09At1g27730 D7D06 1.31 0.78 1.09 0.67 2.57 0.98 1.64 0.54 2.50 1.28 1.3 0.09At2g19810 D7D07 2.21 0.04 1.87 0.20 1.42 0.24 1.16 0.19 1.50 0.23 1.22 0.08At4g30530 D7D08 3.05 1.91 2.50 1.76 6.36 3.85 2.26 0.49 3.92 3.27 1.19 0.09At5g01410 D7D09 1.00 0.14 0.85 0.00 1.63 0.33 1.62 0.66 1.34 0.33 1.12 0.1 At5g09650 D7D10 1.36 0.06 1.11 0.14 1.36 0.22 1.26 0.37 1.20 0.28 0.92 0.11At1g01620 D7D11 1.12 0.00 0.92 0.14 0.95 0.15 1.24 0.48 1.37 0.36 1.19 0.09
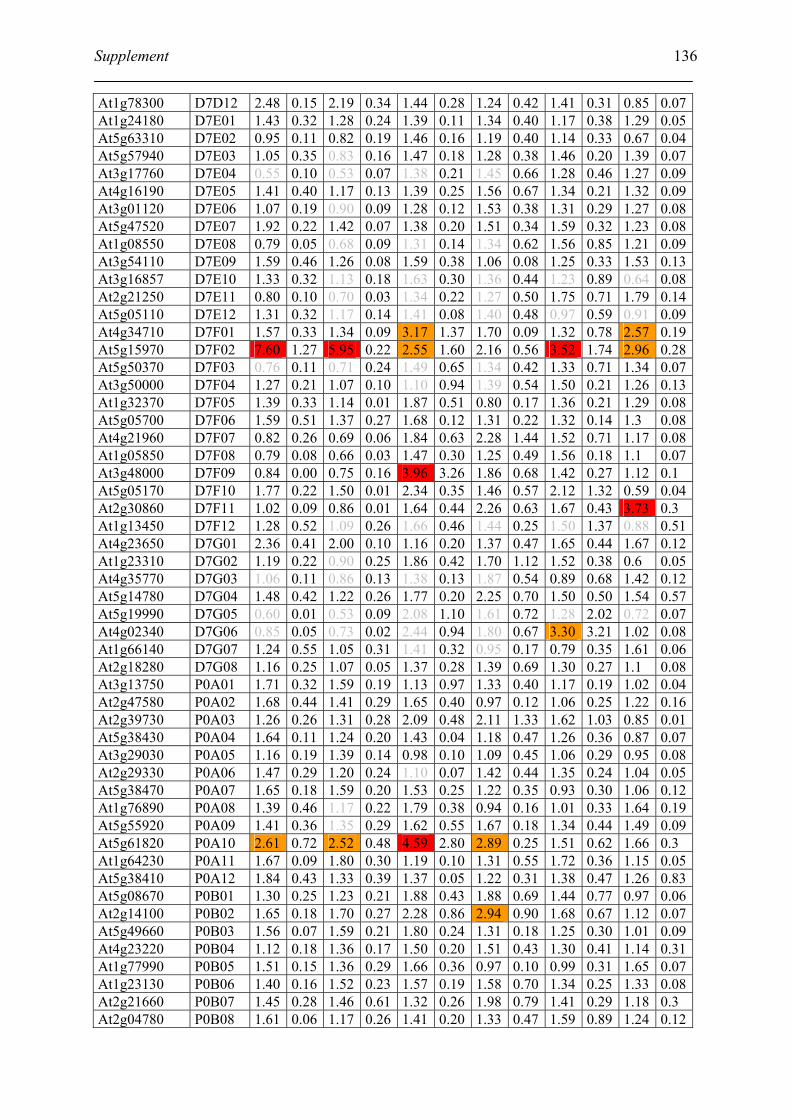
Supplement
136
At1g78300 D7D12 2.48 0.15 2.19 0.34 1.44 0.28 1.24 0.42 1.41 0.31 0.85 0.07At1g24180 D7E01 1.43 0.32 1.28 0.24 1.39 0.11 1.34 0.40 1.17 0.38 1.29 0.05At5g63310 D7E02 0.95 0.11 0.82 0.19 1.46 0.16 1.19 0.40 1.14 0.33 0.67 0.04At5g57940 D7E03 1.05 0.35 0.83 0.16 1.47 0.18 1.28 0.38 1.46 0.20 1.39 0.07At3g17760 D7E04 0.55 0.10 0.53 0.07 1.38 0.21 1.45 0.66 1.28 0.46 1.27 0.09At4g16190 D7E05 1.41 0.40 1.17 0.13 1.39 0.25 1.56 0.67 1.34 0.21 1.32 0.09At3g01120 D7E06 1.07 0.19 0.90 0.09 1.28 0.12 1.53 0.38 1.31 0.29 1.27 0.08At5g47520 D7E07 1.92 0.22 1.42 0.07 1.38 0.20 1.51 0.34 1.59 0.32 1.23 0.08At1g08550 D7E08 0.79 0.05 0.68 0.09 1.31 0.14 1.34 0.62 1.56 0.85 1.21 0.09At3g54110 D7E09 1.59 0.46 1.26 0.08 1.59 0.38 1.06 0.08 1.25 0.33 1.53 0.13At3g16857 D7E10 1.33 0.32 1.13 0.18 1.63 0.30 1.36 0.44 1.23 0.89 0.64 0.08At2g21250 D7E11 0.80 0.10 0.70 0.03 1.34 0.22 1.27 0.50 1.75 0.71 1.79 0.14At5g05110 D7E12 1.31 0.32 1.17 0.14 1.41 0.08 1.40 0.48 0.97 0.59 0.91 0.09At4g34710 D7F01 1.57 0.33 1.34 0.09 3.17 1.37 1.70 0.09 1.32 0.78 2.57 0.19At5g15970 D7F02 7.60 1.27 5.95 0.22 2.55 1.60 2.16 0.56 3.52 1.74 2.96 0.28At5g50370 D7F03 0.76 0.11 0.71 0.24 1.49 0.65 1.34 0.42 1.33 0.71 1.34 0.07At3g50000 D7F04 1.27 0.21 1.07 0.10 1.10 0.94 1.39 0.54 1.50 0.21 1.26 0.13At1g32370 D7F05 1.39 0.33 1.14 0.01 1.87 0.51 0.80 0.17 1.36 0.21 1.29 0.08At5g05700 D7F06 1.59 0.51 1.37 0.27 1.68 0.12 1.31 0.22 1.32 0.14 1.3 0.08At4g21960 D7F07 0.82 0.26 0.69 0.06 1.84 0.63 2.28 1.44 1.52 0.71 1.17 0.08At1g05850 D7F08 0.79 0.08 0.66 0.03 1.47 0.30 1.25 0.49 1.56 0.18 1.1 0.07At3g48000 D7F09 0.84 0.00 0.75 0.16 3.96 3.26 1.86 0.68 1.42 0.27 1.12 0.1 At5g05170 D7F10 1.77 0.22 1.50 0.01 2.34 0.35 1.46 0.57 2.12 1.32 0.59 0.04At2g30860 D7F11 1.02 0.09 0.86 0.01 1.64 0.44 2.26 0.63 1.67 0.43 3.73 0.3 At1g13450 D7F12 1.28 0.52 1.09 0.26 1.66 0.46 1.44 0.25 1.50 1.37 0.88 0.51At4g23650 D7G01 2.36 0.41 2.00 0.10 1.16 0.20 1.37 0.47 1.65 0.44 1.67 0.12At1g23310 D7G02 1.19 0.22 0.90 0.25 1.86 0.42 1.70 1.12 1.52 0.38 0.6 0.05At4g35770 D7G03 1.06 0.11 0.86 0.13 1.38 0.13 1.87 0.54 0.89 0.68 1.42 0.12At5g14780 D7G04 1.48 0.42 1.22 0.26 1.77 0.20 2.25 0.70 1.50 0.50 1.54 0.57At5g19990 D7G05 0.60 0.01 0.53 0.09 2.08 1.10 1.61 0.72 1.28 2.02 0.72 0.07At4g02340 D7G06 0.85 0.05 0.73 0.02 2.44 0.94 1.80 0.67 3.30 3.21 1.02 0.08At1g66140 D7G07 1.24 0.55 1.05 0.31 1.41 0.32 0.95 0.17 0.79 0.35 1.61 0.06At2g18280 D7G08 1.16 0.25 1.07 0.05 1.37 0.28 1.39 0.69 1.30 0.27 1.1 0.08At3g13750 P0A01 1.71 0.32 1.59 0.19 1.13 0.97 1.33 0.40 1.17 0.19 1.02 0.04At2g47580 P0A02 1.68 0.44 1.41 0.29 1.65 0.40 0.97 0.12 1.06 0.25 1.22 0.16At2g39730 P0A03 1.26 0.26 1.31 0.28 2.09 0.48 2.11 1.33 1.62 1.03 0.85 0.01At5g38430 P0A04 1.64 0.11 1.24 0.20 1.43 0.04 1.18 0.47 1.26 0.36 0.87 0.07At3g29030 P0A05 1.16 0.19 1.39 0.14 0.98 0.10 1.09 0.45 1.06 0.29 0.95 0.08At2g29330 P0A06 1.47 0.29 1.20 0.24 1.10 0.07 1.42 0.44 1.35 0.24 1.04 0.05At5g38470 P0A07 1.65 0.18 1.59 0.20 1.53 0.25 1.22 0.35 0.93 0.30 1.06 0.12At1g76890 P0A08 1.39 0.46 1.17 0.22 1.79 0.38 0.94 0.16 1.01 0.33 1.64 0.19At5g55920 P0A09 1.41 0.36 1.35 0.29 1.62 0.55 1.67 0.18 1.34 0.44 1.49 0.09At5g61820 P0A10 2.61 0.72 2.52 0.48 4.59 2.80 2.89 0.25 1.51 0.62 1.66 0.3 At1g64230 P0A11 1.67 0.09 1.80 0.30 1.19 0.10 1.31 0.55 1.72 0.36 1.15 0.05At5g38410 P0A12 1.84 0.43 1.33 0.39 1.37 0.05 1.22 0.31 1.38 0.47 1.26 0.83At5g08670 P0B01 1.30 0.25 1.23 0.21 1.88 0.43 1.88 0.69 1.44 0.77 0.97 0.06At2g14100 P0B02 1.65 0.18 1.70 0.27 2.28 0.86 2.94 0.90 1.68 0.67 1.12 0.07At5g49660 P0B03 1.56 0.07 1.59 0.21 1.80 0.24 1.31 0.18 1.25 0.30 1.01 0.09At4g23220 P0B04 1.12 0.18 1.36 0.17 1.50 0.20 1.51 0.43 1.30 0.41 1.14 0.31At1g77990 P0B05 1.51 0.15 1.36 0.29 1.66 0.36 0.97 0.10 0.99 0.31 1.65 0.07At1g23130 P0B06 1.40 0.16 1.52 0.23 1.57 0.19 1.58 0.70 1.34 0.25 1.33 0.08At2g21660 P0B07 1.45 0.28 1.46 0.61 1.32 0.26 1.98 0.79 1.41 0.29 1.18 0.3 At2g04780 P0B08 1.61 0.06 1.17 0.26 1.41 0.20 1.33 0.47 1.59 0.89 1.24 0.12
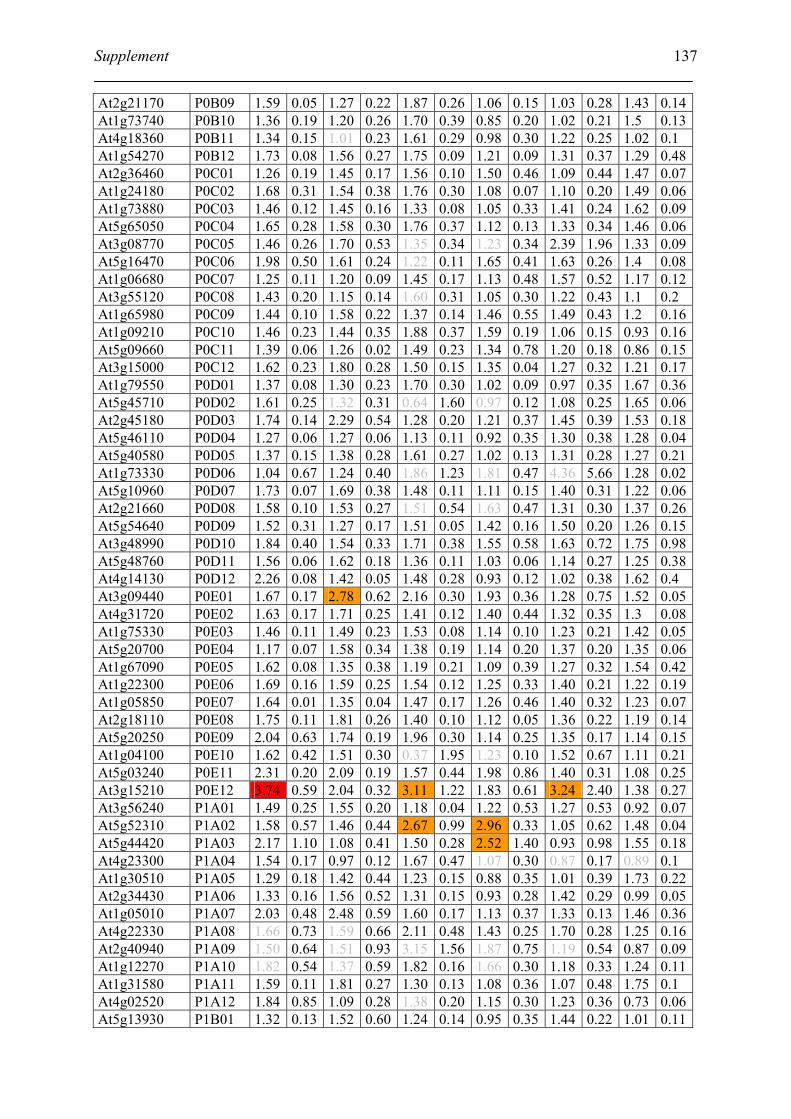
Supplement
137
At2g21170 P0B09 1.59 0.05 1.27 0.22 1.87 0.26 1.06 0.15 1.03 0.28 1.43 0.14At1g73740 P0B10 1.36 0.19 1.20 0.26 1.70 0.39 0.85 0.20 1.02 0.21 1.5 0.13At4g18360 P0B11 1.34 0.15 1.01 0.23 1.61 0.29 0.98 0.30 1.22 0.25 1.02 0.1 At1g54270 P0B12 1.73 0.08 1.56 0.27 1.75 0.09 1.21 0.09 1.31 0.37 1.29 0.48At2g36460 P0C01 1.26 0.19 1.45 0.17 1.56 0.10 1.50 0.46 1.09 0.44 1.47 0.07At1g24180 P0C02 1.68 0.31 1.54 0.38 1.76 0.30 1.08 0.07 1.10 0.20 1.49 0.06At1g73880 P0C03 1.46 0.12 1.45 0.16 1.33 0.08 1.05 0.33 1.41 0.24 1.62 0.09At5g65050 P0C04 1.65 0.28 1.58 0.30 1.76 0.37 1.12 0.13 1.33 0.34 1.46 0.06At3g08770 P0C05 1.46 0.26 1.70 0.53 1.35 0.34 1.23 0.34 2.39 1.96 1.33 0.09At5g16470 P0C06 1.98 0.50 1.61 0.24 1.22 0.11 1.65 0.41 1.63 0.26 1.4 0.08At1g06680 P0C07 1.25 0.11 1.20 0.09 1.45 0.17 1.13 0.48 1.57 0.52 1.17 0.12At3g55120 P0C08 1.43 0.20 1.15 0.14 1.60 0.31 1.05 0.30 1.22 0.43 1.1 0.2 At1g65980 P0C09 1.44 0.10 1.58 0.22 1.37 0.14 1.46 0.55 1.49 0.43 1.2 0.16At1g09210 P0C10 1.46 0.23 1.44 0.35 1.88 0.37 1.59 0.19 1.06 0.15 0.93 0.16At5g09660 P0C11 1.39 0.06 1.26 0.02 1.49 0.23 1.34 0.78 1.20 0.18 0.86 0.15At3g15000 P0C12 1.62 0.23 1.80 0.28 1.50 0.15 1.35 0.04 1.27 0.32 1.21 0.17At1g79550 P0D01 1.37 0.08 1.30 0.23 1.70 0.30 1.02 0.09 0.97 0.35 1.67 0.36At5g45710 P0D02 1.61 0.25 1.32 0.31 0.64 1.60 0.97 0.12 1.08 0.25 1.65 0.06At2g45180 P0D03 1.74 0.14 2.29 0.54 1.28 0.20 1.21 0.37 1.45 0.39 1.53 0.18At5g46110 P0D04 1.27 0.06 1.27 0.06 1.13 0.11 0.92 0.35 1.30 0.38 1.28 0.04At5g40580 P0D05 1.37 0.15 1.38 0.28 1.61 0.27 1.02 0.13 1.31 0.28 1.27 0.21At1g73330 P0D06 1.04 0.67 1.24 0.40 1.86 1.23 1.81 0.47 4.36 5.66 1.28 0.02At5g10960 P0D07 1.73 0.07 1.69 0.38 1.48 0.11 1.11 0.15 1.40 0.31 1.22 0.06At2g21660 P0D08 1.58 0.10 1.53 0.27 1.51 0.54 1.63 0.47 1.31 0.30 1.37 0.26At5g54640 P0D09 1.52 0.31 1.27 0.17 1.51 0.05 1.42 0.16 1.50 0.20 1.26 0.15At3g48990 P0D10 1.84 0.40 1.54 0.33 1.71 0.38 1.55 0.58 1.63 0.72 1.75 0.98At5g48760 P0D11 1.56 0.06 1.62 0.18 1.36 0.11 1.03 0.06 1.14 0.27 1.25 0.38At4g14130 P0D12 2.26 0.08 1.42 0.05 1.48 0.28 0.93 0.12 1.02 0.38 1.62 0.4 At3g09440 P0E01 1.67 0.17 2.78 0.62 2.16 0.30 1.93 0.36 1.28 0.75 1.52 0.05At4g31720 P0E02 1.63 0.17 1.71 0.25 1.41 0.12 1.40 0.44 1.32 0.35 1.3 0.08At1g75330 P0E03 1.46 0.11 1.49 0.23 1.53 0.08 1.14 0.10 1.23 0.21 1.42 0.05At5g20700 P0E04 1.17 0.07 1.58 0.34 1.38 0.19 1.14 0.20 1.37 0.20 1.35 0.06At1g67090 P0E05 1.62 0.08 1.35 0.38 1.19 0.21 1.09 0.39 1.27 0.32 1.54 0.42At1g22300 P0E06 1.69 0.16 1.59 0.25 1.54 0.12 1.25 0.33 1.40 0.21 1.22 0.19At1g05850 P0E07 1.64 0.01 1.35 0.04 1.47 0.17 1.26 0.46 1.40 0.32 1.23 0.07At2g18110 P0E08 1.75 0.11 1.81 0.26 1.40 0.10 1.12 0.05 1.36 0.22 1.19 0.14At5g20250 P0E09 2.04 0.63 1.74 0.19 1.96 0.30 1.14 0.25 1.35 0.17 1.14 0.15At1g04100 P0E10 1.62 0.42 1.51 0.30 0.37 1.95 1.23 0.10 1.52 0.67 1.11 0.21At5g03240 P0E11 2.31 0.20 2.09 0.19 1.57 0.44 1.98 0.86 1.40 0.31 1.08 0.25At3g15210 P0E12 3.74 0.59 2.04 0.32 3.11 1.22 1.83 0.61 3.24 2.40 1.38 0.27At3g56240 P1A01 1.49 0.25 1.55 0.20 1.18 0.04 1.22 0.53 1.27 0.53 0.92 0.07At5g52310 P1A02 1.58 0.57 1.46 0.44 2.67 0.99 2.96 0.33 1.05 0.62 1.48 0.04At5g44420 P1A03 2.17 1.10 1.08 0.41 1.50 0.28 2.52 1.40 0.93 0.98 1.55 0.18At4g23300 P1A04 1.54 0.17 0.97 0.12 1.67 0.47 1.07 0.30 0.87 0.17 0.89 0.1 At1g30510 P1A05 1.29 0.18 1.42 0.44 1.23 0.15 0.88 0.35 1.01 0.39 1.73 0.22At2g34430 P1A06 1.33 0.16 1.56 0.52 1.31 0.15 0.93 0.28 1.42 0.29 0.99 0.05At1g05010 P1A07 2.03 0.48 2.48 0.59 1.60 0.17 1.13 0.37 1.33 0.13 1.46 0.36At4g22330 P1A08 1.66 0.73 1.59 0.66 2.11 0.48 1.43 0.25 1.70 0.28 1.25 0.16At2g40940 P1A09 1.50 0.64 1.51 0.93 3.15 1.56 1.87 0.75 1.19 0.54 0.87 0.09At1g12270 P1A10 1.82 0.54 1.37 0.59 1.82 0.16 1.66 0.30 1.18 0.33 1.24 0.11At1g31580 P1A11 1.59 0.11 1.81 0.27 1.30 0.13 1.08 0.36 1.07 0.48 1.75 0.1 At4g02520 P1A12 1.84 0.85 1.09 0.28 1.38 0.20 1.15 0.30 1.23 0.36 0.73 0.06At5g13930 P1B01 1.32 0.13 1.52 0.60 1.24 0.14 0.95 0.35 1.44 0.22 1.01 0.11
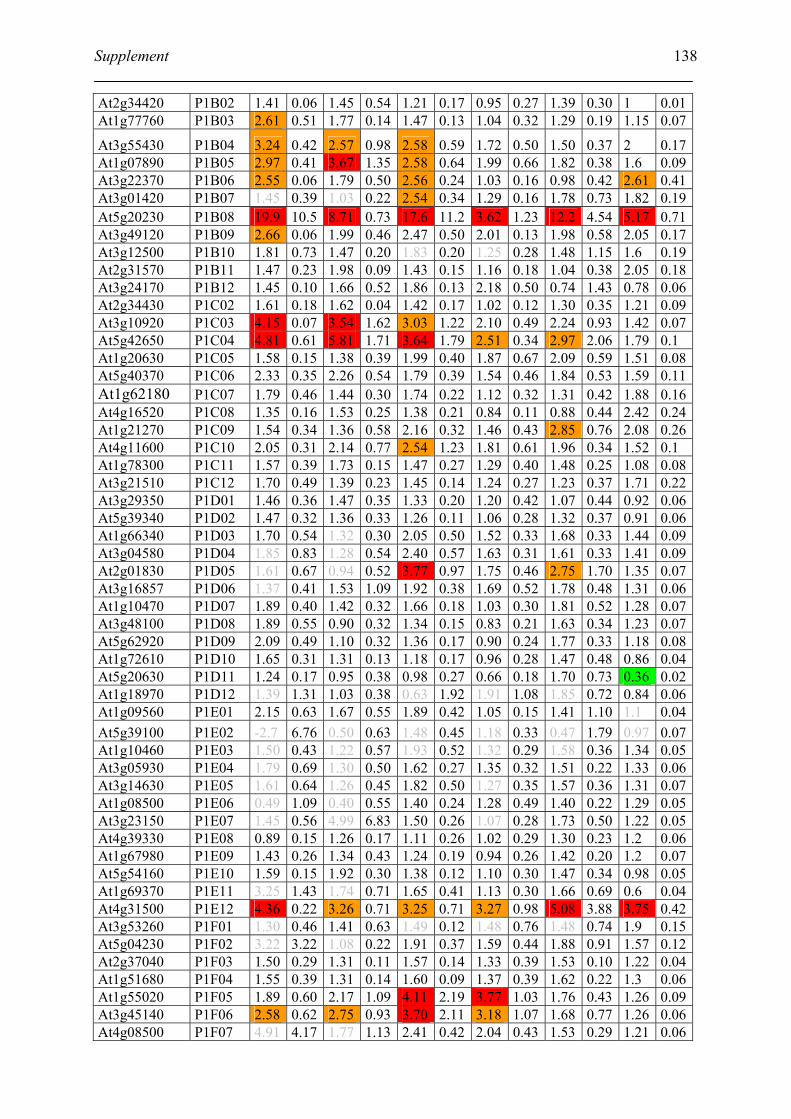
Supplement
138
At2g34420 P1B02 1.41 0.06 1.45 0.54 1.21 0.17 0.95 0.27 1.39 0.30 1 0.01At1g77760 P1B03 2.61 0.51 1.77 0.14 1.47 0.13 1.04 0.32 1.29 0.19 1.15 0.07
At3g55430 P1B04 3.24 0.42 2.57 0.98 2.58 0.59 1.72 0.50 1.50 0.37 2 0.17At1g07890 P1B05 2.97 0.41 3.67 1.35 2.58 0.64 1.99 0.66 1.82 0.38 1.6 0.09At3g22370 P1B06 2.55 0.06 1.79 0.50 2.56 0.24 1.03 0.16 0.98 0.42 2.61 0.41At3g01420 P1B07 1.45 0.39 1.03 0.22 2.54 0.34 1.29 0.16 1.78 0.73 1.82 0.19At5g20230 P1B08 19.9 10.5 8.71 0.73 17.6 11.2 3.62 1.23 12.2 4.54 5.17 0.71At3g49120 P1B09 2.66 0.06 1.99 0.46 2.47 0.50 2.01 0.13 1.98 0.58 2.05 0.17At3g12500 P1B10 1.81 0.73 1.47 0.20 1.83 0.20 1.25 0.28 1.48 1.15 1.6 0.19At2g31570 P1B11 1.47 0.23 1.98 0.09 1.43 0.15 1.16 0.18 1.04 0.38 2.05 0.18At3g24170 P1B12 1.45 0.10 1.66 0.52 1.86 0.13 2.18 0.50 0.74 1.43 0.78 0.06At2g34430 P1C02 1.61 0.18 1.62 0.04 1.42 0.17 1.02 0.12 1.30 0.35 1.21 0.09At3g10920 P1C03 4.15 0.07 3.54 1.62 3.03 1.22 2.10 0.49 2.24 0.93 1.42 0.07At5g42650 P1C04 4.81 0.61 5.81 1.71 3.64 1.79 2.51 0.34 2.97 2.06 1.79 0.1 At1g20630 P1C05 1.58 0.15 1.38 0.39 1.99 0.40 1.87 0.67 2.09 0.59 1.51 0.08At5g40370 P1C06 2.33 0.35 2.26 0.54 1.79 0.39 1.54 0.46 1.84 0.53 1.59 0.11At1g62180 P1C07 1.79 0.46 1.44 0.30 1.74 0.22 1.12 0.32 1.31 0.42 1.88 0.16At4g16520 P1C08 1.35 0.16 1.53 0.25 1.38 0.21 0.84 0.11 0.88 0.44 2.42 0.24At1g21270 P1C09 1.54 0.34 1.36 0.58 2.16 0.32 1.46 0.43 2.85 0.76 2.08 0.26At4g11600 P1C10 2.05 0.31 2.14 0.77 2.54 1.23 1.81 0.61 1.96 0.34 1.52 0.1 At1g78300 P1C11 1.57 0.39 1.73 0.15 1.47 0.27 1.29 0.40 1.48 0.25 1.08 0.08At3g21510 P1C12 1.70 0.49 1.39 0.23 1.45 0.14 1.24 0.27 1.23 0.37 1.71 0.22At3g29350 P1D01 1.46 0.36 1.47 0.35 1.33 0.20 1.20 0.42 1.07 0.44 0.92 0.06At5g39340 P1D02 1.47 0.32 1.36 0.33 1.26 0.11 1.06 0.28 1.32 0.37 0.91 0.06At1g66340 P1D03 1.70 0.54 1.32 0.30 2.05 0.50 1.52 0.33 1.68 0.33 1.44 0.09At3g04580 P1D04 1.85 0.83 1.28 0.54 2.40 0.57 1.63 0.31 1.61 0.33 1.41 0.09At2g01830 P1D05 1.61 0.67 0.94 0.52 3.77 0.97 1.75 0.46 2.75 1.70 1.35 0.07At3g16857 P1D06 1.37 0.41 1.53 1.09 1.92 0.38 1.69 0.52 1.78 0.48 1.31 0.06At1g10470 P1D07 1.89 0.40 1.42 0.32 1.66 0.18 1.03 0.30 1.81 0.52 1.28 0.07At3g48100 P1D08 1.89 0.55 0.90 0.32 1.34 0.15 0.83 0.21 1.63 0.34 1.23 0.07At5g62920 P1D09 2.09 0.49 1.10 0.32 1.36 0.17 0.90 0.24 1.77 0.33 1.18 0.08At1g72610 P1D10 1.65 0.31 1.31 0.13 1.18 0.17 0.96 0.28 1.47 0.48 0.86 0.04At5g20630 P1D11 1.24 0.17 0.95 0.38 0.98 0.27 0.66 0.18 1.70 0.73 0.36 0.02At1g18970 P1D12 1.39 1.31 1.03 0.38 0.63 1.92 1.91 1.08 1.85 0.72 0.84 0.06At1g09560 P1E01 2.15 0.63 1.67 0.55 1.89 0.42 1.05 0.15 1.41 1.10 1.1 0.04At5g39100 P1E02 -2.7 6.76 0.50 0.63 1.48 0.45 1.18 0.33 0.47 1.79 0.97 0.07At1g10460 P1E03 1.50 0.43 1.22 0.57 1.93 0.52 1.32 0.29 1.58 0.36 1.34 0.05At3g05930 P1E04 1.79 0.69 1.30 0.50 1.62 0.27 1.35 0.32 1.51 0.22 1.33 0.06At3g14630 P1E05 1.61 0.64 1.26 0.45 1.82 0.50 1.27 0.35 1.57 0.36 1.31 0.07At1g08500 P1E06 0.49 1.09 0.40 0.55 1.40 0.24 1.28 0.49 1.40 0.22 1.29 0.05At3g23150 P1E07 1.45 0.56 4.99 6.83 1.50 0.26 1.07 0.28 1.73 0.50 1.22 0.05At4g39330 P1E08 0.89 0.15 1.26 0.17 1.11 0.26 1.02 0.29 1.30 0.23 1.2 0.06At1g67980 P1E09 1.43 0.26 1.34 0.43 1.24 0.19 0.94 0.26 1.42 0.20 1.2 0.07At5g54160 P1E10 1.59 0.15 1.92 0.30 1.38 0.12 1.10 0.30 1.47 0.34 0.98 0.05At1g69370 P1E11 3.25 1.43 1.74 0.71 1.65 0.41 1.13 0.30 1.66 0.69 0.6 0.04At4g31500 P1E12 4.36 0.22 3.26 0.71 3.25 0.71 3.27 0.98 5.08 3.88 3.75 0.42At3g53260 P1F01 1.30 0.46 1.41 0.63 1.49 0.12 1.48 0.76 1.48 0.74 1.9 0.15At5g04230 P1F02 3.22 3.22 1.08 0.22 1.91 0.37 1.59 0.44 1.88 0.91 1.57 0.12At2g37040 P1F03 1.50 0.29 1.31 0.11 1.57 0.14 1.33 0.39 1.53 0.10 1.22 0.04At1g51680 P1F04 1.55 0.39 1.31 0.14 1.60 0.09 1.37 0.39 1.62 0.22 1.3 0.06At1g55020 P1F05 1.89 0.60 2.17 1.09 4.11 2.19 3.77 1.03 1.76 0.43 1.26 0.09At3g45140 P1F06 2.58 0.62 2.75 0.93 3.70 2.11 3.18 1.07 1.68 0.77 1.26 0.06At4g08500 P1F07 4.91 4.17 1.77 1.13 2.41 0.42 2.04 0.43 1.53 0.29 1.21 0.06
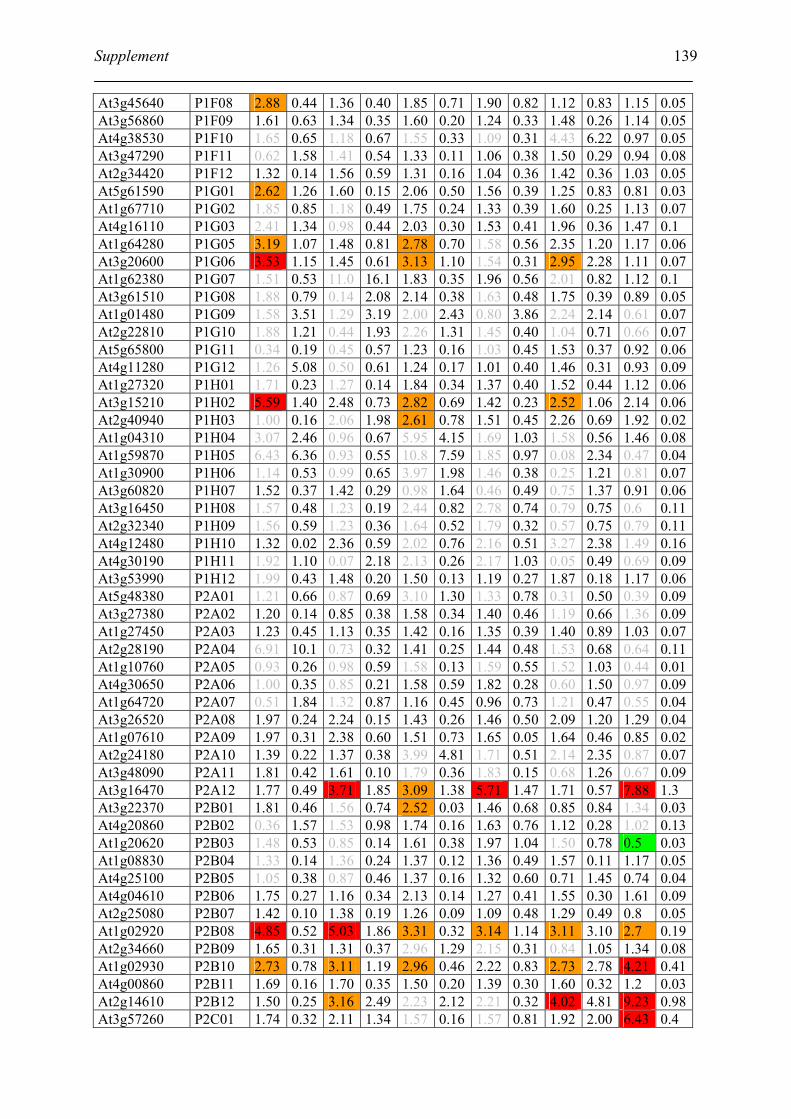
Supplement
139
At3g45640 P1F08 2.88 0.44 1.36 0.40 1.85 0.71 1.90 0.82 1.12 0.83 1.15 0.05At3g56860 P1F09 1.61 0.63 1.34 0.35 1.60 0.20 1.24 0.33 1.48 0.26 1.14 0.05At4g38530 P1F10 1.65 0.65 1.18 0.67 1.55 0.33 1.09 0.31 4.43 6.22 0.97 0.05At3g47290 P1F11 0.62 1.58 1.41 0.54 1.33 0.11 1.06 0.38 1.50 0.29 0.94 0.08At2g34420 P1F12 1.32 0.14 1.56 0.59 1.31 0.16 1.04 0.36 1.42 0.36 1.03 0.05At5g61590 P1G01 2.62 1.26 1.60 0.15 2.06 0.50 1.56 0.39 1.25 0.83 0.81 0.03At1g67710 P1G02 1.85 0.85 1.18 0.49 1.75 0.24 1.33 0.39 1.60 0.25 1.13 0.07At4g16110 P1G03 2.41 1.34 0.98 0.44 2.03 0.30 1.53 0.41 1.96 0.36 1.47 0.1 At1g64280 P1G05 3.19 1.07 1.48 0.81 2.78 0.70 1.58 0.56 2.35 1.20 1.17 0.06At3g20600 P1G06 3.53 1.15 1.45 0.61 3.13 1.10 1.54 0.31 2.95 2.28 1.11 0.07At1g62380 P1G07 1.51 0.53 11.0 16.1 1.83 0.35 1.96 0.56 2.01 0.82 1.12 0.1 At3g61510 P1G08 1.88 0.79 0.14 2.08 2.14 0.38 1.63 0.48 1.75 0.39 0.89 0.05At1g01480 P1G09 1.58 3.51 1.29 3.19 2.00 2.43 0.80 3.86 2.24 2.14 0.61 0.07At2g22810 P1G10 1.88 1.21 0.44 1.93 2.26 1.31 1.45 0.40 1.04 0.71 0.66 0.07At5g65800 P1G11 0.34 0.19 0.45 0.57 1.23 0.16 1.03 0.45 1.53 0.37 0.92 0.06At4g11280 P1G12 1.26 5.08 0.50 0.61 1.24 0.17 1.01 0.40 1.46 0.31 0.93 0.09At1g27320 P1H01 1.71 0.23 1.27 0.14 1.84 0.34 1.37 0.40 1.52 0.44 1.12 0.06At3g15210 P1H02 5.59 1.40 2.48 0.73 2.82 0.69 1.42 0.23 2.52 1.06 2.14 0.06At2g40940 P1H03 1.00 0.16 2.06 1.98 2.61 0.78 1.51 0.45 2.26 0.69 1.92 0.02At1g04310 P1H04 3.07 2.46 0.96 0.67 5.95 4.15 1.69 1.03 1.58 0.56 1.46 0.08At1g59870 P1H05 6.43 6.36 0.93 0.55 10.8 7.59 1.85 0.97 0.08 2.34 0.47 0.04At1g30900 P1H06 1.14 0.53 0.99 0.65 3.97 1.98 1.46 0.38 0.25 1.21 0.81 0.07At3g60820 P1H07 1.52 0.37 1.42 0.29 0.98 1.64 0.46 0.49 0.75 1.37 0.91 0.06At3g16450 P1H08 1.57 0.48 1.23 0.19 2.44 0.82 2.78 0.74 0.79 0.75 0.6 0.11At2g32340 P1H09 1.56 0.59 1.23 0.36 1.64 0.52 1.79 0.32 0.57 0.75 0.79 0.11At4g12480 P1H10 1.32 0.02 2.36 0.59 2.02 0.76 2.16 0.51 3.27 2.38 1.49 0.16At4g30190 P1H11 1.92 1.10 0.07 2.18 2.13 0.26 2.17 1.03 0.05 0.49 0.69 0.09At3g53990 P1H12 1.99 0.43 1.48 0.20 1.50 0.13 1.19 0.27 1.87 0.18 1.17 0.06At5g48380 P2A01 1.21 0.66 0.87 0.69 3.10 1.30 1.33 0.78 0.31 0.50 0.39 0.09At3g27380 P2A02 1.20 0.14 0.85 0.38 1.58 0.34 1.40 0.46 1.19 0.66 1.36 0.09At1g27450 P2A03 1.23 0.45 1.13 0.35 1.42 0.16 1.35 0.39 1.40 0.89 1.03 0.07At2g28190 P2A04 6.91 10.1 0.73 0.32 1.41 0.25 1.44 0.48 1.53 0.68 0.64 0.11At1g10760 P2A05 0.93 0.26 0.98 0.59 1.58 0.13 1.59 0.55 1.52 1.03 0.44 0.01At4g30650 P2A06 1.00 0.35 0.85 0.21 1.58 0.59 1.82 0.28 0.60 1.50 0.97 0.09At1g64720 P2A07 0.51 1.84 1.32 0.87 1.16 0.45 0.96 0.73 1.21 0.47 0.55 0.04At3g26520 P2A08 1.97 0.24 2.24 0.15 1.43 0.26 1.46 0.50 2.09 1.20 1.29 0.04At1g07610 P2A09 1.97 0.31 2.38 0.60 1.51 0.73 1.65 0.05 1.64 0.46 0.85 0.02At2g24180 P2A10 1.39 0.22 1.37 0.38 3.99 4.81 1.71 0.51 2.14 2.35 0.87 0.07At3g48090 P2A11 1.81 0.42 1.61 0.10 1.79 0.36 1.83 0.15 0.68 1.26 0.67 0.09At3g16470 P2A12 1.77 0.49 3.71 1.85 3.09 1.38 5.71 1.47 1.71 0.57 7.88 1.3 At3g22370 P2B01 1.81 0.46 1.56 0.74 2.52 0.03 1.46 0.68 0.85 0.84 1.34 0.03At4g20860 P2B02 0.36 1.57 1.53 0.98 1.74 0.16 1.63 0.76 1.12 0.28 1.02 0.13At1g20620 P2B03 1.48 0.53 0.85 0.14 1.61 0.38 1.97 1.04 1.50 0.78 0.5 0.03At1g08830 P2B04 1.33 0.14 1.36 0.24 1.37 0.12 1.36 0.49 1.57 0.11 1.17 0.05At4g25100 P2B05 1.05 0.38 0.87 0.46 1.37 0.16 1.32 0.60 0.71 1.45 0.74 0.04At4g04610 P2B06 1.75 0.27 1.16 0.34 2.13 0.14 1.27 0.41 1.55 0.30 1.61 0.09At2g25080 P2B07 1.42 0.10 1.38 0.19 1.26 0.09 1.09 0.48 1.29 0.49 0.8 0.05At1g02920 P2B08 4.85 0.52 5.03 1.86 3.31 0.32 3.14 1.14 3.11 3.10 2.7 0.19At2g34660 P2B09 1.65 0.31 1.31 0.37 2.96 1.29 2.15 0.31 0.84 1.05 1.34 0.08At1g02930 P2B10 2.73 0.78 3.11 1.19 2.96 0.46 2.22 0.83 2.73 2.78 4.21 0.41At4g00860 P2B11 1.69 0.16 1.70 0.35 1.50 0.20 1.39 0.30 1.60 0.32 1.2 0.03At2g14610 P2B12 1.50 0.25 3.16 2.49 2.23 2.12 2.21 0.32 4.02 4.81 9.23 0.98At3g57260 P2C01 1.74 0.32 2.11 1.34 1.57 0.16 1.57 0.81 1.92 2.00 6.43 0.4
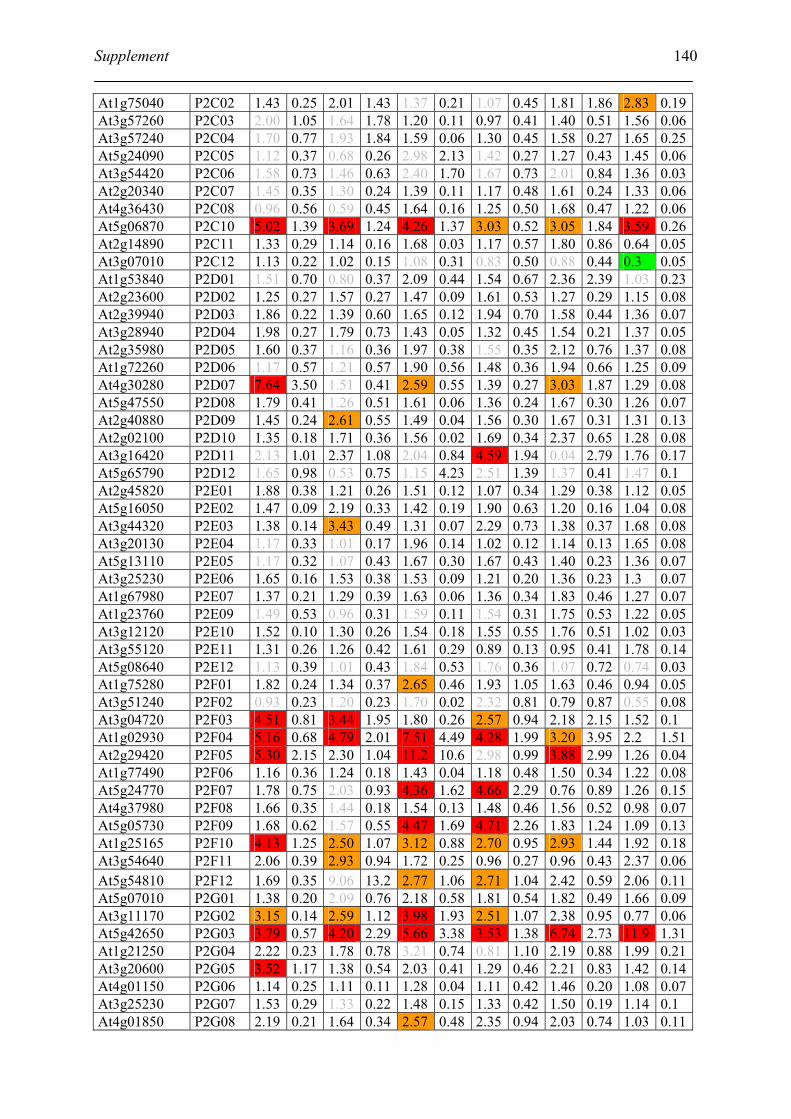
Supplement
140
At1g75040 P2C02 1.43 0.25 2.01 1.43 1.37 0.21 1.07 0.45 1.81 1.86 2.83 0.19At3g57260 P2C03 2.00 1.05 1.64 1.78 1.20 0.11 0.97 0.41 1.40 0.51 1.56 0.06At3g57240 P2C04 1.70 0.77 1.93 1.84 1.59 0.06 1.30 0.45 1.58 0.27 1.65 0.25At5g24090 P2C05 1.12 0.37 0.68 0.26 2.98 2.13 1.42 0.27 1.27 0.43 1.45 0.06At3g54420 P2C06 1.58 0.73 1.46 0.63 2.40 1.70 1.67 0.73 2.01 0.84 1.36 0.03At2g20340 P2C07 1.45 0.35 1.30 0.24 1.39 0.11 1.17 0.48 1.61 0.24 1.33 0.06At4g36430 P2C08 0.96 0.56 0.59 0.45 1.64 0.16 1.25 0.50 1.68 0.47 1.22 0.06At5g06870 P2C10 5.02 1.39 3.69 1.24 4.26 1.37 3.03 0.52 3.05 1.84 3.59 0.26At2g14890 P2C11 1.33 0.29 1.14 0.16 1.68 0.03 1.17 0.57 1.80 0.86 0.64 0.05At3g07010 P2C12 1.13 0.22 1.02 0.15 1.08 0.31 0.83 0.50 0.88 0.44 0.3 0.05At1g53840 P2D01 1.51 0.70 0.80 0.37 2.09 0.44 1.54 0.67 2.36 2.39 1.03 0.23At2g23600 P2D02 1.25 0.27 1.57 0.27 1.47 0.09 1.61 0.53 1.27 0.29 1.15 0.08At2g39940 P2D03 1.86 0.22 1.39 0.60 1.65 0.12 1.94 0.70 1.58 0.44 1.36 0.07At3g28940 P2D04 1.98 0.27 1.79 0.73 1.43 0.05 1.32 0.45 1.54 0.21 1.37 0.05At2g35980 P2D05 1.60 0.37 1.16 0.36 1.97 0.38 1.55 0.35 2.12 0.76 1.37 0.08At1g72260 P2D06 1.17 0.57 1.21 0.57 1.90 0.56 1.48 0.36 1.94 0.66 1.25 0.09At4g30280 P2D07 7.64 3.50 1.51 0.41 2.59 0.55 1.39 0.27 3.03 1.87 1.29 0.08At5g47550 P2D08 1.79 0.41 1.26 0.51 1.61 0.06 1.36 0.24 1.67 0.30 1.26 0.07At2g40880 P2D09 1.45 0.24 2.61 0.55 1.49 0.04 1.56 0.30 1.67 0.31 1.31 0.13At2g02100 P2D10 1.35 0.18 1.71 0.36 1.56 0.02 1.69 0.34 2.37 0.65 1.28 0.08At3g16420 P2D11 2.13 1.01 2.37 1.08 2.04 0.84 4.59 1.94 0.04 2.79 1.76 0.17At5g65790 P2D12 1.65 0.98 0.53 0.75 1.15 4.23 2.51 1.39 1.37 0.41 1.47 0.1 At2g45820 P2E01 1.88 0.38 1.21 0.26 1.51 0.12 1.07 0.34 1.29 0.38 1.12 0.05At5g16050 P2E02 1.47 0.09 2.19 0.33 1.42 0.19 1.90 0.63 1.20 0.16 1.04 0.08At3g44320 P2E03 1.38 0.14 3.43 0.49 1.31 0.07 2.29 0.73 1.38 0.37 1.68 0.08At3g20130 P2E04 1.17 0.33 1.01 0.17 1.96 0.14 1.02 0.12 1.14 0.13 1.65 0.08At5g13110 P2E05 1.17 0.32 1.07 0.43 1.67 0.30 1.67 0.43 1.40 0.23 1.36 0.07At3g25230 P2E06 1.65 0.16 1.53 0.38 1.53 0.09 1.21 0.20 1.36 0.23 1.3 0.07At1g67980 P2E07 1.37 0.21 1.29 0.39 1.63 0.06 1.36 0.34 1.83 0.46 1.27 0.07At1g23760 P2E09 1.49 0.53 0.96 0.31 1.59 0.11 1.54 0.31 1.75 0.53 1.22 0.05At3g12120 P2E10 1.52 0.10 1.30 0.26 1.54 0.18 1.55 0.55 1.76 0.51 1.02 0.03At3g55120 P2E11 1.31 0.26 1.26 0.42 1.61 0.29 0.89 0.13 0.95 0.41 1.78 0.14At5g08640 P2E12 1.13 0.39 1.01 0.43 1.84 0.53 1.76 0.36 1.07 0.72 0.74 0.03At1g75280 P2F01 1.82 0.24 1.34 0.37 2.65 0.46 1.93 1.05 1.63 0.46 0.94 0.05At3g51240 P2F02 0.93 0.23 1.20 0.23 1.70 0.02 2.32 0.81 0.79 0.87 0.55 0.08At3g04720 P2F03 4.51 0.81 3.44 1.95 1.80 0.26 2.57 0.94 2.18 2.15 1.52 0.1 At1g02930 P2F04 5.16 0.68 4.79 2.01 7.51 4.49 4.28 1.99 3.20 3.95 2.2 1.51At2g29420 P2F05 5.30 2.15 2.30 1.04 11.2 10.6 2.98 0.99 3.88 2.99 1.26 0.04At1g77490 P2F06 1.16 0.36 1.24 0.18 1.43 0.04 1.18 0.48 1.50 0.34 1.22 0.08At5g24770 P2F07 1.78 0.75 2.03 0.93 4.36 1.62 4.66 2.29 0.76 0.89 1.26 0.15At4g37980 P2F08 1.66 0.35 1.44 0.18 1.54 0.13 1.48 0.46 1.56 0.52 0.98 0.07At5g05730 P2F09 1.68 0.62 1.57 0.55 4.47 1.69 4.71 2.26 1.83 1.24 1.09 0.13At1g25165 P2F10 4.13 1.25 2.50 1.07 3.12 0.88 2.70 0.95 2.93 1.44 1.92 0.18At3g54640 P2F11 2.06 0.39 2.93 0.94 1.72 0.25 0.96 0.27 0.96 0.43 2.37 0.06At5g54810 P2F12 1.69 0.35 9.06 13.2 2.77 1.06 2.71 1.04 2.42 0.59 2.06 0.11At5g07010 P2G01 1.38 0.20 2.09 0.76 2.18 0.58 1.81 0.54 1.82 0.49 1.66 0.09At3g11170 P2G02 3.15 0.14 2.59 1.12 3.98 1.93 2.51 1.07 2.38 0.95 0.77 0.06At5g42650 P2G03 3.79 0.57 4.20 2.29 5.66 3.38 3.53 1.38 6.74 2.73 11.9 1.31At1g21250 P2G04 2.22 0.23 1.78 0.78 3.21 0.74 0.81 1.10 2.19 0.88 1.99 0.21At3g20600 P2G05 3.52 1.17 1.38 0.54 2.03 0.41 1.29 0.46 2.21 0.83 1.42 0.14At4g01150 P2G06 1.14 0.25 1.11 0.11 1.28 0.04 1.11 0.42 1.46 0.20 1.08 0.07At3g25230 P2G07 1.53 0.29 1.33 0.22 1.48 0.15 1.33 0.42 1.50 0.19 1.14 0.1 At4g01850 P2G08 2.19 0.21 1.64 0.34 2.57 0.48 2.35 0.94 2.03 0.74 1.03 0.11
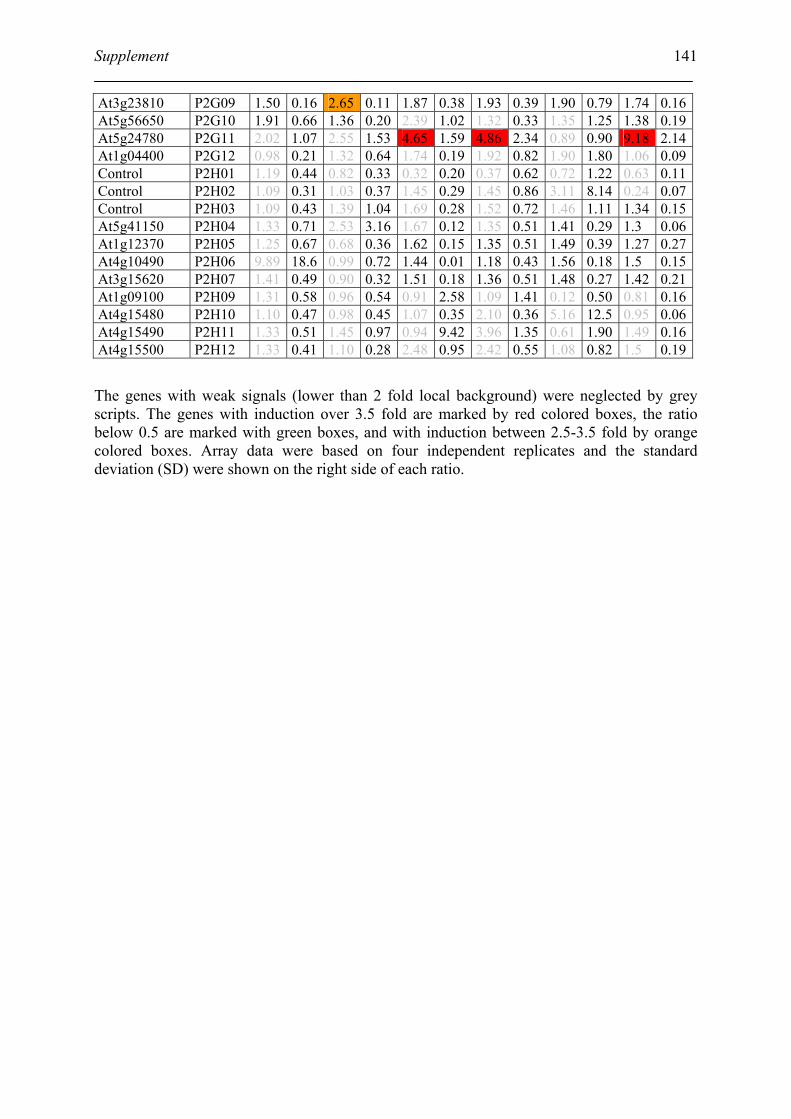
Supplement
141
At3g23810 P2G09 1.50 0.16 2.65 0.11 1.87 0.38 1.93 0.39 1.90 0.79 1.74 0.16At5g56650 P2G10 1.91 0.66 1.36 0.20 2.39 1.02 1.32 0.33 1.35 1.25 1.38 0.19At5g24780 P2G11 2.02 1.07 2.55 1.53 4.65 1.59 4.86 2.34 0.89 0.90 9.18 2.14At1g04400 P2G12 0.98 0.21 1.32 0.64 1.74 0.19 1.92 0.82 1.90 1.80 1.06 0.09Control P2H01 1.19 0.44 0.82 0.33 0.32 0.20 0.37 0.62 0.72 1.22 0.63 0.11Control P2H02 1.09 0.31 1.03 0.37 1.45 0.29 1.45 0.86 3.11 8.14 0.24 0.07Control P2H03 1.09 0.43 1.39 1.04 1.69 0.28 1.52 0.72 1.46 1.11 1.34 0.15At5g41150 P2H04 1.33 0.71 2.53 3.16 1.67 0.12 1.35 0.51 1.41 0.29 1.3 0.06At1g12370 P2H05 1.25 0.67 0.68 0.36 1.62 0.15 1.35 0.51 1.49 0.39 1.27 0.27At4g10490 P2H06 9.89 18.6 0.99 0.72 1.44 0.01 1.18 0.43 1.56 0.18 1.5 0.15At3g15620 P2H07 1.41 0.49 0.90 0.32 1.51 0.18 1.36 0.51 1.48 0.27 1.42 0.21At1g09100 P2H09 1.31 0.58 0.96 0.54 0.91 2.58 1.09 1.41 0.12 0.50 0.81 0.16At4g15480 P2H10 1.10 0.47 0.98 0.45 1.07 0.35 2.10 0.36 5.16 12.5 0.95 0.06At4g15490 P2H11 1.33 0.51 1.45 0.97 0.94 9.42 3.96 1.35 0.61 1.90 1.49 0.16At4g15500 P2H12 1.33 0.41 1.10 0.28 2.48 0.95 2.42 0.55 1.08 0.82 1.5 0.19
The genes with weak signals (lower than 2 fold local background) were neglected by grey scripts. The genes with induction over 3.5 fold are marked by red colored boxes, the ratio below 0.5 are marked with green boxes, and with induction between 2.5-3.5 fold by orange colored boxes. Array data were based on four independent replicates and the standard deviation (SD) were shown on the right side of each ratio.
Acknowledgements
I am most grateful to my supervisor PD Dr. J. Durner for his guidance, support and confidence during this work, and I thank him for his suggestions, excellent correction and accurate review of this the manuscripts.
I express my profound gratitude and deep appreciation to Prof. Dr. H. Sandermann for accepting me as a member of BIOP and fruitful discussion of my work.
I would like to express my sincere gratitude to Prof. Dr. E. Grill for accepting to be my referee.
I sincerely thank Prof. Dr. E. F. Elstner for accepting me for examination.
My profound gratitude goes to Dr. C. Lindermayer and Dr. U. von Rad for his fruitful discussion and the correction of this manuscript.
I am also grateful to E. Mattes and G. Fricke-Bode for technical assistance during the period of this work.
I sincerely thank the staffs of work group of plant immunity for their friendly collaboration and assistance.
My thanks go to the staffs of BIOP for their help in one or other way during the period of this work.
I wish to express my gratitude to R. Ludwig, W. Mayr for ethylene and salicylic acid determination.
My cordial thanks to K. Stettmaier for assistance with EPR and Dr. P. Hutzler for help in confocal microscopie.
Sincere thanks go to work group of Dr. M. J. Mueller in University of Wuerzburg for JA determination.
I am indebted to my wife and my children for their morale assistance and patience.
Finally, I thank the “Deutsche Forschungsgemeinschaft (DFG)” for financial support.

Curriculum vitae
Name Xi Huang
Date of birth 16. 10.1969
Place of birth Hainan, P. R. China
Parents Mother Huanying Li and father Tiancheng Huang
1977-1982 Primary school in Qionghai, Hainan
1982-1988 Middle school in Qionghai, Hainan
1988-1992 Study of biology in Peking University
1992 Bachelor
1992-1998 Work in Biotechnical Department in Hainan Academy of Agricultural Sciences
31. 03. 1998 Come to Germany as DAAD scholarship holder
Mar. - Oct. 1998 Learn German in Goethe-Institute in Göttingen
Oct.1998-Oct.2000 Master of science student at the Institute of Plant Pathology and Plant Protection, Georg-August-University, Göttingen
Oct. 2000 Master of Science
Nov. 2000 to date Ph. D student at Institute of Biochemical Plant Pathology, GSF-National Research Center for Environment and Health, Munich