Embed Size (px)
Citation preview
Ostdeutsche Studiengruppe Hämatologie und Onkologie
Hämatologie im Wandel 2015
Akute Myeloische Leukämien
Studien der OSHO
Ostdeutsche Studiengruppe Hämatologie und Onkologie
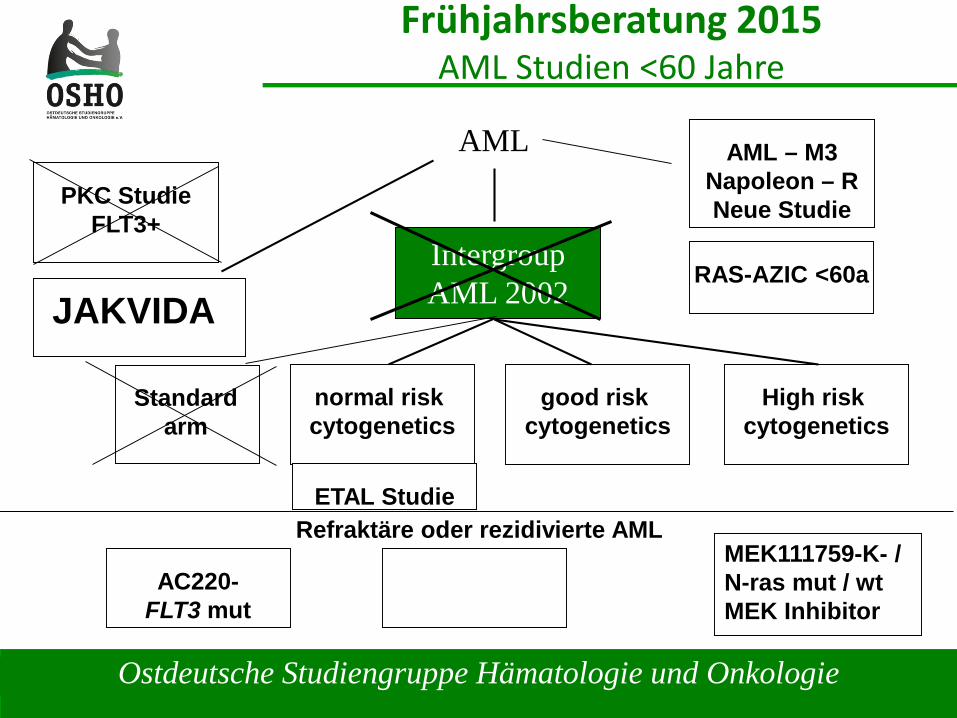
Frühjahrsberatung 2015AML Studien <60 Jahre
IntergroupAML 2002
AML
PKC StudieFLT3+
High risk cytogenetics
normal risk cytogenetics
good risk cytogenetics
Standard arm
AML – M3Napoleon – RNeue Studie
Refraktäre oder rezidivierte AML
AC220-FLT3 mut
MEK111759-K- / N-ras mut / wtMEK Inhibitor
RAS-AZIC <60aJAKVIDA
ETAL Studie
Ostdeutsche Studiengruppe Hämatologie und Onkologie
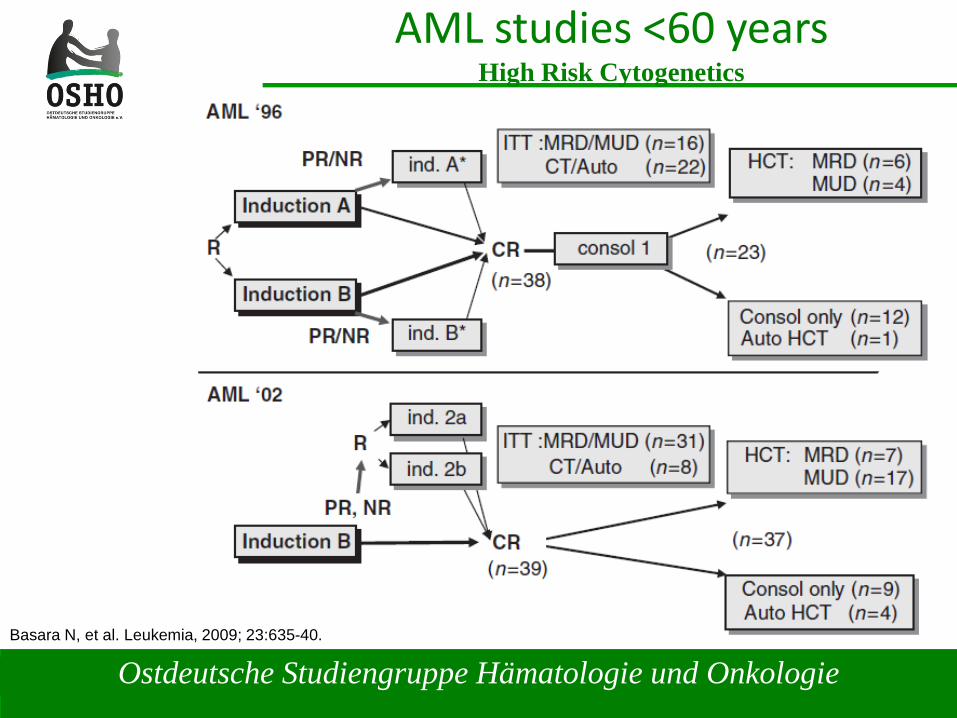
AML studies <60 yearsHigh Risk Cytogenetics
Basara N, et al. Leukemia, 2009; 23:635-40.
Ostdeutsche Studiengruppe Hämatologie und Onkologie
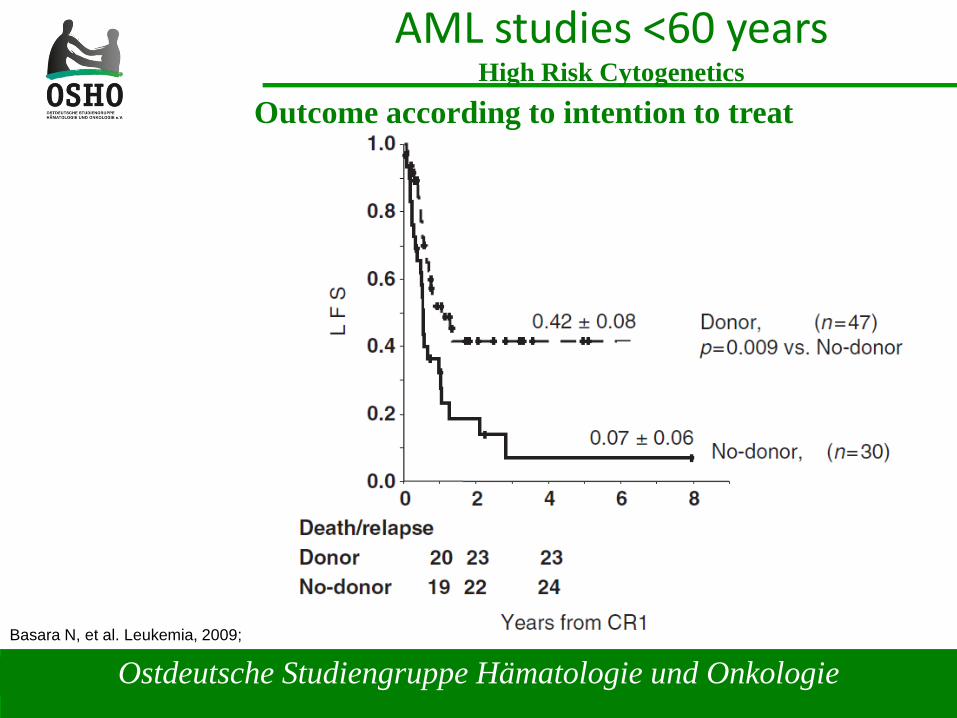
AML studies <60 yearsHigh Risk Cytogenetics
Basara N, et al. Leukemia, 2009; 23:635-40.
Outcome according to intention to treat
Ostdeutsche Studiengruppe Hämatologie und Onkologie
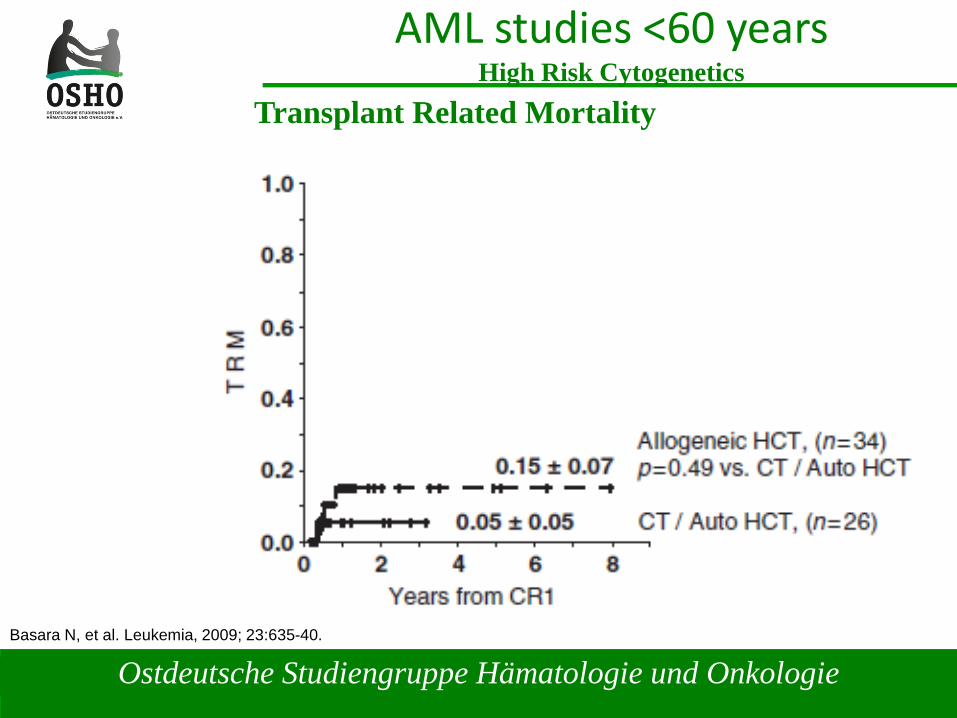
AML studies <60 yearsHigh Risk Cytogenetics
Basara N, et al. Leukemia, 2009; 23:635-40.
Transplant Related Mortality
Ostdeutsche Studiengruppe Hämatologie und Onkologie
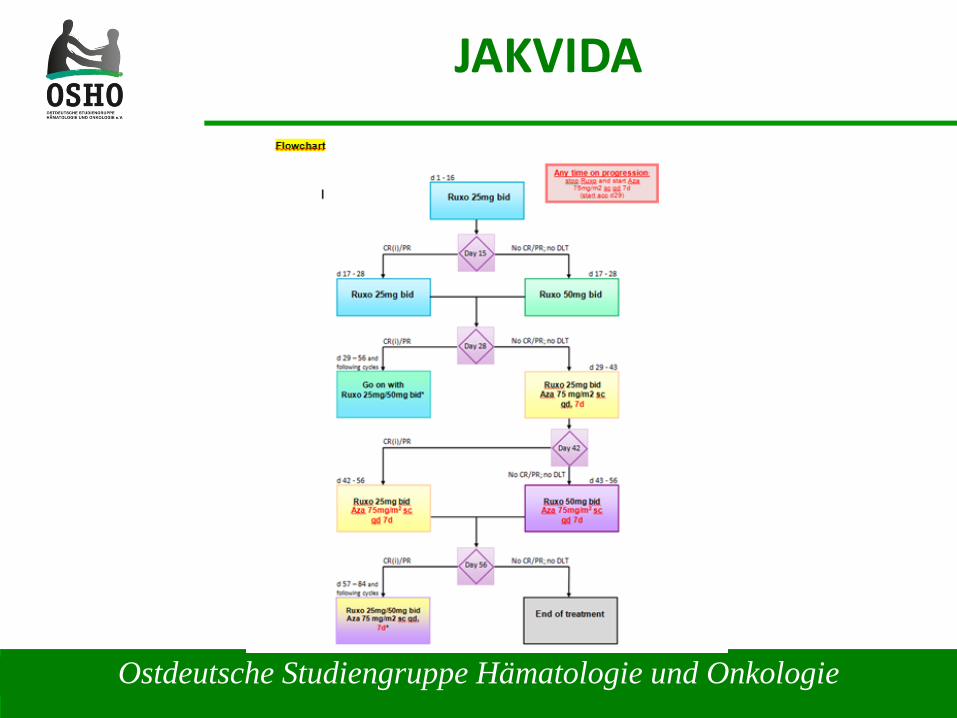
JAKVIDA
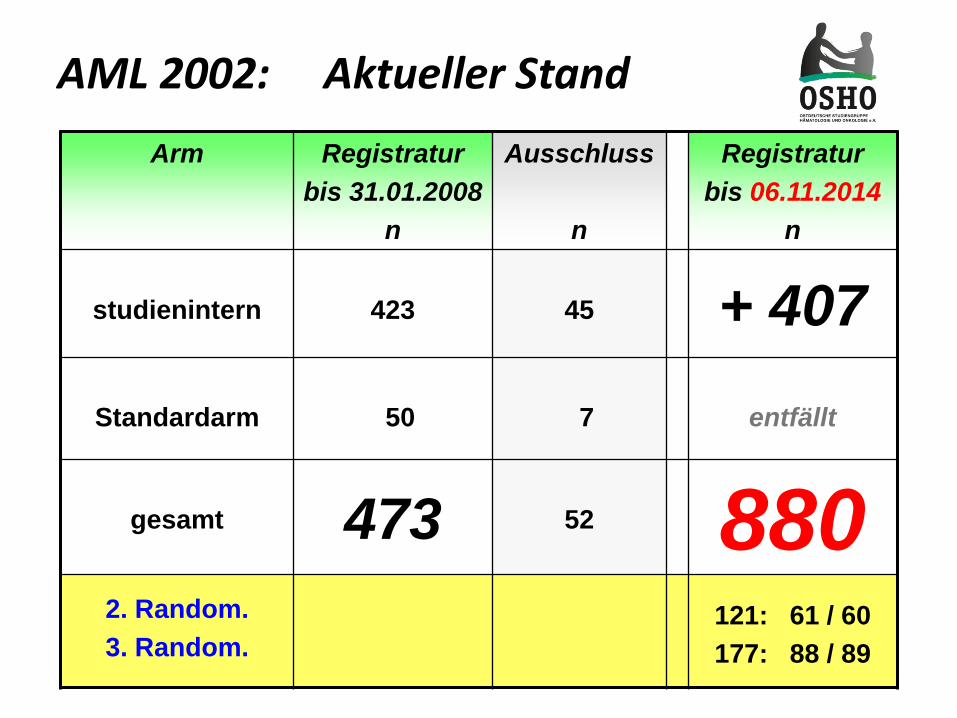
AML 2002: Aktueller StandArm Registratur
bis 31.01.2008n
Ausschluss
n
Registraturbis 06.11.2014
n
studienintern 423 45 + 407Standardarm 50 7 entfällt
gesamt 473 52 8802. Random.3. Random.
121: 61 / 60177: 88 / 89
Ostdeutsche Studiengruppe Hämatologie und Onkologie
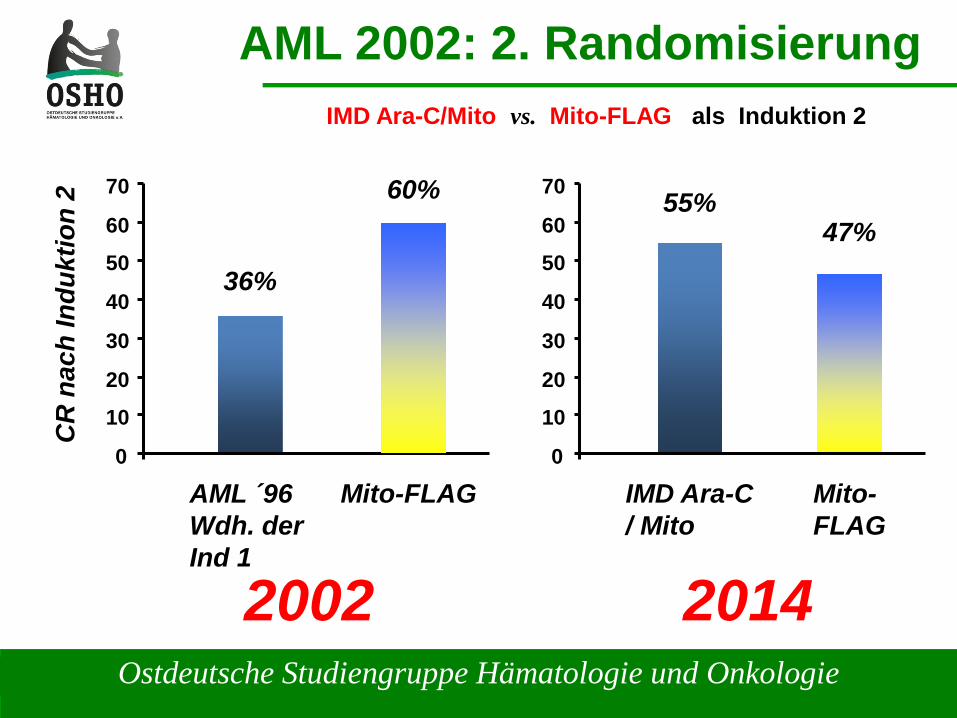
AML 2002: 2. RandomisierungIMD Ara-C/Mito vs. Mito-FLAG als Induktion 2
0
10
20
30
40
50
60
70
IMD Ara-C/ Mito
55%47%
Mito-FLAG
0
10
20
30
40
50
60
70
AML ´96Wdh. derInd 1
CR
nac
h In
dukt
ion
2
36%
60%
Mito-FLAG
2002 2014
Ostdeutsche Studiengruppe Hämatologie und Onkologie
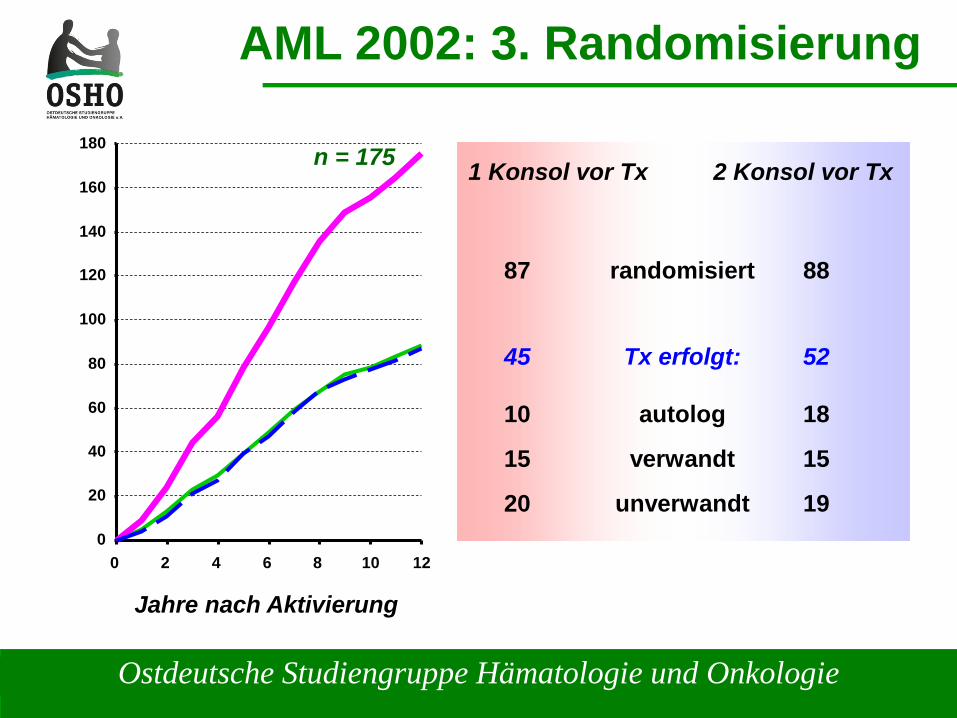
AML 2002: 3. Randomisierung
Jahre nach Aktivierung
1 Konsol vor Tx 2 Konsol vor Tx
randomisiert
Tx erfolgt:
autolog
verwandt
unverwandt
88
52
18
15
19
87
45
10
15
200
20
40
60
80
100
120
140
160
180
0 2 4 6 8 10 12
n = 175
Ostdeutsche Studiengruppe Hämatologie und Onkologie
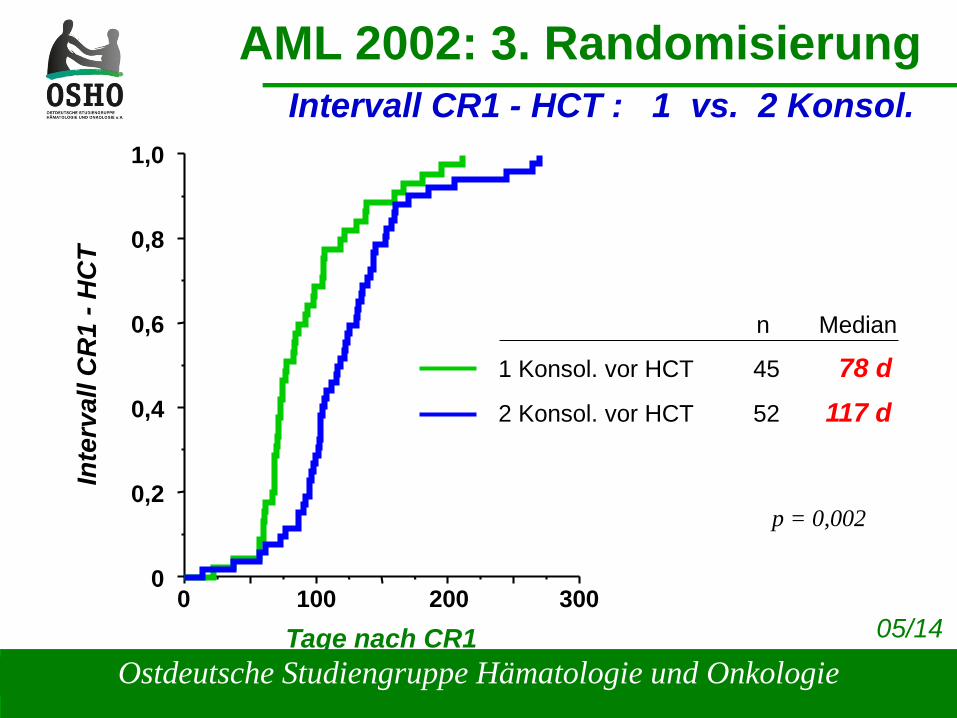
AML 2002: 3. RandomisierungIntervall CR1 - HCT : 1 vs. 2 Konsol.
1,0
0,8
0,6
0,4
0,2
0
Inte
rval
l CR
1 -H
CT
100 200 3000Tage nach CR1
n Median
1 Konsol. vor HCT 45 78 d2 Konsol. vor HCT 52 117 d
p = 0,002
05/14
Ostdeutsche Studiengruppe Hämatologie und Onkologie
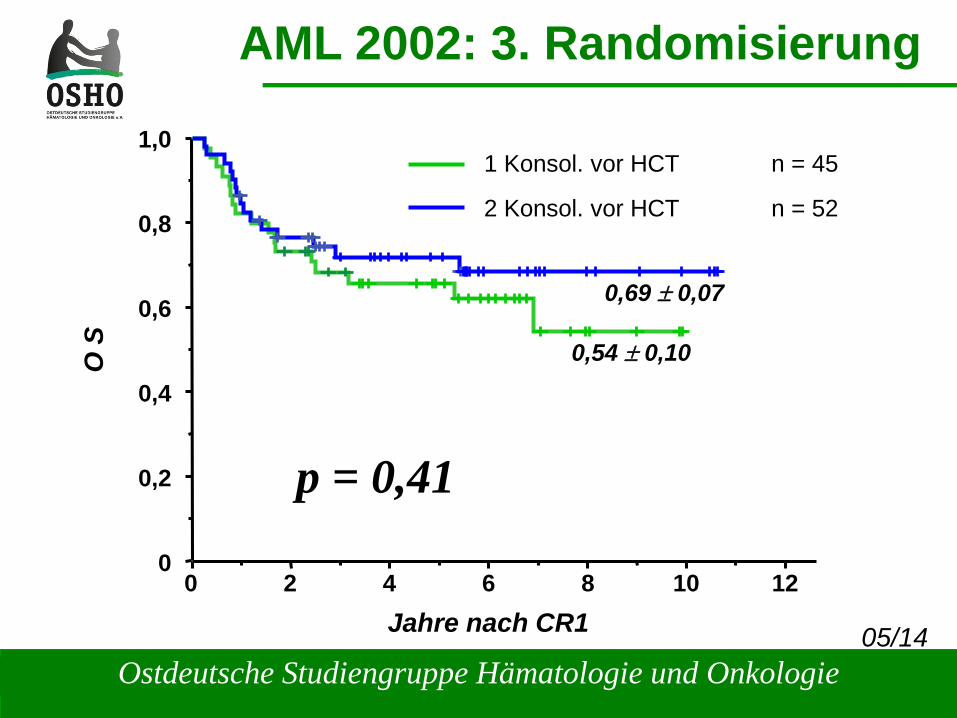
AML 2002: 3. Randomisierung
1,0
0,8
0,6
0,4
0,2
0
O S
0Jahre nach CR1
1 Konsol. vor HCT n = 45
2 Konsol. vor HCT n = 52
p = 0,41
2 4 6 8
0,54 ± 0,10
10 12
0,69 ± 0,07
05/14
Ostdeutsche Studiengruppe Hämatologie und Onkologie
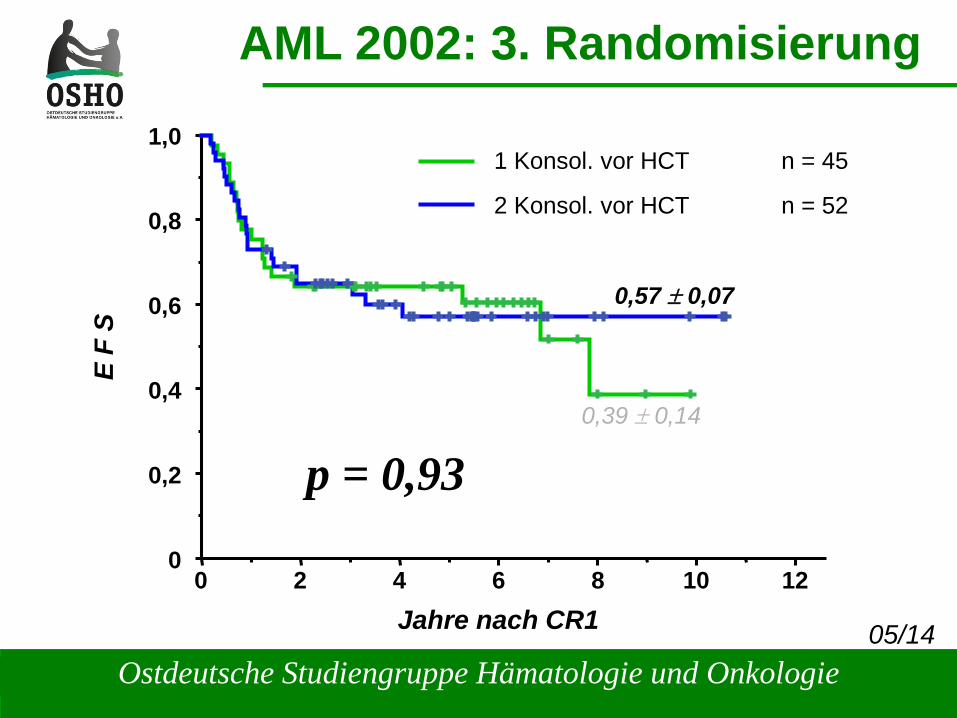
AML 2002: 3. Randomisierung
1,0
0,8
0,6
0,4
0,2
0
E F
S
0Jahre nach CR1
1 Konsol. vor HCT n = 45
2 Konsol. vor HCT n = 52
p = 0,93
2 4 6 8
0,39 ± 0,14
10 12
0,57 ± 0,07
05/14
Ostdeutsche Studiengruppe Hämatologie und Onkologie
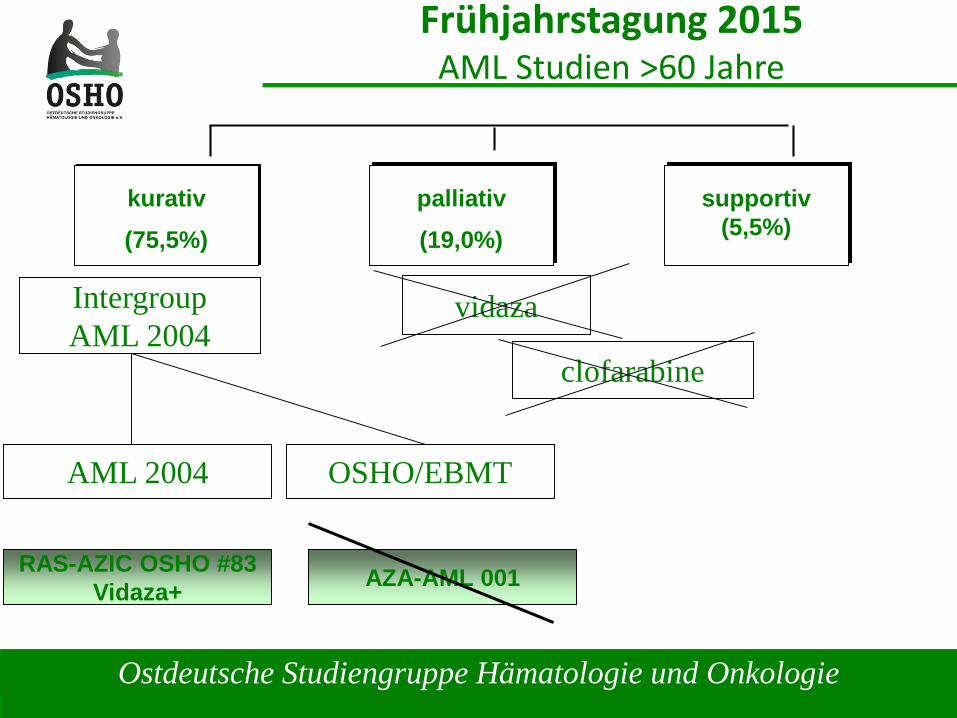
Frühjahrstagung 2015AML Studien >60 Jahre
IntergroupAML 2004
kurativ(75,5%)
palliativ(19,0%)
supportiv(5,5%)
OSHO/EBMT
vidaza
clofarabine
AML 2004
RAS-AZIC OSHO #83Vidaza+ AZA-AML 001
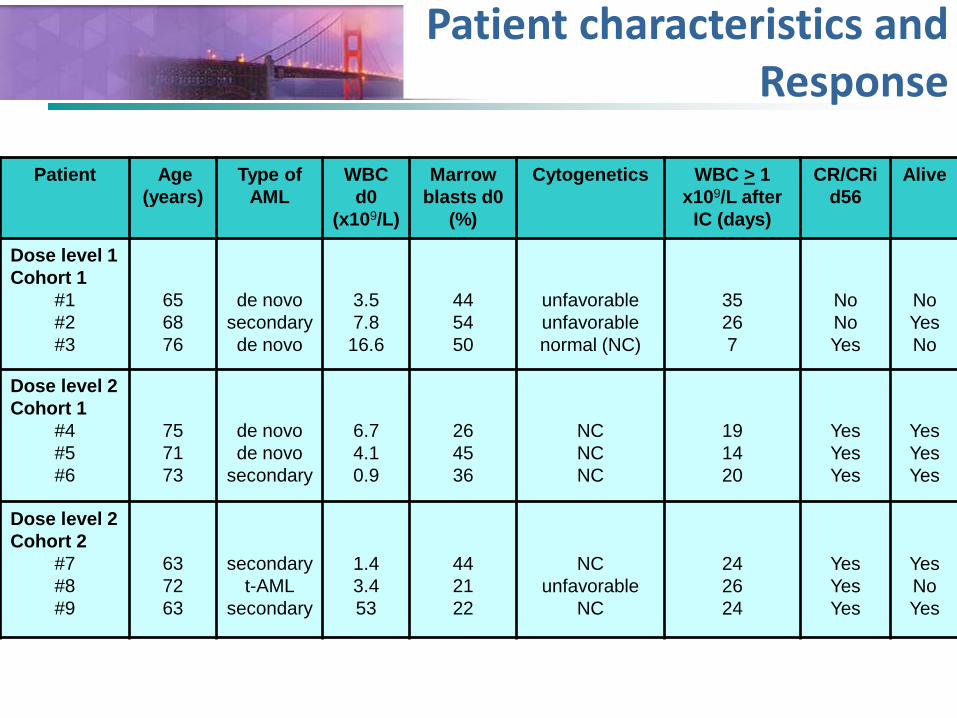
Akute LeukämienPatient characteristics and Response
Patient Age (years)
Type ofAML
WBC d0
(x109/L)
Marrowblasts d0
(%)
Cytogenetics WBC > 1 x10⁹/L after
IC (days)
CR/CRid56
Alive
Dose level 1Cohort 1
#1#2#3
656876
de novosecondaryde novo
3.57.8
16.6
445450
unfavorableunfavorablenormal (NC)
35267
NoNoYes
NoYesNo
Dose level 2Cohort 1
#4#5#6
757173
de novode novo
secondary
6.74.10.9
264536
NCNCNC
191420
YesYesYes
YesYesYes
Dose level 2Cohort 2
#7#8#9
637263
secondaryt-AML
secondary
1.43.453
442122
NCunfavorable
NC
242624
YesYesYes
YesNoYes
Higher LFS after Post-Induction Hematopoietic CellTransplantation Compared to Consolidation Therapy in
Patients >60 Years: Report from the OSHO-AML 2004 study
D. Niederwieser, H. Al-Ali, V. Hoffmann, R. Krahl, Ch. Kahl, H-H. Wolf, U. Kreibich, V. Vucinic, D. Hähling, U. Hegenbart, A.
Krämer, C. Hirt, N. Peter, B. Opitz, A. Florschütz, K. Reifenrath, A. Schulze, N. Zojer, S. Scholl, Ch. Jakob, Ch. Junghanss, W.
Pönisch, S. Heyn, H. Sayer, A. Hochhaus, T. Heinicke, T. Fischer, P. Dreger and G. Maschmeyer
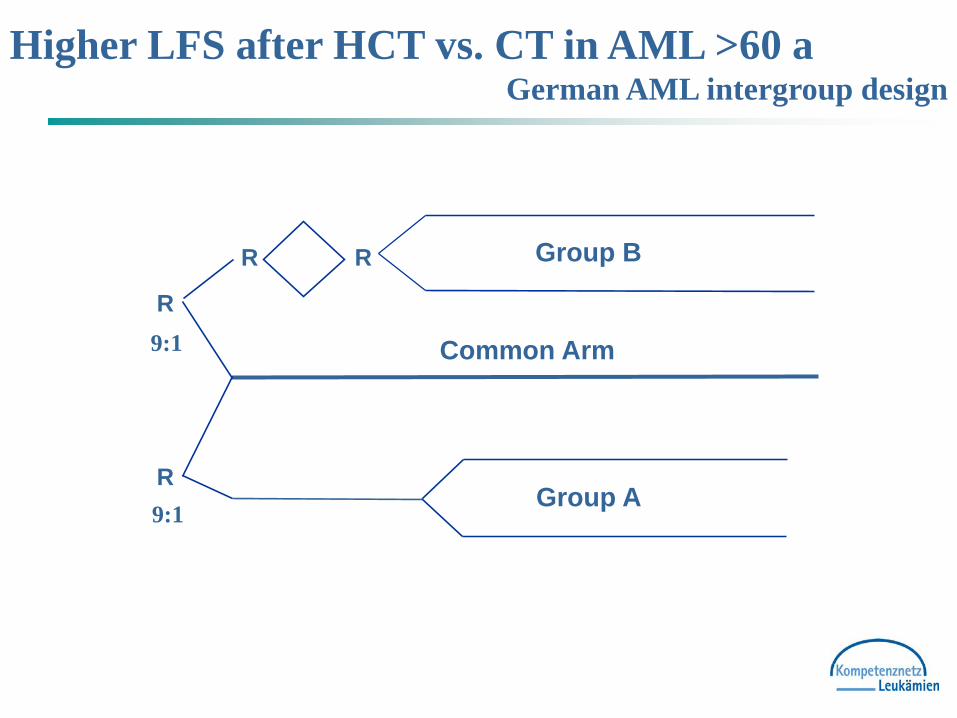
Higher LFS after HCT vs. CT in AML >60 aGerman AML intergroup design
Group B
Group AR
R
Common Arm
R R
9:1
9:1
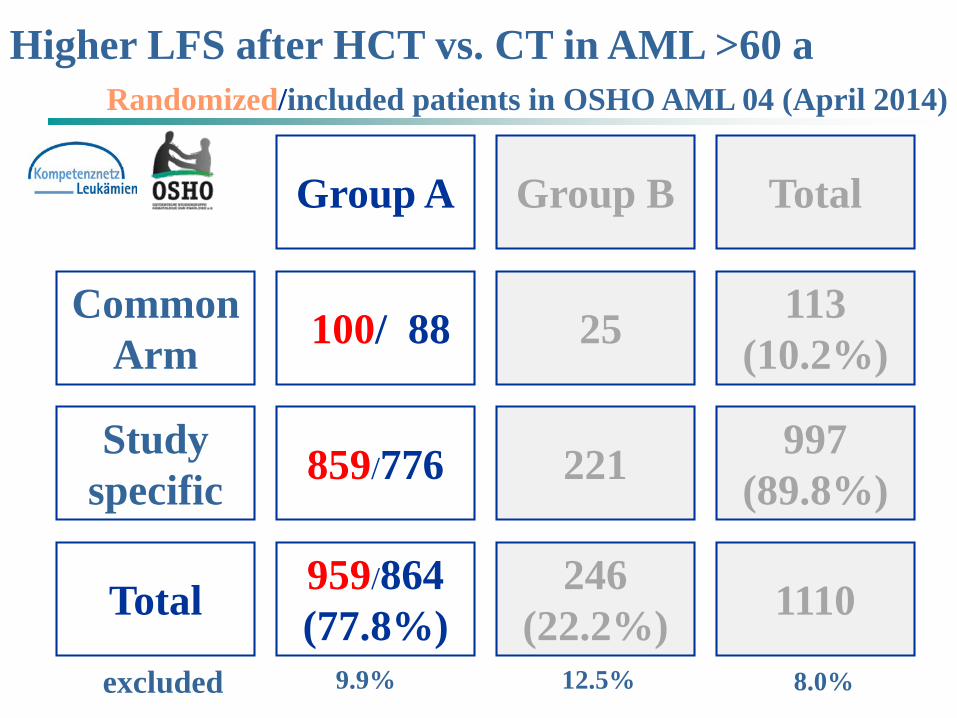
Higher LFS after HCT vs. CT in AML >60 aRandomized/included patients in OSHO AML 04 (April 2014)
Group A Group B Total
CommonArm 100/ 88 25 113
(10.2%)
Study specific 859/776 221 997
(89.8%)
Total 959/864(77.8%)
246(22.2%) 1110
12.5%9.9%excluded 8.0%
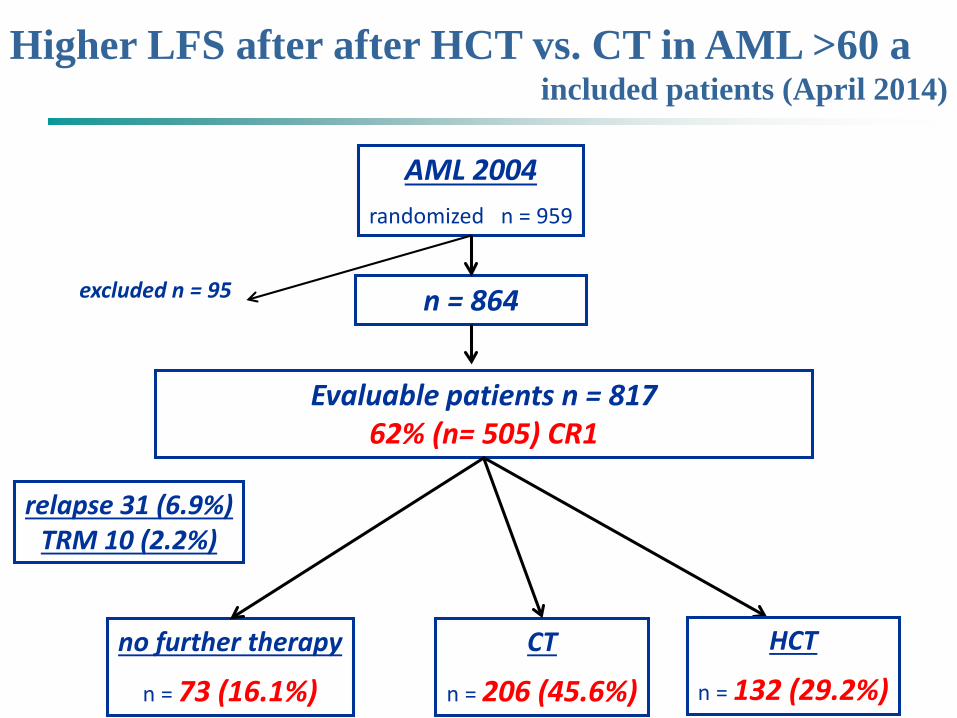
Higher LFS after after HCT vs. CT in AML >60 aincluded patients (April 2014)
AML 2004randomized n = 959
excluded n = 95 n = 864
Evaluable patients n = 81762% (n= 505) CR1
no further therapy
n = 73 (16.1%)CT
n = 206 (45.6%)
relapse 31 (6.9%)TRM 10 (2.2%)
HCT
n = 132 (29.2%)
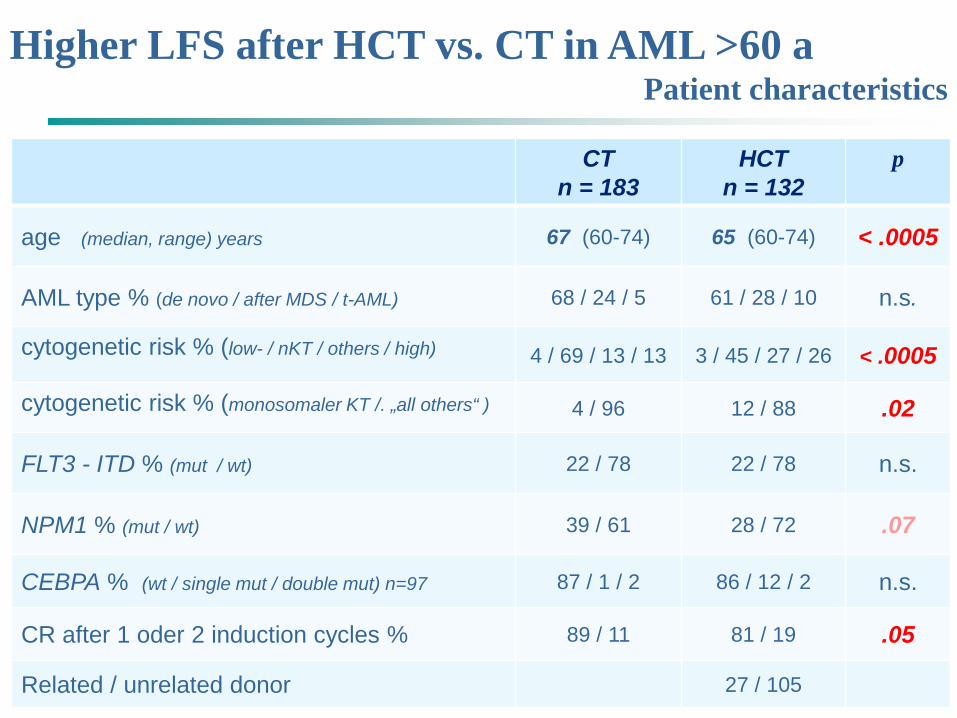
Higher LFS after HCT vs. CT in AML >60 aPatient characteristics
CTn = 183
HCT n = 132
p
age (median, range) years 67 (60-74) 65 (60-74) < .0005
AML type % (de novo / after MDS / t-AML) 68 / 24 / 5 61 / 28 / 10 n.s.
cytogenetic risk % (low- / nKT / others / high) 4 / 69 / 13 / 13 3 / 45 / 27 / 26 < .0005
cytogenetic risk % (monosomaler KT /. „all others“ ) 4 / 96 12 / 88 .02
FLT3 - ITD % (mut / wt) 22 / 78 22 / 78 n.s.
NPM1 % (mut / wt) 39 / 61 28 / 72 .07
CEBPA % (wt / single mut / double mut) n=97 87 / 1 / 2 86 / 12 / 2 n.s.
CR after 1 oder 2 induction cycles % 89 / 11 81 / 19 .05
Related / unrelated donor 27 / 105
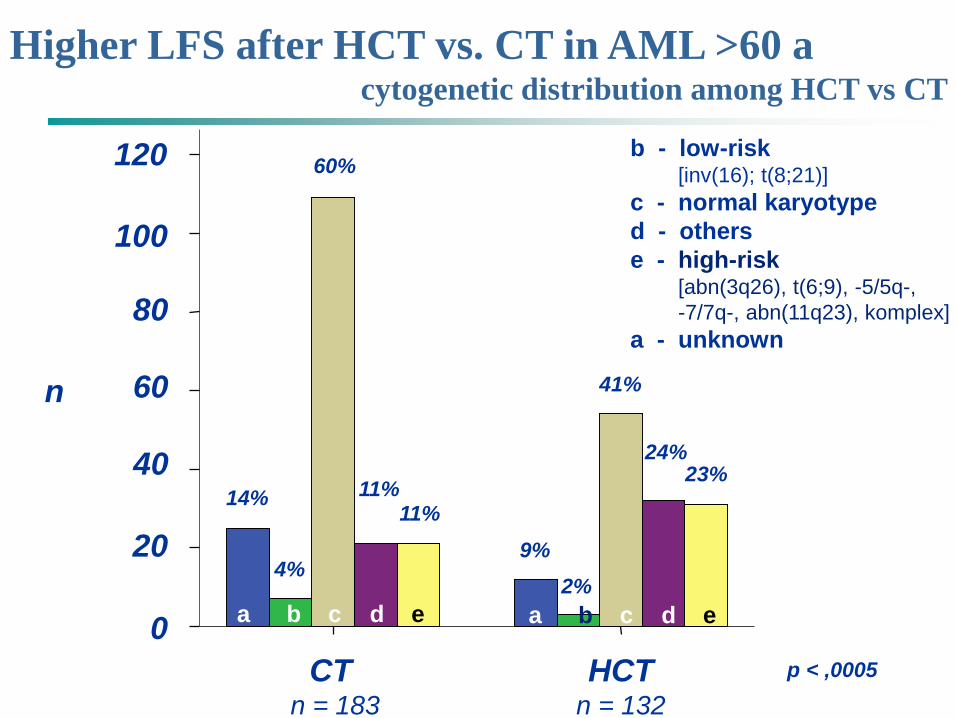
Higher LFS after HCT vs. CT in AML >60 acytogenetic distribution among HCT vs CT
CT n = 183
HCTn = 132
n
100
0
b - low-risk[inv(16); t(8;21)]
c - normal karyotyped - otherse - high-risk
[abn(3q26), t(6;9), -5/5q-, -7/7q-, abn(11q23), komplex]
a - unknown
a b c d e
14%
4%
60%
9%11%
2%
41%
24%23%
11%
p < ,0005
a b c d e
80
60
40
20
120
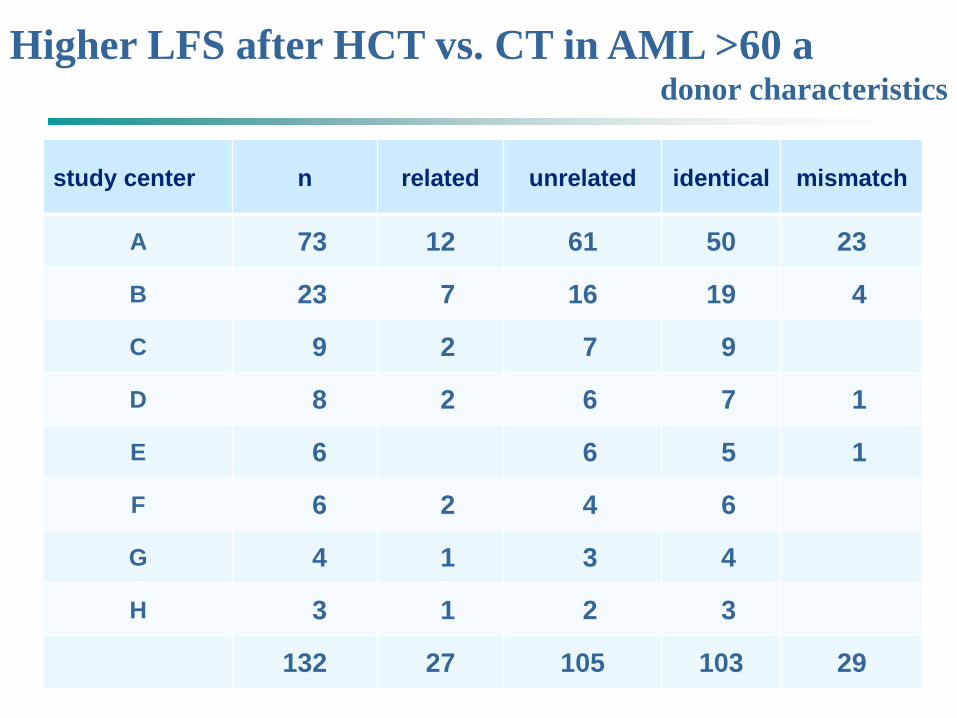
Higher LFS after HCT vs. CT in AML >60 adonor characteristics
study center n related unrelated identical mismatch
A 73 12 61 50 23
B 23 7 16 19 4
C 9 2 7 9
D 8 2 6 7 1
E 6 6 5 1
F 6 2 4 6
G 4 1 3 4
H 3 1 2 3
132 27 105 103 29
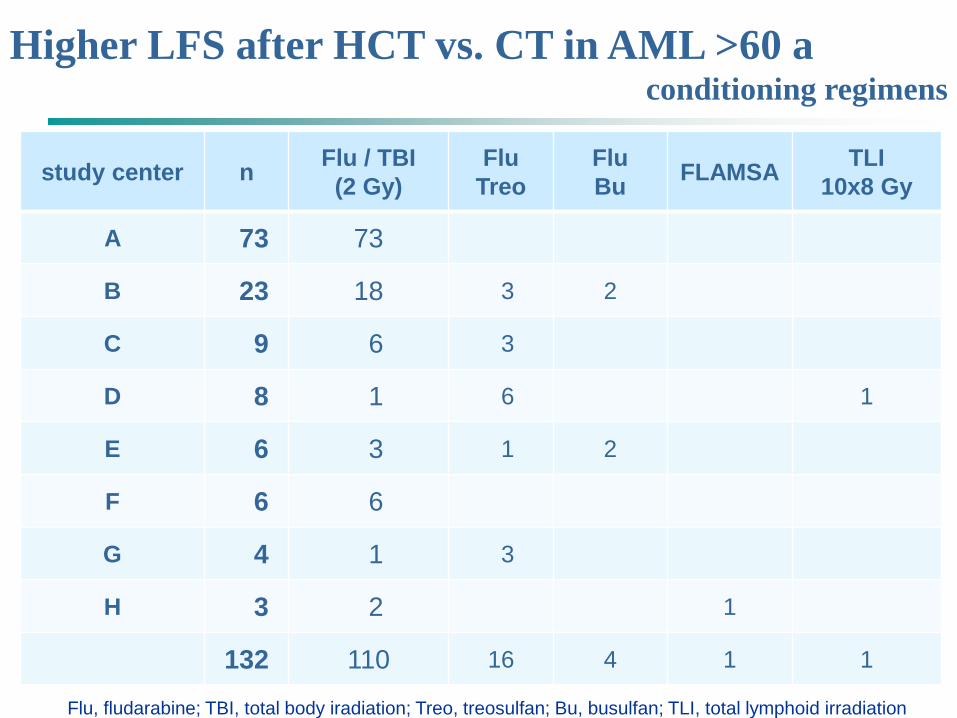
Higher LFS after HCT vs. CT in AML >60 aconditioning regimens
study center n Flu / TBI(2 Gy)
Flu Treo
FluBu FLAMSA TLI
10x8 Gy
A 73 73
B 23 18 3 2
C 9 6 3
D 8 1 6 1
E 6 3 1 2
F 6 6
G 4 1 3
H 3 2 1
132 110 16 4 1 1
Flu, fludarabine; TBI, total body iradiation; Treo, treosulfan; Bu, busulfan; TLI, total lymphoid irradiation
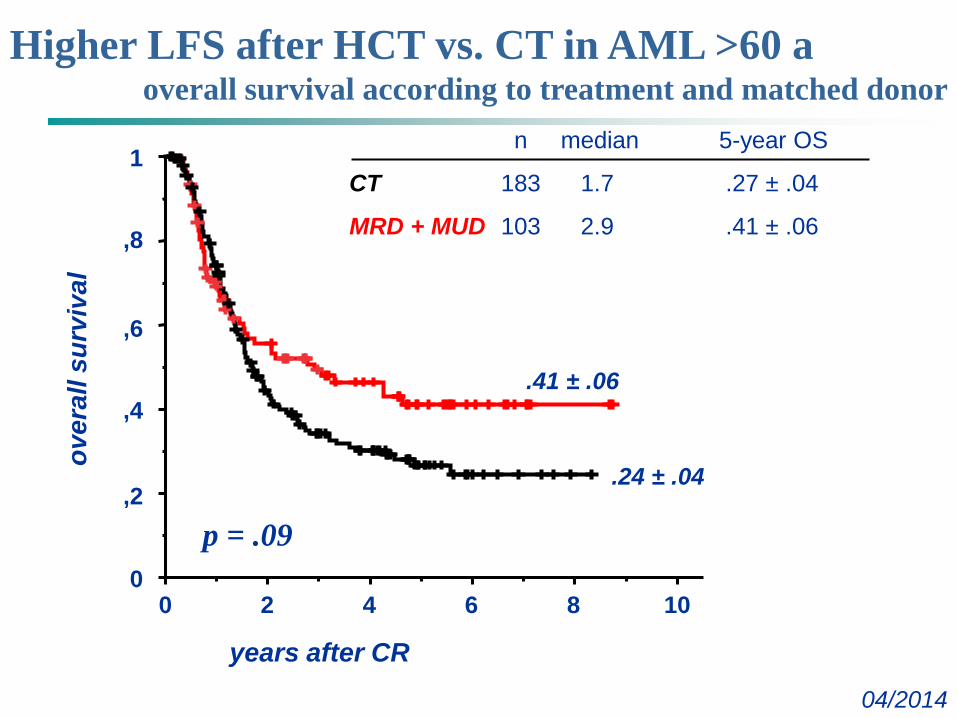
Higher LFS after HCT vs. CT in AML >60 aoverall survival according to treatment and matched donor
04/2014
0
1
,8
,6
,4
,2
02 4 8 10
years after CR
over
alls
urvi
val
6
n median 5-year OS
CT 183 1.7 .27 ± .04
MRD + MUD 103 2.9 .41 ± .06
.41 ± .06
.24 ± .04
p = .09
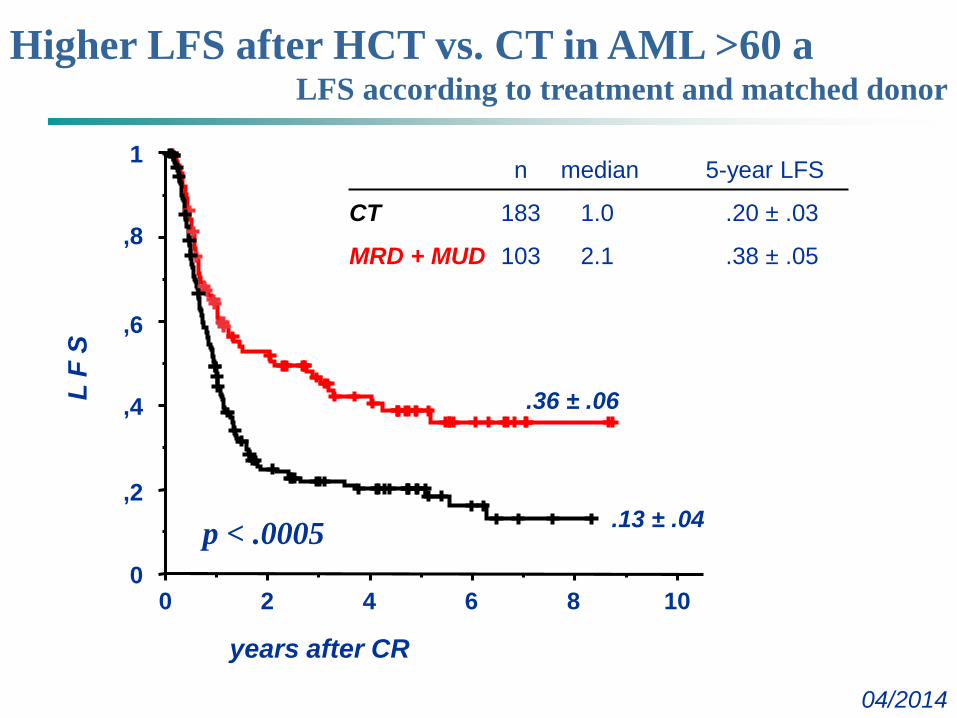
Higher LFS after HCT vs. CT in AML >60 aLFS according to treatment and matched donor
04/2014
0
1
,8
,6
,4
,2
02 4 8 10
years after CR
L F
S
6
n median 5-year LFS
CT 183 1.0 .20 ± .03
MRD + MUD 103 2.1 .38 ± .05
.36 ± .06
.13 ± .04p < .0005
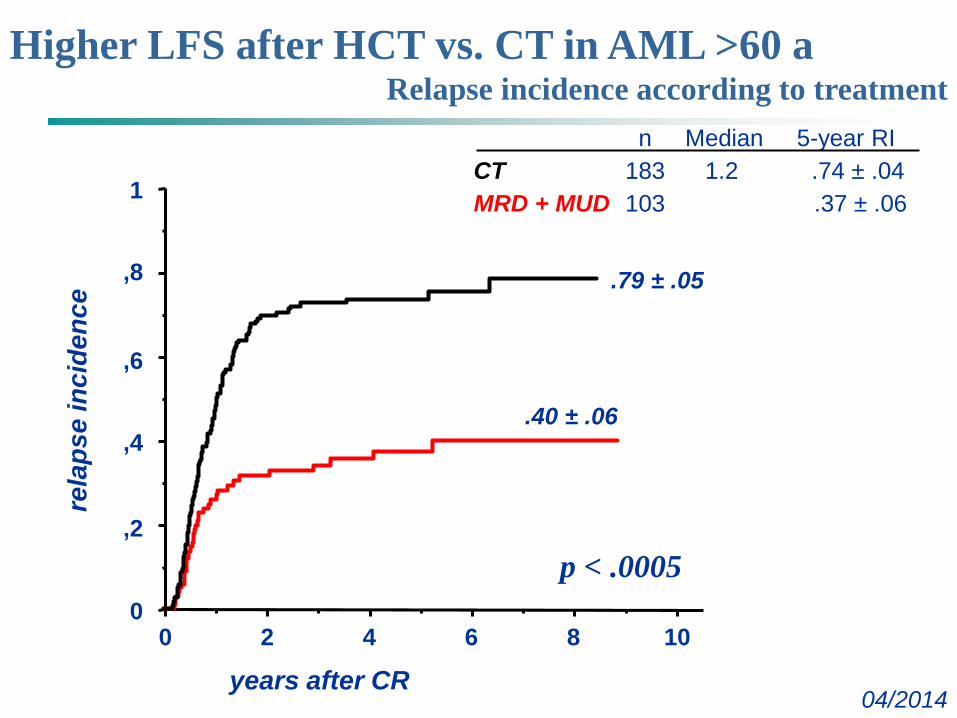
Higher LFS after HCT vs. CT in AML >60 aRelapse incidence according to treatment
04/2014
0
1
,8
,6
,4
,2
02 4 8 10
years after CR
rela
pse
inci
denc
e
6
.79 ± .05
.40 ± .06
n Median 5-year RICT 183 1.2 .74 ± .04MRD + MUD 103 .37 ± .06
p < .0005
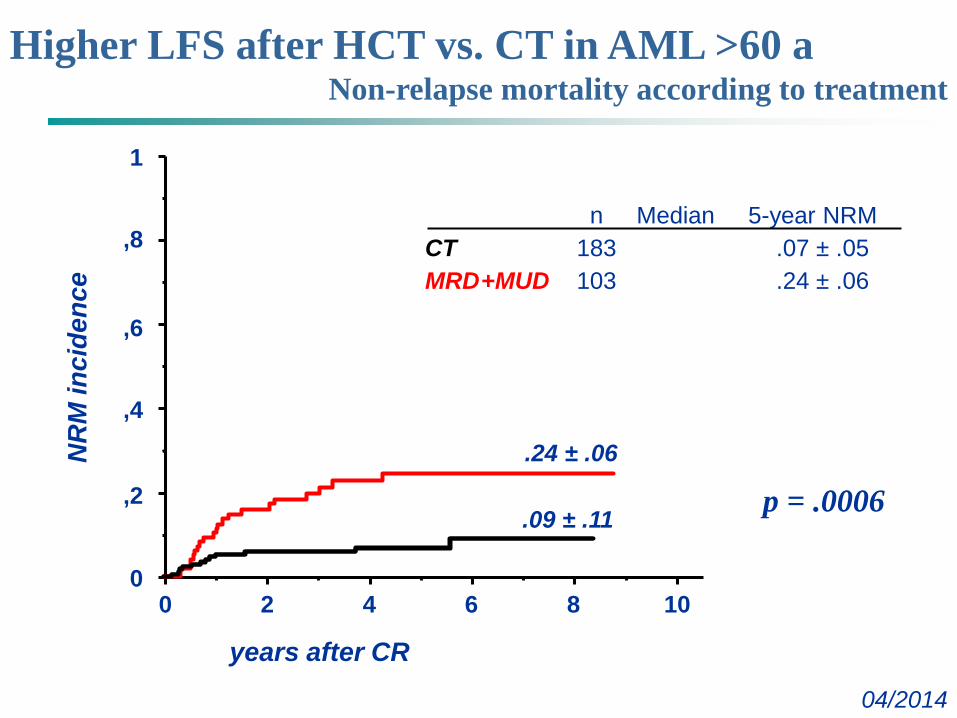
Higher LFS after HCT vs. CT in AML >60 aNon-relapse mortality according to treatment
04/2014
0
1
,8
,6
,4
,2
02 4 8 10
years after CR
NR
M in
cide
nce
6
.24 ± .06
.09 ± .11
n Median 5-year NRMCT 183 .07 ± .05MRD+MUD 103 .24 ± .06
p = .0006
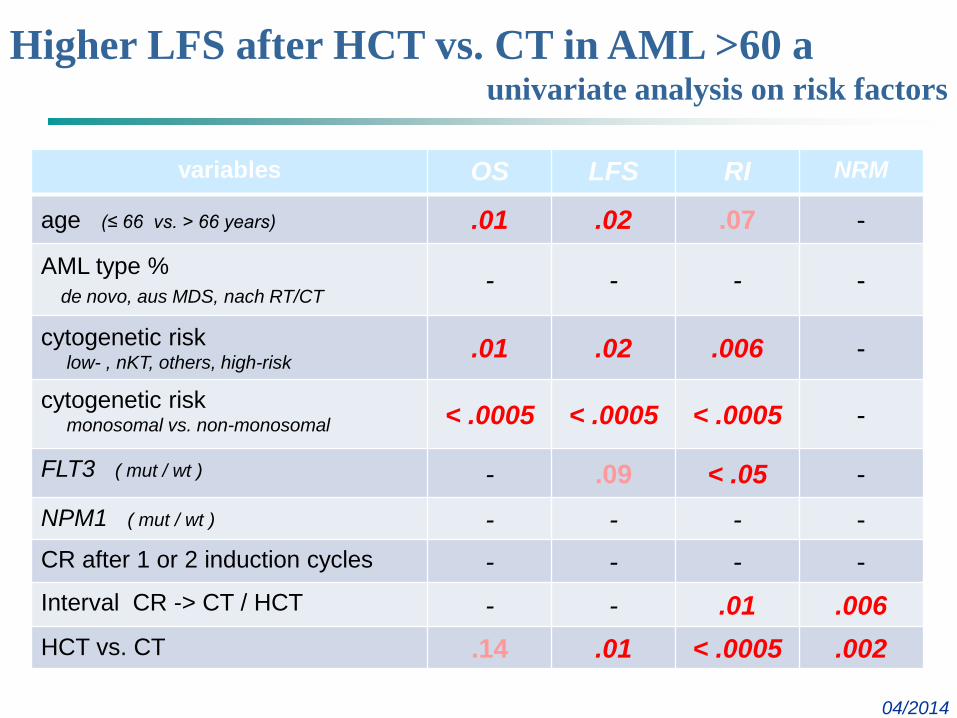
Higher LFS after HCT vs. CT in AML >60 aunivariate analysis on risk factors
04/2014
variables OS LFS RI NRM
age (≤ 66 vs. > 66 years) .01 .02 .07 -
AML type % de novo, aus MDS, nach RT/CT
- - - -
cytogenetic risklow- , nKT, others, high-risk .01 .02 .006 -
cytogenetic riskmonosomal vs. non-monosomal < .0005 < .0005 < .0005 -
FLT3 ( mut / wt ) - .09 < .05 -NPM1 ( mut / wt ) - - - -CR after 1 or 2 induction cycles - - - -Interval CR -> CT / HCT - - .01 .006HCT vs. CT .14 .01 < .0005 .002
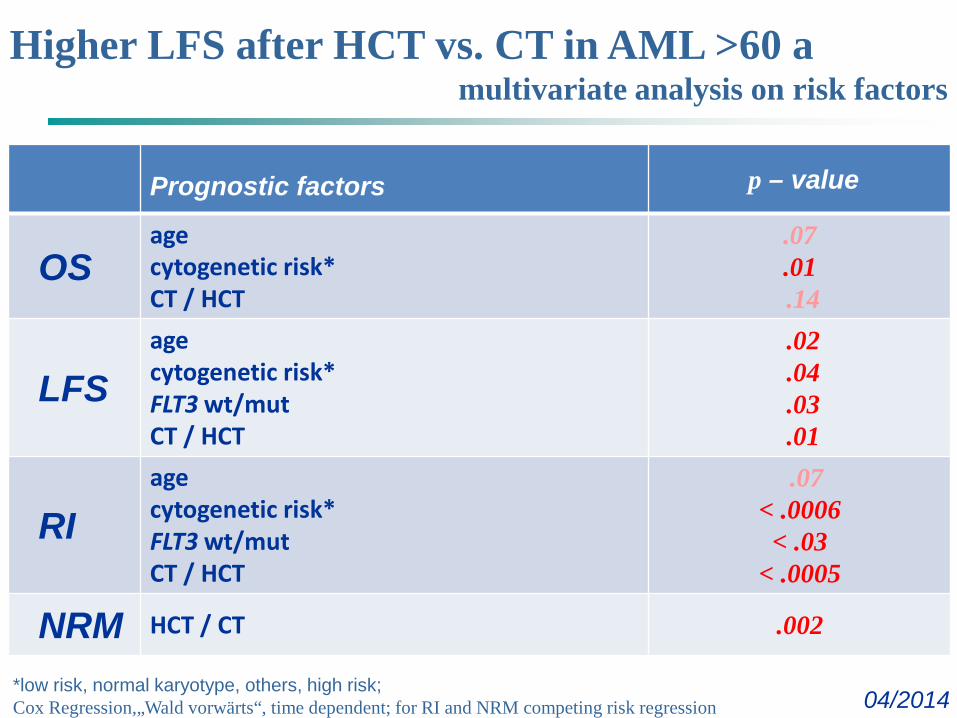
Higher LFS after HCT vs. CT in AML >60 amultivariate analysis on risk factors
04/2014
Prognostic factors p – value
OSagecytogenetic risk* CT / HCT
.07
.01.14
LFSage cytogenetic risk* FLT3 wt/mutCT / HCT
.02
.04
.03
.01
RIage cytogenetic risk*FLT3 wt/mutCT / HCT
.07< .0006
< .03< .0005
NRM HCT / CT .002
*low risk, normal karyotype, others, high risk; Cox Regression,„Wald vorwärts“, time dependent; for RI and NRM competing risk regression
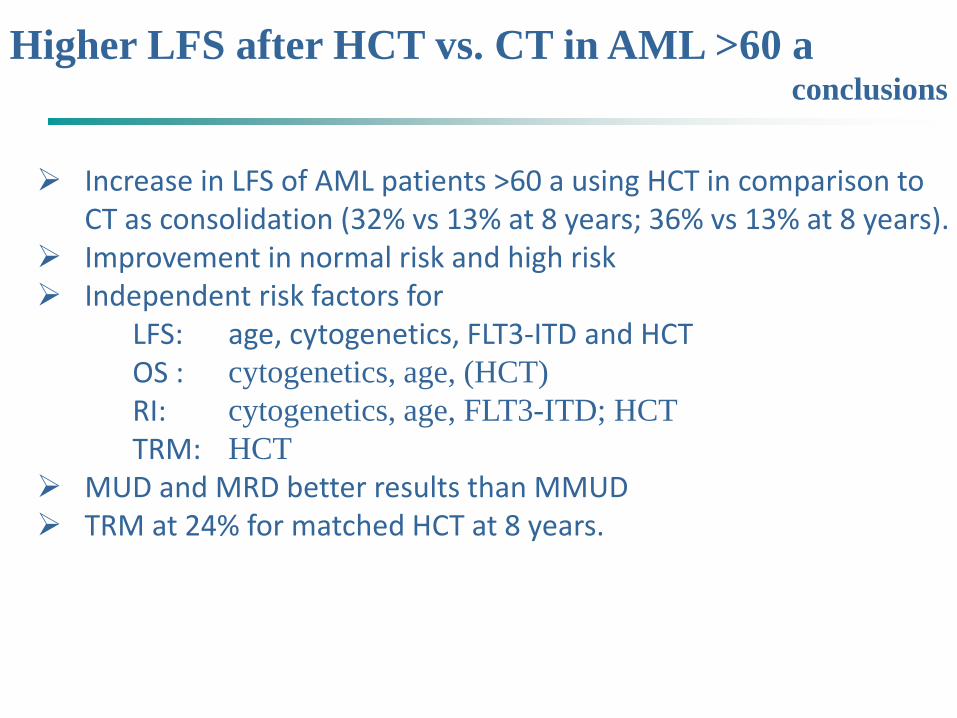
Higher LFS after HCT vs. CT in AML >60 aconclusions
Increase in LFS of AML patients >60 a using HCT in comparison to CT as consolidation (32% vs 13% at 8 years; 36% vs 13% at 8 years).
Improvement in normal risk and high risk Independent risk factors for
LFS: age, cytogenetics, FLT3-ITD and HCTOS : cytogenetics, age, (HCT)RI: cytogenetics, age, FLT3-ITD; HCTTRM: HCT
MUD and MRD better results than MMUD TRM at 24% for matched HCT at 8 years.
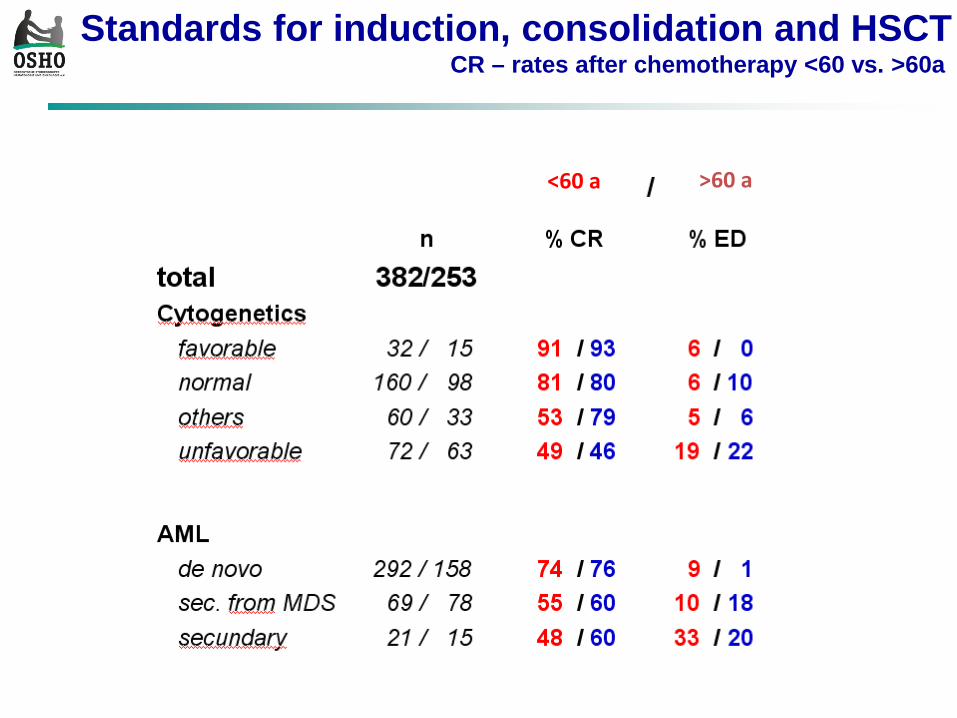
<60 a >60 a
Standards for induction, consolidation and HSCTCR – rates after chemotherapy <60 vs. >60a
Ostdeutsche Studiengruppe Hämatologie und Onkologie
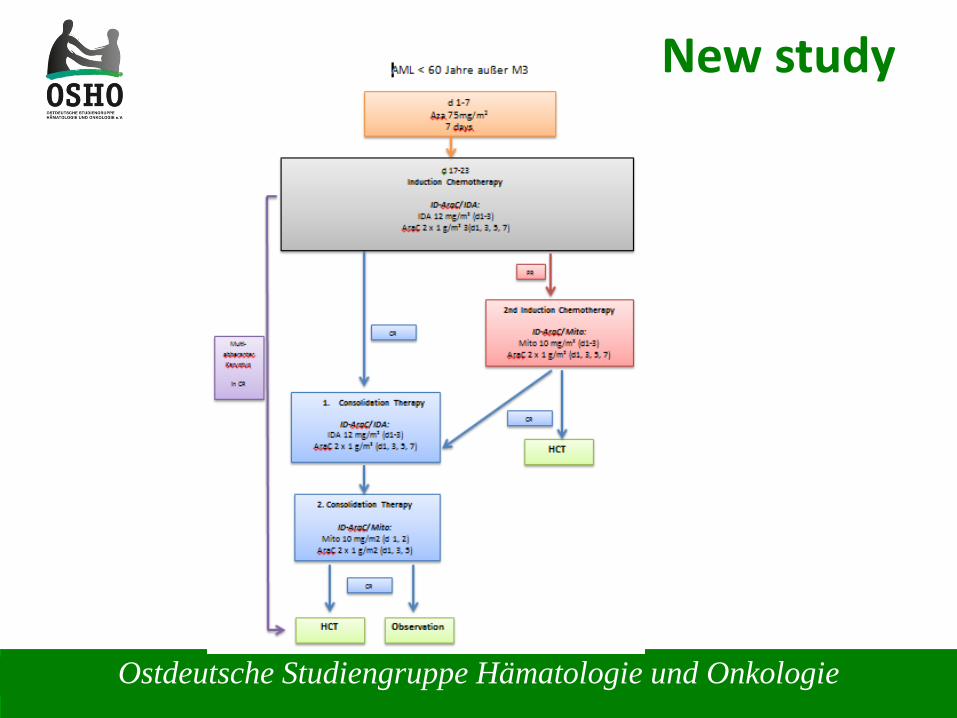
New study
Akute Leukämien
Response-Adapted Sequential Azacitidine and Induction Chemotherapy in
Patients > 60 Years Old with Newly Diagnosed AML Eligible for Chemotherapy (RAS-AZIC)
Results of the Phase I of the DRKS00004519 Study
Haifa Kathrin Al-Ali, MD1*, Rainer Krahl, PhD1*, Michael Cross, PhD2*, Hubert Karolin, Mrs2*, Nadja Jaekel, MD1* and Dietger Niederwieser, MD1
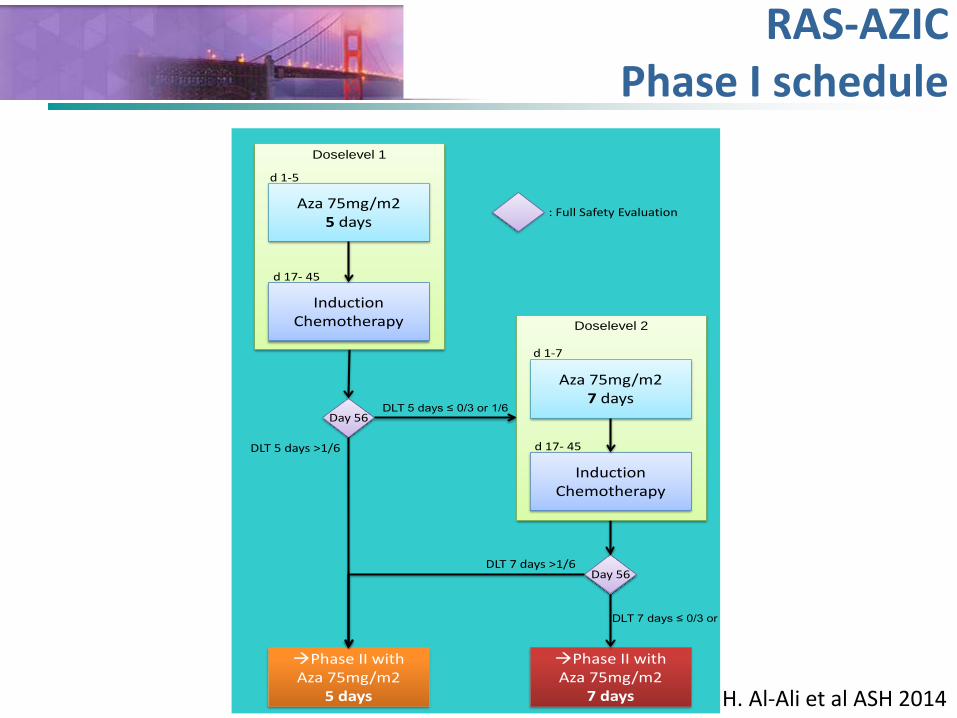
Akute LeukämienRAS-AZICPhase I schedule
Day 56
Day 56
Phase II withAza 75mg/m2
5 days
DLT 5 days ≤ 0/3 or 1/6
DLT 5 days >1/6
Phase II withAza 75mg/m2
7 days
: Full Safety Evaluation
DLT 7 days ≤ 0/3 or
DLT 7 days >1/6
Aza 75mg/m25 days
InductionChemotherapy
d 17- 45
d 1-5
Doselevel 1
Aza 75mg/m27 days
InductionChemotherapy
d 1-7
d 17- 45
Doselevel 2
H. Al-Ali et al ASH 2014
HCT vs. CT in elderly AML
Current statusas of 14-March-2014
Ostdeutsche Studiengruppe Hämatologie und Onkologie
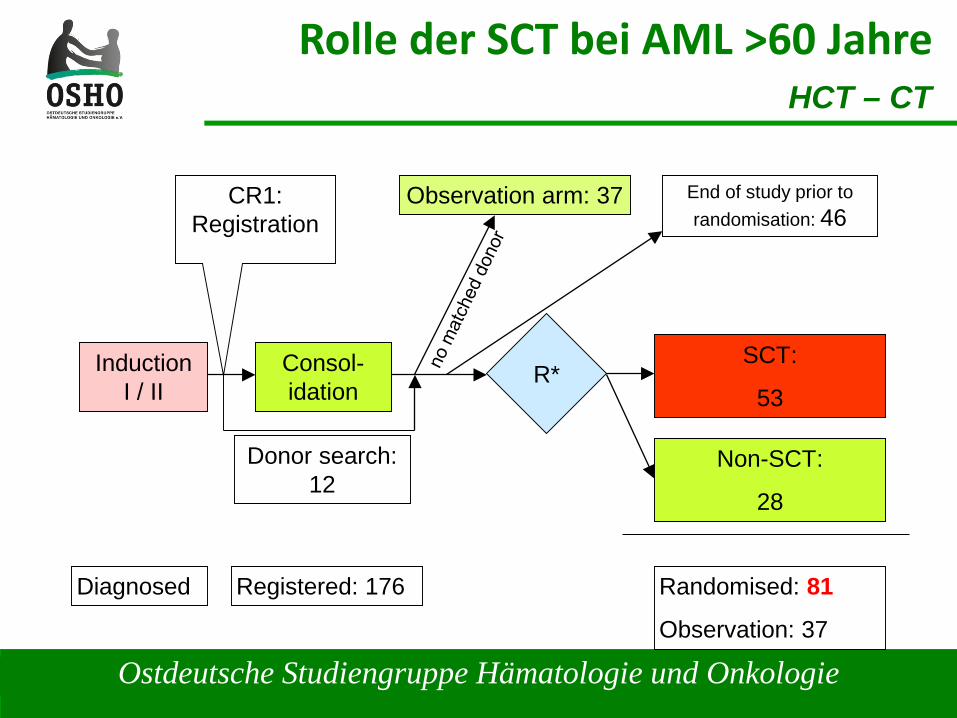
Rolle der SCT bei AML >60 Jahre
Ostdeutsche Studiengruppe Hämatologie und Onkologie
Rolle der SCT bei AML >60 JahreHCT – CT
Registered: 176
InductionI / II
Consol-idation
Observation arm: 37
Non-SCT:
28
SCT:
53R*
Donor search:12
Randomised: 81
Observation: 37
CR1:Registration
Diagnosed
End of study prior to randomisation: 46
Ostdeutsche Studiengruppe Hämatologie und Onkologie
Future of AML
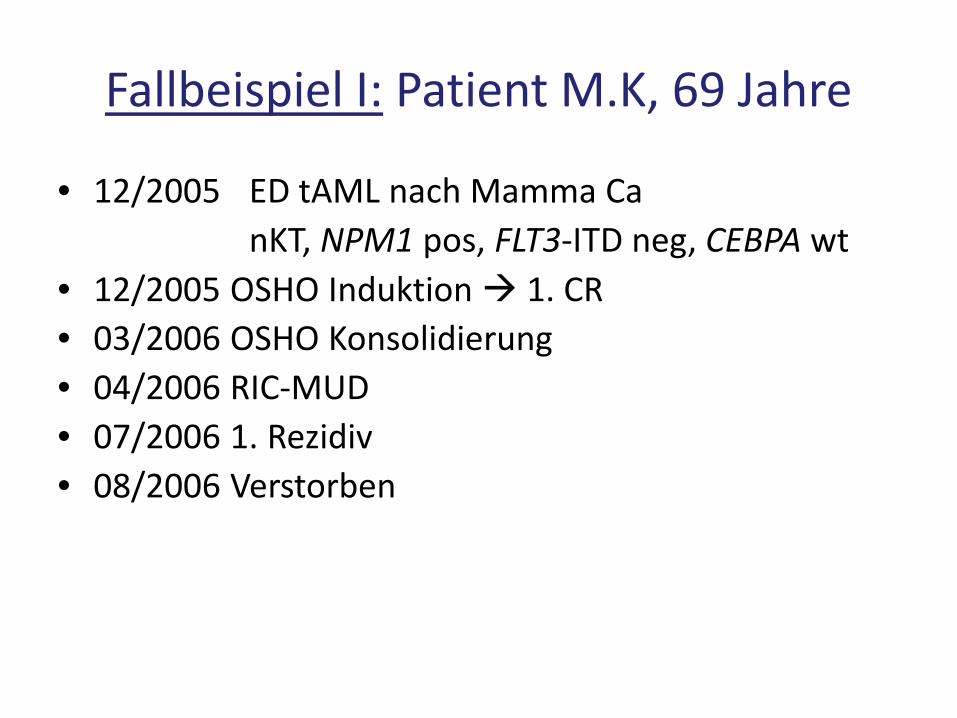
Fallbeispiel I: Patient M.K, 69 Jahre
• 12/2005 ED tAML nach Mamma CanKT, NPM1 pos, FLT3-ITD neg, CEBPA wt
• 12/2005 OSHO Induktion 1. CR• 03/2006 OSHO Konsolidierung• 04/2006 RIC-MUD • 07/2006 1. Rezidiv• 08/2006 Verstorben
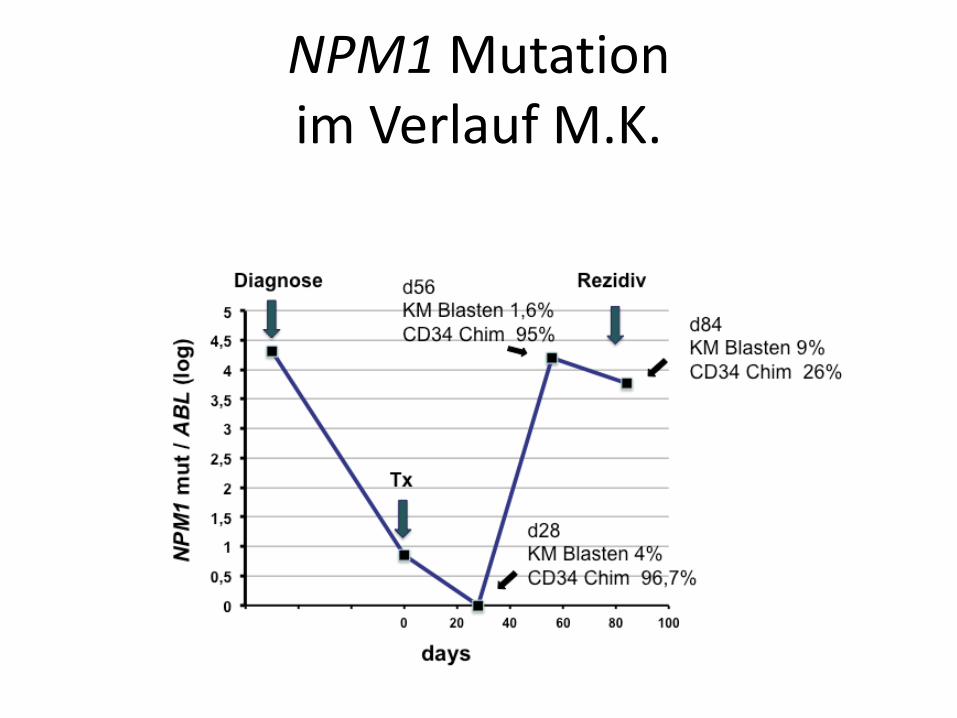
NPM1 Mutation im Verlauf M.K.
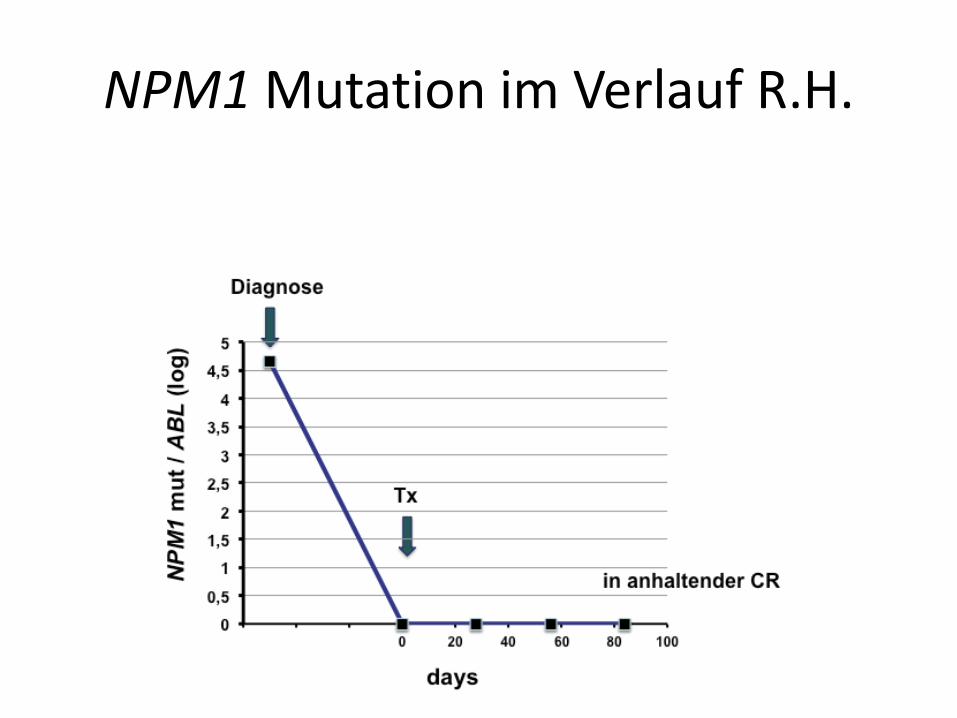
NPM1 Mutation im Verlauf R.H.
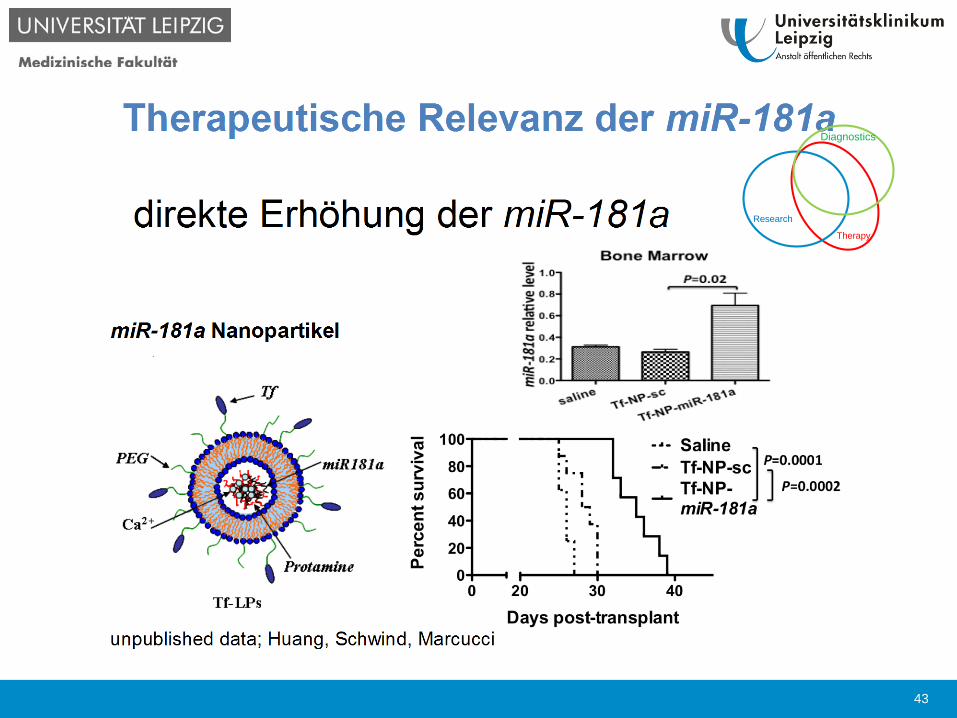
High Pri-miR-181a-1 and Pri-miR-181a-2 Expression Associates with Improved Outcomes in Patients with Acute Myeloid Leukemia Undergoing Allogeneic Stem
Cell Transplantation After Non-MyeloablativeConditioning
University of Leipzig; Dept. Hematology and Clinical Oncology
ASH Abstract #732 ASH Abstract Achievement Award
13. Hämatologisches Wintersymposium
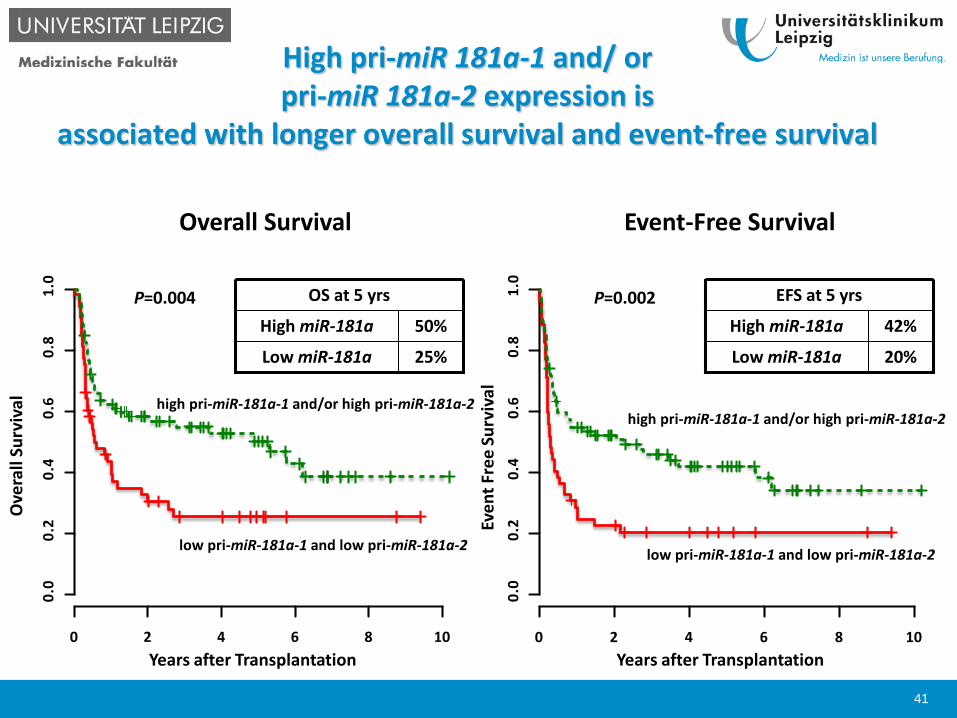
High pri-miR 181a-1 and/ orpri-miR 181a-2 expression is
associated with longer overall survival and event-free survival
Even
t Fre
e Su
rviv
al
Years after Transplantation
P=0.002
high pri-miR-181a-1 and/or high pri-miR-181a-2
low pri-miR-181a-1 and low pri-miR-181a-2
Years after Transplantation
Ove
rall
Surv
ival high pri-miR-181a-1 and/or high pri-miR-181a-2
low pri-miR-181a-1 and low pri-miR-181a-2
P=0.004
0 2 4 6 8 10
0.0
0 .2
0 .4
0 .6
0 .8
1 .0
0 2 4 6 8 10
0.0
0.2
0.4
0.6
0.8
1.0
25%Low miR-181a
50%High miR-181a
OS at 5 yrs
20%Low miR-181a
42%High miR-181a
EFS at 5 yrs
Overall Survival Event-Free Survival
41
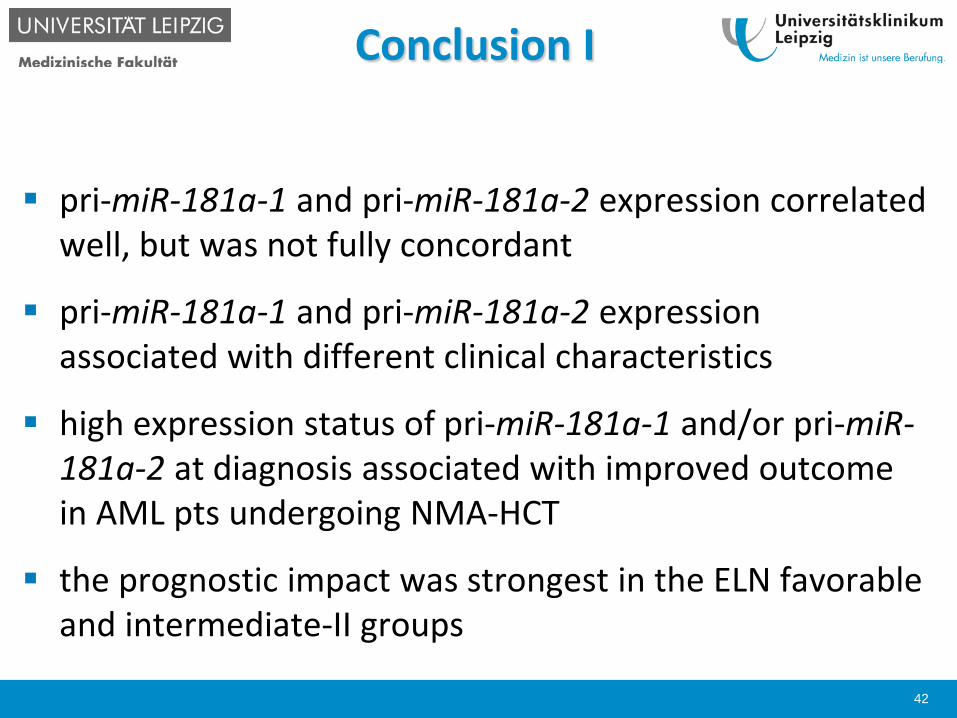
Conclusion I
pri-miR-181a-1 and pri-miR-181a-2 expression correlated well, but was not fully concordant
pri-miR-181a-1 and pri-miR-181a-2 expression associated with different clinical characteristics
high expression status of pri-miR-181a-1 and/or pri-miR-181a-2 at diagnosis associated with improved outcome in AML pts undergoing NMA-HCT
the prognostic impact was strongest in the ELN favorableand intermediate-II groups
42
Therapy
Research
Diagnostics
43
Thank you for your Attention
Acknowledgements:
Dietger Niederwieser
Guido Marcucci
Clara D. Bloomfield
M. JentzschM. BillK. SchubertL. SchmalbrockH. Weidner
L. KlossT. GaberL. BonifacioK. WildenbergerW. Pönisch
V. VucinicG-N. FrankeT. LangeM. CrossG. Behre
44
Ostdeutsche Studiengruppe Hämatologie und Onkologie
Rostock
Hamburg
Bremen
Hannover
Dortmund
Bonn
Mainz
Heidelberg
Stuttgart
Munchen
Nurnberg
Chemnitz
Dresden
Leipzig
Magdeburg
Berlin
Frankfurt
Potsdam
Erfrurt
Greifswald
Osterfeld
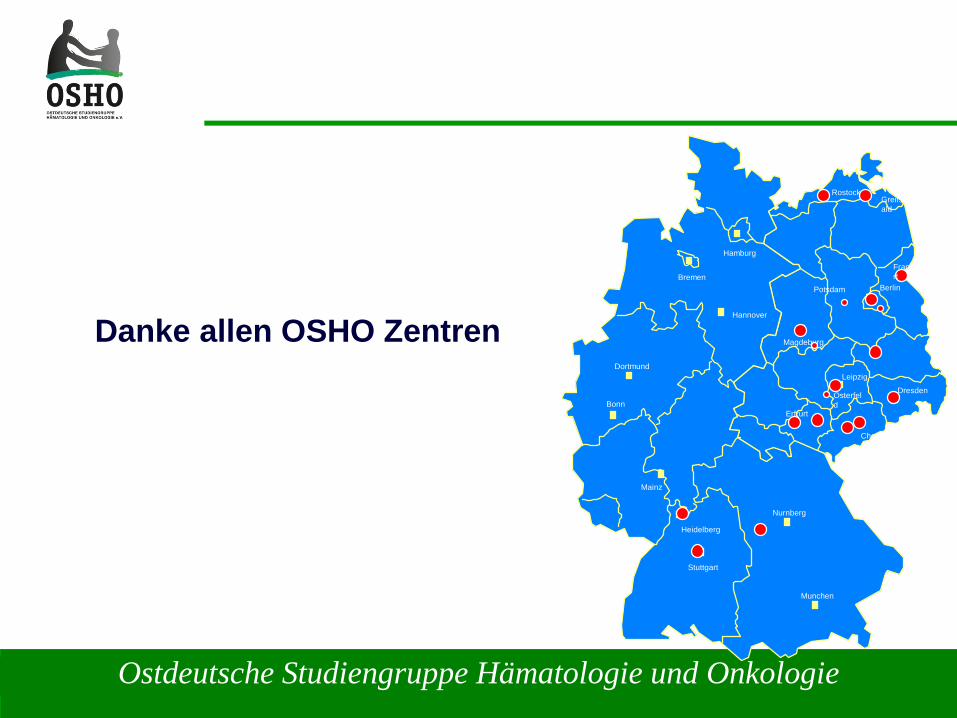
Danke allen OSHO Zentren
Ostdeutsche Studiengruppe Hämatologie und Onkologie
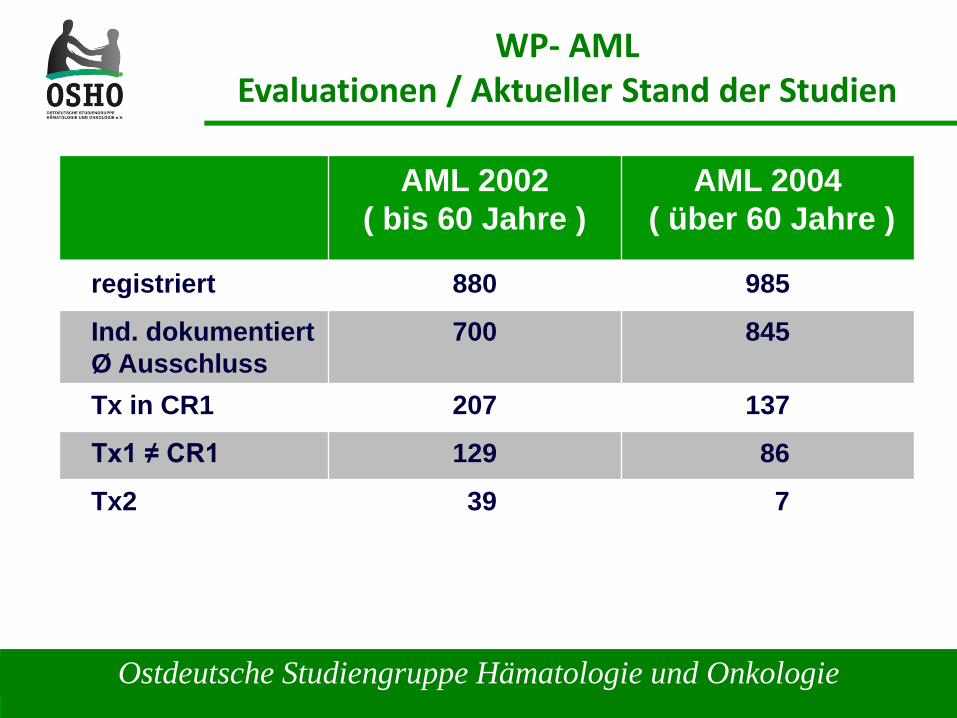
WP- AMLEvaluationen / Aktueller Stand der Studien
AML 2002( bis 60 Jahre )
AML 2004( über 60 Jahre )
registriert 880 985
Ind. dokumentiertØ Ausschluss
700 845
Tx in CR1 207 137
Tx1 ≠ CR1 129 86
Tx2 39 7
Ostdeutsche Studiengruppe Hämatologie und Onkologie
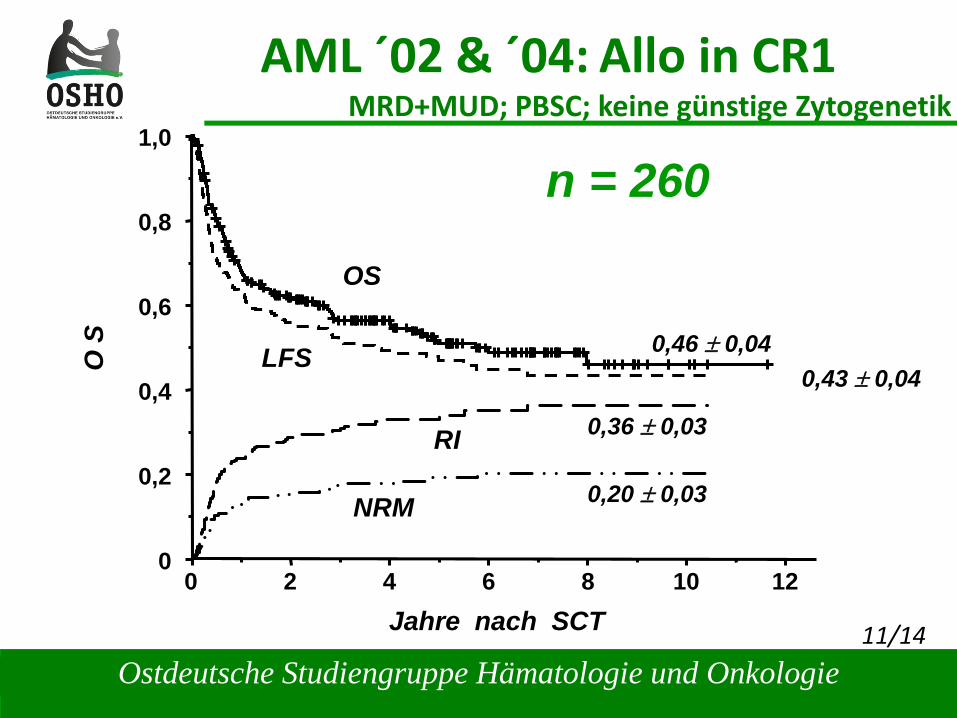
AML ´02 & ´04: Allo in CR1MRD+MUD; PBSC; keine günstige ZytogenetikO
S
Jahre nach SCT
1,0
0,8
0,6
0,4
0,2
00 2 4 6 8 10 12
11/14
0,46 ± 0,04
0,20 ± 0,03
0,36 ± 0,03
OS
LFS
NRM
RI
0,43 ± 0,04
n = 260
Ostdeutsche Studiengruppe Hämatologie und Onkologie
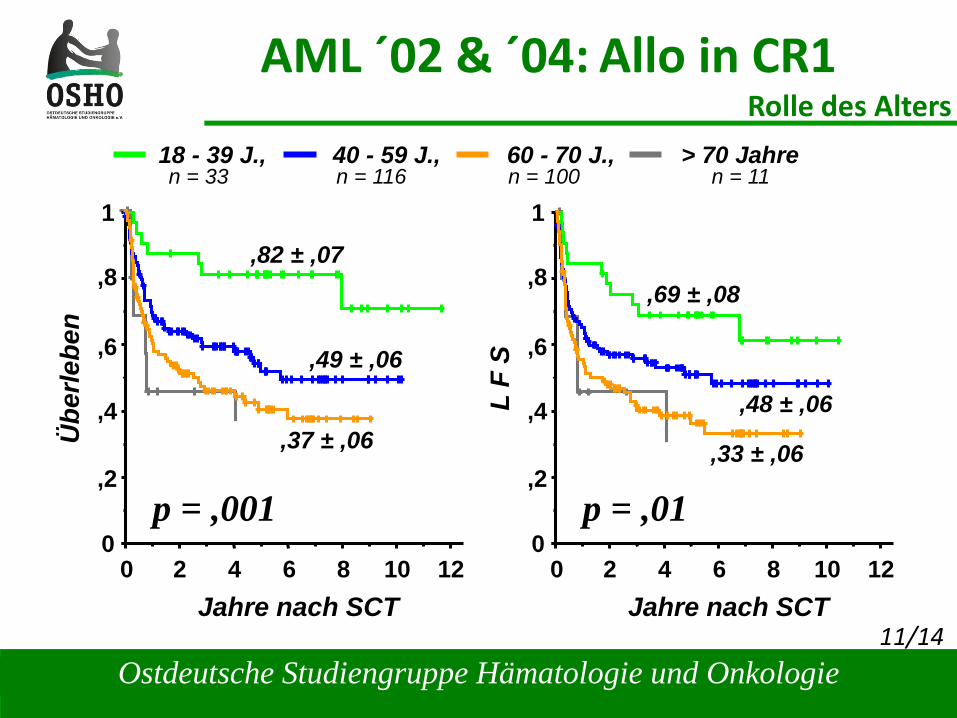
AML ´02 & ´04: Allo in CR1Rolle des Alters
,82 ± ,07
0
1
,8
,6
,4
,2
02 4 8 12
Jahre nach SCT
Übe
rlebe
n
6 10 0
1
,8
,6
,4
,2
02 4 8 12
Jahre nach SCT
L F
S
6 10
,49 ± ,06
,37 ± ,06
p = ,001
18 - 39 J., 40 - 59 J., 60 - 70 J., > 70 Jahre
11/14
,69 ± ,08
,48 ± ,06
,33 ± ,06
p = ,01
n = 33 n = 116 n = 100 n = 11
Ostdeutsche Studiengruppe Hämatologie und Onkologie
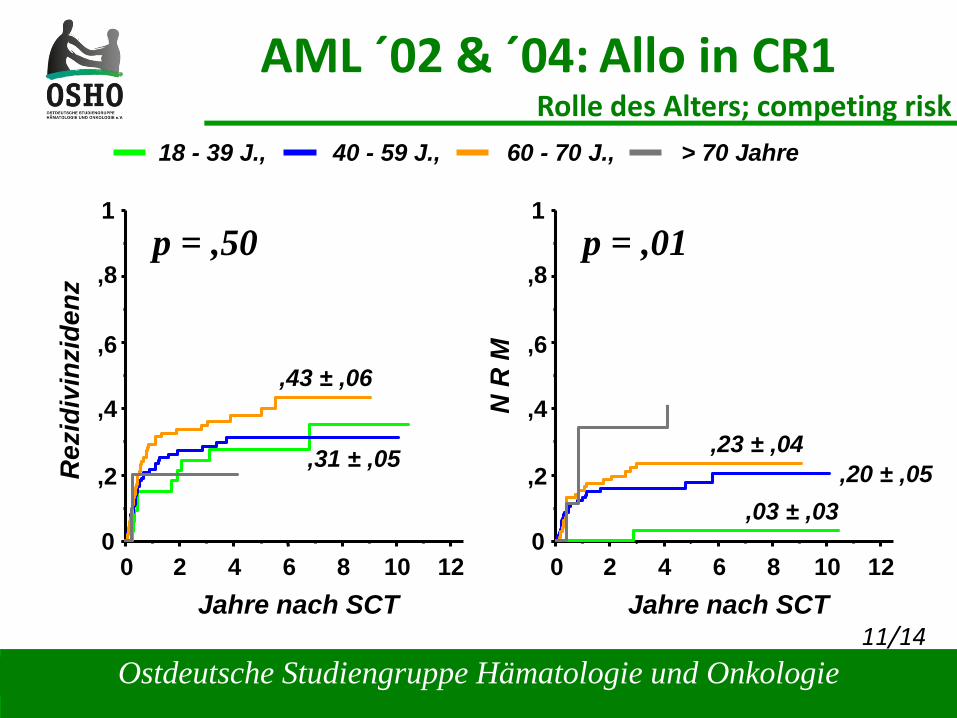
AML ´02 & ´04: Allo in CR1Rolle des Alters; competing risk
0
1
,8
,6
,4
,2
02 4 8 12
Jahre nach SCT
Rez
idiv
inzi
denz
6 10 0
1
,8
,6
,4
,2
02 4 8 12
Jahre nach SCT
N R
M
6 10
,43 ± ,06
,31 ± ,05
p = ,50
11/14
,03 ± ,03,20 ± ,05
,23 ± ,04
p = ,01
18 - 39 J., 40 - 59 J., 60 - 70 J., > 70 Jahre
Ostdeutsche Studiengruppe Hämatologie und Onkologie
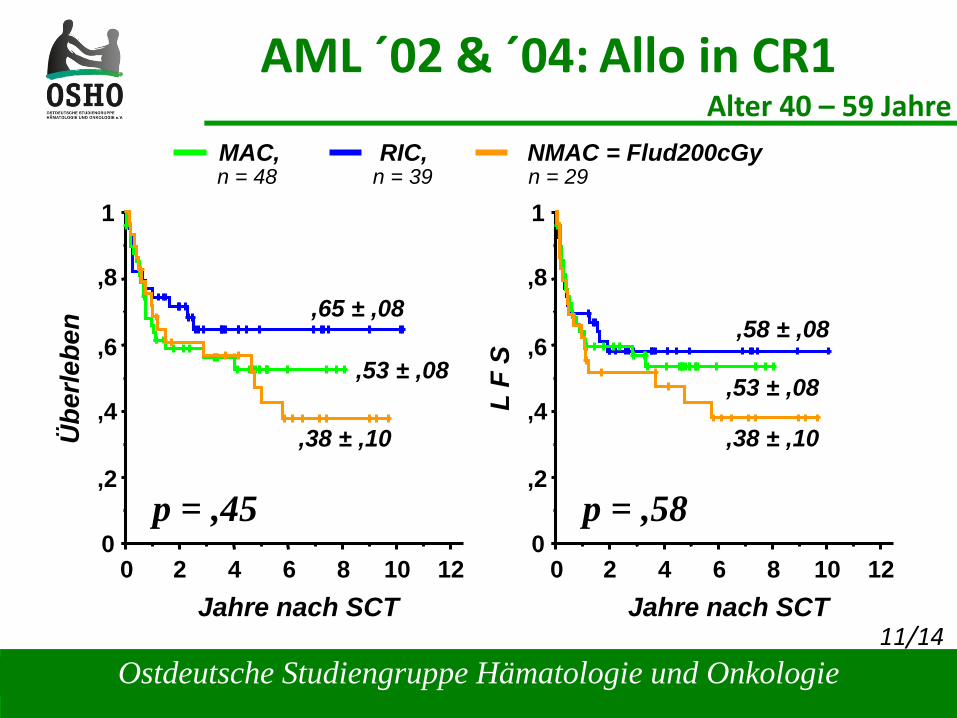
AML ´02 & ´04: Allo in CR1Alter 40 – 59 Jahre
11/14
,65 ± ,08
0
1
,8
,6
,4
,2
02 4 8 12
Jahre nach SCT
Übe
rlebe
n
6 10 0
1
,8
,6
,4
,2
02 4 8 12
Jahre nach SCT
L F
S
6 10
p = ,45
,58 ± ,08
p = ,58
,53 ± ,08
,38 ± ,10
,53 ± ,08
,38 ± ,10
MAC, RIC, NMAC = Flud200cGyn = 48 n = 39 n = 29
Ostdeutsche Studiengruppe Hämatologie und Onkologie
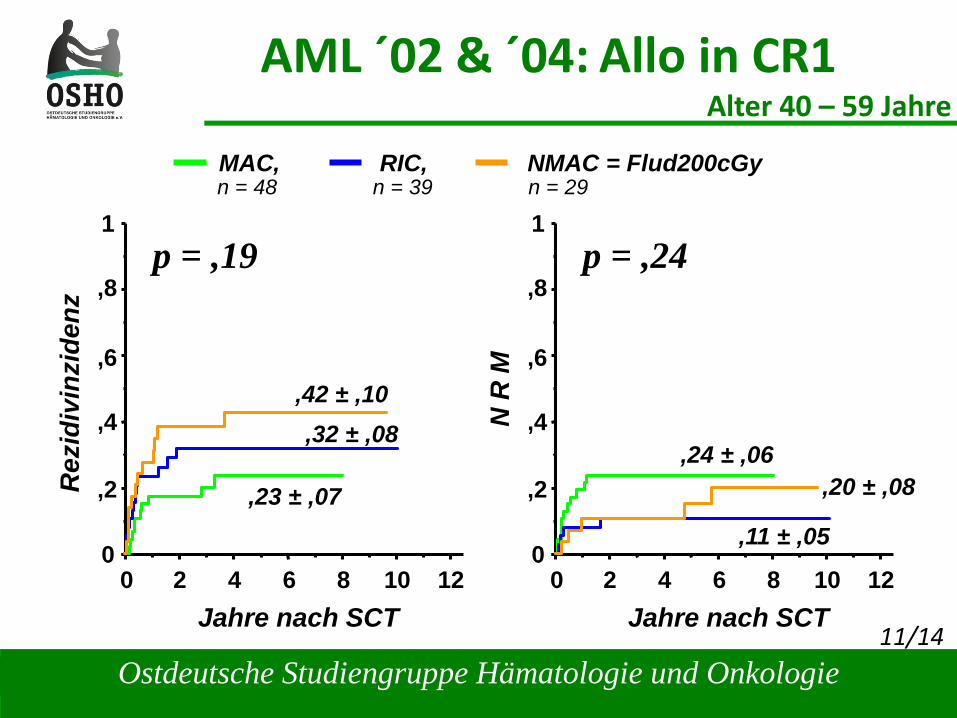
AML ´02 & ´04: Allo in CR1Alter 40 – 59 Jahre
11/14
0
1
,8
,6
,4
,2
02 4 8 12
Jahre nach SCT
Rez
idiv
inzi
denz
6 10 0
1
,8
,6
,4
,2
02 4 8 12
Jahre nach SCT
N R
M
6 10
,23 ± ,07
p = ,19
,24 ± ,06
p = ,24
,32 ± ,08,42 ± ,10
,20 ± ,08
,11 ± ,05
MAC, RIC, NMAC = Flud200cGyn = 48 n = 39 n = 29
Ostdeutsche Studiengruppe Hämatologie und Onkologie
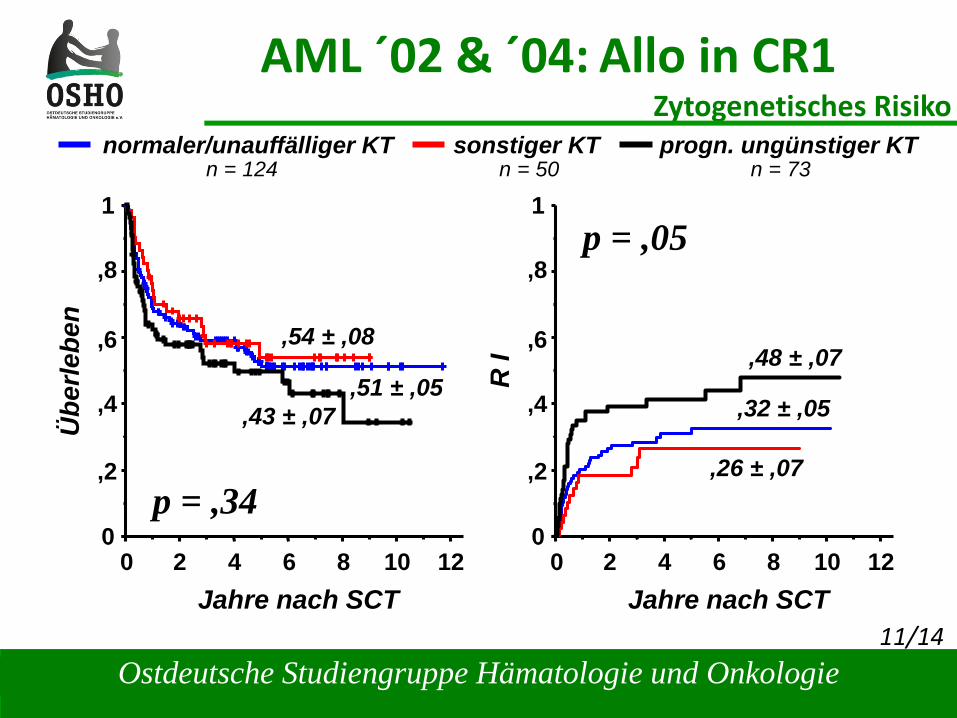
AML ´02 & ´04: Allo in CR1Zytogenetisches Risiko
11/14
0
1
,8
,6
,4
,2
02 4 8 12
Jahre nach SCT
Übe
rlebe
n
6 10 0
1
,8
,6
,4
,2
02 4 8 12
Jahre nach SCT
R I
6 10
p = ,05
,48 ± ,07
,26 ± ,07
,43 ± ,07
p = ,34
,51 ± ,05
normaler/unauffälliger KT sonstiger KT progn. ungünstiger KT
,54 ± ,08
,32 ± ,05
n = 124 n = 50 n = 73