Embed Size (px)
Citation preview
8/22/2019 barakat_moataz.pdf
http://slidepdf.com/reader/full/barakatmoatazpdf 1/158
Modern Geophysical Techniques for Constructing a 3D
Geological Model on the Nile Delta, Egypt
Vorgelegt von
M.Sc. Applied Geophysics
Moataz Khairy Ahmad Barakat
aus Ägypten
an der Fakultät VIPlanen Bauen Umwelt
der Technischen Universität Berlin
Dissertation
zur Erlangung des akademischen Grades
"Doktor der Naturwissenschaften"
(Dr. rer. nat.)
genehmigte Dissertation
Promotionsausschuss:Vorsitzender: Prof. Dr. J. Tiedemann
Berichter : Prof. Dr. W. Dominik
Berichter : Prof. Dr. C. Heubeck
Berichter : Prof. Dr. N. El Gendy
Tag der wissenschaftlichen Aussprache: 14.Oktober 2010
Berlin 2010
D 83
8/22/2019 barakat_moataz.pdf
http://slidepdf.com/reader/full/barakatmoatazpdf 2/158
ZUSAMMENFASSUNG
Zusammenfassung
Das Nil-Delta kann als das älteste bekannte Delta der Welt betrachtet werden. Es wurde
bereits von Herodot im fünften Jahrhundert AD beschrieben. Nil-Delta („Ta-Mehet“) kann
aus der alt-ägyptischen Sprache als „Land in der Mündung des Flusses“ übersetzt werden.
Das Delta gehört zu den Gebieten der Welt, in denen am frühesten intensive Landwirtschaft betrieben wurde. Das Nil-Delta kann als „bogenförmiger Delta-Typ“ beschrieben werden und
ähnelt in der Aufsicht einem Dreieck oder besser einer Lotusblüte. Der Name leitet sich aus
dem Buchstaben Thelta des altgriechischen Alphabets ab.
Das rezente Nil-Delta umfasst auf dem Festland eine Fläche von ca. 30 000 km2 und eine
etwa ebenso große Fläche im Schelfbereich des Mittelmeeres bis zur 200 m-Tiefenlinie. Die
südliche Spitze des Deltas liegt ca. 30 km nördlich von Kairo, wo sich der Nil in den
westlichen Rosetta-Arm und einen östlichen Damietta-Arm verzweigt. Die Breite des Deltas
beträgt etwa 240 Km entlang der Küste; die Nord-Süd Erstreckung erreicht maximal eine
Länge von169 Km. Ägypten wäre ohne das Niltal und das Nil-Delta weitgehen ein
Wüstengebiet.
Im Vergleich mit den Mississippi-, Rhone-, Niger- und Ganges-Deltas sind bisher nur relativ
wenige Studien über die geologische Entwicklung des Nil-Deltas veröffentlicht worden.
Die Untersuchung der älteren Gesteine des Nil-Deltas gestaltet sich besonders schwierig, da
diese sämtlich durch rezente Schlamm- und sonstige Alluvial-Ablagerungen überdeckt
werden. Auf geologischen Karten erscheint das Delta daher zumeist als „weißer Fleck“ und
wird als „Quartär“ beschrieben. Das Becken innerhalb des Nil-Deltas beinhaltet aber sehr
mächtige Sedimentabfolgen aus der Zeit zwischen dem Oligozän und dem Plio-Pleistozän bis
hin zur Gegenwart.
Wegen seiner zentralen Position zwischen dem Riftsystem des Roten Meeres und der Sub-
duktionszone zwischen der nordöstlichen afrikanischen Platte und den kretischen und
cyprischen Inselbögen nimmt das Nil-Delta eine zentrale Position während der
plattentektonischen Entwicklung des östlichen mediterranen Raumes ein.
Während des Oligozäns bis hin zum Plio-/Pleistozän kamen dabei in strukturell
unterschiedlichen Gebieten Sedimente verschiedener Milieus zur Ablagerung. Hierbei werden
die Faziesverteilung und die Sequenzstratigraphie mit Hilfe auf seismischer Stratigraphie
beruhender 2-D Seismik (inkl. sythetischer Seismogramme) sowie der Einbindung von
Bohrungs-Daten (Logs) ermittelt. Synthetische Seismogramme wurden durch dieVerwendung von Schall- und Dichte-logs konstruiert. Eine Kombination der strukturellen
Interpretation und der Sequenzstratigraphie ermöglichte die Rekonstruktion der
Entwicklungsgeschichte des Beckens. Insgesamt sieben chronostratigraphische Grenzen
wurden ermittelt und über seismische und Bohrungs-Daten korreliert. Diverse auf den
seismischen Linien zu verzeichnende Diskordanzen resultieren aus Winkeldiskordanzen bis
hin zu Sedimentationsunterbrechungen.
Das Nil-Delta unterlag in den letzten Jahren rigorosen und erfolgreichen
Explorationskampagnen. Heutzutage kann das Delta als eine aufsteigende Großprovinz der
Gaslagerstätten im mittleren Osten angesehen werden, bei der sich die nachgewiesenen
Lagerstätten innerhalb dieser Zeit mehr als verdoppelt haben. Dies kann direkt darauf zurückgeführt werden, das die neuen Explorationsverfahren hier – zusätzlich zu den
-I-
8/22/2019 barakat_moataz.pdf
http://slidepdf.com/reader/full/barakatmoatazpdf 3/158
ZUSAMMENFASSUNG
-II-
klassischen Verfahren der geologischen und geophysikalischen Modellierung – unmittelbar
zur Anwendung kamen und zur Entdeckung bisher unbekannter Lagerstätten führten.
Des Weiteren wurden Zeit/Struktur-Karten, Geschwindigkeits-Karten und Isopachen-Karten
aus den vorliegenden seismischen Linien und Log-Daten erstellt. Verschiedene
strukturelle/tektonische Elemente wurden identifiziert: Normale Störungen, Wachstums-Störungen, „listrische Störungen“, sekundäre antithetische Störungen und große Störungs-
bedingte rotierte Blöcke, die zumeist im Miozän, Verschiedene strukturelle/tektonische Elemente
wurden identifiziert, die zumeist während Hiaten im Miozän (mittleres Miozän: ~ 10 my, Tortonium
und Ende des Miozäns: ~ 5 my, Messinium) entstanden. Sedimentstrukturen in Form von
Paläokanälen wurden identifiziert.
Typische sequenz-stratigrphische Strukturen wie „incised valleys“, „clinoforms“, „topsets und
„onlaps“, die eine gute Beurteilung der sequenz-stratigraphischen Geschichte besonders des
Miozäns bis Pliozäns des Niltals erlauben, konnten ebenfalls identifiziert und in ihrer
Verbreitung innerhalb der klastischen Sedimentabfolge verfolgt werden. Das Gebiet des Nil-
Deltas wird in drei Hauptregionen für die Kohlenwasserstoffexploration unterteilt: a) der südliche Delta-Block, b) das nördliche Delta-Becken and c) der tiefe offshore-Bereich.
Durch die Einführung effektiver Computerarbeitsmöglichkeiten wurde die Einführung
interaktiver 3D-Modellierungen zum Allgemeingut. Der Vorteil der 3D-Modellierungen liegt
eindeutig in der Möglichkeit innerhalb eines Strukturmodells geologische Schnitte in jeder
Richtung und durch jede Bohrung zu erzeugen und deren Auswertung zu ermöglichen.
8/22/2019 barakat_moataz.pdf
http://slidepdf.com/reader/full/barakatmoatazpdf 4/158
ABSTRACT
ABSTRACT
The Nile Delta can be considered the earliest known delta in the world. It was described by
Herodotus in the 5th Century AC. The Nile Delta (Ta-Mehet) in Hieroglyphic language means
the land of the estuary water. It is one of the oldest intensely cultivated areas on the earth. The
Nile Delta is illustrated to be an arcuate delta (arcshaped), as it resembles a triangle or lotus
flower when seen from above. The name has been derived from the letter Thelta of the Greek
alphabet. In comparison to the Mississippi, the Rhone, the Niger and the Ganges Deltas very
little work has been published on the geological evolution of the Nile Delta.
The present Nile Delta covers an onshore area of about 30,000 km2 and about an equal size
offshore to the 200 m isobath. The southern apex of the delta is located approximately 30 km
north of Cairo where the Nile River splits into the western Rosetta branch and the eastern
Damietta branch. The delta reaches some 240 km along the Mediterranean coastline and
extends to a maximum of 160 km from north to south. Without the Nile Valley and Delta,
Egypt is mainly a desert country.
It is difficult to investigate the ancient rocks of the Nile Delta, since no outcrops could be
found as these are mainly covered by recent mud and alluvial deposits. On many maps the
Nile Delta area is mostly represented a blank space described as Quaternary. The Nile Delta
basin contains thick sedimentary sequences deposited mainly between Oligocene and
Pliocene/Pleistocene extending to recent times.
The Nile Delta plays a major role in the plate tectonic development of the eastern
Mediterranean and north eastern Africa in a central position between the Red Sea rift and the
subduction zone of the north-eastern Africa plate adjacent to the Cretan and Cyprus arcs.
Structural styles and depositional environments varied during the Oligocene and Pliocene/Pleistocene. Facies architecture and sequence stratigraphy of the Nile Delta are resolved using
seismic stratigraphy based on 2D seismic lines including synthetic seismograms and tying in
well log data. Synthetic seismograms were constructed using sonic and density logs. The
combination of structural interpretation and sequence stratigraphy of the development of the
basin was resolved. Seven chrono-stratigraphic boundaries have been identified and correlated
on seismic and well log data. Several unconformities identified on seismic lines vary from
angular unconformity to disconformity type.
The Delta has experienced a rigorous and successful exploration campaign during the last few
years. Nowadays, the Nile Delta is an emerging giant gas province in the Middle East with
proven gas reserves which have more than doubled in size in the last years. This could beattributed to the fact that such province started to disclose part of its hidden hydrocarbon
reserves as a direct result of using state of the art exploration techniques, in addition to the
expanding use of different types of geological and geophysical modeling.
Moreover, time structure maps, velocity maps, depth structure maps and isopach maps were
constructed using seismic lines and log data. Several structural features include: normal faults,
growth faults, listric faults, secondary antithetic faults and large rotated fault blocks mainly of
Miocene age. In the Middle Miocene hiatus lasted about 10 my in the south-west delta, while
the Late Miocene (Messinian) hiatus lasted only about 5 my in the same area. Also,
sedimentary features such as paleo-channels were distinctively recognized.
Typical sequence stratigraphic features such as incised valley, clinoforms, topsets, offlaps and
onlaps are identified and traced on the seismic lines allowing insight into the sequence
-III-

8/22/2019 barakat_moataz.pdf
http://slidepdf.com/reader/full/barakatmoatazpdf 5/158
ABSTRACT
-IV-
stratigraphic history of the Nile Delta most especially in the Miocene to Pliocene clastic
sedimentary succession.The Nile Delta region is distinguished into three geological provinces
for hydrocarbon exploration: a) the South Delta Block, b) the North Delta Basin and c) the
deep offshore.
With the advent of powerful computer workstations, the ability to perform interactive 3Dmodelling has become commonplace. The advantage of 3D modelling lies in its capability to
allow viewing and evaluating a structure model by displaying cross section along any
direction and through any well location of the model’s data base.
8/22/2019 barakat_moataz.pdf
http://slidepdf.com/reader/full/barakatmoatazpdf 6/158
ACKNOWLEDGEMENTS
ACKNOWLEDGEMENTS
First and above all, I would like to express my great thanks to ''ALLA'' who supplied me
with strength and patience to complete this work. ''Thanks GOD''.
I would like to express my sincere gratitude and express my great appreciation to my
academic supervisor Prof. Dr. Wilhelm Dominik, Head of the Institute of Exploration
Geology, Technical University, Berlin, Germany for proposing the present research topic,
helpful advice and permanent support. He gave me a lot of his precious time during his
supervision. His door was always open to me, even when he had piles of work. We worked
together with ease and enjoyment. This work would have never been successfully undertaken
without the unreserved support of Prof. Dr. W. Dominik.
A special word of gratitude is due to Dr. Peter Luger for his constant encouragement and
fruitful and interesting discussions throughout this work. He has critically read this thesis andhis valuable comments; corrections and suggestions are gratefully appreciated.
Really, I received enormous assistance from Ms. Schröder for which I am very grateful.
During my graphic works and overall computer related difficulties, I received considerable
help from Mr. Thiel.
I would like to express my deep and sincere appreciation to all my colleagues of the
Exploration Geology Department; especially, Dr. Bankole for his continuous discussions
during my work.
My appreciation is extended to Dr. M. Temraz Egyptian Petroleum Research Institute (EPRI)and Dr. F. Ahmed South Valley University (SVU) for their help and support during the work.
Also, I would like to take this opportunity to express my grateful thanks to the Egyptian
Government for providing me with financial support, to my colleagues and members of the
Geology Department, Faculty of Science, Tanta University, Egypt for their continuous
encouragement.
Gratitude is wished to extend the appreciation to (EGPC), for their approval and permission to
use the material of study. Special thanks are due to Dr. R. Guedemann and Mr. Ali Gadalla
RWE Dea Company, for their valuable advices and their effort to provide me with the
available data to complete this thesis.
Last but not least, I wish to crown my sincere thanks and deepest gratitude to ''My Parents''
for their continuous encouragement and support during this work, but no words of thanks and
feelings are sufficient. Special thanks to my brothers Dr. Yasser and Mr. Hany and Sincere
thanks to my sister Mrs. Amany. I am grateful to my father Eng. Khairy Barakat, who taught
me to cherish excellence. I express explicitly my appreciation to a special person, who
supported me and light up my life my mother Mrs. Nadia Adawy, who alternatively
threatened me with dire consequences to make me complete this research, heartily feelings
and continuous prayers.
-V-
8/22/2019 barakat_moataz.pdf
http://slidepdf.com/reader/full/barakatmoatazpdf 7/158
CONTENTS
CONTENTS
ZUSAMMENFASSUNG...................................................................................................
ABSTRACT........................................................................................................................
ACKNOWLEDGEMENT.................................................................................................
TABLE OF CONTENTS...................................................................................................LIST OF FIGURES...........................................................................................................
LIST OF TABLES.............................................................................................................
CHAPTER ONE …………………………………………………………...…..………..
INTRODUCTION..............................................................................................................
1.1. General...................................................................................................................................................... 1.2. Goals of the Present Study………………………………...…..………………………………………...1.3. Material and Methods………………………………………………………………………….………...
CHAPTER TWO …………………………………………………………….………….
REGIONAL GEOLOGY AND HYDROCARBON PROVINCES IN EGYPT……...
2.1. General……………………………………………..................................................................................2.2. General Geological Setting of Egypt ………………………………… ……………………………...2.2.1. The Mediterranean Fault Zone ………………………………………. ……………………………..2.2.2. Linear Uplifts and Half-Grabens ………………………………….. ……………………………...2.2.3. The North Sinai fold belt ……………………………………………………………………………..2.2.4. The Suez and Red Seagraben…………………………………………………..……………………...2.2.5. Cratonic Egypt…………………………………………………………………………………………
2.3. Tectonic Framework………………………………………………………………..................................2.4. Stratigraphic Chart of Egypt …………………………………………………………………………….2.4.1 Paleozoic ………………………………………………………………………..……………………...2.4.2 Mesozoic …………………………………………..…………………………………………………...Triassic ………………………………………………………………………………………………………Jurassic ………….……………………………………………………………………...................................
Cretaceous …………………………………………………………………………………………………...2.4.3 Cenozoic …………………………………………………………………………….…………………
Paleogene……………………………………………………………………………………….....................Paleocene …………………………………………………………………………………………………….Eocene ………………………………………………………………………………...……………………..Oligocene ………………………………………………………………………………………………......... Neogene………………………………………………………………………………………………………Miocene………………………………………………………………………………..……………………..
Early Miocene………………………………………………………………………………………………..Middle Miocene………………………………………………………………………………………………Late Miocene ………………………………………………………………………………………………...Pliocene……………………………………………………………………………………………................Quaternary………………………………………………………………………………................................
2.5. Hydrocarbon Exploration………………………………………………………………………………..2.5.1. General…………………………………………………………………………………………….......2.5.2. Hydrocarbon Provinces………………………………………………………………………………..Gulf of Suez………………………………………………………………………………………………….General overview………………………………………………………………………………….………….Gulf of Suez rifting…………………………………………………………………………………………...Lithostratigraphy…………………………………………………………………………………..................Petroleum system……………………………………………………………………….................................Source rocks…………………………………………………………………………………….....................
Geothermal gradients…………………………………………………………………………………………Reservoir rocks…………………………………………………………………………………….................Seals…………………………………………………………………………………………………………..Traps………………………………………………………………………………………………………….
Western Desert……………………………………………………………………………………………….General overview…………………………………………………………………………..…………………
Lithostratigraphy and petroleum geology……………………………………………………………………
I
III
V
VIX
XIII
1
1
1
23
4
4
44778
888999
1111
11111112
1212
121213131313
141414161616
1718
18181919
1919
212121
-VI-
8/22/2019 barakat_moataz.pdf
http://slidepdf.com/reader/full/barakatmoatazpdf 8/158
CONTENTS
Petroleum system…………………………………………………………………………………………….Source rocks ………………………………………………………………………………………................Geothermal gradients………………………………………………………………………….......................Reservoirs rocks……………………………………………………………………………...........................Carbonate reservoirs…………………………………………………………….............................................Sandstone reservoirs……………………………………………………………………………….. ………..
Seals…………………………………………………………………..………………………………………Traps…………………………………………………………………………………………..……………...Oil and gas types……………………………………………………………………………………………..
CHAPTER THREE ………………………………………………………………..........
GEOLOGY OF THE NILE DELTA …………………………………………………..
3.1. General view …………………………………………………………………………………………….3.2. Shape of the Deltas………………………………………………………………………………………3.2.1. Delta Environments……………………………………………………………………………………Delta plain…………………………………..……………………………......................................................
Delta front…………………………...………………………………………………......................................Prodelta……………………...………………………………………………………………………………..3.3. River Nile…………………………………………………………………………….………………….
3.4. The Modern delta………………………………………………………………………………………..3.5. Stratigraphic Column of the Nile Delta………………………………………………….........................3.5.1. Basement Rocks……………………………………………………………………………………….
3.5.2. Paleozoic Period……………………………………………………………………..………………..3.5.3. Mesozoic Period……………………………………………………………………………………….
Triassic ……………………………………………………………………………………………………… Jurassic ……………………………………………………………………………..…………………...…...Cretaceous …………………………………………………………………………………………………...3.5.4. Cenozoic ………………………………………………………………………………………………
Paleogene…………………………………………………………………………………………………….. Neogene…………………………………………………………………..…………………………………..
Miocene……………………………………………………………………..………………………………..Miocene Unconformities……………………………………………………………………………………..
Early Miocene…………………………………………………………………….………………………….Middle Miocene …………………………………………………………………….……………………….Late Miocene ………………………………………………………………………………………………...Pliocene………………………………………………………………………………………………………
Quaternary …………………………………………………………………………………………………...3.6. Subsurface Well Correlation………………………………………………….........................................3.7. Structural Frameworks of Nile Delta…………………………………………………..……………......3.8. Tectonic Framework History…………………………………………………………………………….3.9. Geologic History…………………………………………………………………...................................3.10. Petroleum System………………………………………………………………….…………………...
3.10.1. Source rocks……………………………………………………………………………………….....3.10.2. Reservoir rocks…………………………………………………………………………………….....
3.10.3. Cap rocks……………………………………………………………………..………………………3.10.4. Traps…………………………………………………………………………….................................3.10.5. Maturation……………………………………………………………………………………………3.10.6. Petroleum Occurrence………………………………………………………………………………..
3.11. History of Exploration Activities in the Nile Delta……………………………………………...……..3.11.1 First exploration phase (1963 - 1972)…...............................................................................................
3.11.2 Second exploration phase (1973 -1980)…............................................................................................3.11.3 Third exploration phase (1980 -1986)…………………………..……………………………… ……3.11.4 Fourth exploration phase (1987-1994)………………………………………….…....................…….3.11.5. Fifth exploration phase (1994-present) ………………………………………………………...........
CHAPTER FOUR………………………………………………………………………..
SEISMIC INVESTIGATION…………………………………………………………...
4.1. General………………………………………………………………………………..…………………4.2. History of Seismic Activities in the Nile Delta…………………………………………..…………...…4.3. Data Base in the Nile Delta and methodology……………………………………………………..…....4.3.1. Data base………………………………………………………………................................................
212121222224
242425
26
26
26272929
303030
333535
3536
36363637
3738
4040
40424448
495053555759
5959
60606161
6162
62636363
66
66
66666767
-VII-
8/22/2019 barakat_moataz.pdf
http://slidepdf.com/reader/full/barakatmoatazpdf 9/158
CONTENTS
4.3.2. Techniques and methodology…………………………………………………………........................4.4. Quality of the Seismic Data……………………………………………………………….......................4.4.1. Non-continuity of horizons…………………………………………………………………………….4.4.2. Cut-off feature………………………………………………………………………………………....4.4.3. Thick shale masses ………………………………………………………………….………………...4.5. Velocity Analysis…………………………………………………………….………………………….
4.5.1. Interval velocity (Vi) …………………………………………………………………………………..4.5.2. Average velocity (Vav) ……………………………………………………………..………………….
4.5.3. Well velocity survey………………………………………………………………….………………..Check shot survey……………………………………………………………………….……………………Synthetic Seismogram………………………………………………………………………………………..
CHAPTER FIVE ………………………………………………………………………...
SEISMIC INTERPRETATION ………………………………………………………..
5.1. Introduction……………………………………………………………………………………………...5.2. Identification of Seismic Boundaries……………………………………………………………………
5.2.1. Late Pliocene………………………………………………………………..…………………………5.2.2. Middle Pliocene……………………………………………………………………………………….
5.2.3. Late Miocene……………………………………………………………………………………….....
5.2.4. Middle Miocene………………………………………………………………………………………5.2.5. Oligocene………………………………………………………………………………………………5.2.6. Cretaceous to Eocene………………………………………………………………………………….
5.2.7. Jurassic………………….…………………………………………………………………..…………5.3. Structural Features and Their Causes in the Nile Delta…………………..……………….…………….
5.3.1. Gravity Transport Structures…………………………………………………………………………..Slumps ………………………..…………………………………………………………..………………….Debris flow………………..………………………………………………………………………………….5.3.2. Syn-depositional Structures………………………………………………………...………………….
Normal faults ………………………………………………………………………………………………...Growth (Listric) Faults ………………………………………………………………………..…………….
Fault blocks…………………………………………………………………………………………………..Channels……………………………………………………………………………………….……………..
Rollover structures……………………………………………………………………………..…………….Antithetic faults………………………………………………………………………………………………5.4 Seismic Stratigraphy…………………………………………………………………………………….5.5. The Interpretation Technique……………………………………………………………..…………….5.5.1. Seismic reflection terminations of stratigraphic features……………………..……………………….5.5.2. Internal reflection configuration……………………………………………………………………….Lapout…………………………………………………………………………………….…………………..
Baselap……………………………………………………………………………………………………….Downlap……………………………………………………………………………………………………...Onlap…………………………………………………………………………………………………………Toplap ……………………………………………………………………………………………………….Erosional truncation………………………………………………………………………………………….Parallel-subparallel facies……………………………………………………………………..……………..
Chaotic seismic facies……………………………………………………………………………………….Hummocky Reflection Configuration………………………………………………………………………..
Reflection free areas or transparent ………………………………………………………………………….Clinoforms or foresets………………………………………………………………………………………..Oblique clinoforms seismic facies……………………………………………………………………………Sigmoid clinoforms seismic facies…………………………………………………………………………..5.6. Basin-Margin Concepts………………………………………………………………………………….5.7. Description of Some Seismic Profiles…………………………………………………………..……….
5.7.1. North-south direction………………………………………………………………………………….5.7.2. East-west direction…………………………………………………………………………………….
CHAPTER SIX…………………………………………………………….......................
3D SEISMIC MODELING………………………………………………….………….. 6.1. Introduction……………………………………………………………………………………………...6.2. Modelling Processes…………………………………………………………………….……………….6.2.1. Data import…………………………………………………………………………………………….
697070707070
7171717173
76
76
7676
7878
78
787979
7979
80808082
8282
8484
84858688
8888
88888888
8989
89919191
9394
9496969699
101
101101101101
-VIII-
8/22/2019 barakat_moataz.pdf
http://slidepdf.com/reader/full/barakatmoatazpdf 10/158
CONTENTS
-IX-
6.2.2. Stratigraphic stage……………………………………………………………………………………..Well tops spreadsheet………………………………………………………………………………………..Well correlation………………………………………………………………………………………………Synthetic seismogram…………………………………………………………………….………………….6.2.3. Seismic interpretation……………………………………………………………………………….....Interpret grid horizons………………………………………………………………………………………..
Structure interpretation……………………………………………………………………………………….6.2.4. Structural modelling …………………………………………………………………….…………….Fault modelling………………………………………………………………………………..……………..Pillar gridding………………………………………………………………………………………………..Make horizons ……………………………………………………………………………………………….Depth convert 3D grid ……………………………………………………………………………………….Velocity model……………………………………………………………………………………………….6.3. Seismic Maps…………………………………………………………………………………………….
6.4. Thickness Measurements and Thickness Maps…………………………………………….…………..6.4.1. Isochron map…………………………………………………………………………………………..6.4.2. Isopach map……………………………………………………………………………………………6.4.3. Fence diagram…………………………………………………………………………………………6.5. 3D Structural Model……………………………………………………………………………………..
6.6. Cross Sections…………………………………………………………..……………………………….
CHAPTER SEVEN………………………………………………………………………
SUMMARY AND CONCLUSIONS …………………………………………………...
REFERENCES…………………………………………………………………………...
APPENDICES....................................................................................................................
102102
102102102102
103104
104104105106107107
115115115122122
122
126
126
128
136
8/22/2019 barakat_moataz.pdf
http://slidepdf.com/reader/full/barakatmoatazpdf 11/158
LIST OF FIGURES
LIST OF FIGURES
CHAPTER ONE………………………………………………………………………......
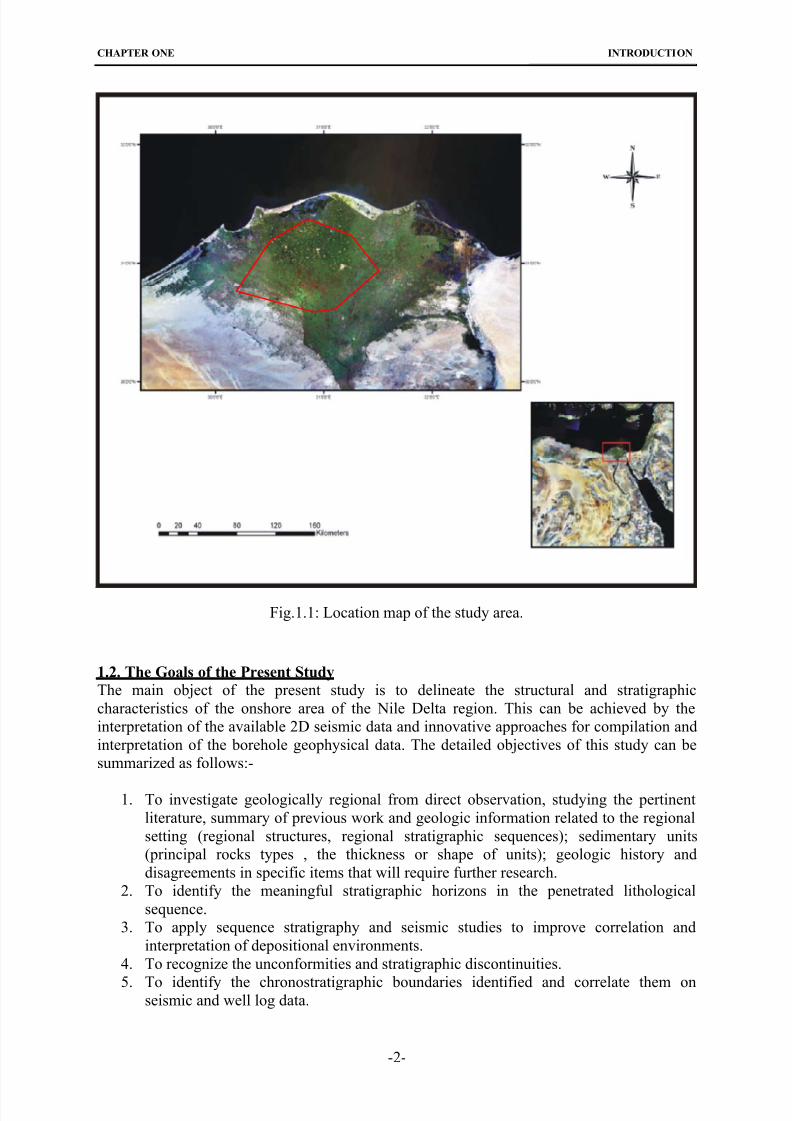
Fig.1.1: Location map of the study area. ……………………………………………………………………...
CHAPTER TWO……………………………………………………………………….....
Fig. 2.1: Geological map of Egypt………………………………………….………………………………....Fig. 2.2: Main structural feature of northern Egypt and the east Mediterranean Sea. The lower diagramshows a schematic cross section along the line indicated in the map………………………………………….Fig. 2.3: Map of Egypt and the south eastern Mediterranean Sea showing the main structural elements andsedimentary basins……………………………………………………………………………………….…….Fig. 2.4: Generalized structural cross-section across from the Western Desert Basin and southern Egyptian
platform………………………………………………………………………………………………………..Fig. 2.5: Stratigraphic chart of Egypt including subsurface sediment and tectonic sequence from Jurassic toRecent………………………………………………………………………….………………………………Fig. 2.6: Map of petroliferous basins of Egypt showing oil and gas fields and discoveries in the WesternDesert, the Nile Delta and Sinai…………………………………………………………..…………………...Fig. 2.7: The oil production and consumption of Egypt…………………………………………………….....
Fig. 2.8: The annual gas production and consumption of Egypt………………………………………………
Fig. 2.9: Reservoir morphology in different hydrocarbon provinces in Egypt………………………………..Fig. 2.10: Oil field locations in the Gulf of Suez……………………………………………………………...Fig. 2.11: Plate tectonic and structural trends in and along the Gulf of Suez………………………………....Fig. 2.12: Stratigraphic column of the Gulf of Suez. …………………………………………...…………….Fig. 2.13: Distribution of trap types in Egypt………………………………………………………………….
Fig. 2.14: The main sedimentary basins and major structural elements in the North Western Desert of Egypt……………………………………………………………………………………………………….…..
Fig. 2.15: Lithostratigraphic column of the North Western Desert of Egypt…………………….....................
CHAPTER THREE…………………………………………………………….……..…..
Fig. 3.1: A diagram to define general fields of fluvial-, wave- and tide-dominated deltas……………………Fig. 3.2: Delta triangle of Galloway (1975) as extended by Dalrymple et al. (1992)………………….……...Fig. 3.3: Nile River trajectory from source to outfall……………………………………………………...…..
Fig. 3.4: Ancient and recent geographical boundaries of both the direct and indirect discharging outlets of the Nile Delta…………………………………………………………………………………………….…….Fig. 3.5: Ancient shorelines of the Nile Delta………………………………………….……………………...Fig. 3.6: Structure contour map on top of the Jurassic in the Nile Delta……………………………………...Fig. 3.7: Isopach contour map of the early Cretaceous in Nile Delta………………………………………….Fig. 3.8: Structure contour on top of the late Cretaceous in Nile Delta……………………………………….Fig. 3.9: Isopach contour map of the late Cretaceous in Nile Delta…………………………………………...
Fig. 3.10: Structure contour map on the top of Oligocene in Nile Delta…………………………………..…..Fig. 3.11: Isopach contour map of the Oligocene deposits in Nile Delta…………………………….……......Fig. 3.12: The major unconformities in the Nile Delta region during Tertiary …………………………….....Fig. 3.13: The mid Miocene and late Miocene (Messinian) unconformities in the Nile Delta region ………..Fig. 3.14: Early Miocene facies and thicknesses from the Cairo-Suez District ……………………………....Fig. 3.15: Structure contour map on top of the middle Miocene in Nile Delta……….….……………………Fig. 3.16: Isopach Contour Map of the middle Miocene in the Nile Delta………………….………………...Fig. 3.17: Late Miocene (Messinian) facies and total late Miocene thicknesses……………………………...
Fig. 3.18: Basal Messinian subcrop and Messinian drainage pattern in the western Delta……………………Fig.3.19: Schematic block diagram illustrating the Messinian canyon, canyon front, and turbiditedepositional settings of the Nile Delta area…………………………………………………………………....Fig. 3.20: Structure contour map on top of the late middle Miocene in Nile Delta……………………….…..Fig. 3.21: Structure contour map on top of Kafr El-Sheikh Formation…………………..……………….…...Fig. 3.22: Structure contour map on top of El-Wastani Formation…………………………………………....Fig. 3.23: Subsurface well correlation of rock units in about north-south direction at the study area…….......Fig. 3.24: Subsurface well correlation of rock units in east-west direction at the study area.…………...........
Fig. 3.25: Main subsurface structures of the Nile Delta region …………………………………………….....Fig. 3.26a: Paleogeographic maps of Nile Delta and surrounding areas from the Triassic to Quaternary........Fig. 3.26b: Legend for paleogeographic maps from fig. 2.26a………..............................................................Fig. 3.27: Tectonic motions and relations with tectonic events in the Mediterranean Sea, Nile Delta, Gulf of Suez and some events in Egypt ……………………………………………………………………………….
1
2
4
5
6
7
8
10
1515
16
1617182020
22
23
26
282931
333437373737
383841414143
434545
45464949
5152535657
58
-X -
8/22/2019 barakat_moataz.pdf
http://slidepdf.com/reader/full/barakatmoatazpdf 12/158
LIST OF FIGURES
Fig. 3.28: Schematic cross section based on regional seismic profiles across the Nile Delta and theMediterranean showing major petroleum plays……………………………………………………………….Fig. 3.29: Schematic cross section illustrating traps and play types recognized in the study area…………....Fig.3.30: Gas field in Nile Delta…………………………………………………………………………….....Fig.3.31: Gas resource additions for the Western Desert and Nile Delta……………………………………...
CHAPTER FOUR …………………………………………………..………………….....Fig. 4.1: The shot point location map……………………………………………………………………….....Fig. 4.2: Location map of 2D seismic sections…………………………………………...................................Fig. 4.3: Two stratigraphic cross sections in north-south direction passing through the study area ………….Fig. 4.4: Schematic diagram of work steps…………………………………….……………………………...Fig. 4.5: Depth-velocity relationship of the Tanta-1 well……………………………………………………..
Fig. 4.6: Synthetic trace construction methods for Kafr-El-Sheikh-1x well…………………………………..Fig. 4.7: Synthetic trace construction methods for Tanta-1 well………………………………………………
CHAPTER FIVE …………………………………………………………………………
Fig. 5.1: The seismic boundaries discovered in the study area.……………………………………..………...Fig. 5.2: Perspective block model of the study area towards the north, showing the several stratigraphic
boundaries discovered………………………………………………………………………………………....
Fig. 5.3: Example of a slump structure………………………………………………………………….……..Fig. 5.4: Example of a debris flow……………………………………………………………………..……...Fig. 5.5: Examples of normal faults…………………………………………………………………………...Fig. 5.6: Examples of growth (listric) faults……………………………...……………………………………Fig. 5.7a: Examples of fault blocks……………………………………………………………………………
Fig. 5.7b: Examples of rotated fault blocks……………………………………………………………………Fig. 5.8: Examples of erosional channels……………………………………………………………………...Fig. 5.9: Examples of anticlinal rollover structures……………………………………………………………Fig. 5.10: Examples of antithetic faults………………………………………………………………………..Fig. 5.11: Examples of downlap and toplap facies………………………………….…………………………Fig. 5.12: Examples of onlap fill seismic facies, A) channel fill seismic facies B) onlap facies……………...Fig. 5.13: Example of a parallel facies……………...………………………………………….……………...Fig. 5.14: Examples of chaotic seismic facies A) Tectonically active areas B) Fills topographic lows……....
Fig. 5.15: Examples of hummocky reflection configuration………………………………..…………………Fig. 5.16: Examples of reflection free areas or transparent……………………………………………………Fig. 5.17: Types of clinoform profile…………………………………………………………….……………Fig. 5.18: Example of an oblique clinoform seismic facies…….…..…………………………………………Fig. 5.19: Examples of sigmoid clinoforms seismic facies……………………………………………………Fig. 5.20: A) Seismic profile with basin-margin concepts. B) Interpreted profile……….……………………Fig. 5.21: A) Seismic profile in the north-south direction. B) Interpreted profile…………..………………...
Fig. 5.22: A) Seismic profile in the east-west direction. B) Interpreted profile………………….……………
CHAPTER SIX ……………………………………………………..…………………….
Fig.6.1: Interpreted grid horizons in the study area……………………………………………………………
Fig.6.2: Interpret faults in the study area; the blue fault refers to the major fault (hinge line) …………...…..
Fig.6.3: Rollover anticlines in the middle of the study area…………………………………………………...Fig.6.4: The maximum shape points can control in the major listric fault in the studied area…………….…..Fig.6.5: Skeleton framework of the study area……………………………………………….………………..Fig.6.6: Pillar gridding increments (400 m x 400 m) in the small area within the study area ………………..Fig.6.7: Pillar gridding increments (1500 m x1500 m) in the large area………………..…………………….Fig.6.8: Two views of the 3D model constructed from structure time map. A) Horizons with seismic linesB) Horizons without seismic lines…………………………………………………………………………......
Fig.6.9: Time structure map of the middle Miocene in the study area………………….……………………..Fig.6.10: Time structure map of middle Miocene covering the entire Nile Delta…………………………….
Fig.6.11: 3D view of the adapting the time structure map with the two stratigraphic cross sections passingin N-S direction through the study area……………………………………………………………..................Fig.6.12: Depth structure map of middle Miocene in the study area………………………………………….Fig.6.13: Depth structure map of the middle Miocene covering the entire Nile Delta……….…………….....
Fig.6.14: Isochron map from late Pliocene to middle Pliocene in the study area……………………………..Fig.6.15: Isochron map from late Pliocene to Holocene covering the entire Nile Delta ……..…………….....
Fig.6.16: Isopach map for the Cretaceous and Eocene in the study area……………………..…………….....Fig.6.17: Isopach map for the Oligocene cover the entire Nile Delta…………………………………………
60616465
666768686972
7475
76
77
77
8181828385
858687878990
9192
93939495
9597
98100
101
102
103
103104105105106
106
108108
111111113
118118
119119
-XI -

8/22/2019 barakat_moataz.pdf
http://slidepdf.com/reader/full/barakatmoatazpdf 13/158
LIST OF FIGURES
-XII -
Fig.6.18A&B: 3D fence diagrams generalizing the sedimentary thickness variations in the available wellsin the Nile Delta in different directions…………………………………………………..……………………Fig.6.19: Prospective view on the 3D structural model of the Nile Delta onshore…………………………....Fig.6.20: Cross section in the south to north direction of the Nile Delta ……………………………………..Fig.6.21: Cross section (A-B)…………………………… ……………………………………………………Fig.6.22: Cross section (C-D)……………………… …………………………………………………………
123124125125125
8/22/2019 barakat_moataz.pdf
http://slidepdf.com/reader/full/barakatmoatazpdf 14/158
LIST OF TABLES
LIST OF TABLES
CHAPTERTWO……………………………………………………..…………….…...
Table 2.1: Exploratory wells in Egypt by age at total depth………………………...…………………...…
CHAPTER THREE…………………………………..……………..………………….
Table 3.1: Some morphological and hydrographic data of the Nile Delta lakes……………….…………..Table 3.2: Stratigraphic classification of Nile Delta (IEOC, 1967)………………………………………...Table 3.3: Stratigraphic classification of Nile Delta (IEOC, 1969)………………………………………...Table 3.4: Stratigraphic classification of Nile Delta (NCGS, 1974)…………………………… ………….Table 3.5: Stratigraphic classification of Nile Delta (El Heiny and Enani, 1996)…………… ……………Table 3.6: Hydrocarbon production of Egypt………………………………………………………………
CHAPTER SIX ……………………………………………………….…………..........
Table 6.1: The main parameters of the time structure maps ………………………………………..……...Table 6.2: The main parameters of the time structure maps covering the entire Nile Delta……………….Table 6.3: The main parameters of the depth structure maps…………………………………..………..…
Table 6.4: The main parameters of the depth structure maps covering the entire Nile Delta………………Table 6.5: The main characteristics of the different isochron maps………………………….…………….Table 6.6: The main characteristics of the different isochron maps (large area)………………...................
Table 6.7: The main characteristics of the different isopach maps…………………………..…………..…Table 6.8: The main characteristics of the different isopach maps (large area)……………………………
4
14
26
353839394063
101
109110112
114116117
120121
-XIII-
8/22/2019 barakat_moataz.pdf
http://slidepdf.com/reader/full/barakatmoatazpdf 15/158
CHAPTER ONE INTRODUCTION
CHAPTER ONE
INTRODUCTION
1.1. General
Nile Delta (Ta-Mehet)
Delta (uppercase Δ, lowercase δ; Greek : Δέλτα [ðelta] Thelta) is the fourth letter of the Greek
alphabet. In the system of Greek numerals it has a value of 4. It was derived from the
Phoenician letter Dalet (Δ). Letters that arose from Delta include the Latin D and the
equivalent in the Cyrillic alphabet (Д). The Nile Delta (Ta-Mehet) in Hieroglyphic (ancientEgyptian language) means the land of the estuary water.
The Nile Delta is considered as the earliest known delta in the world. It was described by
Herodotus in the 5th Century AC (Said, 1981). The Nile Delta is illustrated to be an arcuate
delta (arc-shaped), as it resembles a triangle or lotus flower when seen from above. In
comparison to the Mississippi, the Rhone, the Niger and the Ganges Deltas very little work
has been published on the geological evolution of the Nile Delta.
The present Nile Delta covers an onshore area of about 30,000 km2 and about an equal size
offshore down to the 200 m isobath. The southern apex of the delta is located approximately
30 km north of Cairo. The Nile Delta formed by the division of the branches of the River Nile
as it flows south through the Valley formed by the Nile in Upper Egypt. The river branches
spread out in a V-shaped fan and make their way towards the Mediterranean through Lower
Egypt, where the Nile River splits into the western Rosetta branch and the eastern Damietta
branch. In ancient times the Nile flood deposited layers of silt in this area, making the deltaic
fan expand from east to west and pushed out into the sea.
The delta reaches expands some 240 km along the Mediterranean coastline and extends to a
maximum of 160 km from north to south. The Nile Delta represents about 2.4% of total area
of Egypt; without the Nile Valley and Delta, Egypt is mainly a desert country (Fig.1.1). To
the west of the Nile River the Western Desert (about 650 x 1000) km consists of flat plateaus,and large parts of it near Libya are covered by sand dunes. There are a number of topographic
depressions occupied by oases (Baharia, Farafra, Kharga, Dakhla and Siwa), some of them
below the sea-level (e.g. Fayoum).
The Nile Delta occupies a central position within the plate tectonic development of the eastern
Mediterranean. It lies on the northern margin of the NE-African plate extends from the
subduction zone adjacent to the Cretan and Cyprus arcs to the Red Sea where it rifted from
the Arabian plate. The Nile Delta’s geologic history became known due to the activities of the
oil companies which started work in the Nile Delta in the early sixties of the last century. This
can be attributed to the fact that this province started to disclose part of its hidden
hydrocarbon reserves as a direct result of using state of the art exploration techniques, inaddition to the expanding the use of different types of geological and geophysical modeling
techniques (EGPC, 1994).
-1-
8/22/2019 barakat_moataz.pdf
http://slidepdf.com/reader/full/barakatmoatazpdf 16/158
CHAPTER ONE INTRODUCTION
Fig.1.1: Location map of the study area.
1.2. The Goals of the Present Study
The main object of the present study is to delineate the structural and stratigraphic
characteristics of the onshore area of the Nile Delta region. This can be achieved by the
interpretation of the available 2D seismic data and innovative approaches for compilation and
interpretation of the borehole geophysical data. The detailed objectives of this study can be
summarized as follows:-
1. To investigate geologically regional from direct observation, studying the pertinent
literature, summary of previous work and geologic information related to the regional
setting (regional structures, regional stratigraphic sequences); sedimentary units
(principal rocks types , the thickness or shape of units); geologic history and
disagreements in specific items that will require further research.
2. To identify the meaningful stratigraphic horizons in the penetrated lithological
sequence.
3. To apply sequence stratigraphy and seismic studies to improve correlation and
interpretation of depositional environments.
4. To recognize the unconformities and stratigraphic discontinuities.
5. To identify the chronostratigraphic boundaries identified and correlate them onseismic and well log data.
-2-
8/22/2019 barakat_moataz.pdf
http://slidepdf.com/reader/full/barakatmoatazpdf 17/158
CHAPTER ONE INTRODUCTION
-3-
6. To extract complete subsurface geo-information from borehole geophysical data and
related geologic data.
7. To create a variety of geological maps as time structure maps and depth structure
maps shall be derived maps, showing depths (TWT and km) of a unit contact or other
surfaces of interest. Relevant faults will be an integral part of the mapping. The
structural model is to be analyzed and related to the deposited sediments. Finally,isopach maps will be contoured that tie all wells, showing thickness aerial distribution
of the penetrated units.
8. To construct time structure maps, velocity maps, depth structure maps as well as
isopach maps using 2D seismic lines and log data.
9. To determine the regional and local structural features through a process of seismic
interpretation for the selected seismic lines.
10. To develop seismic stratigraphic analysis procedures, involving seismic sequence
analysis, seismic facies analysis and seismic unit analysis.
11. To construct 3D modeling of geological and geophysical data.
12. To construct geological cross sections to clarify the complex relations between
seismic and well logging data.13. To present a correlation between log interpretation results and seismic analysis.
1.3. Material and Methods
The present work is based on the available 2D seismic data, well logging data and subsurface
borehole geological cross sections. All evaluations and interpretations have been established
with the Petrel Software 2009. The approach to the analysis of the data is divided roughly into
the seismic interpretation and the construction of a 3D structural model of the interpreted
faults and horizons. This study was passing through different steps as follows:
1. The collection all available geological data such as:
a. Technical reports, recent available papers on the different depositional
environments and structural geology.
b. Geological cross-sections and stratigraphic correlation charts, formation
descriptions.
c. Structure maps with well locations and faults.
d. Different sets of the borehole geophysical databases.
2. The completion of 2D seismic interpretations from the Jurassic to Resent.
3. Distinguishing the chrono-stratigraphic boundaries and their correlation with seismic and
well log data.
4. Identifying the unconformity boundaries on the seismic lines, ranging from angular to
disconformity types.5. The velocity analysis (average and interval) to show the change of velocity in different
rock units penetrated by wells as a function of depth and draw the T-Z curve. Then
construct synthetic seismograms using sonic and density logs for the available well logs.
6. Construction of time structure maps, velocity maps, depth structure maps as well as
isopach and isochron maps using seismic lines and log data.
7. Study of the structural features of all the area by analysis of all available seismic lines.
8. Seismic stratigraphic analysis procedures, involving seismic sequence analysis, seismic
facies analysis and seismic unit analysis.
9. Construction of a 3D structure model by using all the available data (geological and
geophysical data, also cross section from previously published work (Kellner et al., 2009).
10. Construct geological cross sections in N-S and E-W directions.
8/22/2019 barakat_moataz.pdf
http://slidepdf.com/reader/full/barakatmoatazpdf 18/158
CHAPTER TWO REGIONAL GEOLOGY AND HYDROCARBON PROVINCES IN EGYPT
CHAPTER TWO
REGIONAL GEOLOGY AND HYDROCARBON PROVINCES IN
EGYPT
2.1.General
The Arab Republic of Egypt is situated in the northeast of the African continent between the
Mediterranean and the Red Sea and its extensions, the Gulf of Suez and Aqaba; it is bordered
by Libya to the west and by Sudan to the south. It has an area about 1001449 km2 and
occupies nearly one-thirtieth of the total area of Africa. Without the Nile Valley and Delta,
Egypt is mainly a desert country (Sestini, 1995).
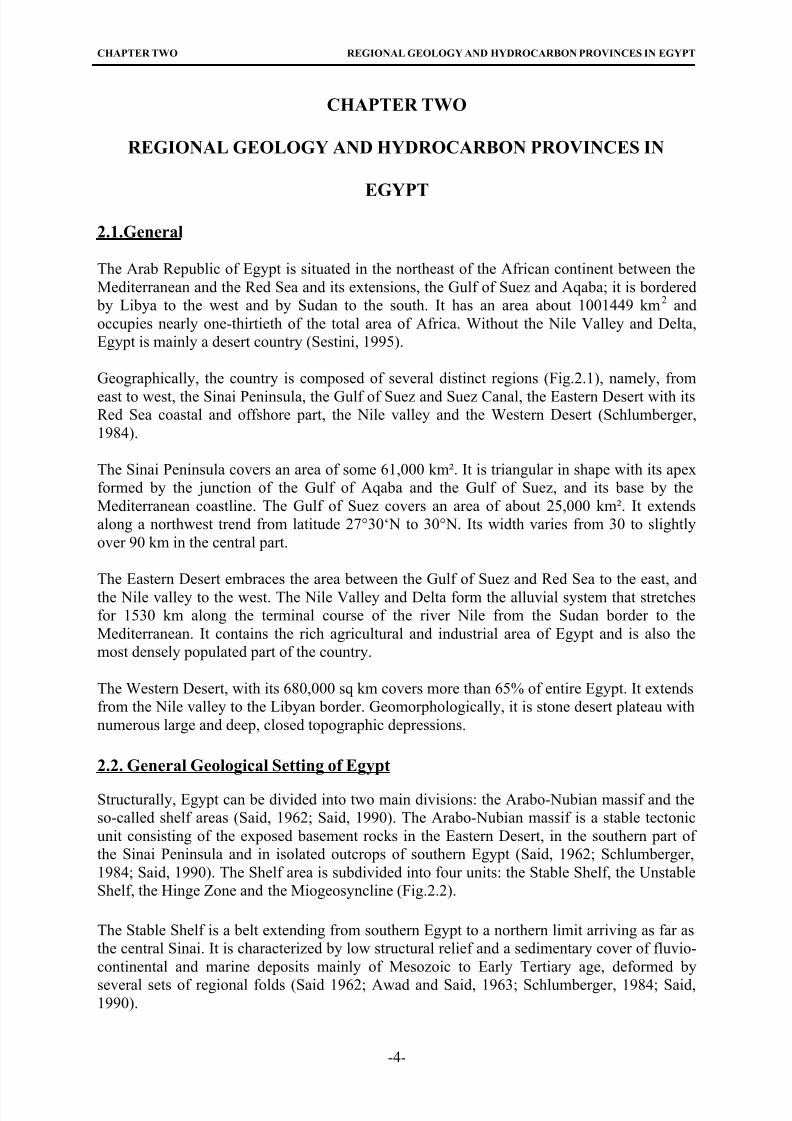
Geographically, the country is composed of several distinct regions (Fig.2.1), namely, from
east to west, the Sinai Peninsula, the Gulf of Suez and Suez Canal, the Eastern Desert with itsRed Sea coastal and offshore part, the Nile valley and the Western Desert (Schlumberger,
1984).
The Sinai Peninsula covers an area of some 61,000 km². It is triangular in shape with its apex
formed by the junction of the Gulf of Aqaba and the Gulf of Suez, and its base by the
Mediterranean coastline. The Gulf of Suez covers an area of about 25,000 km². It extends
along a northwest trend from latitude 27°30‘N to 30°N. Its width varies from 30 to slightly
over 90 km in the central part.
The Eastern Desert embraces the area between the Gulf of Suez and Red Sea to the east, and
the Nile valley to the west. The Nile Valley and Delta form the alluvial system that stretches
for 1530 km along the terminal course of the river Nile from the Sudan border to the
Mediterranean. It contains the rich agricultural and industrial area of Egypt and is also the
most densely populated part of the country.
The Western Desert, with its 680,000 sq km covers more than 65% of entire Egypt. It extends
from the Nile valley to the Libyan border. Geomorphologically, it is stone desert plateau with
numerous large and deep, closed topographic depressions.
2.2. General Geological Setting of Egypt
Structurally, Egypt can be divided into two main divisions: the Arabo-Nubian massif and the
so-called shelf areas (Said, 1962; Said, 1990). The Arabo-Nubian massif is a stable tectonic
unit consisting of the exposed basement rocks in the Eastern Desert, in the southern part of
the Sinai Peninsula and in isolated outcrops of southern Egypt (Said, 1962; Schlumberger,
1984; Said, 1990). The Shelf area is subdivided into four units: the Stable Shelf, the Unstable
Shelf, the Hinge Zone and the Miogeosyncline (Fig.2.2).
The Stable Shelf is a belt extending from southern Egypt to a northern limit arriving as far as
the central Sinai. It is characterized by low structural relief and a sedimentary cover of fluvio-
continental and marine deposits mainly of Mesozoic to Early Tertiary age, deformed by
several sets of regional folds (Said 1962; Awad and Said, 1963; Schlumberger, 1984; Said,1990).
-4-
8/22/2019 barakat_moataz.pdf
http://slidepdf.com/reader/full/barakatmoatazpdf 19/158
CHAPTER TWO REGIONAL GEOLOGY AND HYDROCARBON PROVINCES IN EGYPT
Fig.2.1: Geological map of Egypt (Schlumberger, 1984).
-5-
8/22/2019 barakat_moataz.pdf
http://slidepdf.com/reader/full/barakatmoatazpdf 20/158
CHAPTER TWO REGIONAL GEOLOGY AND HYDROCARBON PROVINCES IN EGYPT
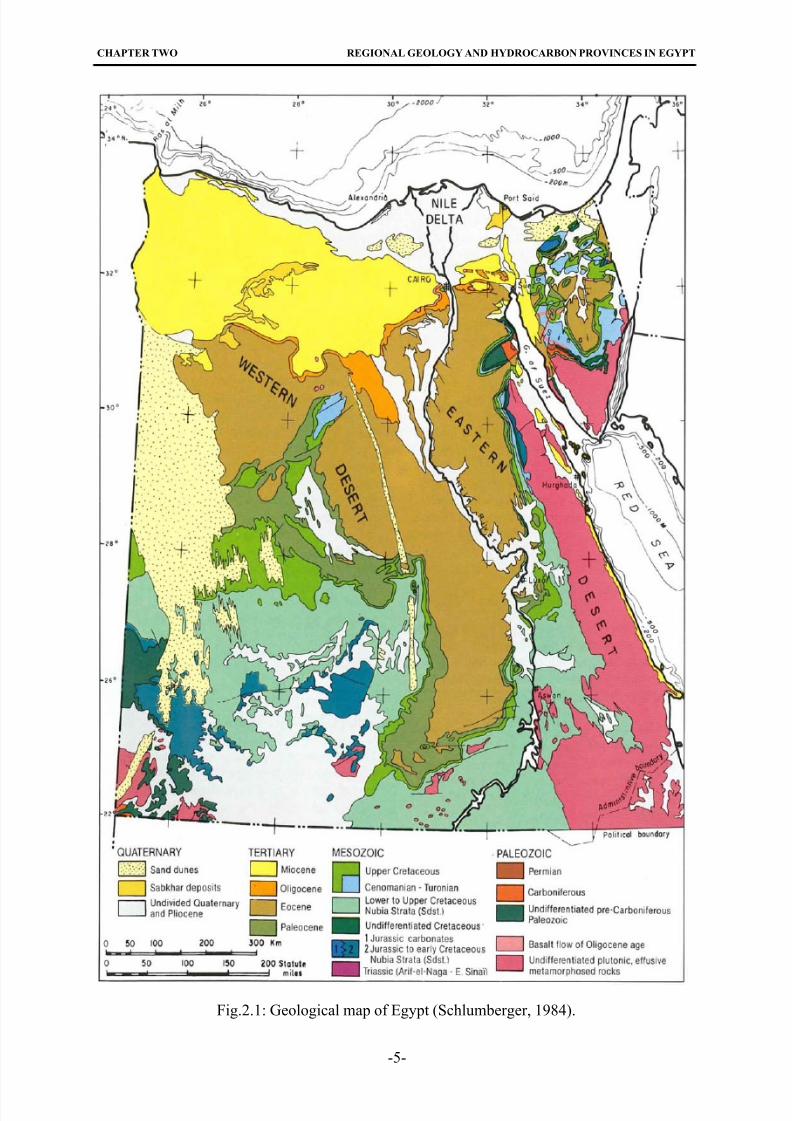
Fig. 2.2: Main structural features of northern Egypt and the eastern Mediterranean Sea. The
lower diagram shows a schematic cross section along the line indicated in the map
(Schlumberger, 1984).
The Unstable Shelf occupies almost all of northern Egypt (the Nile Delta area is part of theunstable shelf), characterized by a northward-thickening sedimentary section underlain by
high basement relief due to block faulting. The Nile Delta was treated as a part of the passive
leading edge of the African Plate along the southeastern Mediterranean Sea (Harms and
Wray, 1990) and (EGPC, 1994). The Hinge Zone coincides nearly with the present
Mediterranean coastal area separating the unstable shelf from the miogeosynclinal basinal
area. It causes a rapid basinwards thickening of Oligocene to Pliocene sediments. According
to Sestini (1995) Egypt can be subdivided into five major morpho-structural units as follows
(Fig.2.3):
1) The Mediterranean Fault Zone, 2) a belt of linear uplifts and half-grabens, 3) the NorthSinai Fold Belt (Syrian Arc), 4) the Suez and the Red Sea Graben, and 5) the intracratonic
basins of southern Egypt.
-6-
8/22/2019 barakat_moataz.pdf
http://slidepdf.com/reader/full/barakatmoatazpdf 21/158
CHAPTER TWO REGIONAL GEOLOGY AND HYDROCARBON PROVINCES IN EGYPT
2.2.1. The Mediterranean fault zone
It extends along all the Mediterranean margin of Egypt, where it downthrows Mesozoic-
Eocene carbonates by a few 1000 m northwards. In the Nile Delta, it separates a South Delta
Block (with a 1000-1500 m section of post-Eocene clastics) from a subsiding North Delta
Basin (with at least 4-6 km of Neogene sediments) (Sestini, 1995). It has been assumed, but
not directly demonstrated, that the Mediterranean Fault Zone represents also a major facies boundary (a hinge zone) between platform and slope carbonates (Harms and Wray, 1990).
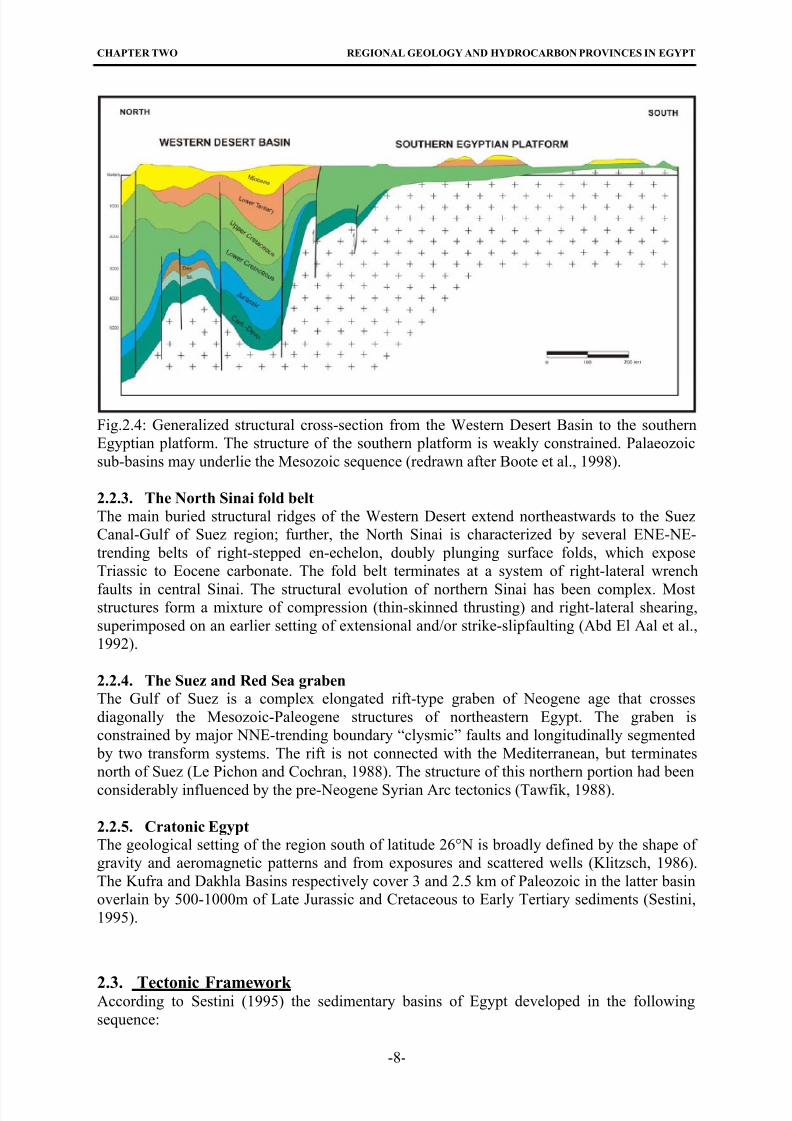
2.2.2. Linear uplifts and half-grabens
The dominant structural style of the Western Desert comprises two systems: a deeper series of
low-relief horst and graben belts separated by master faults of large throw, and broad Late
Tertiary folds at shallower depth. The major structural depressions are generally half-grabens
that dip towards northerly directions (Fig.2.4).
A more complex situation exists around the margins, within and north of the Abu Gharadiq
Basin, where compressed ridges, flower structures and reverse faults have been related to Late
Cretaceous wrench faulting (Bayoumi and Lotfy, 1989).
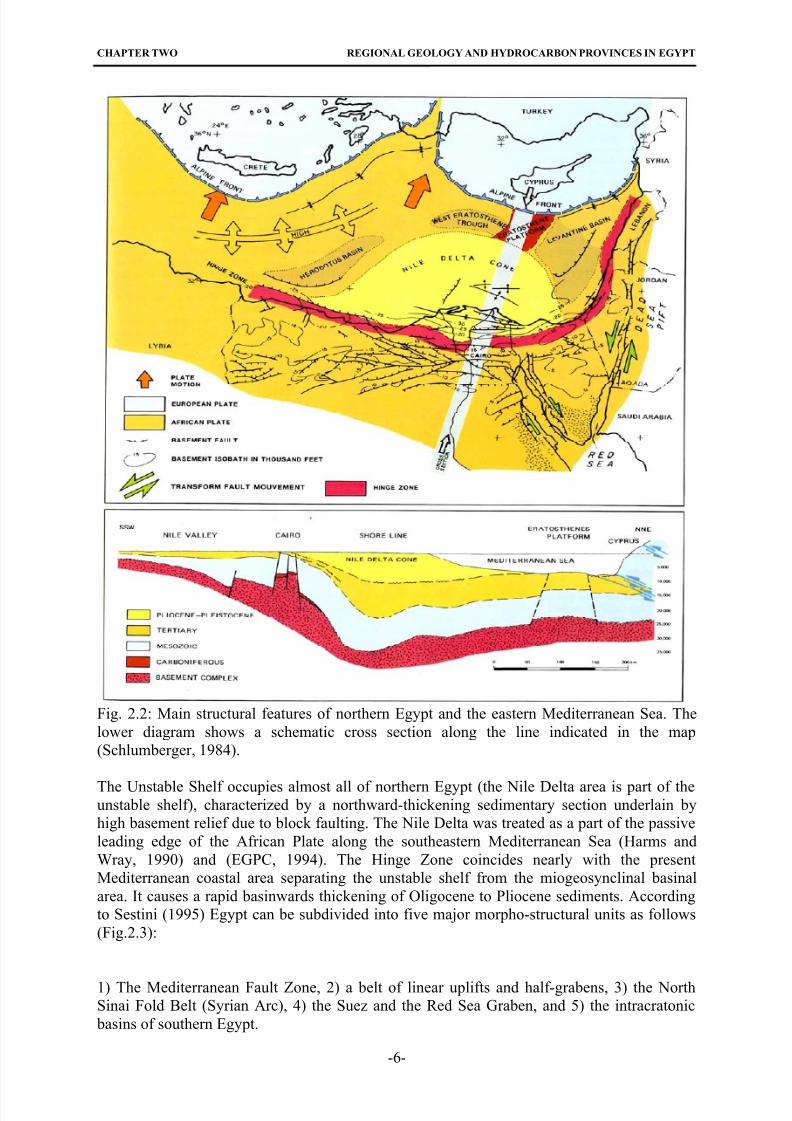
Fig.2.3: Map of Egypt and the southeastern Mediterranean Sea showing main structural
elements and sedimentary basins (modified after Sestini, 1995).
-7-
8/22/2019 barakat_moataz.pdf
http://slidepdf.com/reader/full/barakatmoatazpdf 22/158
CHAPTER TWO REGIONAL GEOLOGY AND HYDROCARBON PROVINCES IN EGYPT
Fig.2.4: Generalized structural cross-section from the Western Desert Basin to the southern
Egyptian platform. The structure of the southern platform is weakly constrained. Palaeozoic
sub-basins may underlie the Mesozoic sequence (redrawn after Boote et al., 1998).
2.2.3. The North Sinai fold belt
The main buried structural ridges of the Western Desert extend northeastwards to the Suez
Canal-Gulf of Suez region; further, the North Sinai is characterized by several ENE-NE-
trending belts of right-stepped en-echelon, doubly plunging surface folds, which expose
Triassic to Eocene carbonate. The fold belt terminates at a system of right-lateral wrench
faults in central Sinai. The structural evolution of northern Sinai has been complex. Moststructures form a mixture of compression (thin-skinned thrusting) and right-lateral shearing,
superimposed on an earlier setting of extensional and/or strike-slipfaulting (Abd El Aal et al.,
1992).
2.2.4. The Suez and Red Sea graben
The Gulf of Suez is a complex elongated rift-type graben of Neogene age that crosses
diagonally the Mesozoic-Paleogene structures of northeastern Egypt. The graben is
constrained by major NNE-trending boundary “clysmic” faults and longitudinally segmented
by two transform systems. The rift is not connected with the Mediterranean, but terminates
north of Suez (Le Pichon and Cochran, 1988). The structure of this northern portion had been
considerably influenced by the pre-Neogene Syrian Arc tectonics (Tawfik, 1988).
2.2.5. Cratonic Egypt
The geological setting of the region south of latitude 26°N is broadly defined by the shape of
gravity and aeromagnetic patterns and from exposures and scattered wells (Klitzsch, 1986).
The Kufra and Dakhla Basins respectively cover 3 and 2.5 km of Paleozoic in the latter basin
overlain by 500-1000m of Late Jurassic and Cretaceous to Early Tertiary sediments (Sestini,
1995).
2.3. Tectonic Framework According to Sestini (1995) the sedimentary basins of Egypt developed in the following
sequence:
-8-
8/22/2019 barakat_moataz.pdf
http://slidepdf.com/reader/full/barakatmoatazpdf 23/158
CHAPTER TWO REGIONAL GEOLOGY AND HYDROCARBON PROVINCES IN EGYPT
1. Early Palaeozoic (Caledonian): NNW-SSE trending basins, with marine transgressions
in Cambro-Ordovician, Silurian and Devonian times, mainly present in the western
part of Egypt.
2. Carboniferous-Permian (Variscan-Hercynian): NE-trending basins over northern
Egypt, opposed to an emergent central-southern Egypt (Klitzsch, 1986).
3. Triassic-Jurassic: Tethys-margin parallel basins due to a re-alignment of tectonictrends. A rifting period was structurally dominated by Jurassic NW-SE left-lateral
oblique extension (Eurasia moving westwards relative to Africa), which produced
ENE- to NE-trending normal faulting.
4. Late Jurassic-Early-Middle Cretaceous: a prism of prograding clastics and carbonates
extends over the continental margin (northern basins) related to the South Tethys
passive margin development.
5. Late Cretaceous and Eocene: marginal basins bound to north by an uplifted rim. In the
period Turonian through Maastrichtian. The structural development was dominated by
right-lateral oblique-slip faulting induced by the westward movement of Africa
relative to Europe. Tectonic activity strongly influenced the sedimentation patterns
(Moussa, 1986; Said, 1990).6. Oligocene to Pliocene: clastic basins (Nile Delta, Gulf of Suez) conditioned by E-W,
NW-SE, NNE-SSW tensional and gravity faulting. The Miocene collapse of the
Mediterranean margin was matched by the uplift of Sinai, the Red Sea Hills, and the
Western Desert.
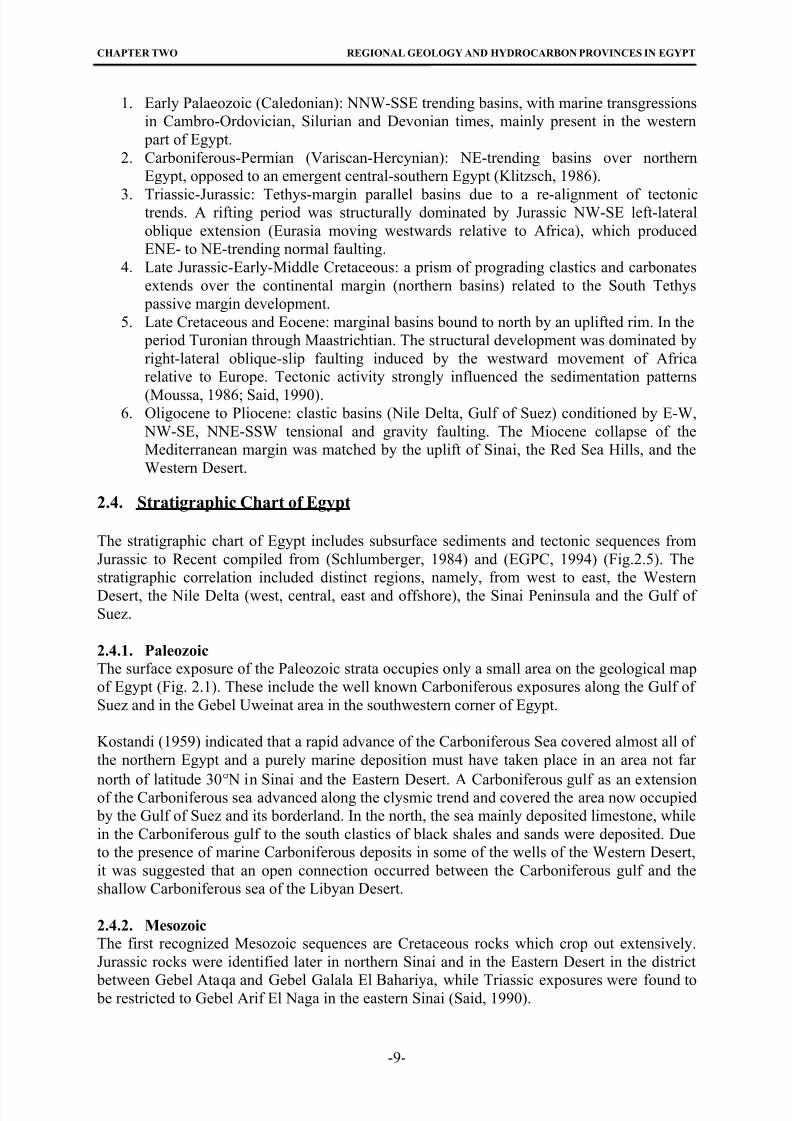
2.4. Stratigraphic Chart of Egypt
The stratigraphic chart of Egypt includes subsurface sediments and tectonic sequences from
Jurassic to Recent compiled from (Schlumberger, 1984) and (EGPC, 1994) (Fig.2.5). The
stratigraphic correlation included distinct regions, namely, from west to east, the Western
Desert, the Nile Delta (west, central, east and offshore), the Sinai Peninsula and the Gulf of
Suez.
2.4.1. Paleozoic
The surface exposure of the Paleozoic strata occupies only a small area on the geological map
of Egypt (Fig. 2.1). These include the well known Carboniferous exposures along the Gulf of
Suez and in the Gebel Uweinat area in the southwestern corner of Egypt.
Kostandi (1959) indicated that a rapid advance of the Carboniferous Sea covered almost all of
the northern Egypt and a purely marine deposition must have taken place in an area not far
north of latitude 30 N in Sinai and the Eastern Desert. A Carboniferous gulf as an extensionof the Carboniferous sea advanced along the clysmic trend and covered the area now occupied
by the Gulf of Suez and its borderland. In the north, the sea mainly deposited limestone, while
in the Carboniferous gulf to the south clastics of black shales and sands were deposited. Due
to the presence of marine Carboniferous deposits in some of the wells of the Western Desert,
it was suggested that an open connection occurred between the Carboniferous gulf and the
shallow Carboniferous sea of the Libyan Desert.
2.4.2. Mesozoic
The first recognized Mesozoic sequences are Cretaceous rocks which crop out extensively.
Jurassic rocks were identified later in northern Sinai and in the Eastern Desert in the district
between Gebel Ataqa and Gebel Galala El Bahariya, while Triassic exposures were found to be restricted to Gebel Arif El Naga in the eastern Sinai (Said, 1990).
-9-
8/22/2019 barakat_moataz.pdf
http://slidepdf.com/reader/full/barakatmoatazpdf 24/158
CHAPTER TWO REGIONAL GEOLOGY AND HYDROCARBON PROVINCES IN EGYPT
N o t R e c o r d e d
Fig.2.5: Stratigraphic chart of Egypt including subsurface sediment and tectonic sequencefrom Jurassic to Recent, compared with the Nile Delta chart from (EGPC,1994) and the North
Sinai, Eastern and Western Desert charts from (Schlumberger, 1984).
-10-
8/22/2019 barakat_moataz.pdf
http://slidepdf.com/reader/full/barakatmoatazpdf 25/158
CHAPTER TWO REGIONAL GEOLOGY AND HYDROCARBON PROVINCES IN EGYPT
Triassic
The marine Triassic transgression followed the Paleozoic (Hercynian) tectonic event and
affected only the structurally lower areas of northeast Egypt. The isopachs of the Triassic are
showing a maximum of +900 m toward the north. The Triassic sediments seem to have been
deposited on a shallow shelf, affected by several transgressive/regressive cycles which caused
tidal flat deposits of the south to interfinger with the marine sediments towards the north.
Jurassic
The thickest exposed Jurassic sequence known in Egypt is that of Gebel Maghara (+2000 m).
During this period the northern basinal area of Sinai was the site of a major sedimentary basin
extending over the present Nile Delta area. Several thinner Jurassic outcrops are known to
occur along the western coast of the Gulf of Suez.
Cretaceous
Early Cretaceous is represented by interbedded of shales, limestones and thin beds of
sandstones with subordinate amounts of dolomites. Sediments of Neocomian formations are
represented by dark grey shales with intercalations of sandstone and limestone. The sedimentsof Aptian age (among them the Abu Ballas Formation) represent thin marine intercalations in
the continental section of lower Cretaceous clastics in northern and southern Egypt,
respectively (Said, 1990).
The Albian is represented by regressive phase in which the sea retreated northward. The
northern part of the elevated Eastern Desert, as well as a large part of the Western Desert,
formed a depression receiving the fluvial detritus of the rivers brought in from the eroding
elevated massif to the south (Said, 1990). During the Cenomanian a marine transgression
covered most of Sinai, Gulf of Suez and northwest Egypt. In late Cenomanian times the
transgression pushed southward to form a narrow passageway, which lay between the Arabo-
Nubian massif and the elevated Kufra basin.
During the Turonian, genuine marine conditions prevailed over a larger part of northern
Egypt. The marine Turonian beds cover north Egypt and the embayment of the Gulf of Suez.
The Coniacian represents a transgressive phase which brought the sea inland as far as Nubia
and beyond, covering the entire Nile basin. The Santonian represents a regressive phase
during which the sea occupied only the tectonic basins of northern Egypt which became
clearly distinguished.
The major transgression took place during the Campanian. During the earliest part of this
transgression the area was covered by a very shallow sea which was affected by tidal currents.
After a short regressive interval during the earliest Maastrichtian, the sea advanced
southwards and covered larger areas of Egypt than at any other time of the Cretaceous (Said,
1990).
2.4.3. Cenozoic
Cenozoic sediments of the Paleogene and the Neogene cover large areas of Egypt.
Paleogene
Paleogene rocks mostly unconformably overly Late Cretaceous or older rocks in most areas of
Egypt. The nature of this contact differs in the two major tectonic provinces of Egypt, the
Stable and Unstable shelves. The transition from the Cretaceous to the Tertiary in the south
Stable Shelf areas was not accompanied by intense tectonic disturbances; the sediments of the
Tertiary mostly disconformably overly the Cretaceous and usually are separated from it by an
intraformational conglomerate carrying reworked Late Cretaceous fossils.
-11-
8/22/2019 barakat_moataz.pdf
http://slidepdf.com/reader/full/barakatmoatazpdf 26/158
CHAPTER TWO REGIONAL GEOLOGY AND HYDROCARBON PROVINCES IN EGYPT
Paleocene
The Paleocene is mainly represented by open marine sediments of varying lithologies
reflecting the frequent epeirogenic movements and change of sea level which affected Egypt
during this epoch. A typical Paleocene section of the stable shelf is Gebel Aweina (height:
450 m). This hill is the type locality of the Esna shale rock unit (Said, 1990).
Eocene
Eocene outcrops cover about 21% of the surface area of Egypt around the Nile valley. The
Eocene rocks may reach several thousand meters in thickness and are made up of almost
exclusively carbonates, occasionally mixed with varying proportion of clastics (Said, 1990).
Oligocene
The Oligocene deposits disconformably overlie late Eocene sediments. They derive from two
distinct faces, a fluviatile facies of sands and gravels and an open marine facies of shales and
minor limestone interbeds (Said, 1990). Attributed to the Oligocene, basalts were recorded in
some wells drilled in the Delta, south, east and west.
Neogene
The advent of the Neogene period was marked by intense tectonic movements, which had a
great effect on the present-day structural framework of Egypt (Said, 1990). The distribution of
Neogene sediments in Egypt is controlled by old SW-NE, NW-SE and W-E trending fault
systems. These fault systems divided the country into five areas. These are from west to east;
1) the Western Desert Plateau; 2) the Nile Delta Basin; 3) the North Sinai Basin; 4) the Gulf
of Suez Basin, and 5) the Northern Red Sea Basin (Shabaan, 2007).
Miocene
The Miocene succession in Egypt occupies about 12 % of the total land surface (Ball, 1952).
Lying unconformable on the older rocks, Miocene sediments extend from near Cairo
westwards across the northern part of the Western Desert into Libya. They are forming a
plateau rising gradually to south and reaching height over 200 m. In addition, they occur in
hills to the east of Cairo as well as along both sides of the Gulf of Suez and near the Red Sea
coast in both Egypt and Sudan.
Miocene sediments exhibit great facies variations and have a large number of unconformities
within the middle and upper sedimentary sequence reflecting the nature of the tectonically
formed basins in which they were deposited. Four tectonic provinces can be distinguished.
1-The North Delta embayment: The northern part of the Nile Delta forms a basin with a thick Neogene section. This basin, named the north Delta embayment by Said (1981), lies between
the east Mediterranean oceanic basin and the south Delta block, which forms part of the
regional high separating the stable and unstable shelves. This high, which was active
throughout the Paleogene and earlier times, is characterized by an attenuated crust and
numerous volcanic eruptions, most of which are dated as early Miocene. The north Delta
embayment extends westward as an elongate belt covering the Mediterranean offshore areas.
This belt lies to the north of the Mediterranean coastal high. The sediments of this embayment
form a miogeoclinal prism.
2-Northwestern Desert: This basin developed to the south of the Mediterranean coastal high,
an old marginal offset which was active during the Palaeogene. During the early Miocene,clastic sedimentation prevailed. A change of the climate and a reactivation of the coastal high
during the middle Miocene left the north Western Desert as a distinctive basin.
-12-
8/22/2019 barakat_moataz.pdf
http://slidepdf.com/reader/full/barakatmoatazpdf 27/158
CHAPTER TWO REGIONAL GEOLOGY AND HYDROCARBON PROVINCES IN EGYPT
3-Cairo-Suez District: This area forms a neritic marginal zone which was intermittently
covered by the sea as it advanced toward the south. The sediments are thin and are made up of
mostly shallow organogenic carbonates with numerous diastems (Said, 1990).
4-Gulf of Suez and Red Sea Basins: These are elongate basins which are flanked by uplifts
along nearby rifted continental margins. The Gulf of Suez basin seems to have formed at anearlier date than the Red sea basin. Both basins have narrow outlets to the open ocean system
from which they were separated by sills, the Suez high in the north and the Bab El Mandab in
the south.
The Miocene sediments in the Gulf of Suez region represent the main hydrocarbon bearing
reservoirs in Egypt. The majority of the oil fields are producing from Miocene reservoirs. The
Miocene rocks have a wide surface or subsurface distribution (Barakat, 2003). The many
wells penetrating the Miocene sediments in Egypt allowed their treatment in more detail;
early, middle and late Miocene.
Early MioceneEarly Miocene sediments of Aquitanian age are of limited areal distribution. They are
recorded with certainty in the north Delta embayment wells. Wherever their base was reached,
they were found to rest conformably over die marine Oligocene sediments.
The maximum marine transgression of the Miocene epoch occurred during the Burdigalian
when the sea covered large areas of northern Egypt and flooded the newly formed Gulf of
Suez. A large part of the transgressing sea was under the influence of fluvial sedimentation
forming a wave-dominated delta plain covering the eastern part of the north Western Desert.
Middle Miocene
The Early and Middle Miocene sediments are separated by an unconformity whose magnitude
varies. In the case of the Gulf of Suez, the unconformity caused severance of the Gulf from
the Mediterranean and the start of evaporitic sedimentation. In the Red Sea, where basins
were deeper, evaporitic sedimentation began in late middle Miocene times and continued
during the late Miocene. In the Western Desert, arid conditions that prevailed during this time
terminated the fluvial sedimentation, which characterized the early Miocene and brought
about organogenic deposits.
Late Miocene
A continuous withdrawal of the sea from Egypt took place during the late Miocene. By
Messinian times not only the land of Egypt completely was exposed, but also the entireMediterranean Sea as its connection with the world oceanic system was interrupted. The
impact of this event was enormous in shaping the modern landscape of Egypt. The Nile
excavated its modern course and the oases and other depressions were formed in adjustment
to the newly lowered base level of the Mediterranean. The late Miocene was an episode of
erosion with few types of sediment preserved. These are mostly evaporites, which
accumulated in the Gulf of Suez, the Red Sea and the north Delta embayment. Coarse-grained
clastics accumulated in front of the forming Nile are also recorded from the subsurface.
Pliocene
The advent of the Pliocene epoch was marked by the flooding of the Mediterranean basin.
The Gulf of Suez and the Red Sea, which had been isolated from the Mediterranean, wereconnected with the Indian Ocean across the Bab El Mandab Strait. The late Pliocene saw a
withdrawal of the sea and a remarkable climatic change that brought about local rains.
-13-
8/22/2019 barakat_moataz.pdf
http://slidepdf.com/reader/full/barakatmoatazpdf 28/158
CHAPTER TWO REGIONAL GEOLOGY AND HYDROCARBON PROVINCES IN EGYPT
Quaternary
The Quaternary sediments unconformably overly the Pliocene or older sediments in the Nile
Valley and the surrounding deserts. The Nile trough possesses the most complete record of
the Quaternary in Egypt where the sediments accumulated in great thickness and are divisible
into units which are unconformable with one another. In the deserts, however, which are the
sites of intense erosion, the Quaternary sediments are thin and incomplete. The correlation of sediments of the different environments is difficult because of the presence of great gaps in
the sedimentary record and the precise age of most of the sediments in unknown.
2.5. Hydrocarbon Exploration
2.5.1. General
The North African region is known in international geological circles for its Palaeozoic
reservoirs and source rocks. The Palaeozoic contributes nearly half the oil (43%) and the vast
majority (84%) of the gas reserves of the region, with most of this petroleum originating from
Silurian and Devonian source beds (Macgregor,1998). Petroleum exploration in North Africa
began in the late nineteenth century. The first reported “commercial” oil discovery in NorthAfrica was the Gemsa find in 1909, which is located in the southern Gulf of Suez coastal
region of Egypt and produced small quantities of oil from shallow Miocene reservoirs.
After this discovery further exploration during this period in the Gulf of Suez region was only
modestly successful (Traut et al., 1998). Despite its petroleum exploration history of more
than 100 years, many areas in Egypt remain underexplored, see Table 2.1: Exploratory
penetrations in Egypt by age at total depth (Dolson et al., 2001).
Table 2.1: Exploratory wells in Egypt by geological age at total depth (Dolson et al., 2001).
Petroleumsystem
TotalWells
Tertiary Cretaceous Jurassic Triassic Paleozoic Precambrian
Western Desert 578 51 319 137 0 40 31
Nile Delta, NorthSinai, Med. Sea
247 199 27 20 0 1 0
Gulf of Suez,Eastern Desert,
Sinai
902 260 412 13 0 19 198
Upper Egypt 13 0 5 0 0 0 8
Red Sea 14 6 0 0 0 0 8
Totals 1754 516 763 170 0 60 245
There are about 54 producing fields in the Gulf of Suez, 50 oil and/or gas fields in Western
Desert, and two large gas fields in the Nile Delta (Fig.2.6) (Sestini, 1995). In 1992, the
official proven recoverable reserves were estimated to be 856 mio.t of oil and 436 bill.m3 of
gas. The Abu Qir and Abu Madi fields hold just under 28 bill.m3 of gas each.
According to the Oil and Gas Journal’s January 2008 estimate, Egypt’s proven oil reserves
reach up to 3.7 billion barrels. In 2007, Egypt’s oil production averaged 664,000 barrels per
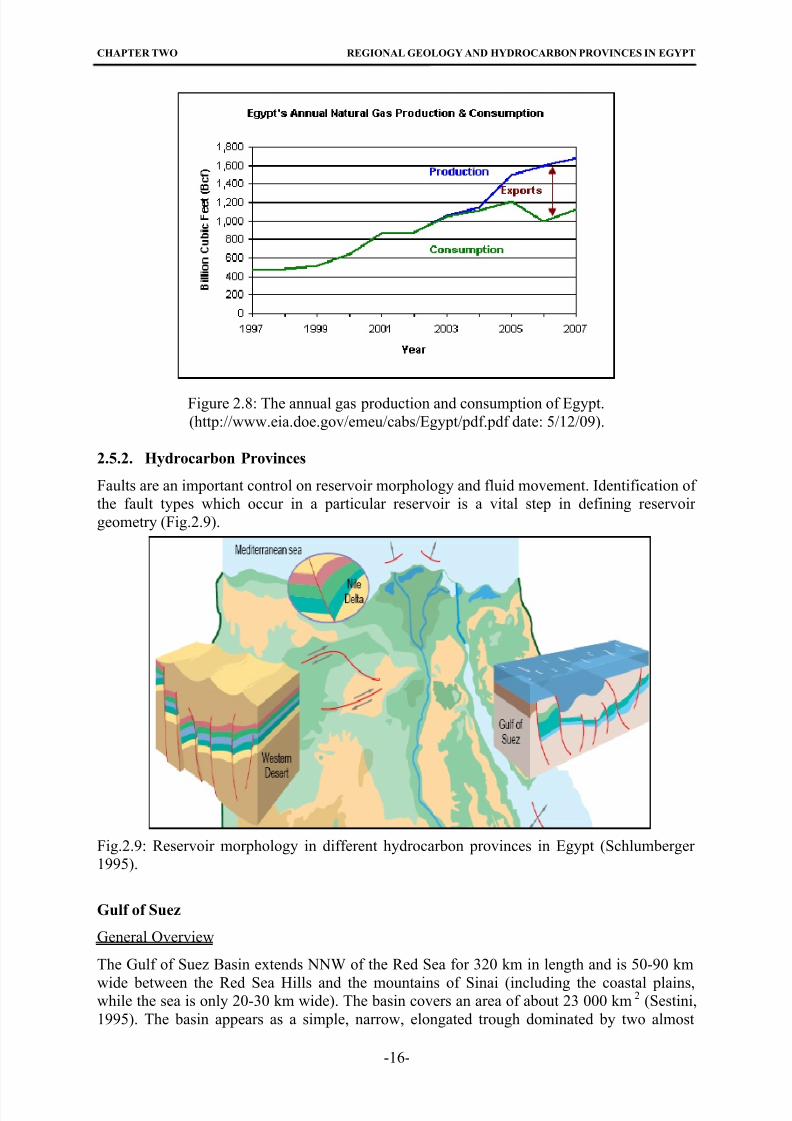
day (bbl/d), less than 1 percent of world production (Fig.2.7). Egypt’s natural gas is likely to
be the primary growth engine of Egypt's energy sector for the foreseeable future. The natural
gas sector is expanding rapidly with production having increased over 30 percent between
1999 and 2007 (Fig.2.8). In 2006, Egypt produced roughly 1.9 trillion cubic feet (Tcf) and
consumed 1.3 Tcf of natural gas.
-14-
8/22/2019 barakat_moataz.pdf
http://slidepdf.com/reader/full/barakatmoatazpdf 29/158
CHAPTER TWO REGIONAL GEOLOGY AND HYDROCARBON PROVINCES IN EGYPT
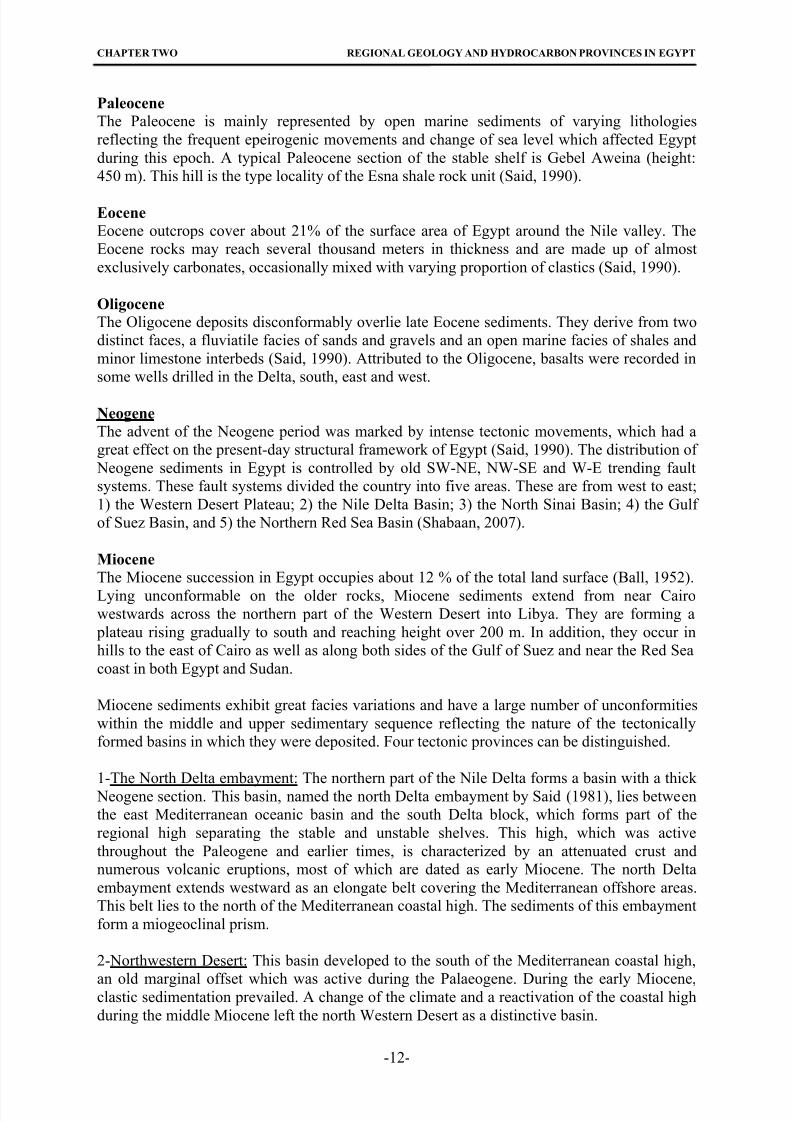
Figure 2.6: Map of petroliferous basins of Egypt showing oil and gas fields and discoveries in
the Western Desert, the Nile Delta and Sinai (redrawn after Sestini, 1995).
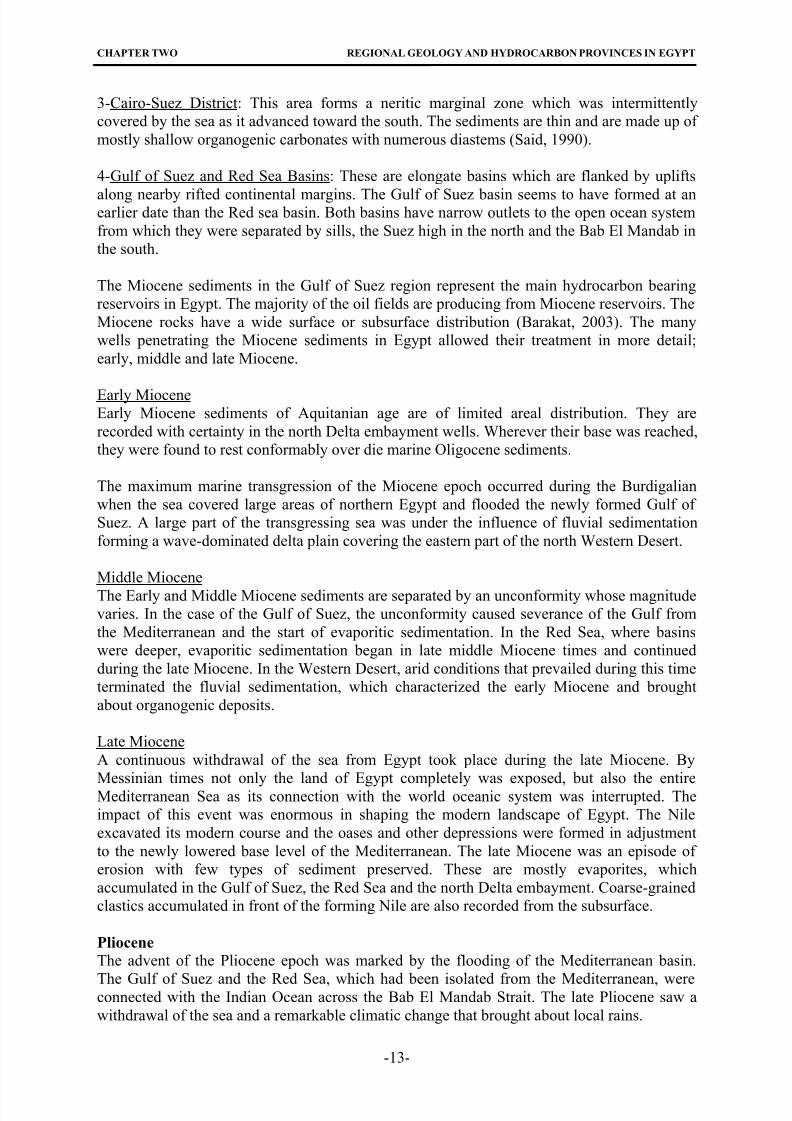
Figure 2.7: The oil production and consumption of Egypt.(http://www.eia.doe.gov/emeu/cabs/Egypt/pdf.pdf date: 5/12/09).
-15-
8/22/2019 barakat_moataz.pdf
http://slidepdf.com/reader/full/barakatmoatazpdf 30/158
CHAPTER TWO REGIONAL GEOLOGY AND HYDROCARBON PROVINCES IN EGYPT
Figure 2.8: The annual gas production and consumption of Egypt.
(http://www.eia.doe.gov/emeu/cabs/Egypt/pdf.pdf date: 5/12/09).
2.5.2. Hydrocarbon Provinces
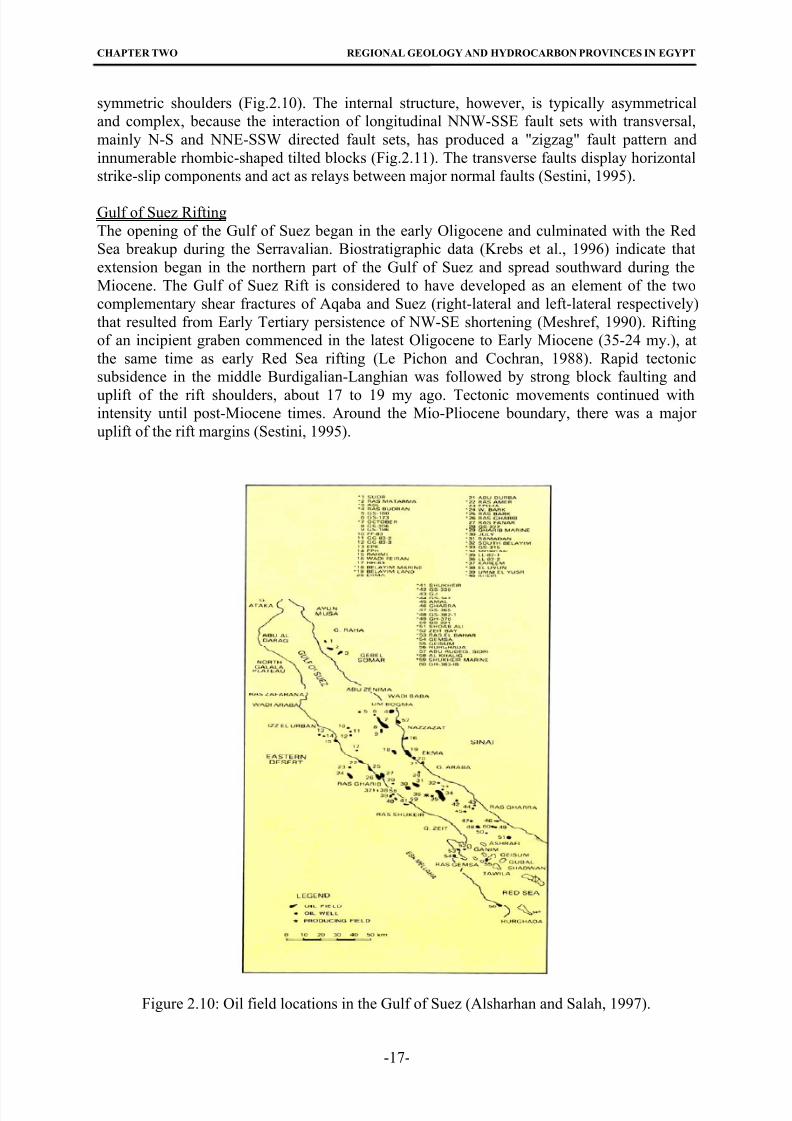
Faults are an important control on reservoir morphology and fluid movement. Identification of
the fault types which occur in a particular reservoir is a vital step in defining reservoir
geometry (Fig.2.9).
Fig.2.9: Reservoir morphology in different hydrocarbon provinces in Egypt (Schlumberger
1995).
Gulf of Suez
General Overview
The Gulf of Suez Basin extends NNW of the Red Sea for 320 km in length and is 50-90 km
wide between the Red Sea Hills and the mountains of Sinai (including the coastal plains,while the sea is only 20-30 km wide). The basin covers an area of about 23 000 km 2 (Sestini,
1995). The basin appears as a simple, narrow, elongated trough dominated by two almost
-16-
8/22/2019 barakat_moataz.pdf
http://slidepdf.com/reader/full/barakatmoatazpdf 31/158
CHAPTER TWO REGIONAL GEOLOGY AND HYDROCARBON PROVINCES IN EGYPT
symmetric shoulders (Fig.2.10). The internal structure, however, is typically asymmetrical
and complex, because the interaction of longitudinal NNW-SSE fault sets with transversal,
mainly N-S and NNE-SSW directed fault sets, has produced a "zigzag" fault pattern and
innumerable rhombic-shaped tilted blocks (Fig.2.11). The transverse faults display horizontal
strike-slip components and act as relays between major normal faults (Sestini, 1995).
Gulf of Suez Rifting
The opening of the Gulf of Suez began in the early Oligocene and culminated with the Red
Sea breakup during the Serravalian. Biostratigraphic data (Krebs et al., 1996) indicate that
extension began in the northern part of the Gulf of Suez and spread southward during the
Miocene. The Gulf of Suez Rift is considered to have developed as an element of the two
complementary shear fractures of Aqaba and Suez (right-lateral and left-lateral respectively)
that resulted from Early Tertiary persistence of NW-SE shortening (Meshref, 1990). Rifting
of an incipient graben commenced in the latest Oligocene to Early Miocene (35-24 my.), at
the same time as early Red Sea rifting (Le Pichon and Cochran, 1988). Rapid tectonic
subsidence in the middle Burdigalian-Langhian was followed by strong block faulting and
uplift of the rift shoulders, about 17 to 19 my ago. Tectonic movements continued withintensity until post-Miocene times. Around the Mio-Pliocene boundary, there was a major
uplift of the rift margins (Sestini, 1995).
Figure 2.10: Oil field locations in the Gulf of Suez (Alsharhan and Salah, 1997).
-17-
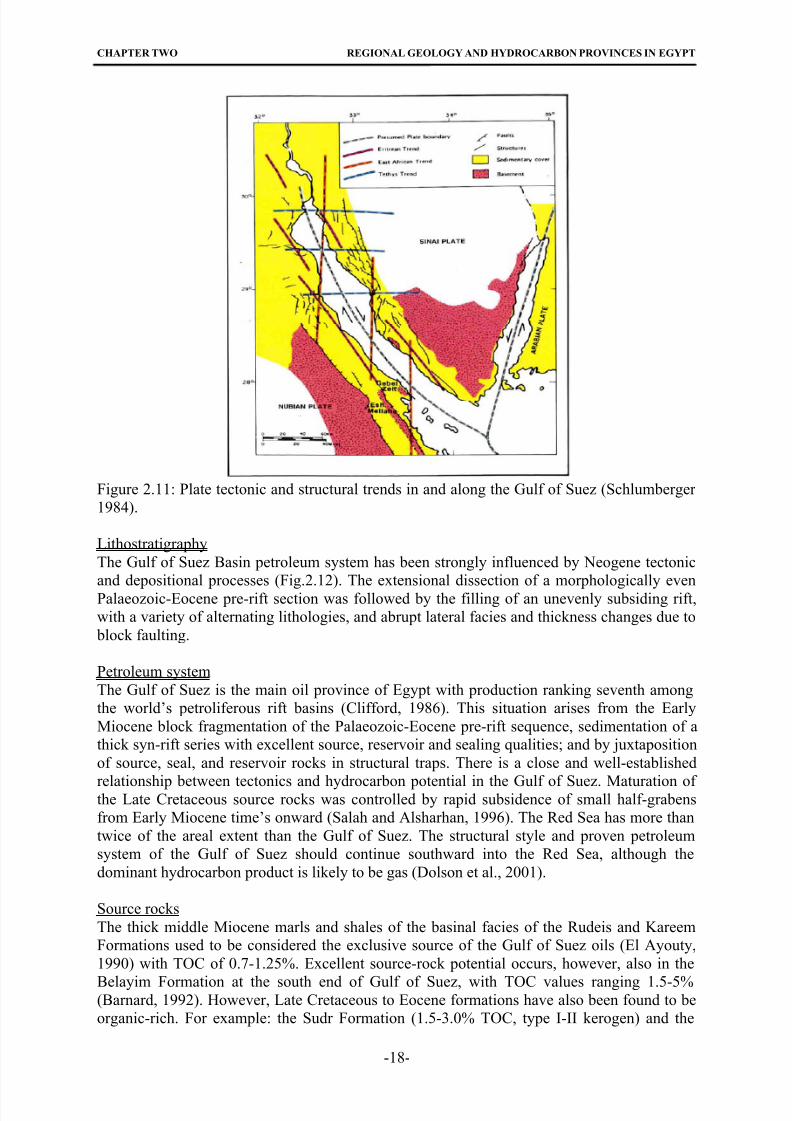
8/22/2019 barakat_moataz.pdf
http://slidepdf.com/reader/full/barakatmoatazpdf 32/158
CHAPTER TWO REGIONAL GEOLOGY AND HYDROCARBON PROVINCES IN EGYPT
Figure 2.11: Plate tectonic and structural trends in and along the Gulf of Suez (Schlumberger
1984).
Lithostratigraphy
The Gulf of Suez Basin petroleum system has been strongly influenced by Neogene tectonic
and depositional processes (Fig.2.12). The extensional dissection of a morphologically even
Palaeozoic-Eocene pre-rift section was followed by the filling of an unevenly subsiding rift,
with a variety of alternating lithologies, and abrupt lateral facies and thickness changes due to
block faulting.
Petroleum system
The Gulf of Suez is the main oil province of Egypt with production ranking seventh among
the world’s petroliferous rift basins (Clifford, 1986). This situation arises from the Early
Miocene block fragmentation of the Palaeozoic-Eocene pre-rift sequence, sedimentation of a
thick syn-rift series with excellent source, reservoir and sealing qualities; and by juxtaposition
of source, seal, and reservoir rocks in structural traps. There is a close and well-established
relationship between tectonics and hydrocarbon potential in the Gulf of Suez. Maturation of the Late Cretaceous source rocks was controlled by rapid subsidence of small half-grabens
from Early Miocene time’s onward (Salah and Alsharhan, 1996). The Red Sea has more than
twice of the areal extent than the Gulf of Suez. The structural style and proven petroleum
system of the Gulf of Suez should continue southward into the Red Sea, although the
dominant hydrocarbon product is likely to be gas (Dolson et al., 2001).
Source rocks
The thick middle Miocene marls and shales of the basinal facies of the Rudeis and Kareem
Formations used to be considered the exclusive source of the Gulf of Suez oils (El Ayouty,
1990) with TOC of 0.7-1.25%. Excellent source-rock potential occurs, however, also in the
Belayim Formation at the south end of Gulf of Suez, with TOC values ranging 1.5-5%(Barnard, 1992). However, Late Cretaceous to Eocene formations have also been found to be
organic-rich. For example: the Sudr Formation (1.5-3.0% TOC, type I-II kerogen) and the
-18-
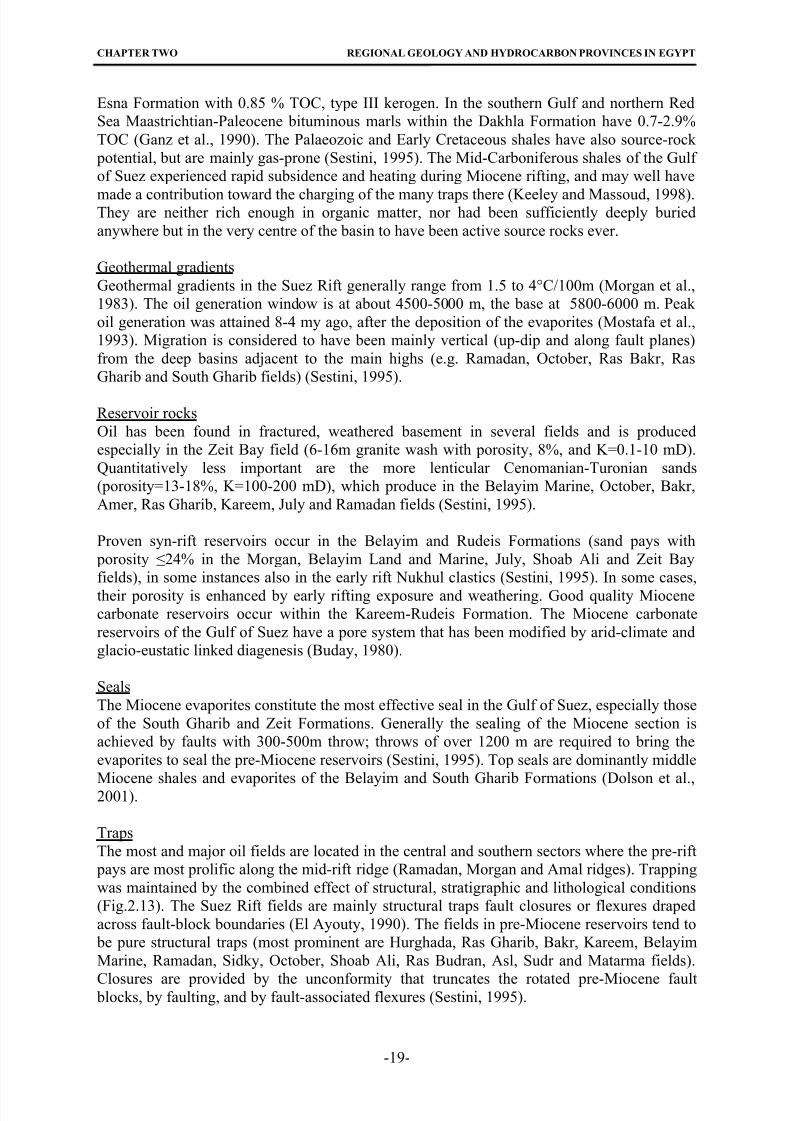
8/22/2019 barakat_moataz.pdf
http://slidepdf.com/reader/full/barakatmoatazpdf 33/158
CHAPTER TWO REGIONAL GEOLOGY AND HYDROCARBON PROVINCES IN EGYPT
Esna Formation with 0.85 % TOC, type III kerogen. In the southern Gulf and northern Red
Sea Maastrichtian-Paleocene bituminous marls within the Dakhla Formation have 0.7-2.9%
TOC (Ganz et al., 1990). The Palaeozoic and Early Cretaceous shales have also source-rock
potential, but are mainly gas-prone (Sestini, 1995). The Mid-Carboniferous shales of the Gulf
of Suez experienced rapid subsidence and heating during Miocene rifting, and may well have
made a contribution toward the charging of the many traps there (Keeley and Massoud, 1998).They are neither rich enough in organic matter, nor had been sufficiently deeply buried
anywhere but in the very centre of the basin to have been active source rocks ever.
Geothermal gradients
Geothermal gradients in the Suez Rift generally range from 1.5 to 4°C/100m (Morgan et al.,
1983). The oil generation window is at about 4500-5000 m, the base at 5800-6000 m. Peak
oil generation was attained 8-4 my ago, after the deposition of the evaporites (Mostafa et al.,
1993). Migration is considered to have been mainly vertical (up-dip and along fault planes)
from the deep basins adjacent to the main highs (e.g. Ramadan, October, Ras Bakr, Ras
Gharib and South Gharib fields) (Sestini, 1995).
Reservoir rocks
Oil has been found in fractured, weathered basement in several fields and is produced
especially in the Zeit Bay field (6-16m granite wash with porosity, 8%, and K=0.1-10 mD).
Quantitatively less important are the more lenticular Cenomanian-Turonian sands
(porosity=13-18%, K=100-200 mD), which produce in the Belayim Marine, October, Bakr,
Amer, Ras Gharib, Kareem, July and Ramadan fields (Sestini, 1995).
Proven syn-rift reservoirs occur in the Belayim and Rudeis Formations (sand pays with
porosity ≤24% in the Morgan, Belayim Land and Marine, July, Shoab Ali and Zeit Bay
fields), in some instances also in the early rift Nukhul clastics (Sestini, 1995). In some cases,
their porosity is enhanced by early rifting exposure and weathering. Good quality Miocene
carbonate reservoirs occur within the Kareem-Rudeis Formation. The Miocene carbonate
reservoirs of the Gulf of Suez have a pore system that has been modified by arid-climate and
glacio-eustatic linked diagenesis (Buday, 1980).
Seals
The Miocene evaporites constitute the most effective seal in the Gulf of Suez, especially those
of the South Gharib and Zeit Formations. Generally the sealing of the Miocene section is
achieved by faults with 300-500m throw; throws of over 1200 m are required to bring the
evaporites to seal the pre-Miocene reservoirs (Sestini, 1995). Top seals are dominantly middle
Miocene shales and evaporites of the Belayim and South Gharib Formations (Dolson et al.,2001).
Traps
The most and major oil fields are located in the central and southern sectors where the pre-rift
pays are most prolific along the mid-rift ridge (Ramadan, Morgan and Amal ridges). Trapping
was maintained by the combined effect of structural, stratigraphic and lithological conditions
(Fig.2.13). The Suez Rift fields are mainly structural traps fault closures or flexures draped
across fault-block boundaries (El Ayouty, 1990). The fields in pre-Miocene reservoirs tend to
be pure structural traps (most prominent are Hurghada, Ras Gharib, Bakr, Kareem, Belayim
Marine, Ramadan, Sidky, October, Shoab Ali, Ras Budran, Asl, Sudr and Matarma fields).
Closures are provided by the unconformity that truncates the rotated pre-Miocene fault blocks, by faulting, and by fault-associated flexures (Sestini, 1995).
-19-
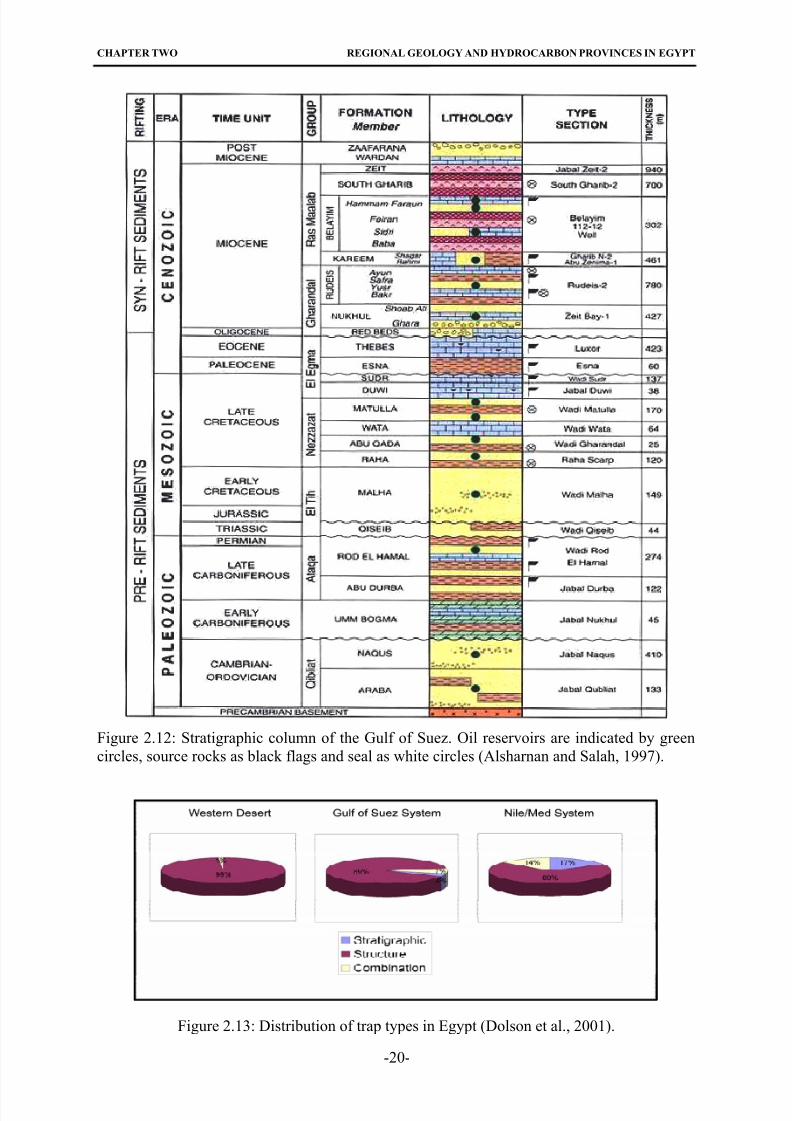
8/22/2019 barakat_moataz.pdf
http://slidepdf.com/reader/full/barakatmoatazpdf 34/158
CHAPTER TWO REGIONAL GEOLOGY AND HYDROCARBON PROVINCES IN EGYPT
Figure 2.12: Stratigraphic column of the Gulf of Suez. Oil reservoirs are indicated by green
circles, source rocks as black flags and seal as white circles (Alsharnan and Salah, 1997).
Figure 2.13: Distribution of trap types in Egypt (Dolson et al., 2001).
-20-
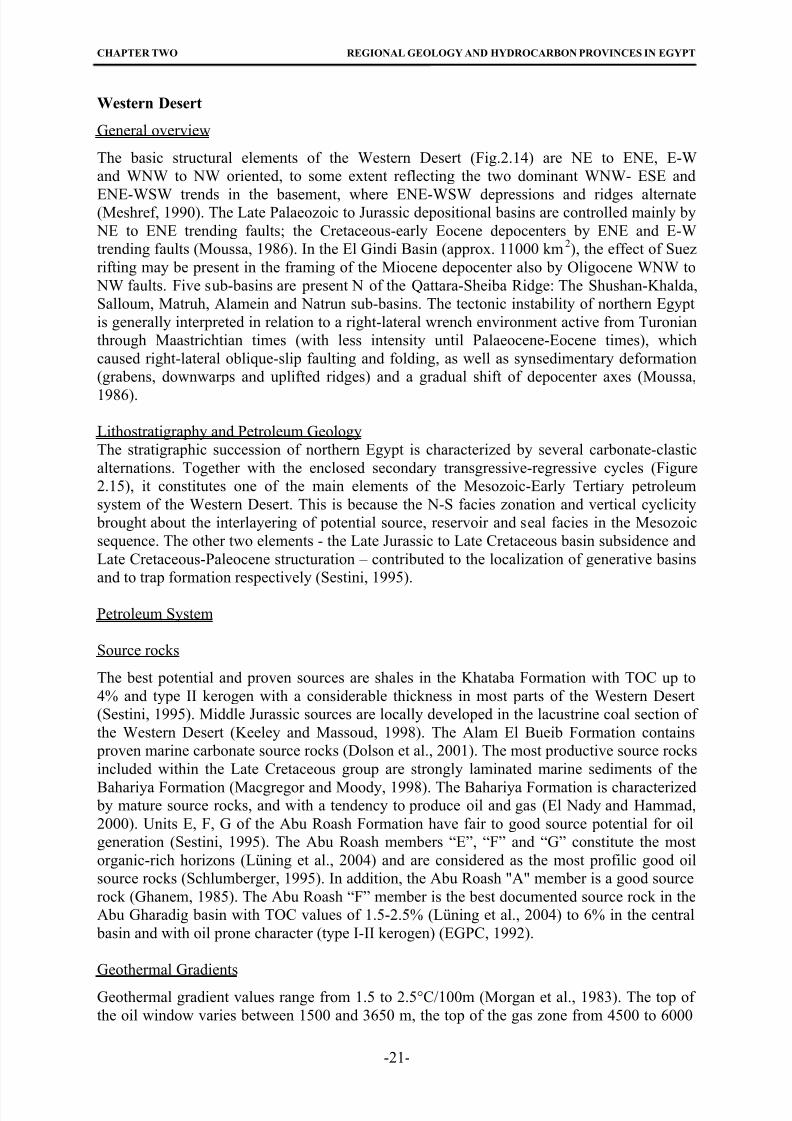
8/22/2019 barakat_moataz.pdf
http://slidepdf.com/reader/full/barakatmoatazpdf 35/158
CHAPTER TWO REGIONAL GEOLOGY AND HYDROCARBON PROVINCES IN EGYPT
Western Desert
General overview
The basic structural elements of the Western Desert (Fig.2.14) are NE to ENE, E-W
and WNW to NW oriented, to some extent reflecting the two dominant WNW- ESE and
ENE-WSW trends in the basement, where ENE-WSW depressions and ridges alternate(Meshref, 1990). The Late Palaeozoic to Jurassic depositional basins are controlled mainly by
NE to ENE trending faults; the Cretaceous-early Eocene depocenters by ENE and E-W
trending faults (Moussa, 1986). In the El Gindi Basin (approx. 11000 km2), the effect of Suez
rifting may be present in the framing of the Miocene depocenter also by Oligocene WNW to
NW faults. Five sub-basins are present N of the Qattara-Sheiba Ridge: The Shushan-Khalda,
Salloum, Matruh, Alamein and Natrun sub-basins. The tectonic instability of northern Egypt
is generally interpreted in relation to a right-lateral wrench environment active from Turonian
through Maastrichtian times (with less intensity until Palaeocene-Eocene times), which
caused right-lateral oblique-slip faulting and folding, as well as synsedimentary deformation
(grabens, downwarps and uplifted ridges) and a gradual shift of depocenter axes (Moussa,
1986).
Lithostratigraphy and Petroleum Geology
The stratigraphic succession of northern Egypt is characterized by several carbonate-clastic
alternations. Together with the enclosed secondary transgressive-regressive cycles (Figure
2.15), it constitutes one of the main elements of the Mesozoic-Early Tertiary petroleum
system of the Western Desert. This is because the N-S facies zonation and vertical cyclicity
brought about the interlayering of potential source, reservoir and seal facies in the Mesozoic
sequence. The other two elements - the Late Jurassic to Late Cretaceous basin subsidence and
Late Cretaceous-Paleocene structuration – contributed to the localization of generative basins
and to trap formation respectively (Sestini, 1995).
Petroleum System
Source rocks
The best potential and proven sources are shales in the Khataba Formation with TOC up to
4% and type II kerogen with a considerable thickness in most parts of the Western Desert
(Sestini, 1995). Middle Jurassic sources are locally developed in the lacustrine coal section of
the Western Desert (Keeley and Massoud, 1998). The Alam El Bueib Formation contains
proven marine carbonate source rocks (Dolson et al., 2001). The most productive source rocks
included within the Late Cretaceous group are strongly laminated marine sediments of the
Bahariya Formation (Macgregor and Moody, 1998). The Bahariya Formation is characterized by mature source rocks, and with a tendency to produce oil and gas (El Nady and Hammad,
2000). Units E, F, G of the Abu Roash Formation have fair to good source potential for oil
generation (Sestini, 1995). The Abu Roash members “E”, “F” and “G” constitute the most
organic-rich horizons (Lüning et al., 2004) and are considered as the most profilic good oil
source rocks (Schlumberger, 1995). In addition, the Abu Roash "A" member is a good source
rock (Ghanem, 1985). The Abu Roash “F” member is the best documented source rock in the
Abu Gharadig basin with TOC values of 1.5-2.5% (Lüning et al., 2004) to 6% in the central
basin and with oil prone character (type I-II kerogen) (EGPC, 1992).
Geothermal Gradients
Geothermal gradient values range from 1.5 to 2.5°C/100m (Morgan et al., 1983). The top of
the oil window varies between 1500 and 3650 m, the top of the gas zone from 4500 to 6000
-21-
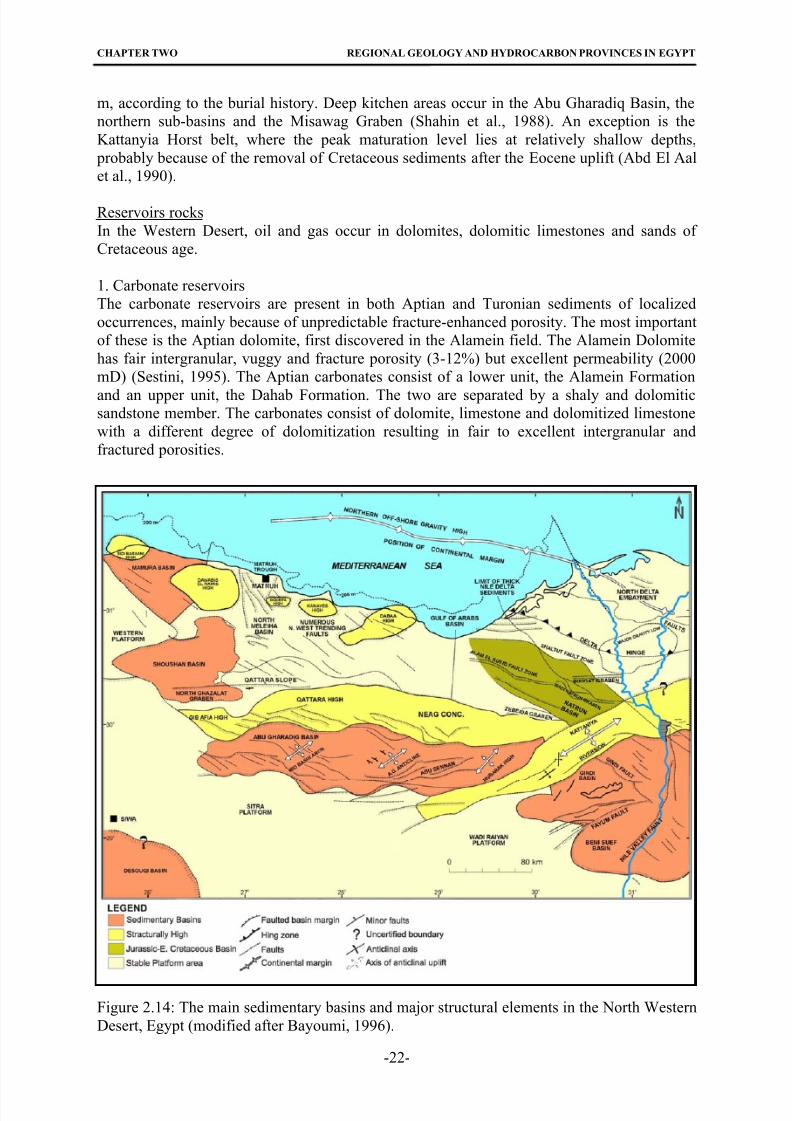
8/22/2019 barakat_moataz.pdf
http://slidepdf.com/reader/full/barakatmoatazpdf 36/158
CHAPTER TWO REGIONAL GEOLOGY AND HYDROCARBON PROVINCES IN EGYPT
m, according to the burial history. Deep kitchen areas occur in the Abu Gharadiq Basin, the
northern sub-basins and the Misawag Graben (Shahin et al., 1988). An exception is the
Kattanyia Horst belt, where the peak maturation level lies at relatively shallow depths,
probably because of the removal of Cretaceous sediments after the Eocene uplift (Abd El Aal
et al., 1990).
Reservoirs rocks
In the Western Desert, oil and gas occur in dolomites, dolomitic limestones and sands of
Cretaceous age.
1. Carbonate reservoirs
The carbonate reservoirs are present in both Aptian and Turonian sediments of localized
occurrences, mainly because of unpredictable fracture-enhanced porosity. The most important
of these is the Aptian dolomite, first discovered in the Alamein field. The Alamein Dolomite
has fair intergranular, vuggy and fracture porosity (3-12%) but excellent permeability (2000
mD) (Sestini, 1995). The Aptian carbonates consist of a lower unit, the Alamein Formation
and an upper unit, the Dahab Formation. The two are separated by a shaly and dolomiticsandstone member. The carbonates consist of dolomite, limestone and dolomitized limestone
with a different degree of dolomitization resulting in fair to excellent intergranular and
fractured porosities.
Figure 2.14: The main sedimentary basins and major structural elements in the North Western
Desert, Egypt (modified after Bayoumi, 1996).
-22-
8/22/2019 barakat_moataz.pdf
http://slidepdf.com/reader/full/barakatmoatazpdf 37/158
CHAPTER TWO REGIONAL GEOLOGY AND HYDROCARBON PROVINCES IN EGYPT
Figure 2.15: Lithostratigraphic column of the northern Western Desert region of Egypt.
-23-
8/22/2019 barakat_moataz.pdf
http://slidepdf.com/reader/full/barakatmoatazpdf 38/158
CHAPTER TWO REGIONAL GEOLOGY AND HYDROCARBON PROVINCES IN EGYPT
Carbonate reservoirs are present in Abu Roash (D) and (F) units of Turonian age and the Abu
Roash (G) units of late Cenomanian age (El Ayouty, 1990). The Abu Roash D, F and G
dolomite units are oil-bearing in the Abu Gharadiq, WD 33, WD 19, Alamein and Razzak
fields (Sestini, 1995). Intergranular porosity is seen in carbonates of the "D" Member. The
Khoman chalky limestones constitute a gas reservoir (3-60 m pay with 10-30% porosity)
(Sestini, 1995).
2. Sandstone reservoirs
The Jurassic is poorly explored probably because of being buried in considerable depths
particularly in the basin. The Jurassic Khataba sandstones, though oil and gas bearing in the
Meleiha and Salam fields and in other findings, are of low reservoir quality, on account of
quartz cementation (Kholeif et al., 1986). The Cretaceous sandstone reservoirs belong to
different stratigraphic levels starting from the Albian Kharita sands, Early Cenomanian
Bahariya sands (El Ayouty, 1990), and the Turonian Abu Roash "C", "E" and "G" sands and
are good reservoir rocks. The Kharita Formation provides a major oil/gas reservoir in the Badr
El Din concession (Barakat, 1982). Many of the very fine- to medium-grained sandstones
have good porosities and permeabilities (porosity =15-30%, K=100-300 m D) (Sestini, 1995).In the Bahariya Formation clean quartzose sandstones to argillaceous-glauconitic sandstones
with 18-25% porosity and permeabiliy up to 500mD, contain oil in the majority of the
Western Desert fields (Sestini, 1995).
Sandstones within the Bahariya Formation are the main gas and/or condensate producing
horizons in the Razzak, Aghar, Ahram, Meleiha, Abu Gharadig, and Bed fields (EGPC,
1992). The reservoir sandstone intervals of the Abu Roash (“C”, “E” & “G”) members, and
the Bahariya and Kharita Formations are well explored. Intergranular porosity is seen in
sandstones of the Abu Roash "C", "E" and "G" Members. In Egypt, the massive sandstones of
the Bahariya and Abu Roash Formations (Cenomanian and Santonian) contain over 90% of
the known reserves.
Other proven reservoirs are the Aptian Dahab and Cenomanian Razzak sandstones (porosity
~18-25%) and those present in units A, C, E, G of the Abu Roash Formation (Sestini, 1995).
Evaluation of reservoir sandstone trends in the Bahariya, Khataba and Alam El Bueib
Formations is difficult, because of poor continuity, resulting from rapid lateral facies changes
in shallow marine, tidal flat to lagoonal environments (Sestini, 1995).
Seals
The Western Desert reservoirs are generally sealed by local intra-formational shale, compact
limestone and dolomite beds of Cretaceous and Eocene age, which can form efficient caprocks. Likewise, shales and limestones of Turonian and younger Cretaceous units are believed
to be sealing off any oil trapped within the Cenomanian-Turonian porous sequence (El
Ayouty, 1990). Best sealing conditions are said to occur in basinal areas rather than on
ridge/platform areas, where the sequences become more sandy (Sultan and Abd El Halim,
1988). The vertical sealing is provided by both intercalated shale and tight limestone intervals.
The shale and carbonate intervals of the Abu Roash Formation are effective vertical and
lateral seals. Moreover; the overlying Paleocene chalks provide a top seal, forcing oil into
older reservoirs or, as in the Abu Gharadiq field, maintaining it within interbedded fractured
and vuggy Abu Roash limestones (Keeley and Massoud, 1998).
TrapsMost of the hydrocarbons discovered in the Western Desert were drilled as structural
prospects, either in the form of three or four way closure structures or as fault block
-24-
8/22/2019 barakat_moataz.pdf
http://slidepdf.com/reader/full/barakatmoatazpdf 39/158
CHAPTER TWO REGIONAL GEOLOGY AND HYDROCARBON PROVINCES IN EGYPT
-25-
structures. Most of the existing oil fields are located at the intersections between NW and NE
trending fault systems (Sultan and Abd El Halim, 1988). Most fields are related to structures
formed in Late Cretaceous-Eocene times and are placed in, or at the edge of early depocenters
that later became kitchen areas (Abu El Naga, 1984). Several oilfield groups are four-way
closures arranged en-echelon, right stepping in relation to strike slip movements (e.g. Safir-
Salam-Meleiha, Abu Sennan and Aghar-Razzak-Alamein trends (Sultan and Abd El Halim,1988). The structural elements were the main factor determining the trapping of oil in almost
all of the discoveries. Syrian Arc-related structural trends form the bulk of the productive
traps discovered in the Western Desert (Dolson et al., 2001). The size of structures and the
sealing integrity of faults were negatively affected by repeated fault rejuvenation and by the
re-arrangement of local stress (Sestini, 1995).
Oil and gas types
The Western Desert oils are non-biodegraded normal crudes with gravities ranging from 25 to
40°API (in 40 pools) and 41 to 45°API (in 27 pools; only 6 pools have oils under 25° API).
There are two main oil groups (EGPC, 1992):
1. The Abu Gharadiq group, with negative isotope values, low to moderate pristine/phytane ratios, low wax content, low to moderate sulphur content (< 3%), and
mainly moderate maturity levels.
2. The Umbarka-type oils, which are characterized by a high wax content, high
pristine/phytane ratios, lesser negative isotope values, very low sulphur content and
relatively high maturity levels. They were derived from a largely terrestrial source
(probably the Khataba Formation) (Sestini, 1995).
8/22/2019 barakat_moataz.pdf
http://slidepdf.com/reader/full/barakatmoatazpdf 40/158
CHAPTER THREE GEOLOGY OF THE NILE DELTA
CHAPTER THREE
GEOLOGY OF THE NILE DELTA
3.1. General View
The geological knowledge of the Nile Delta is still somewhat limited, as the area does not
have any exposures of ancient rocks since it is covered by Holocene soils. The Tertiary and
Mesozoic stratigraphic sequences, which are exposed along the borders of the Delta and in the
Western Desert, are better known. Information about the stratigraphy of Nile Delta has been
gathered by Said (1962) and elaborated by Salem (1976) for construction of sedimentation
models of northern Egypt.
In general, the Nile Delta is a topographically featureless surface with a northward slope
except for some limited topographic features such as the Khataba positive structural
topographic element which is located in the south and the Wadi El Natrun negative structuralelement which is located to the west (Azzam, 1994).
The hydrocarbon potential of the Nile Delta sedimentary sequence is, for the time being,
limited to the Neogene formations, trapped against listric fault planes or by tilted fault blocks.
However, pre-Miocene formations may also be considered as having hydrocarbon potential.
They are confined to the platform and it is along the hinge line where they might be
developed as high-energy deposits such as reefal build-ups.
While investigating the structure and sedimentary history of the southern Mediterranean Sea
Ross and Uchupi (1977) reported that the present River Nile Valley is a recent feature,
probably cut into the anterior sediments during the Late Miocene; and that during MiddleMiocene the northern part of the present Delta was an embayment bordered from east and
west by Cretaceous and Eocene cliffs which were higher than 1000 m above the Miocene Sea.
During Late Miocene, the northern part of the region, now occupied by the delta, dried up due
to a regression of the sea. This event was accompanied by the deposition of anhydrites
alternating with stromatolitic carbonates. At that time, the drainage system changed its
direction from the northwest to the north because of an eastward tilting of the land (Salem,
1967).
In a study of the Neogene-Quaternary sedimentary basins of the Nile Delta, Zaghloul, et al.,
(1977) delineated older shorelines for the depositional basins in the area from the middle
Miocene to the Holocene. An east west belt running across the delta and passing by Shibin El
Kom and Abu Hammad seems to have divided the delta area tectonically into two blocks, a
southern higher block and a northern lower block. This narrow belt represents the hinge zone
between the stable Mesozoic platform to the south (buried African plate margin) and the
mobile Delta (Tertiary – Quaternary) basin to the north.
According to Rizzini et al. (1978), the stratigraphy and sedimentation of the Neogene-
Quaternary section in the Nile Delta comprises three cycles of sedimentation. These are of
Miocene, Plio-Pleistocene and Holocene age. They further subdivided the Plio-Pleistocene-
Holocene sequence into two rock units, the Mit Ghamr and Bilqas Formations.
Said (1981), dealing with the geology of the River Nile, reported that the middle Pleistocene
unit (Prenile-episode) is related to the Riss and Mindel glaciations. He added that the late
Pleistocene Pluvial, which corresponds to the Neonile-episode, is related to the glaciations.
-26-
8/22/2019 barakat_moataz.pdf
http://slidepdf.com/reader/full/barakatmoatazpdf 41/158
CHAPTER THREE GEOLOGY OF THE NILE DELTA
Studying the pattern of sedimentation of the Quaternary Nile Delta, Zaghloul et al. (1986)
reported that the stratigraphic correlation of the deltaic sections shows marked thickness and
facies variations. The thicknesses of the Quaternary sediments increase gradually from south
to north and abruptly towards the northeast and north-west. This increase in thickness was
accompanied by subsidence during sedimentation on the downthrown side of the hinge zone
(growth fault). A strong variation in lithology is also recorded from south to north in the NileDelta. The southern parts as well as the eastern side are characterized by the dominance of
sands with lenses of gravel.
The offshore Delta sections indicate remarkable rhythmic variation in lithology: sands
alternate with clays. Four major fining-upward sequences have been recognized in the central
northern part of the Delta. They represent four regressive-transgressive cycles of the
Mediterranean Sea during the Quaternary.
3.2. Shape of the Deltas
Deltas are discrete shoreline protuberances formed where a river enters a standing body of water and supplies sediments more rapidly than they can be redistributed by basinal processes
(Elliott, 1986). All deltas are river-dominated and are fundamentally regressive in nature. The
morphology and facies architecture of a delta is controlled by the proportion of wave, tide,
and river processes. Other depositional environments, such as wave-formed shore faces or
barrier-lagoons can form significant components of larger wave influenced deltas, but
conversely smaller lagoonal deltas can form within larger barrier-island or estuarine systems.
Distributary channels may show several orders of sizes and shapes as they bifurcate
downstream around distributary mouth bars. Bifurcation is inhibited in strongly wave-
influenced deltas, resulting in relatively few terminal distributary channels and mouth bars
flanked by extensive wave-formed sandy barriers or strand plain deposits. As the deltas
prograde, they form upward-coarsening facies successions, as sandy mouth bars and delta-front sediments accumulate over muddy deeper-water pro-delta facies.
The deposits at the mouth of a river are usually roughly triangular in shape. The triangular
shape and the increased width at the base are due to blocking of the river mouth, with
resulting continuous formation of distributaries at angles to the original course. These
distributaries start out flowing fairly fast, but slow in speed as more sediment is deposited and
ultimately, the water flows elsewhere. This change in flow affects the particle size in the
suspended and bed loads, the size of the particles decreases as the flow slows and the larger
particles are deposited. This deposition goes on continually in a cyclic fashion, creating
alternating sediment beds of coarse and fine grain deposits. The sediment load is dispersed
and deposited, with coarse-grained bedload sediment tending to accumulate near the river mouth, whilst finer grained sediment is transported offshore in suspension, to be deposited in
deeper water areas. Basinal processes, such as waves, tides and oceanic currents may assist in
dispersion and also rework sediments deposited from the fluvial currents (Dalrymple et al.
1992).
On the basis of a qualitative comparison of modern deltas, two main types are distinguished
(Reading, 1986): High-constructive deltas, dominated by fluvial processes and high-
destructive deltas, dominated by basinal processes. Lobate and birdfoot types are recognized
in the high-constructive class, while wave-dominated and tide-dominated types are
distinguished in the high-destructive class (Fig.3.1). Each type is distinguished by a
characteristic morphology and facies pattern, described in terms of vertical sequences, areal
facies distribution and sand body geometry.
-27-
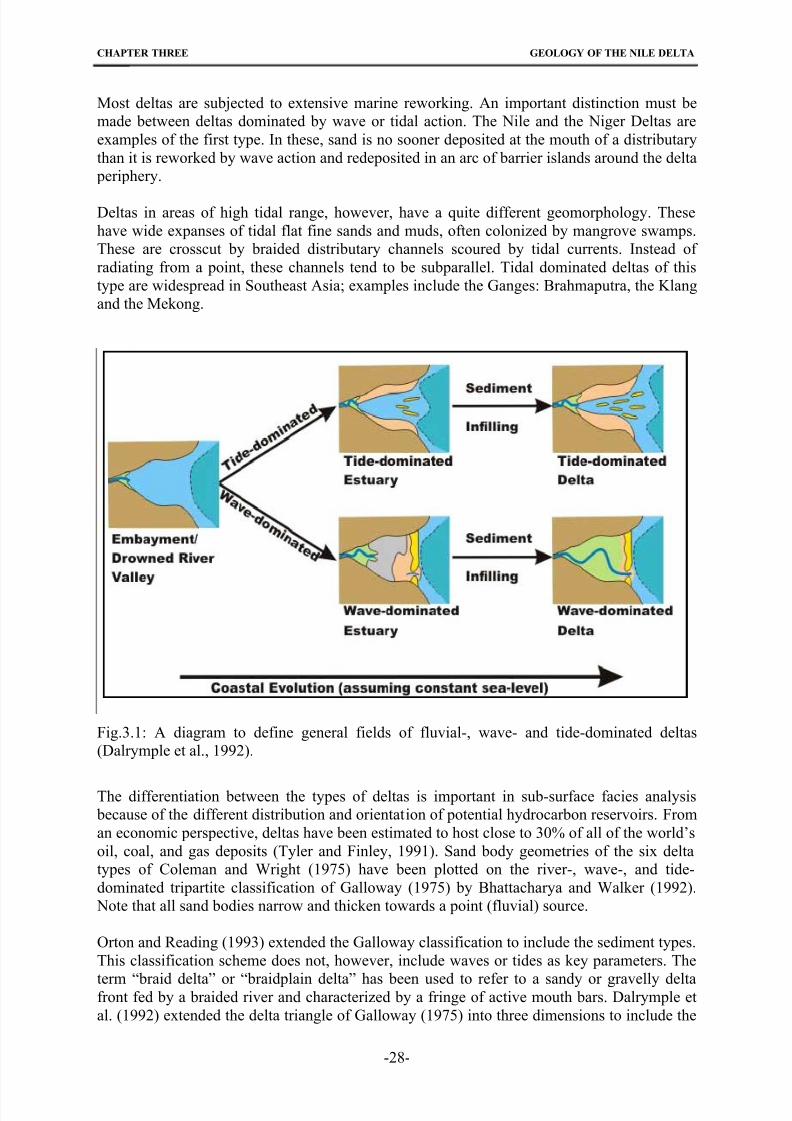
8/22/2019 barakat_moataz.pdf
http://slidepdf.com/reader/full/barakatmoatazpdf 42/158
CHAPTER THREE GEOLOGY OF THE NILE DELTA
Most deltas are subjected to extensive marine reworking. An important distinction must be
made between deltas dominated by wave or tidal action. The Nile and the Niger Deltas are
examples of the first type. In these, sand is no sooner deposited at the mouth of a distributary
than it is reworked by wave action and redeposited in an arc of barrier islands around the delta
periphery.
Deltas in areas of high tidal range, however, have a quite different geomorphology. These
have wide expanses of tidal flat fine sands and muds, often colonized by mangrove swamps.
These are crosscut by braided distributary channels scoured by tidal currents. Instead of
radiating from a point, these channels tend to be subparallel. Tidal dominated deltas of this
type are widespread in Southeast Asia; examples include the Ganges: Brahmaputra, the Klang
and the Mekong.
Fig.3.1: A diagram to define general fields of fluvial-, wave- and tide-dominated deltas
(Dalrymple et al., 1992).
The differentiation between the types of deltas is important in sub-surface facies analysis
because of the different distribution and orientation of potential hydrocarbon reservoirs. From
an economic perspective, deltas have been estimated to host close to 30% of all of the world’s
oil, coal, and gas deposits (Tyler and Finley, 1991). Sand body geometries of the six delta
types of Coleman and Wright (1975) have been plotted on the river-, wave-, and tide-
dominated tripartite classification of Galloway (1975) by Bhattacharya and Walker (1992).
Note that all sand bodies narrow and thicken towards a point (fluvial) source.
Orton and Reading (1993) extended the Galloway classification to include the sediment types.
This classification scheme does not, however, include waves or tides as key parameters. The
term “braid delta” or “braidplain delta” has been used to refer to a sandy or gravelly deltafront fed by a braided river and characterized by a fringe of active mouth bars. Dalrymple et
al. (1992) extended the delta triangle of Galloway (1975) into three dimensions to include the
-28-
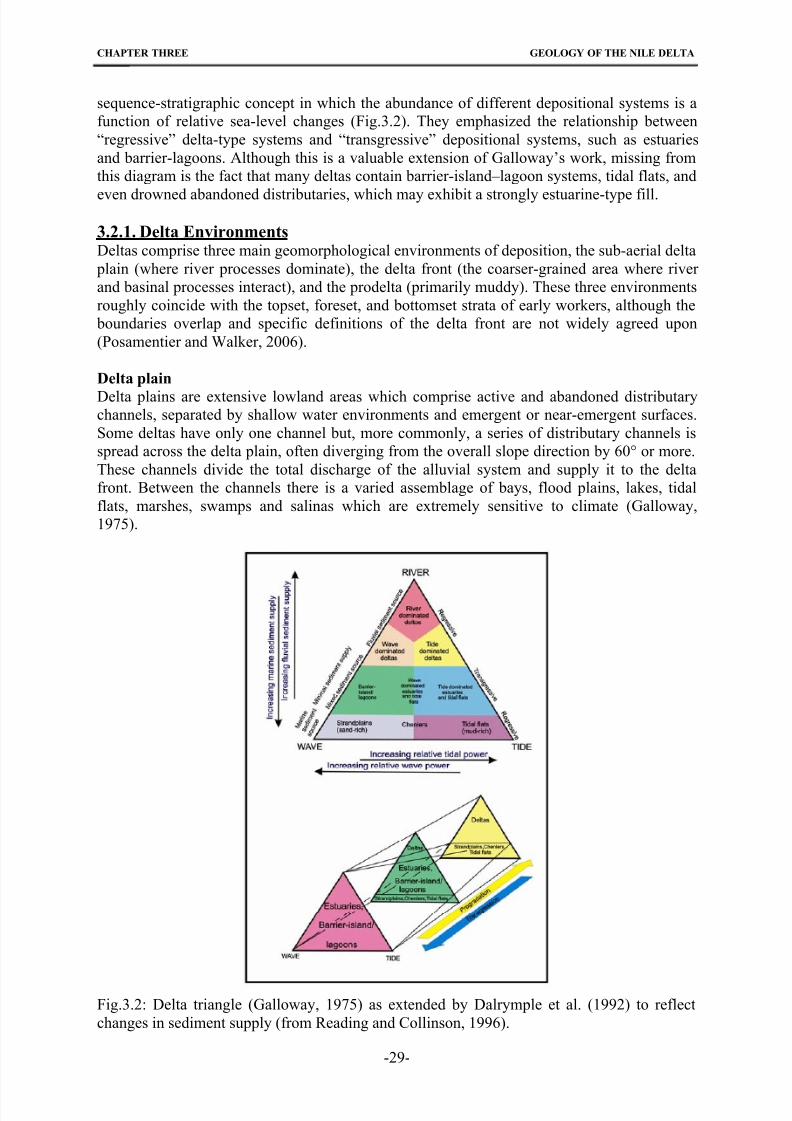
8/22/2019 barakat_moataz.pdf
http://slidepdf.com/reader/full/barakatmoatazpdf 43/158
CHAPTER THREE GEOLOGY OF THE NILE DELTA
sequence-stratigraphic concept in which the abundance of different depositional systems is a
function of relative sea-level changes (Fig.3.2). They emphasized the relationship between
“regressive” delta-type systems and “transgressive” depositional systems, such as estuaries
and barrier-lagoons. Although this is a valuable extension of Galloway’s work, missing from
this diagram is the fact that many deltas contain barrier-island–lagoon systems, tidal flats, and
even drowned abandoned distributaries, which may exhibit a strongly estuarine-type fill.
3.2.1. Delta EnvironmentsDeltas comprise three main geomorphological environments of deposition, the sub-aerial delta
plain (where river processes dominate), the delta front (the coarser-grained area where river
and basinal processes interact), and the prodelta (primarily muddy). These three environments
roughly coincide with the topset, foreset, and bottomset strata of early workers, although the
boundaries overlap and specific definitions of the delta front are not widely agreed upon
(Posamentier and Walker, 2006).
Delta plain
Delta plains are extensive lowland areas which comprise active and abandoned distributarychannels, separated by shallow water environments and emergent or near-emergent surfaces.
Some deltas have only one channel but, more commonly, a series of distributary channels is
spread across the delta plain, often diverging from the overall slope direction by 60° or more.
These channels divide the total discharge of the alluvial system and supply it to the delta
front. Between the channels there is a varied assemblage of bays, flood plains, lakes, tidal
flats, marshes, swamps and salinas which are extremely sensitive to climate (Galloway,
1975).
Fig.3.2: Delta triangle (Galloway, 1975) as extended by Dalrymple et al. (1992) to reflect
changes in sediment supply (from Reading and Collinson, 1996).
-29-
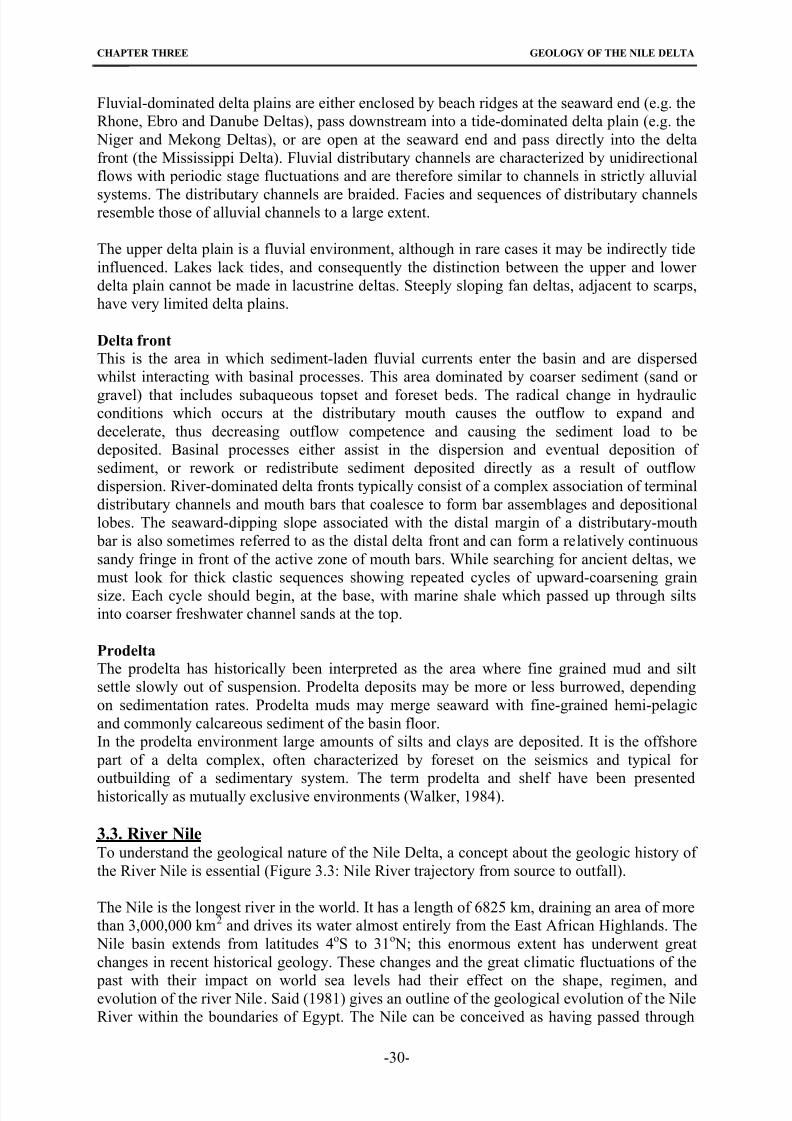
8/22/2019 barakat_moataz.pdf
http://slidepdf.com/reader/full/barakatmoatazpdf 44/158
CHAPTER THREE GEOLOGY OF THE NILE DELTA
Fluvial-dominated delta plains are either enclosed by beach ridges at the seaward end (e.g. the
Rhone, Ebro and Danube Deltas), pass downstream into a tide-dominated delta plain (e.g. the
Niger and Mekong Deltas), or are open at the seaward end and pass directly into the delta
front (the Mississippi Delta). Fluvial distributary channels are characterized by unidirectional
flows with periodic stage fluctuations and are therefore similar to channels in strictly alluvial
systems. The distributary channels are braided. Facies and sequences of distributary channelsresemble those of alluvial channels to a large extent.
The upper delta plain is a fluvial environment, although in rare cases it may be indirectly tide
influenced. Lakes lack tides, and consequently the distinction between the upper and lower
delta plain cannot be made in lacustrine deltas. Steeply sloping fan deltas, adjacent to scarps,
have very limited delta plains.
Delta front
This is the area in which sediment-laden fluvial currents enter the basin and are dispersed
whilst interacting with basinal processes. This area dominated by coarser sediment (sand or
gravel) that includes subaqueous topset and foreset beds. The radical change in hydraulicconditions which occurs at the distributary mouth causes the outflow to expand and
decelerate, thus decreasing outflow competence and causing the sediment load to be
deposited. Basinal processes either assist in the dispersion and eventual deposition of
sediment, or rework or redistribute sediment deposited directly as a result of outflow
dispersion. River-dominated delta fronts typically consist of a complex association of terminal
distributary channels and mouth bars that coalesce to form bar assemblages and depositional
lobes. The seaward-dipping slope associated with the distal margin of a distributary-mouth
bar is also sometimes referred to as the distal delta front and can form a relatively continuous
sandy fringe in front of the active zone of mouth bars. While searching for ancient deltas, we
must look for thick clastic sequences showing repeated cycles of upward-coarsening grain
size. Each cycle should begin, at the base, with marine shale which passed up through silts
into coarser freshwater channel sands at the top.
Prodelta
The prodelta has historically been interpreted as the area where fine grained mud and silt
settle slowly out of suspension. Prodelta deposits may be more or less burrowed, depending
on sedimentation rates. Prodelta muds may merge seaward with fine-grained hemi-pelagic
and commonly calcareous sediment of the basin floor.
In the prodelta environment large amounts of silts and clays are deposited. It is the offshore
part of a delta complex, often characterized by foreset on the seismics and typical for
outbuilding of a sedimentary system. The term prodelta and shelf have been presentedhistorically as mutually exclusive environments (Walker, 1984).
3.3. River NileTo understand the geological nature of the Nile Delta, a concept about the geologic history of
the River Nile is essential (Figure 3.3: Nile River trajectory from source to outfall).
The Nile is the longest river in the world. It has a length of 6825 km, draining an area of more
than 3,000,000 km2 and drives its water almost entirely from the East African Highlands. The
Nile basin extends from latitudes 4oS to 31o N; this enormous extent has underwent great
changes in recent historical geology. These changes and the great climatic fluctuations of the
past with their impact on world sea levels had their effect on the shape, regimen, andevolution of the river Nile. Said (1981) gives an outline of the geological evolution of the Nile
River within the boundaries of Egypt. The Nile can be conceived as having passed through
-30-
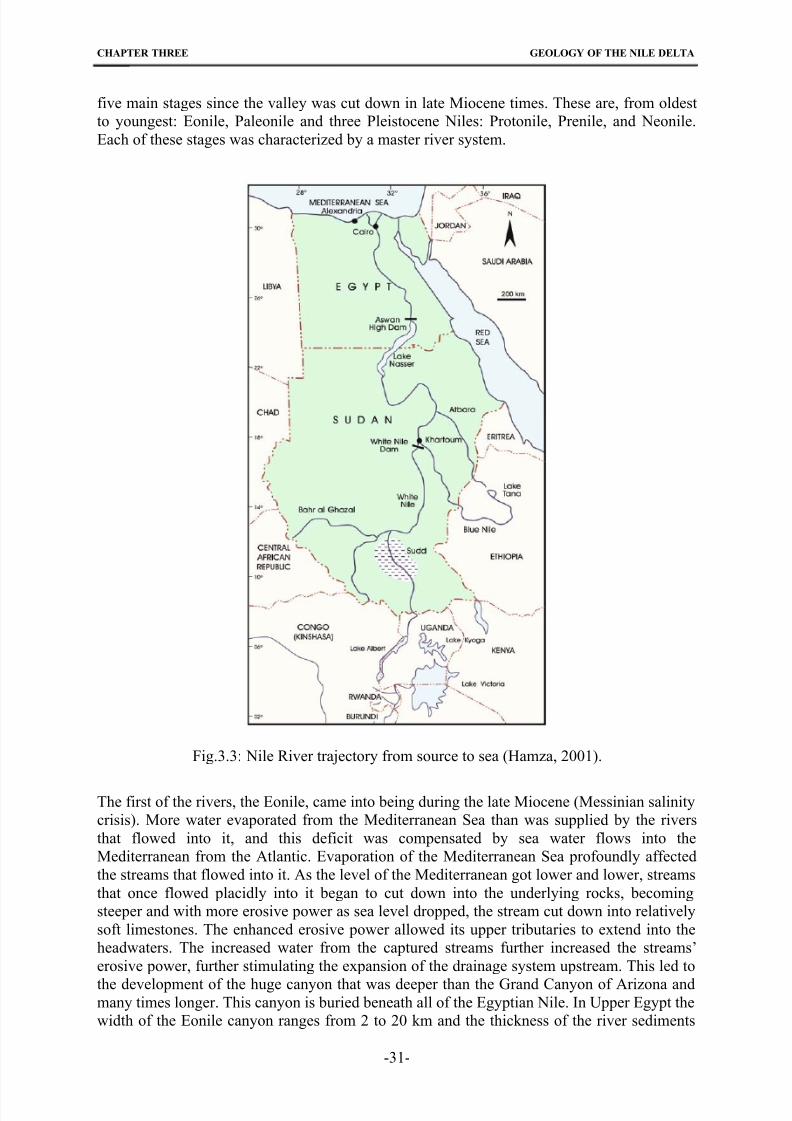
8/22/2019 barakat_moataz.pdf
http://slidepdf.com/reader/full/barakatmoatazpdf 45/158
CHAPTER THREE GEOLOGY OF THE NILE DELTA
five main stages since the valley was cut down in late Miocene times. These are, from oldest
to youngest: Eonile, Paleonile and three Pleistocene Niles: Protonile, Prenile, and Neonile.
Each of these stages was characterized by a master river system.
Fig.3.3: Nile River trajectory from source to sea (Hamza, 2001).
The first of the rivers, the Eonile, came into being during the late Miocene (Messinian salinity
crisis). More water evaporated from the Mediterranean Sea than was supplied by the rivers
that flowed into it, and this deficit was compensated by sea water flows into the
Mediterranean from the Atlantic. Evaporation of the Mediterranean Sea profoundly affected
the streams that flowed into it. As the level of the Mediterranean got lower and lower, streams
that once flowed placidly into it began to cut down into the underlying rocks, becoming
steeper and with more erosive power as sea level dropped, the stream cut down into relatively
soft limestones. The enhanced erosive power allowed its upper tributaries to extend into the
headwaters. The increased water from the captured streams further increased the streams’
erosive power, further stimulating the expansion of the drainage system upstream. This led to
the development of the huge canyon that was deeper than the Grand Canyon of Arizona andmany times longer. This canyon is buried beneath all of the Egyptian Nile. In Upper Egypt the
width of the Eonile canyon ranges from 2 to 20 km and the thickness of the river sediments
-31-
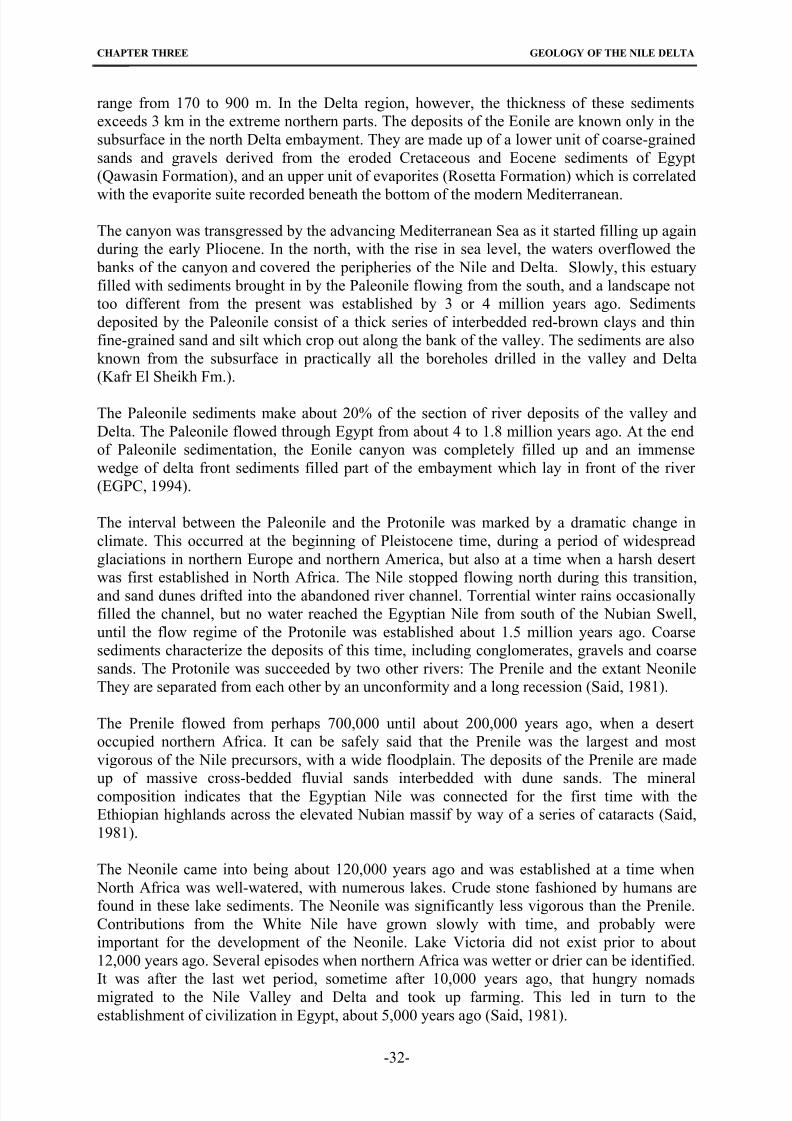
8/22/2019 barakat_moataz.pdf
http://slidepdf.com/reader/full/barakatmoatazpdf 46/158
CHAPTER THREE GEOLOGY OF THE NILE DELTA
range from 170 to 900 m. In the Delta region, however, the thickness of these sediments
exceeds 3 km in the extreme northern parts. The deposits of the Eonile are known only in the
subsurface in the north Delta embayment. They are made up of a lower unit of coarse-grained
sands and gravels derived from the eroded Cretaceous and Eocene sediments of Egypt
(Qawasin Formation), and an upper unit of evaporites (Rosetta Formation) which is correlated
with the evaporite suite recorded beneath the bottom of the modern Mediterranean.
The canyon was transgressed by the advancing Mediterranean Sea as it started filling up again
during the early Pliocene. In the north, with the rise in sea level, the waters overflowed the
banks of the canyon and covered the peripheries of the Nile and Delta. Slowly, this estuary
filled with sediments brought in by the Paleonile flowing from the south, and a landscape not
too different from the present was established by 3 or 4 million years ago. Sediments
deposited by the Paleonile consist of a thick series of interbedded red-brown clays and thin
fine-grained sand and silt which crop out along the bank of the valley. The sediments are also
known from the subsurface in practically all the boreholes drilled in the valley and Delta
(Kafr El Sheikh Fm.).
The Paleonile sediments make about 20% of the section of river deposits of the valley and
Delta. The Paleonile flowed through Egypt from about 4 to 1.8 million years ago. At the end
of Paleonile sedimentation, the Eonile canyon was completely filled up and an immense
wedge of delta front sediments filled part of the embayment which lay in front of the river
(EGPC, 1994).
The interval between the Paleonile and the Protonile was marked by a dramatic change in
climate. This occurred at the beginning of Pleistocene time, during a period of widespread
glaciations in northern Europe and northern America, but also at a time when a harsh desert
was first established in North Africa. The Nile stopped flowing north during this transition,
and sand dunes drifted into the abandoned river channel. Torrential winter rains occasionally
filled the channel, but no water reached the Egyptian Nile from south of the Nubian Swell,
until the flow regime of the Protonile was established about 1.5 million years ago. Coarse
sediments characterize the deposits of this time, including conglomerates, gravels and coarse
sands. The Protonile was succeeded by two other rivers: The Prenile and the extant Neonile
They are separated from each other by an unconformity and a long recession (Said, 1981).
The Prenile flowed from perhaps 700,000 until about 200,000 years ago, when a desert
occupied northern Africa. It can be safely said that the Prenile was the largest and most
vigorous of the Nile precursors, with a wide floodplain. The deposits of the Prenile are made
up of massive cross-bedded fluvial sands interbedded with dune sands. The mineralcomposition indicates that the Egyptian Nile was connected for the first time with the
Ethiopian highlands across the elevated Nubian massif by way of a series of cataracts (Said,
1981).
The Neonile came into being about 120,000 years ago and was established at a time when
North Africa was well-watered, with numerous lakes. Crude stone fashioned by humans are
found in these lake sediments. The Neonile was significantly less vigorous than the Prenile.
Contributions from the White Nile have grown slowly with time, and probably were
important for the development of the Neonile. Lake Victoria did not exist prior to about
12,000 years ago. Several episodes when northern Africa was wetter or drier can be identified.
It was after the last wet period, sometime after 10,000 years ago, that hungry nomadsmigrated to the Nile Valley and Delta and took up farming. This led in turn to the
establishment of civilization in Egypt, about 5,000 years ago (Said, 1981).
-32-
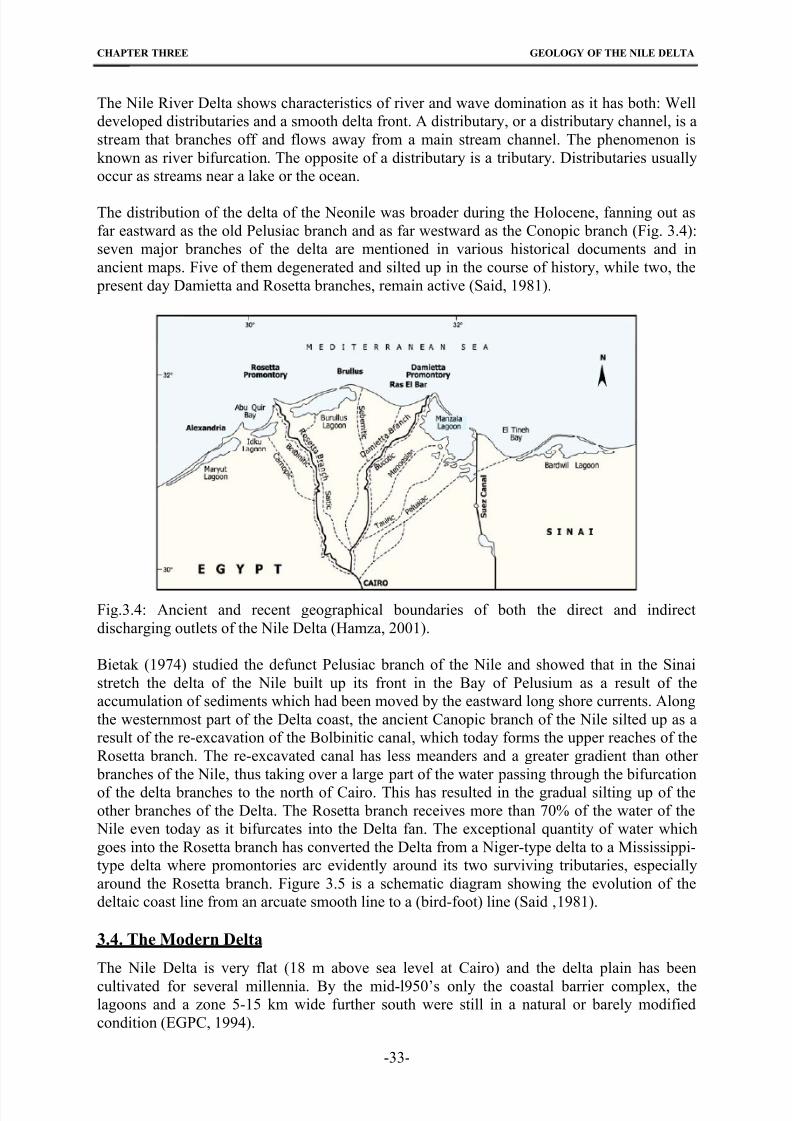
8/22/2019 barakat_moataz.pdf
http://slidepdf.com/reader/full/barakatmoatazpdf 47/158
CHAPTER THREE GEOLOGY OF THE NILE DELTA
The Nile River Delta shows characteristics of river and wave domination as it has both: Well
developed distributaries and a smooth delta front. A distributary, or a distributary channel, is a
stream that branches off and flows away from a main stream channel. The phenomenon is
known as river bifurcation. The opposite of a distributary is a tributary. Distributaries usually
occur as streams near a lake or the ocean.
The distribution of the delta of the Neonile was broader during the Holocene, fanning out as
far eastward as the old Pelusiac branch and as far westward as the Conopic branch (Fig. 3.4):
seven major branches of the delta are mentioned in various historical documents and in
ancient maps. Five of them degenerated and silted up in the course of history, while two, the
present day Damietta and Rosetta branches, remain active (Said, 1981).
Fig.3.4: Ancient and recent geographical boundaries of both the direct and indirect
discharging outlets of the Nile Delta (Hamza, 2001).
Bietak (1974) studied the defunct Pelusiac branch of the Nile and showed that in the Sinai
stretch the delta of the Nile built up its front in the Bay of Pelusium as a result of the
accumulation of sediments which had been moved by the eastward long shore currents. Along
the westernmost part of the Delta coast, the ancient Canopic branch of the Nile silted up as a
result of the re-excavation of the Bolbinitic canal, which today forms the upper reaches of the
Rosetta branch. The re-excavated canal has less meanders and a greater gradient than other
branches of the Nile, thus taking over a large part of the water passing through the bifurcation
of the delta branches to the north of Cairo. This has resulted in the gradual silting up of the
other branches of the Delta. The Rosetta branch receives more than 70% of the water of the
Nile even today as it bifurcates into the Delta fan. The exceptional quantity of water which
goes into the Rosetta branch has converted the Delta from a Niger-type delta to a Mississippi-
type delta where promontories arc evidently around its two surviving tributaries, especially
around the Rosetta branch. Figure 3.5 is a schematic diagram showing the evolution of the
deltaic coast line from an arcuate smooth line to a (bird-foot) line (Said ‚1981).
3.4. The Modern Delta
The Nile Delta is very flat (18 m above sea level at Cairo) and the delta plain has been
cultivated for several millennia. By the mid-l950’s only the coastal barrier complex, thelagoons and a zone 5-15 km wide further south were still in a natural or barely modified
condition (EGPC, 1994).
-33-
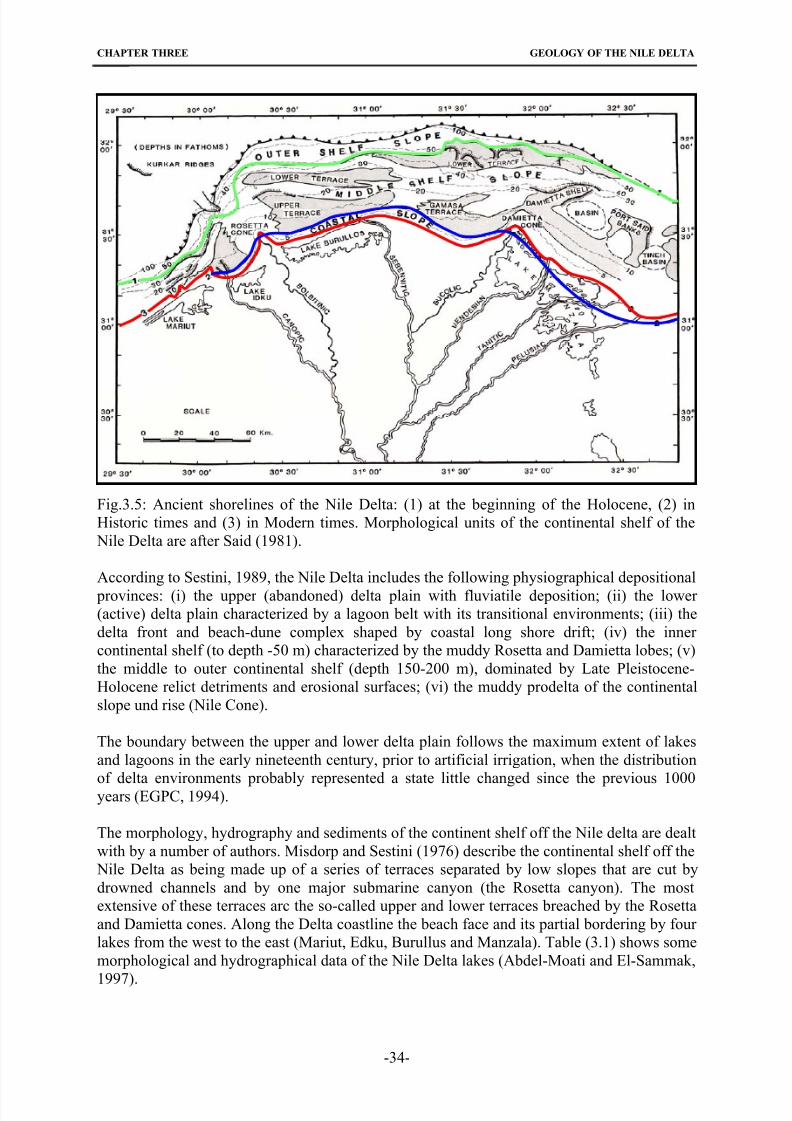
8/22/2019 barakat_moataz.pdf
http://slidepdf.com/reader/full/barakatmoatazpdf 48/158
CHAPTER THREE GEOLOGY OF THE NILE DELTA
Fig.3.5: Ancient shorelines of the Nile Delta: (1) at the beginning of the Holocene, (2) in
Historic times and (3) in Modern times. Morphological units of the continental shelf of the
Nile Delta are after Said (1981).
According to Sestini, 1989, the Nile Delta includes the following physiographical depositional
provinces: (i) the upper (abandoned) delta plain with fluviatile deposition; (ii) the lower
(active) delta plain characterized by a lagoon belt with its transitional environments; (iii) the
delta front and beach-dune complex shaped by coastal long shore drift; (iv) the inner
continental shelf (to depth -50 m) characterized by the muddy Rosetta and Damietta lobes; (v)
the middle to outer continental shelf (depth 150-200 m), dominated by Late Pleistocene-
Holocene relict detriments and erosional surfaces; (vi) the muddy prodelta of the continental
slope und rise (Nile Cone).
The boundary between the upper and lower delta plain follows the maximum extent of lakes
and lagoons in the early nineteenth century, prior to artificial irrigation, when the distribution
of delta environments probably represented a state little changed since the previous 1000years (EGPC, 1994).
The morphology, hydrography and sediments of the continent shelf off the Nile delta are dealt
with by a number of authors. Misdorp and Sestini (1976) describe the continental shelf off the
Nile Delta as being made up of a series of terraces separated by low slopes that are cut by
drowned channels and by one major submarine canyon (the Rosetta canyon). The most
extensive of these terraces arc the so-called upper and lower terraces breached by the Rosetta
and Damietta cones. Along the Delta coastline the beach face and its partial bordering by four
lakes from the west to the east (Mariut, Edku, Burullus and Manzala). Table (3.1) shows some
morphological and hydrographical data of the Nile Delta lakes (Abdel-Moati and El-Sammak,
1997).
-34-
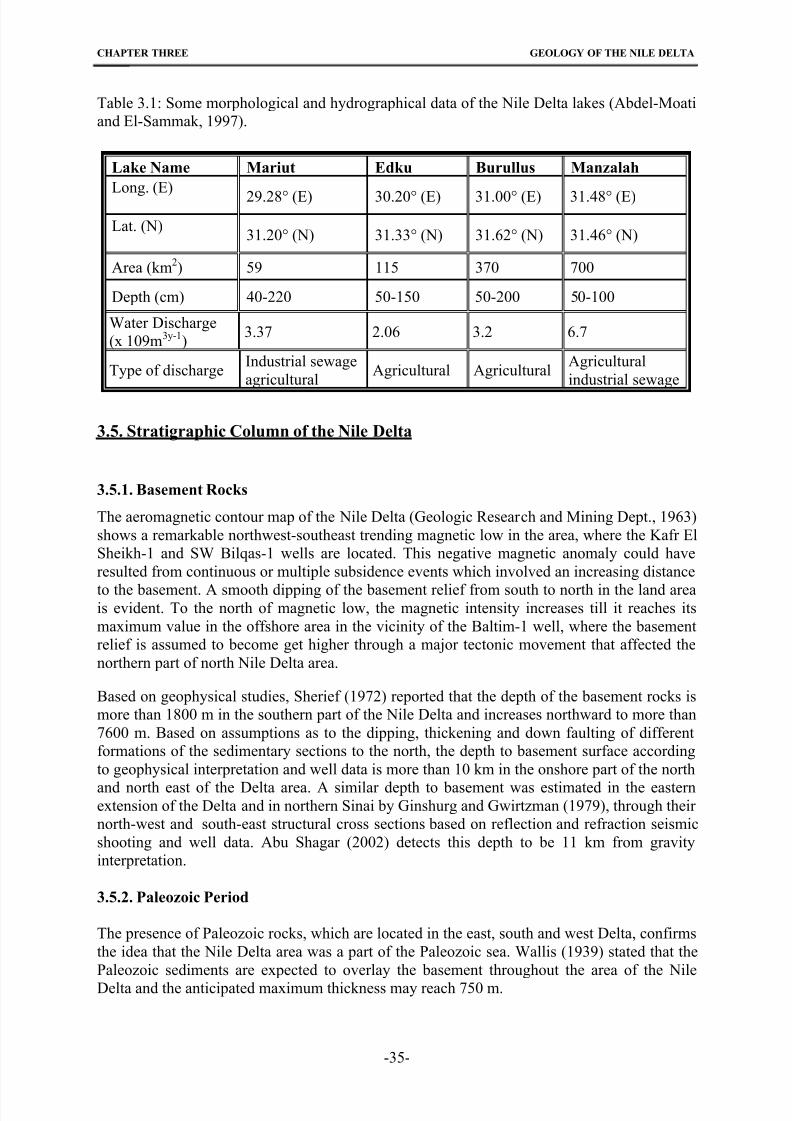
8/22/2019 barakat_moataz.pdf
http://slidepdf.com/reader/full/barakatmoatazpdf 49/158
CHAPTER THREE GEOLOGY OF THE NILE DELTA
Table 3.1: Some morphological and hydrographical data of the Nile Delta lakes (Abdel-Moati
and El-Sammak, 1997).
Lake Name Mariut Edku Burullus Manzalah
Long. (E)29.28° (E) 30.20° (E) 31.00° (E) 31.48° (E)
Lat. (N)31.20° (N) 31.33° (N) 31.62° (N) 31.46° (N)
Area (km2) 59 115 370 700
Depth (cm) 40-220 50-150 50-200 50-100
Water Discharge
(x 109m3y-1)3.37 2.06 3.2 6.7
Type of dischargeIndustrial sewage
agriculturalAgricultural Agricultural
Agricultural
industrial sewage
3.5. Stratigraphic Column of the Nile Delta
3.5.1. Basement Rocks
The aeromagnetic contour map of the Nile Delta (Geologic Research and Mining Dept., 1963)
shows a remarkable northwest-southeast trending magnetic low in the area, where the Kafr El
Sheikh-1 and SW Bilqas-1 wells are located. This negative magnetic anomaly could have
resulted from continuous or multiple subsidence events which involved an increasing distance
to the basement. A smooth dipping of the basement relief from south to north in the land areais evident. To the north of magnetic low, the magnetic intensity increases till it reaches its
maximum value in the offshore area in the vicinity of the Baltim-1 well, where the basement
relief is assumed to become get higher through a major tectonic movement that affected the
northern part of north Nile Delta area.
Based on geophysical studies, Sherief (1972) reported that the depth of the basement rocks is
more than 1800 m in the southern part of the Nile Delta and increases northward to more than
7600 m. Based on assumptions as to the dipping, thickening and down faulting of different
formations of the sedimentary sections to the north, the depth to basement surface according
to geophysical interpretation and well data is more than 10 km in the onshore part of the north
and north east of the Delta area. A similar depth to basement was estimated in the easternextension of the Delta and in northern Sinai by Ginshurg and Gwirtzman (1979), through their
north-west and south-east structural cross sections based on reflection and refraction seismic
shooting and well data. Abu Shagar (2002) detects this depth to be 11 km from gravity
interpretation.
3.5.2. Paleozoic Period
The presence of Paleozoic rocks, which are located in the east, south and west Delta, confirms
the idea that the Nile Delta area was a part of the Paleozoic sea. Wallis (1939) stated that the
Paleozoic sediments are expected to overlay the basement throughout the area of the Nile
Delta and the anticipated maximum thickness may reach 750 m.
-35-
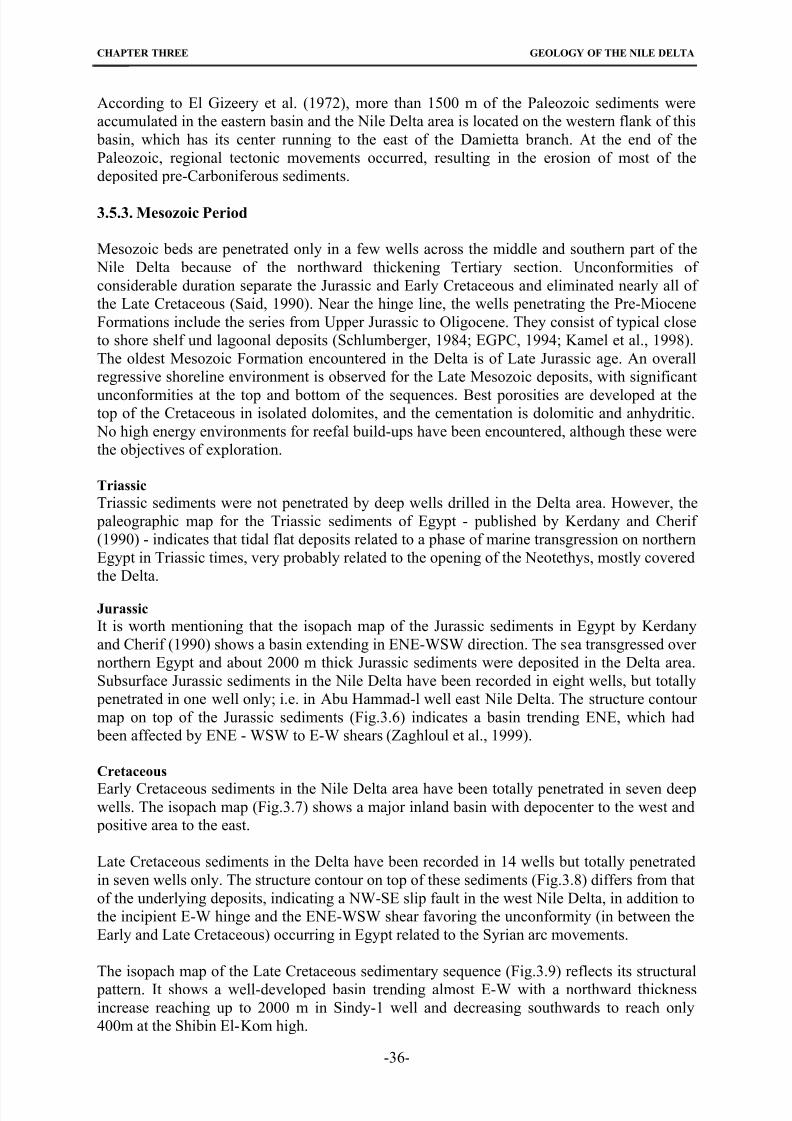
8/22/2019 barakat_moataz.pdf
http://slidepdf.com/reader/full/barakatmoatazpdf 50/158
CHAPTER THREE GEOLOGY OF THE NILE DELTA
According to El Gizeery et al. (1972), more than 1500 m of the Paleozoic sediments were
accumulated in the eastern basin and the Nile Delta area is located on the western flank of this
basin, which has its center running to the east of the Damietta branch. At the end of the
Paleozoic, regional tectonic movements occurred, resulting in the erosion of most of the
deposited pre-Carboniferous sediments.
3.5.3. Mesozoic Period
Mesozoic beds are penetrated only in a few wells across the middle and southern part of the
Nile Delta because of the northward thickening Tertiary section. Unconformities of
considerable duration separate the Jurassic and Early Cretaceous and eliminated nearly all of
the Late Cretaceous (Said, 1990). Near the hinge line, the wells penetrating the Pre-Miocene
Formations include the series from Upper Jurassic to Oligocene. They consist of typical close
to shore shelf und lagoonal deposits (Schlumberger, 1984; EGPC, 1994; Kamel et al., 1998).
The oldest Mesozoic Formation encountered in the Delta is of Late Jurassic age. An overall
regressive shoreline environment is observed for the Late Mesozoic deposits, with significant
unconformities at the top and bottom of the sequences. Best porosities are developed at thetop of the Cretaceous in isolated dolomites, and the cementation is dolomitic and anhydritic.
No high energy environments for reefal build-ups have been encountered, although these were
the objectives of exploration.
Triassic
Triassic sediments were not penetrated by deep wells drilled in the Delta area. However, the
paleographic map for the Triassic sediments of Egypt - published by Kerdany and Cherif
(1990) - indicates that tidal flat deposits related to a phase of marine transgression on northern
Egypt in Triassic times, very probably related to the opening of the Neotethys, mostly covered
the Delta.
Jurassic
It is worth mentioning that the isopach map of the Jurassic sediments in Egypt by Kerdany
and Cherif (1990) shows a basin extending in ENE-WSW direction. The sea transgressed over
northern Egypt and about 2000 m thick Jurassic sediments were deposited in the Delta area.
Subsurface Jurassic sediments in the Nile Delta have been recorded in eight wells, but totally
penetrated in one well only; i.e. in Abu Hammad-l well east Nile Delta. The structure contour
map on top of the Jurassic sediments (Fig.3.6) indicates a basin trending ENE, which had
been affected by ENE - WSW to E-W shears (Zaghloul et al., 1999).
Cretaceous
Early Cretaceous sediments in the Nile Delta area have been totally penetrated in seven deepwells. The isopach map (Fig.3.7) shows a major inland basin with depocenter to the west and
positive area to the east.
Late Cretaceous sediments in the Delta have been recorded in 14 wells but totally penetrated
in seven wells only. The structure contour on top of these sediments (Fig.3.8) differs from that
of the underlying deposits, indicating a NW-SE slip fault in the west Nile Delta, in addition to
the incipient E-W hinge and the ENE-WSW shear favoring the unconformity (in between the
Early and Late Cretaceous) occurring in Egypt related to the Syrian arc movements.
The isopach map of the Late Cretaceous sedimentary sequence (Fig.3.9) reflects its structural
pattern. It shows a well-developed basin trending almost E-W with a northward thickness
increase reaching up to 2000 m in Sindy-1 well and decreasing southwards to reach only
400m at the Shibin El-Kom high.
-36-
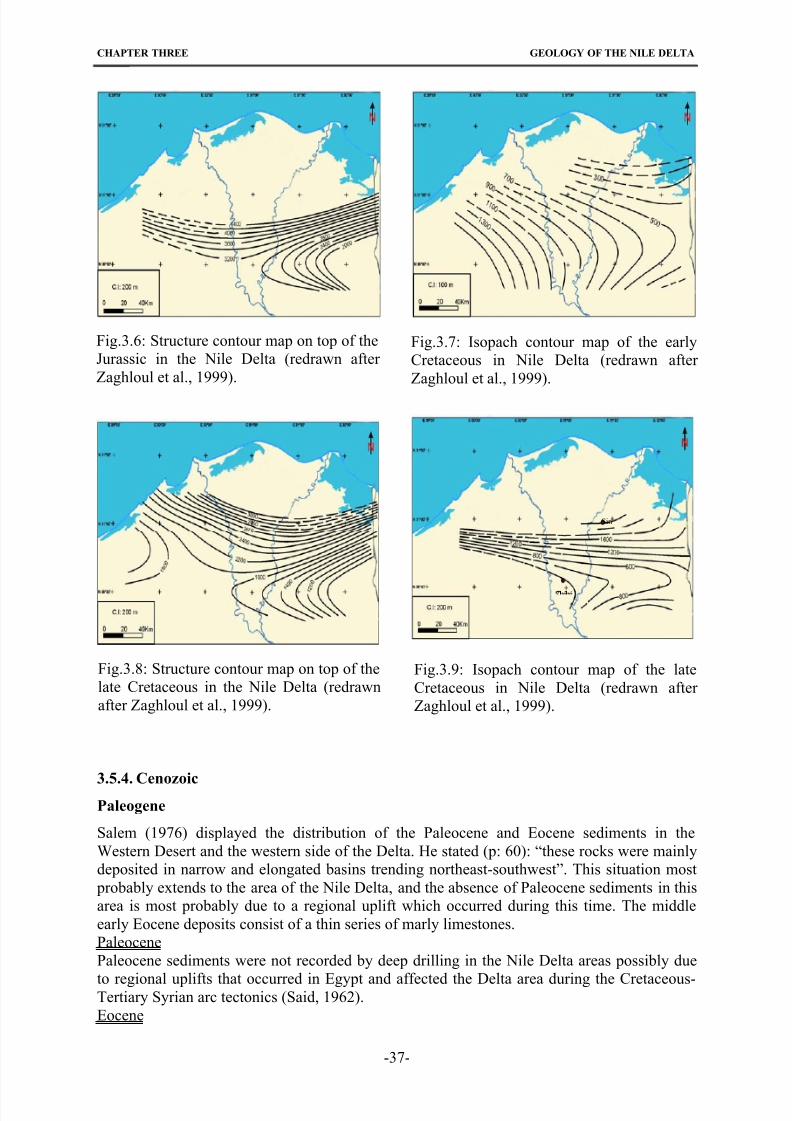
8/22/2019 barakat_moataz.pdf
http://slidepdf.com/reader/full/barakatmoatazpdf 51/158
CHAPTER THREE GEOLOGY OF THE NILE DELTA
Fig.3.6: Structure contour map on top of the
Jurassic in the Nile Delta (redrawn after
Zaghloul et al., 1999).
Fig.3.7: Isopach contour map of the early
Cretaceous in Nile Delta (redrawn after
Zaghloul et al., 1999).
Sin
Structure contour map on top of the
taceous in the Nile Delta (redrawnFig.3.9: Isopach contour map of the late
Cretaceous in Nile Delta (redrawn after
Zaghloul et al., 1999).
Fig.3.8:
late Cre
after Zaghloul et al., 1999).
3.5.4. CenozoicPaleogene
Salem (1976) displayed the distribution of the Paleocene and Eocene sediments in the
Western Desert and the western side of the Delta. He stated (p: 60): “these rocks were mainly
deposited in narrow and elongated basins trending northeast-southwest”. This situation most
probably extends to the area of the Nile Delta, and the absence of Paleocene sediments in this
area is most probably due to a regional uplift which occurred during this time. The middle
early Eocene deposits consist of a thin series of marly limestones.
Paleocene
Paleocene sediments were not recorded by deep drilling in the Nile Delta areas possibly due
to regional uplifts that occurred in Egypt and affected the Delta area during the Cretaceous-Tertiary Syrian arc tectonics (Said, 1962).
Eocene
-37-
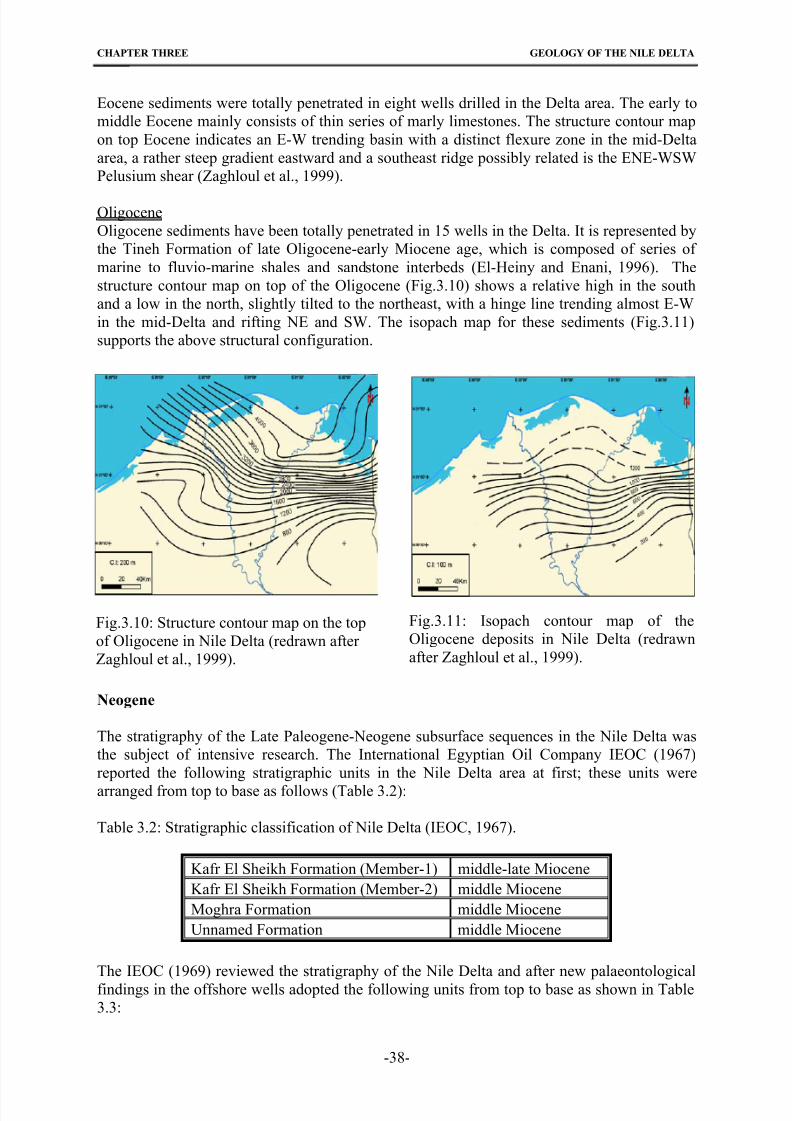
8/22/2019 barakat_moataz.pdf
http://slidepdf.com/reader/full/barakatmoatazpdf 52/158
CHAPTER THREE GEOLOGY OF THE NILE DELTA
Eocene sediments were totally penetrated in eight wells drilled in the Delta area. The early to
middle Eocene mainly consists of thin series of marly limestones. The structure contour map
on top Eocene indicates an E-W trending basin with a distinct flexure zone in the mid-Delta
area, a rather steep gradient eastward and a southeast ridge possibly related is the ENE-WSW
Pelusium shear (Zaghloul et al., 1999).
Oligocene
Oligocene sediments have been totally penetrated in 15 wells in the Delta. It is represented by
the Tineh Formation of late Oligocene-early Miocene age, which is composed of series of
marine to fluvio-marine shales and sandstone interbeds (El-Heiny and Enani, 1996). The
structure contour map on top of the Oligocene (Fig.3.10) shows a relative high in the south
and a low in the north, slightly tilted to the northeast, with a hinge line trending almost E-W
in the mid-Delta and rifting NE and SW. The isopach map for these sediments (Fig.3.11)
supports the above structural configuration.
Fig.3.10: Structure contour map on the top
of Oligocene in Nile Delta (redrawn after
Zaghloul et al., 1999).
Fig.3.11: Isopach contour map of the
Oligocene deposits in Nile Delta (redrawn
after Zaghloul et al., 1999).
Neogene
The stratigraphy of the Late Paleogene-Neogene subsurface sequences in the Nile Delta was
the subject of intensive research. The International Egyptian Oil Company IEOC (1967)
reported the following stratigraphic units in the Nile Delta area at first; these units were
arranged from top to base as follows (Table 3.2):
Table 3.2: Stratigraphic classification of Nile Delta (IEOC, 1967).
Kafr El Sheikh Formation (Member-1) middle-late Miocene
Kafr El Sheikh Formation (Member-2) middle Miocene
Moghra Formation middle Miocene
Unnamed Formation middle Miocene
The IEOC (1969) reviewed the stratigraphy of the Nile Delta and after new palaeontological
findings in the offshore wells adopted the following units from top to base as shown in Table
3.3:
-38-
8/22/2019 barakat_moataz.pdf
http://slidepdf.com/reader/full/barakatmoatazpdf 53/158
CHAPTER THREE GEOLOGY OF THE NILE DELTA
Table 3.3: Stratigraphic classification of Nile Delta (IEOC, 1969).
El Wastani Formation middle-late Miocene
Kafr El Sheikh Formation middle Miocene
Abu Madi Formation middle Miocene
Sidi Salem Formation Oligocene-early Miocene
The Stratigraphic Subcommittee of the National Committee of Geologic Science (NCGS,
1974), established the final rock stratigraphic classification of the Neogene rock units in the
Nile Delta area. According to this decision the units from top to base were arranged as shown
in Table 3.4:
Table 3.4: Stratigraphic classification of Nile Delta (NCGS, 1974).
Kafr El Sheikh Formation Pliocene
Abu Madi Formation early Pliocene
Sidi Salem Formation Miocene
Thereafter, Zaghloul et al (1977a) grouped these formations into three sedimentary cycles
with different environmental parameters, also involving the Neogene-Quaternary successions.
The first cycle is formed by transgressive deposits and includes the Miocene Sidi Salem
Formation. The second cycle comprises a regressive to transgressive sedimentary sequence of
the Miocene (upper part of Sidi Salem and Abu Madi Formations) and the lower part of Kafr El-Sheikh Formation (Pliocene). The third cycle is mainly represented by a regressive phase
and includes the Pliocene to Holocene (upper part of Kafr El Sheikh, El-Wastani, Mit Ghamr
and Bilqas Formations).
In the northern part of the Nile Delta basin, the Neogene-Quaternary subsurface succession
has been subdivided by Rizzini et al. (1978) into eight formations arranged from older to
younger as follows: Sidi Salem, Qawasim, Rosetta, Abu Madi, Kafr El-Sheikh, El-Wastani,
Mit Ghamr and Bilqas Formations. These Formations were grouped by Rizzini et al. (1978)
into three sedimentary cycles. The first cycle belongs to the Miocene and includes the Sidi
Salem, Qawasim and Rosetta Formations. The second cycle is attributed to the Plio-
Pleistocene and includes the Abu Madi, Kafr El Sheikh, El-Wastani and Mit Ghamr Formations. The third cycle belongs to the Holocene and includes the Bilqas Formation.
Later on, El Heiny and Enani (1996) and Vandre´et al. (2006) mentioned that the Oligocene-
Neogene stratigraphic succession in the northern Nile Delta area is represented by the
following Formations (from top to bottom): Kafr El-Sheikh (early to late Pliocene), Rosetta
Formation (Messinian), Abu Madi Formation (Messinian), Qawasim Formation (Messinian),
Sidi Salem Formation (Serravallian-Tortonian), Qantara Formation (Burdigalian-Langhian)
and the Tineh Formation (Oligocene-Aquitanian), Table 3.5:
-39-
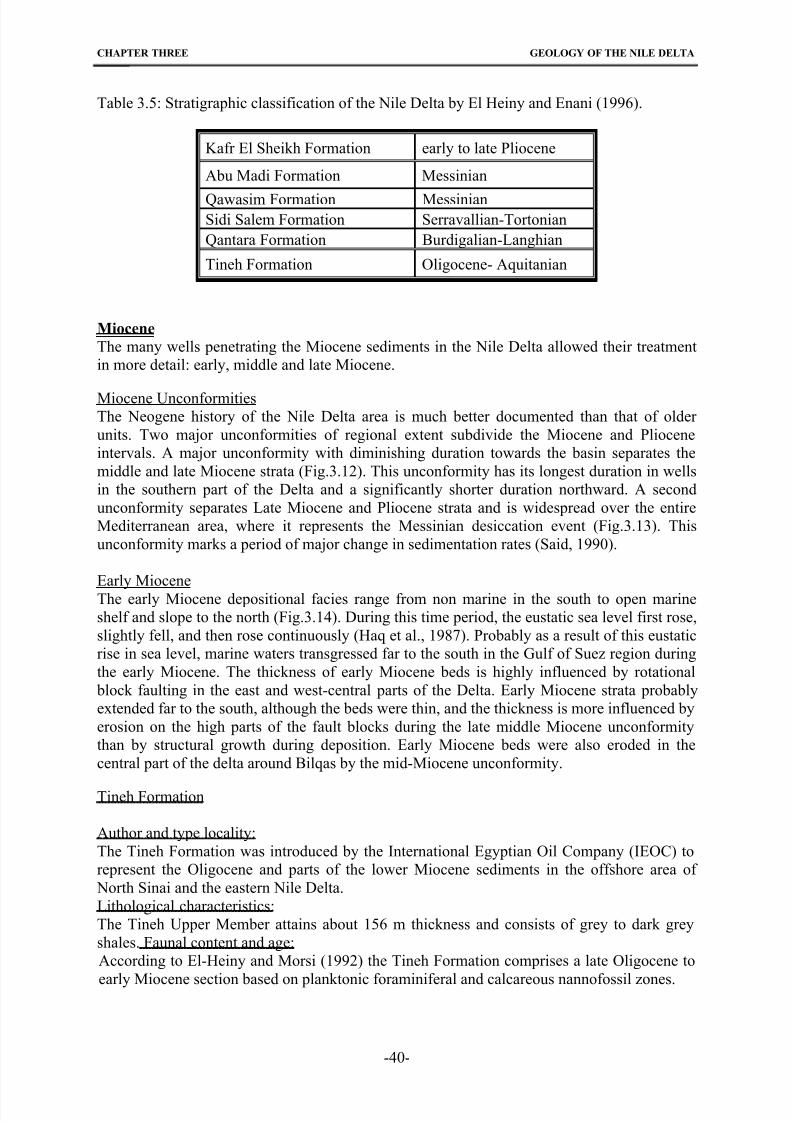
8/22/2019 barakat_moataz.pdf
http://slidepdf.com/reader/full/barakatmoatazpdf 54/158
CHAPTER THREE GEOLOGY OF THE NILE DELTA
Table 3.5: Stratigraphic classification of the Nile Delta by El Heiny and Enani (1996).
Kafr El Sheikh Formation early to late Pliocene
Abu Madi Formation Messinian
Qawasim Formation MessinianSidi Salem Formation Serravallian-Tortonian
Qantara Formation Burdigalian-Langhian
Tineh Formation Oligocene- Aquitanian
Miocene
The many wells penetrating the Miocene sediments in the Nile Delta allowed their treatment
in more detail: early, middle and late Miocene.
Miocene UnconformitiesThe Neogene history of the Nile Delta area is much better documented than that of older
units. Two major unconformities of regional extent subdivide the Miocene and Pliocene
intervals. A major unconformity with diminishing duration towards the basin separates the
middle and late Miocene strata (Fig.3.12). This unconformity has its longest duration in wells
in the southern part of the Delta and a significantly shorter duration northward. A second
unconformity separates Late Miocene and Pliocene strata and is widespread over the entire
Mediterranean area, where it represents the Messinian desiccation event (Fig.3.13). This
unconformity marks a period of major change in sedimentation rates (Said, 1990).
Early Miocene
The early Miocene depositional facies range from non marine in the south to open marine
shelf and slope to the north (Fig.3.14). During this time period, the eustatic sea level first rose,
slightly fell, and then rose continuously (Haq et al., 1987). Probably as a result of this eustatic
rise in sea level, marine waters transgressed far to the south in the Gulf of Suez region during
the early Miocene. The thickness of early Miocene beds is highly influenced by rotational
block faulting in the east and west-central parts of the Delta. Early Miocene strata probably
extended far to the south, although the beds were thin, and the thickness is more influenced by
erosion on the high parts of the fault blocks during the late middle Miocene unconformity
than by structural growth during deposition. Early Miocene beds were also eroded in the
central part of the delta around Bilqas by the mid-Miocene unconformity.
Tineh Formation
Author and type locality:
The Tineh Formation was introduced by the International Egyptian Oil Company (IEOC) to
represent the Oligocene and parts of the lower Miocene sediments in the offshore area of
North Sinai and the eastern Nile Delta.
Lithological characteristics:
The Tineh Upper Member attains about 156 m thickness and consists of grey to dark grey
shales. Faunal content and age:
According to El-Heiny and Morsi (1992) the Tineh Formation comprises a late Oligocene to
early Miocene section based on planktonic foraminiferal and calcareous nannofossil zones.
-40-
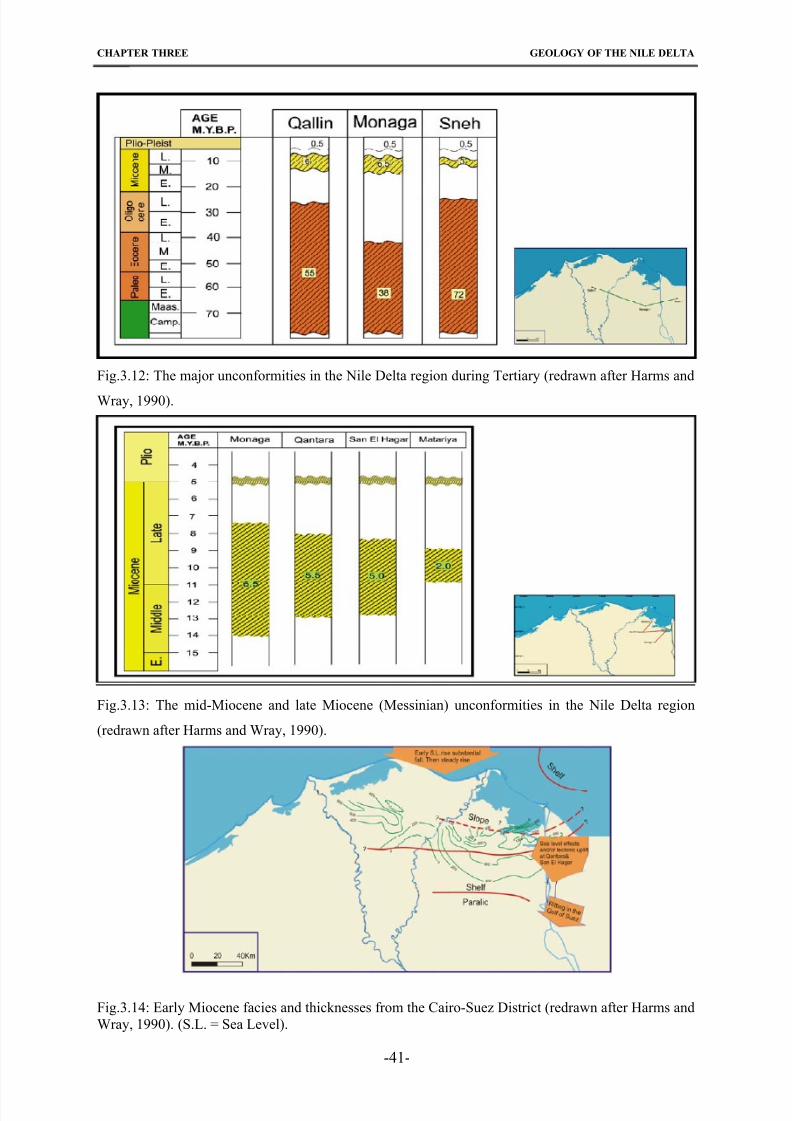
8/22/2019 barakat_moataz.pdf
http://slidepdf.com/reader/full/barakatmoatazpdf 55/158
CHAPTER THREE GEOLOGY OF THE NILE DELTA
Fig.3.12: The major unconformities in the Nile Delta region during Tertiary (redrawn after Harms and
Wray, 1990).
Fig.3.13: The mid-Miocene and late Miocene (Messinian) unconformities in the Nile Delta region
(redrawn after Harms and Wray, 1990).
Fig.3.14: Early Miocene facies and thicknesses from the Cairo-Suez District (redrawn after Harms and
Wray, 1990). (S.L. = Sea Level).
-41-
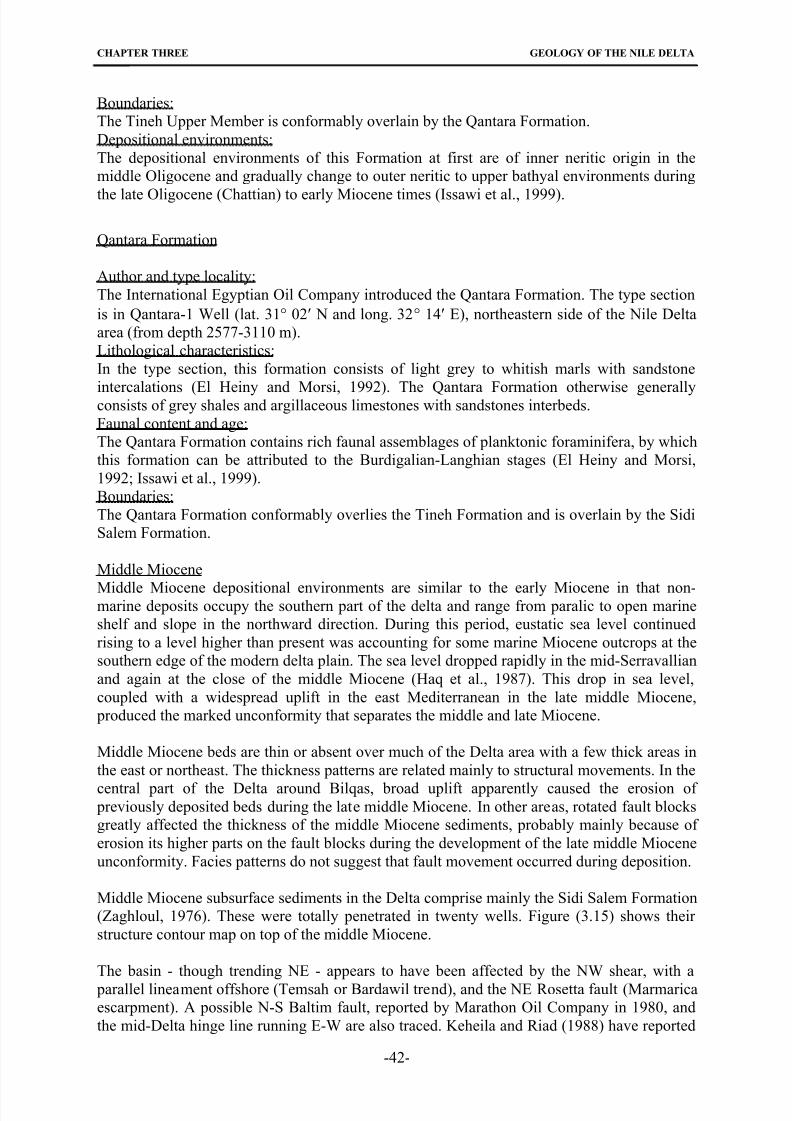
8/22/2019 barakat_moataz.pdf
http://slidepdf.com/reader/full/barakatmoatazpdf 56/158
CHAPTER THREE GEOLOGY OF THE NILE DELTA
Boundaries:
The Tineh Upper Member is conformably overlain by the Qantara Formation.
Depositional environments:
The depositional environments of this Formation at first are of inner neritic origin in the
middle Oligocene and gradually change to outer neritic to upper bathyal environments during
the late Oligocene (Chattian) to early Miocene times (Issawi et al., 1999).
Qantara Formation
Author and type locality:
The International Egyptian Oil Company introduced the Qantara Formation. The type section
is in Qantara-1 Well (lat. 31 02 N and long. 32 14 E), northeastern side of the Nile Delta
area (from depth 2577-3110 m).
Lithological characteristics:
In the type section, this formation consists of light grey to whitish marls with sandstone
intercalations (El Heiny and Morsi, 1992). The Qantara Formation otherwise generallyconsists of grey shales and argillaceous limestones with sandstones interbeds.
Faunal content and age:
The Qantara Formation contains rich faunal assemblages of planktonic foraminifera, by which
this formation can be attributed to the Burdigalian-Langhian stages (El Heiny and Morsi,
1992; Issawi et al., 1999).
Boundaries:
The Qantara Formation conformably overlies the Tineh Formation and is overlain by the Sidi
Salem Formation.
Middle Miocene
Middle Miocene depositional environments are similar to the early Miocene in that non-marine deposits occupy the southern part of the delta and range from paralic to open marine
shelf and slope in the northward direction. During this period, eustatic sea level continued
rising to a level higher than present was accounting for some marine Miocene outcrops at the
southern edge of the modern delta plain. The sea level dropped rapidly in the mid-Serravallian
and again at the close of the middle Miocene (Haq et al., 1987). This drop in sea level,
coupled with a widespread uplift in the east Mediterranean in the late middle Miocene,
produced the marked unconformity that separates the middle and late Miocene.
Middle Miocene beds are thin or absent over much of the Delta area with a few thick areas in
the east or northeast. The thickness patterns are related mainly to structural movements. In the
central part of the Delta around Bilqas, broad uplift apparently caused the erosion of previously deposited beds during the late middle Miocene. In other areas, rotated fault blocks
greatly affected the thickness of the middle Miocene sediments, probably mainly because of
erosion its higher parts on the fault blocks during the development of the late middle Miocene
unconformity. Facies patterns do not suggest that fault movement occurred during deposition.
Middle Miocene subsurface sediments in the Delta comprise mainly the Sidi Salem Formation
(Zaghloul, 1976). These were totally penetrated in twenty wells. Figure (3.15) shows their
structure contour map on top of the middle Miocene.
The basin - though trending NE - appears to have been affected by the NW shear, with a
parallel lineament offshore (Temsah or Bardawil trend), and the NE Rosetta fault (Marmarica
escarpment). A possible N-S Baltim fault, reported by Marathon Oil Company in 1980, and
the mid-Delta hinge line running E-W are also traced. Keheila and Riad (1988) have reported
-42-
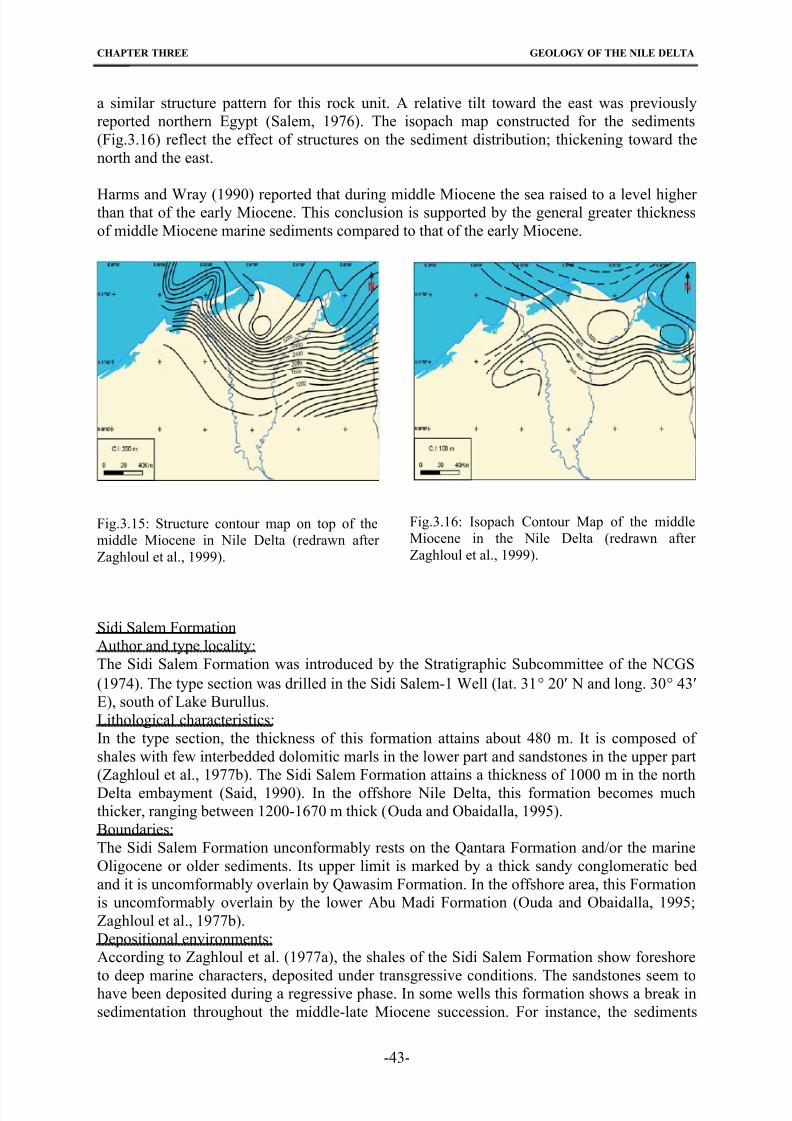
8/22/2019 barakat_moataz.pdf
http://slidepdf.com/reader/full/barakatmoatazpdf 57/158
CHAPTER THREE GEOLOGY OF THE NILE DELTA
a similar structure pattern for this rock unit. A relative tilt toward the east was previously
reported northern Egypt (Salem, 1976). The isopach map constructed for the sediments
(Fig.3.16) reflect the effect of structures on the sediment distribution; thickening toward the
north and the east.
Harms and Wray (1990) reported that during middle Miocene the sea raised to a level higher than that of the early Miocene. This conclusion is supported by the general greater thickness
of middle Miocene marine sediments compared to that of the early Miocene.
Fig.3.15: Structure contour map on top of the
middle Miocene in Nile Delta (redrawn after
Zaghloul et al., 1999).
Fig.3.16: Isopach Contour Map of the middle
Miocene in the Nile Delta (redrawn after
Zaghloul et al., 1999).
Sidi Salem Formation
Author and type locality:
The Sidi Salem Formation was introduced by the Stratigraphic Subcommittee of the NCGS
(1974). The type section was drilled in the Sidi Salem-1 Well (lat. 31 20 N and long. 30 43
E), south of Lake Burullus.
Lithological characteristics:
In the type section, the thickness of this formation attains about 480 m. It is composed of
shales with few interbedded dolomitic marls in the lower part and sandstones in the upper part
(Zaghloul et al., 1977b). The Sidi Salem Formation attains a thickness of 1000 m in the north
Delta embayment (Said, 1990). In the offshore Nile Delta, this formation becomes much
thicker, ranging between 1200-1670 m thick (Ouda and Obaidalla, 1995).
Boundaries:
The Sidi Salem Formation unconformably rests on the Qantara Formation and/or the marine
Oligocene or older sediments. Its upper limit is marked by a thick sandy conglomeratic bed
and it is uncomformably overlain by Qawasim Formation. In the offshore area, this Formation
is uncomformably overlain by the lower Abu Madi Formation (Ouda and Obaidalla, 1995;
Zaghloul et al., 1977b).
Depositional environments:
According to Zaghloul et al. (1977a), the shales of the Sidi Salem Formation show foreshore
to deep marine characters, deposited under transgressive conditions. The sandstones seem tohave been deposited during a regressive phase. In some wells this formation shows a break in
sedimentation throughout the middle-late Miocene succession. For instance, the sediments
-43-
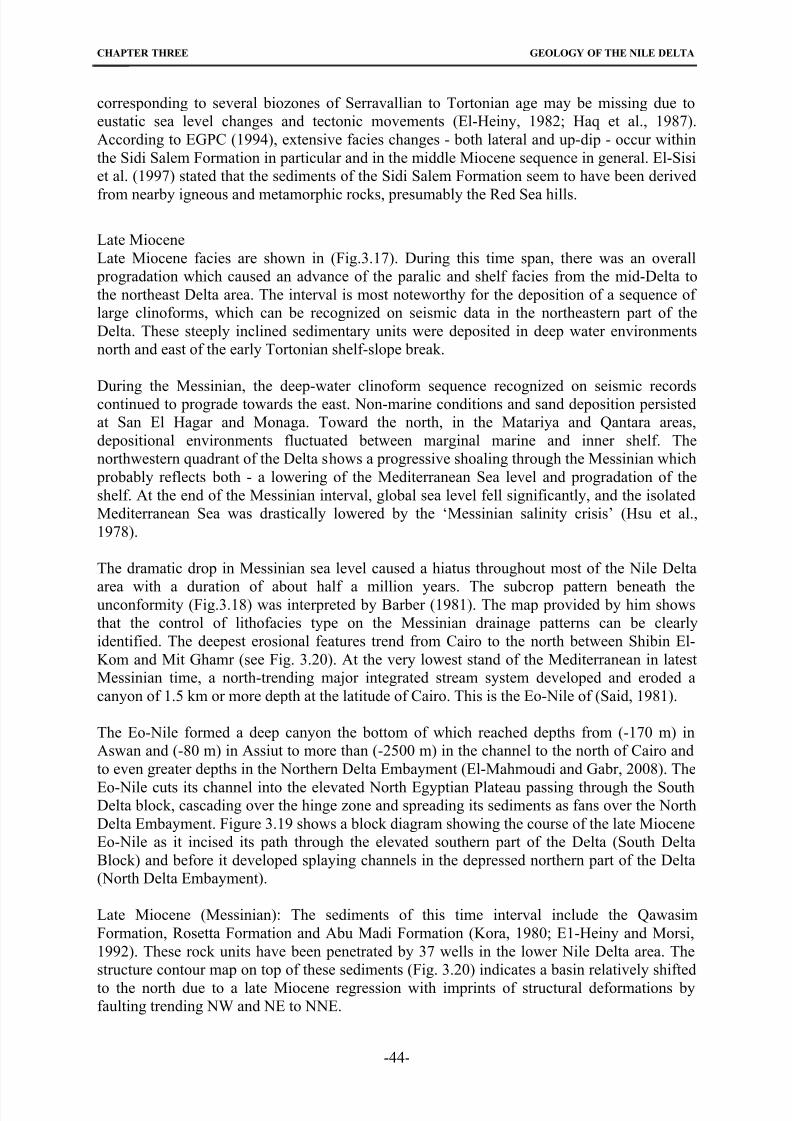
8/22/2019 barakat_moataz.pdf
http://slidepdf.com/reader/full/barakatmoatazpdf 58/158
CHAPTER THREE GEOLOGY OF THE NILE DELTA
corresponding to several biozones of Serravallian to Tortonian age may be missing due to
eustatic sea level changes and tectonic movements (El-Heiny, 1982; Haq et al., 1987).
According to EGPC (1994), extensive facies changes - both lateral and up-dip - occur within
the Sidi Salem Formation in particular and in the middle Miocene sequence in general. El-Sisi
et al. (1997) stated that the sediments of the Sidi Salem Formation seem to have been derived
from nearby igneous and metamorphic rocks, presumably the Red Sea hills.
Late Miocene
Late Miocene facies are shown in (Fig.3.17). During this time span, there was an overall
progradation which caused an advance of the paralic and shelf facies from the mid-Delta to
the northeast Delta area. The interval is most noteworthy for the deposition of a sequence of
large clinoforms, which can be recognized on seismic data in the northeastern part of the
Delta. These steeply inclined sedimentary units were deposited in deep water environments
north and east of the early Tortonian shelf-slope break.
During the Messinian, the deep-water clinoform sequence recognized on seismic recordscontinued to prograde towards the east. Non-marine conditions and sand deposition persisted
at San El Hagar and Monaga. Toward the north, in the Matariya and Qantara areas,
depositional environments fluctuated between marginal marine and inner shelf. The
northwestern quadrant of the Delta shows a progressive shoaling through the Messinian which
probably reflects both - a lowering of the Mediterranean Sea level and progradation of the
shelf. At the end of the Messinian interval, global sea level fell significantly, and the isolated
Mediterranean Sea was drastically lowered by the ‘Messinian salinity crisis’ (Hsu et al.,
1978).
The dramatic drop in Messinian sea level caused a hiatus throughout most of the Nile Delta
area with a duration of about half a million years. The subcrop pattern beneath theunconformity (Fig.3.18) was interpreted by Barber (1981). The map provided by him shows
that the control of lithofacies type on the Messinian drainage patterns can be clearly
identified. The deepest erosional features trend from Cairo to the north between Shibin El-
Kom and Mit Ghamr (see Fig. 3.20). At the very lowest stand of the Mediterranean in latest
Messinian time, a north-trending major integrated stream system developed and eroded a
canyon of 1.5 km or more depth at the latitude of Cairo. This is the Eo-Nile of (Said, 1981).
The Eo-Nile formed a deep canyon the bottom of which reached depths from (-170 m) in
Aswan and (-80 m) in Assiut to more than (-2500 m) in the channel to the north of Cairo and
to even greater depths in the Northern Delta Embayment (El-Mahmoudi and Gabr, 2008). The
Eo-Nile cuts its channel into the elevated North Egyptian Plateau passing through the SouthDelta block, cascading over the hinge zone and spreading its sediments as fans over the North
Delta Embayment. Figure 3.19 shows a block diagram showing the course of the late Miocene
Eo-Nile as it incised its path through the elevated southern part of the Delta (South Delta
Block) and before it developed splaying channels in the depressed northern part of the Delta
(North Delta Embayment).
Late Miocene (Messinian): The sediments of this time interval include the Qawasim
Formation, Rosetta Formation and Abu Madi Formation (Kora, 1980; E1-Heiny and Morsi,
1992). These rock units have been penetrated by 37 wells in the lower Nile Delta area. The
structure contour map on top of these sediments (Fig. 3.20) indicates a basin relatively shifted
to the north due to a late Miocene regression with imprints of structural deformations byfaulting trending NW and NE to NNE.
-44-
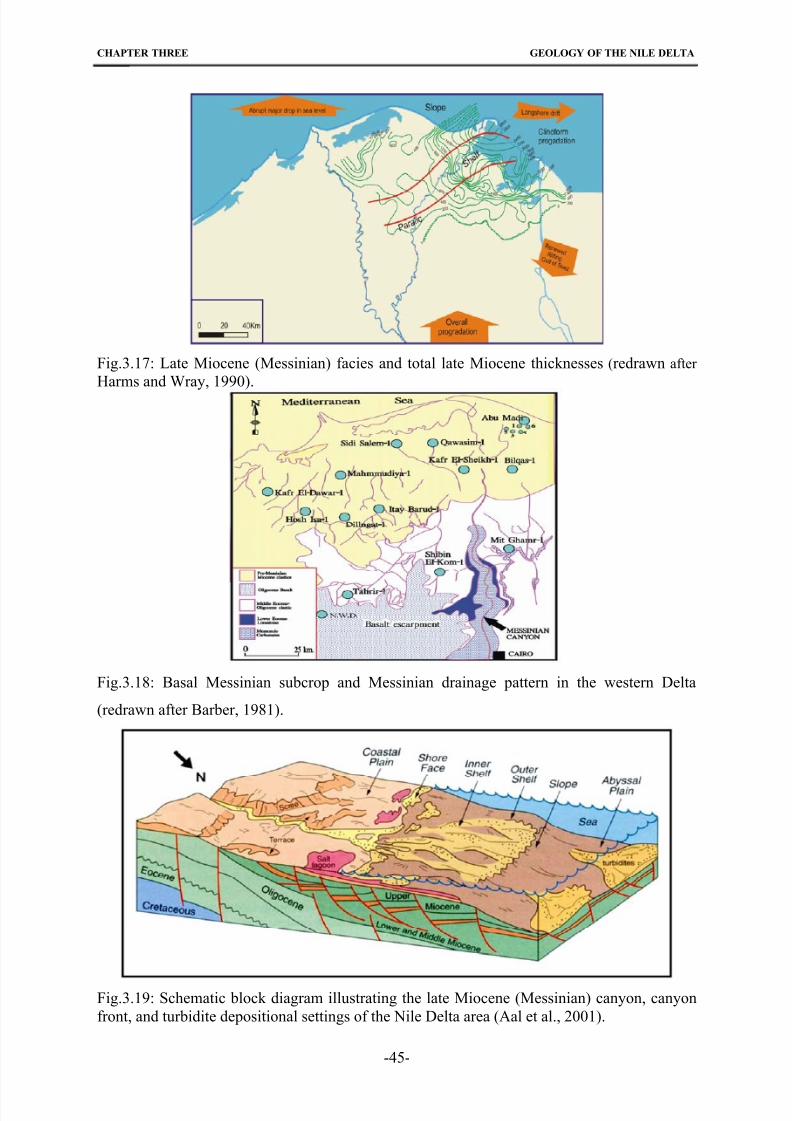
8/22/2019 barakat_moataz.pdf
http://slidepdf.com/reader/full/barakatmoatazpdf 59/158
CHAPTER THREE GEOLOGY OF THE NILE DELTA
Fig.3.17: Late Miocene (Messinian) facies and total late Miocene thicknesses (redrawn after
Harms and Wray, 1990).
Fig.3.18: Basal Messinian subcrop and Messinian drainage pattern in the western Delta
(redrawn after Barber, 1981).
Fig.3.19: Schematic block diagram illustrating the late Miocene (Messinian) canyon, canyon
front, and turbidite depositional settings of the Nile Delta area (Aal et al., 2001).
-45-

8/22/2019 barakat_moataz.pdf
http://slidepdf.com/reader/full/barakatmoatazpdf 60/158
CHAPTER THREE GEOLOGY OF THE NILE DELTA
Fig.3.20: Structure contour map on top of the late Miocene in the Nile Delta (redrawn after
Zaghloul et al., 1999).
Qawasim Formation
Authors and type locality:
This formation was introduced by Rizzini et al. (1978). The type section is in the Qawasim-1
Well (lat. 31 21 N and long. 30 51 E), Nile Delta area (depth intervals between 2800 to
3765 m).
Lithological characteristics:
The Qawasim Formation essentially consists of interbedded sand/shale strata with
conglomeratic layers (Zaghloul et al., 1977b). The formation is interpreted as forming the
deltaic fan of the Eo-Nile (Said, 1981). It is thin over the hinge zone of the delta which
separates the embayment from the south Delta high (Said, 1990). According to Abd El Aal et
al. (1994), the Lower Qawasim Formation derived from sandy shallow marine and deltaic
facies interfingering with shales and siltstones of the Sidi Salem Formation.
Faunal content and age:
The age of the Qawasim Formation can only be interpreted as its fossil content is not
diagnostic. Based on correlation with the eastern and western equvalent units and because it
unconformably overlies the well-dated early Tortonian sediments of the Sidi Salem
Formation, the age of this formation is assumed to be of late Miocene - Tortonian to
Messinian - (Said, 1990; El Heiny and Morsi, 1992; Issawi et al., 1999).
Boundaries:
The Qawasim Formation unconformably rests on the Sidi Salem Formation and is
unconformably overlain by the open marine sediments of Abu Madi (Ouda and Obaidalla,1995).
Depositional environments:
The Qawasim Formation was deposited in fluvio-deltaic-, brackish- to shallow marine
environments (Zaghloul et al., 1977b).
Rosetta Formation
Authors and type locality:
This formation was named by Rizzini et al. (1978) and is encountered in most of the wells
drilled in the embayment at the same level recorded beneath the sea level. The type section is
that of Rosetta well no.2 from 2678 to 2718 m, location 31°37'22.65"N 30°31'34.18"E. The
well is located offshore, NE of the mouth of the Rosetta Nile branch.Lithological characteristics:
-46-
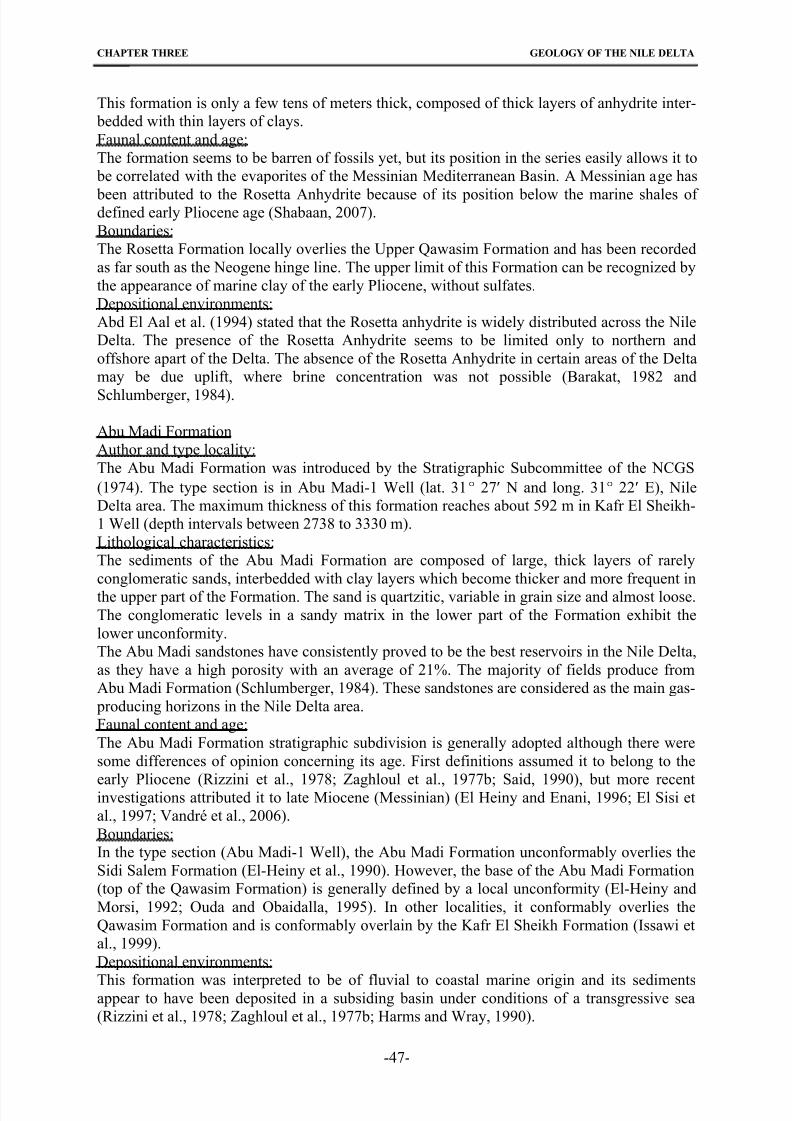
8/22/2019 barakat_moataz.pdf
http://slidepdf.com/reader/full/barakatmoatazpdf 61/158
CHAPTER THREE GEOLOGY OF THE NILE DELTA
This formation is only a few tens of meters thick, composed of thick layers of anhydrite inter-
bedded with thin layers of clays.
Faunal content and age:
The formation seems to be barren of fossils yet, but its position in the series easily allows it to
be correlated with the evaporites of the Messinian Mediterranean Basin. A Messinian age has
been attributed to the Rosetta Anhydrite because of its position below the marine shales of defined early Pliocene age (Shabaan, 2007).
Boundaries:
The Rosetta Formation locally overlies the Upper Qawasim Formation and has been recorded
as far south as the Neogene hinge line. The upper limit of this Formation can be recognized by
the appearance of marine clay of the early Pliocene, without sulfates.
Depositional environments:
Abd El Aal et al. (1994) stated that the Rosetta anhydrite is widely distributed across the Nile
Delta. The presence of the Rosetta Anhydrite seems to be limited only to northern and
offshore apart of the Delta. The absence of the Rosetta Anhydrite in certain areas of the Delta
may be due uplift, where brine concentration was not possible (Barakat, 1982 and
Schlumberger, 1984).
Abu Madi Formation
Author and type locality:
The Abu Madi Formation was introduced by the Stratigraphic Subcommittee of the NCGS
(1974). The type section is in Abu Madi-1 Well (lat. 31 27 N and long. 31 22 E), Nile
Delta area. The maximum thickness of this formation reaches about 592 m in Kafr El Sheikh-
1 Well (depth intervals between 2738 to 3330 m).
Lithological characteristics:
The sediments of the Abu Madi Formation are composed of large, thick layers of rarely
conglomeratic sands, interbedded with clay layers which become thicker and more frequent in
the upper part of the Formation. The sand is quartzitic, variable in grain size and almost loose.
The conglomeratic levels in a sandy matrix in the lower part of the Formation exhibit the
lower unconformity.
The Abu Madi sandstones have consistently proved to be the best reservoirs in the Nile Delta,
as they have a high porosity with an average of 21%. The majority of fields produce from
Abu Madi Formation (Schlumberger, 1984). These sandstones are considered as the main gas-
producing horizons in the Nile Delta area.
Faunal content and age:
The Abu Madi Formation stratigraphic subdivision is generally adopted although there were
some differences of opinion concerning its age. First definitions assumed it to belong to the
early Pliocene (Rizzini et al., 1978; Zaghloul et al., 1977b; Said, 1990), but more recentinvestigations attributed it to late Miocene (Messinian) (El Heiny and Enani, 1996; El Sisi et
al., 1997; Vandré et al., 2006).
Boundaries:
In the type section (Abu Madi-1 Well), the Abu Madi Formation unconformably overlies the
Sidi Salem Formation (El-Heiny et al., 1990). However, the base of the Abu Madi Formation
(top of the Qawasim Formation) is generally defined by a local unconformity (El-Heiny and
Morsi, 1992; Ouda and Obaidalla, 1995). In other localities, it conformably overlies the
Qawasim Formation and is conformably overlain by the Kafr El Sheikh Formation (Issawi et
al., 1999).
Depositional environments:
This formation was interpreted to be of fluvial to coastal marine origin and its sedimentsappear to have been deposited in a subsiding basin under conditions of a transgressive sea
(Rizzini et al., 1978; Zaghloul et al., 1977b; Harms and Wray, 1990).
-47-
8/22/2019 barakat_moataz.pdf
http://slidepdf.com/reader/full/barakatmoatazpdf 62/158
CHAPTER THREE GEOLOGY OF THE NILE DELTA
Ward (1996) classified the Abu Madi Formation into three types (I, II, III), according to its
petrology. All have intergarnular pore shapes but type III rocks are the best reservoir rocks
and have enhanced porosity as a result of feldspar dissolution, very limited cement, good
sorting and medium-coarsed grain size. El Sisi et al. (1997) stated that the Abu Madi reservoir
(Messinian) has received its sediments by reworking of nearby sediments older than Miocene,
of clastic provenance and with contribution of a distant igneous components, suggesting anadditional source of clastic supply for Abu Madi reservoirs.
Pliocene
The Pliocene sediments of the Nile Delta valley consist of a lower marine sequence of early
Pliocene age and an upper fluviatile sequence of the late Pliocene age, and are subdivided into
two Formations: 1) Kafr El Sheikh Formation and 2) El Wastani Formation.
Kafr El Sheikh Formation
Author and type locality:
The Kafr El-Sheikh Formation was introduced by the Stratigraphic Subcommittee of the
NCGS (1974). The type well of this formation is the depth interval 975 to 2735 m at Kafr El-
Sheikh Well in the south-central part of the onshore Nile Delta area (lat. 31 10 23 N and
long. 31 04 55E).
Lithological characteristics:
This formation is widely distributed in the whole area of the Nile Delta and is considered the
thickest rock unit in the Neogene succession. The thickness increases towards the north. This
rock unit consists mainly of shales and clays. The clays are composed of kaolinite and
montomorillonite with illite which forms a thick voluminous section extending over the whole
Delta area with almost the same characteristics. Generally, it is intercalated with fine sand
beds, indicating a periodic lowering of the sea level throughout the interval (Zaghloul et al,1977b).
The formation attains a maximum thickness reaching about 1820 m in Abu Madi-4 Well,
whereas it comprises 1400 m in the Ras El Barr-1 and 992 m in Qantara-1 wells. Generally,
the Kafr El Sheikh Formation shows gradual lateral changes of sediments from open marine
shales in the offshore area (offshore wells) to inner-shelf and fluvio-marine shaly sandstones
towards the south (Zaghloul et al.,1977b).
Faunal content and age:
The age of the Kafr El Sheikh Formation ranges from early to middle Pliocene (Rizzini et al.,
1978; Zaghloul et al., 1977b; El Heiny, 1982; Said, 1990). During that time, a marinetransgression, which commenced during the early Pliocene, had been spreading over the
entire Delta area.
Boundaries:
The Kafr El Sheikh Formation unconformably overlies the Abu Madi Formation and is
unconformably overlain by the El Wastani Formation (Zaghloul et al., 1977b; Said, 1990).
Depositional environments:
The depositional environments of the Kafr El Sheikh sediments are ranging from inner to
outer neritic conditions (Rizzini et al., 1978; Zaghloul et al., 1977a, b). The Kafr El-Sheikh
Formation has been totally penetrated in nearly all deep wells drilled in the Delta. The
structure contour map made on top (Fig.3.21) indicates a relatively broader V-shaped basin in
which the Pliocene sea invasion of the Delta continued. Its distribution is mainly controlled by NW and NE to ENE fault systems.
-48-
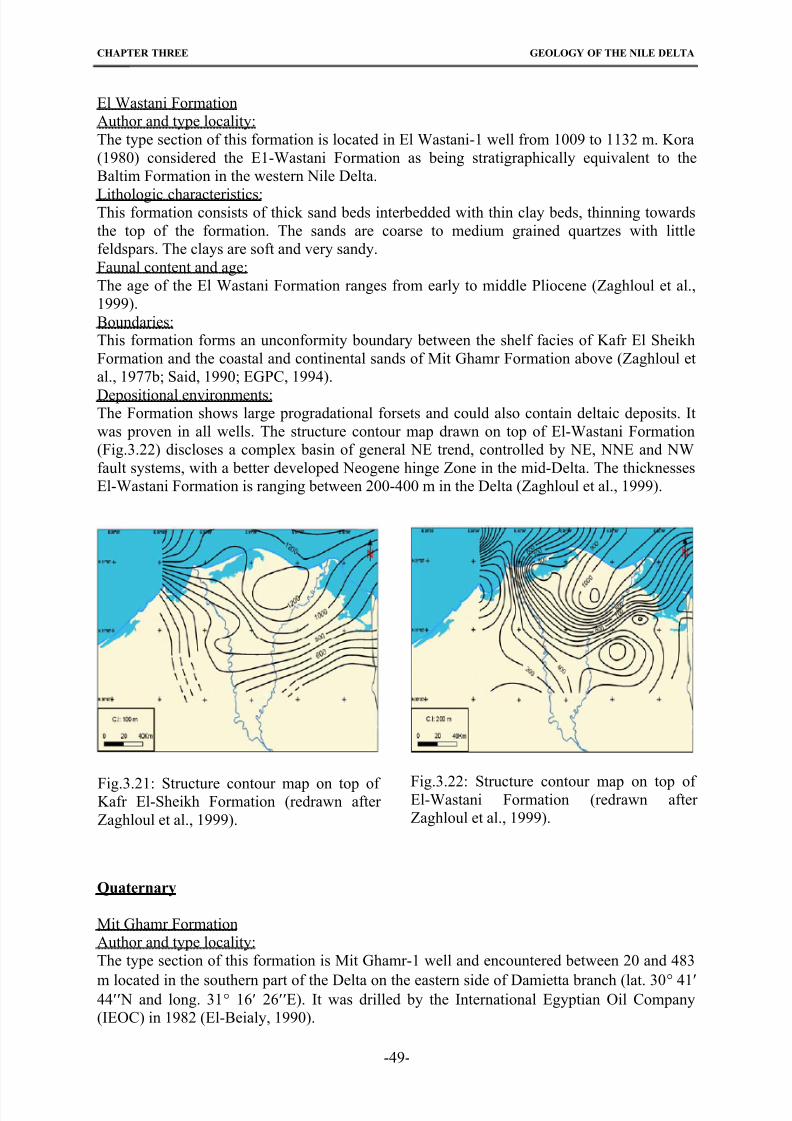
8/22/2019 barakat_moataz.pdf
http://slidepdf.com/reader/full/barakatmoatazpdf 63/158
CHAPTER THREE GEOLOGY OF THE NILE DELTA
El Wastani Formation
Author and type locality:
The type section of this formation is located in El Wastani-1 well from 1009 to 1132 m. Kora
(1980) considered the E1-Wastani Formation as being stratigraphically equivalent to the
Baltim Formation in the western Nile Delta.
Lithologic characteristics:This formation consists of thick sand beds interbedded with thin clay beds, thinning towards
the top of the formation. The sands are coarse to medium grained quartzes with little
feldspars. The clays are soft and very sandy.
Faunal content and age:
The age of the El Wastani Formation ranges from early to middle Pliocene (Zaghloul et al.,
1999).
Boundaries:
This formation forms an unconformity boundary between the shelf facies of Kafr El Sheikh
Formation and the coastal and continental sands of Mit Ghamr Formation above (Zaghloul et
al., 1977b; Said, 1990; EGPC, 1994).
Depositional environments:The Formation shows large progradational forsets and could also contain deltaic deposits. It
was proven in all wells. The structure contour map drawn on top of El-Wastani Formation
(Fig.3.22) discloses a complex basin of general NE trend, controlled by NE, NNE and NW
fault systems, with a better developed Neogene hinge Zone in the mid-Delta. The thicknesses
El-Wastani Formation is ranging between 200-400 m in the Delta (Zaghloul et al., 1999).
Fig.3.21: Structure contour map on top of ation (redrawn after
Fig.3.22: Structure contour map on top of El-Wastani Formation (redrawn after
Zaghloul et al., 1999). Kafr El-Sheikh Form
Zaghloul et al., 1999).
Quaternary
Mit Ghamr Formation
Author and type locality:
The type section of this formation is Mit Ghamr-1 well and encountered between 20 and 483
m located in the southern part of the Delta on the eastern side of Damietta branch (lat. 30
41
44 N and long. 31 16 26E). It was drilled by the International Egyptian Oil Company
(IEOC) in 1982 (El-Beialy, 1990).
-49-
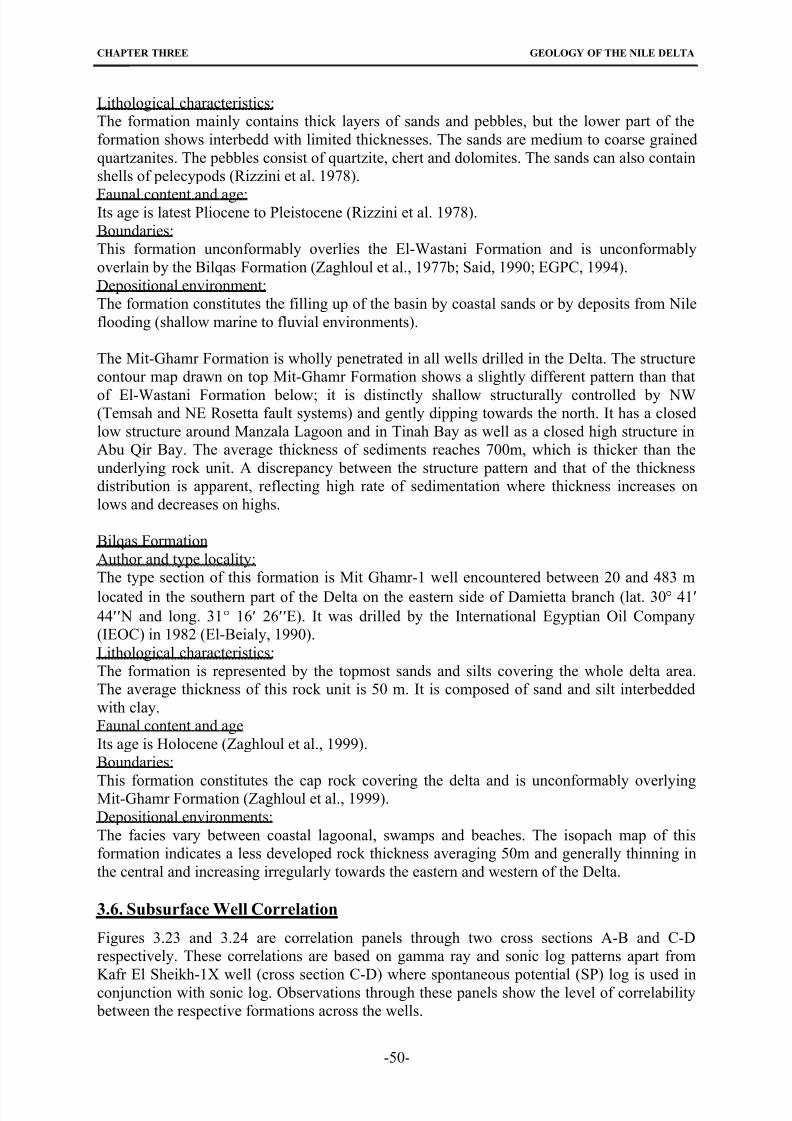
8/22/2019 barakat_moataz.pdf
http://slidepdf.com/reader/full/barakatmoatazpdf 64/158
CHAPTER THREE GEOLOGY OF THE NILE DELTA
Lithological characteristics:
The formation mainly contains thick layers of sands and pebbles, but the lower part of the
formation shows interbedd with limited thicknesses. The sands are medium to coarse grained
quartzanites. The pebbles consist of quartzite, chert and dolomites. The sands can also contain
shells of pelecypods (Rizzini et al. 1978).
Faunal content and age:Its age is latest Pliocene to Pleistocene (Rizzini et al. 1978).
Boundaries:
This formation unconformably overlies the El-Wastani Formation and is unconformably
overlain by the Bilqas Formation (Zaghloul et al., 1977b; Said, 1990; EGPC, 1994).
Depositional environment:
The formation constitutes the filling up of the basin by coastal sands or by deposits from Nile
flooding (shallow marine to fluvial environments).
The Mit-Ghamr Formation is wholly penetrated in all wells drilled in the Delta. The structure
contour map drawn on top Mit-Ghamr Formation shows a slightly different pattern than that
of El-Wastani Formation below; it is distinctly shallow structurally controlled by NW(Temsah and NE Rosetta fault systems) and gently dipping towards the north. It has a closed
low structure around Manzala Lagoon and in Tinah Bay as well as a closed high structure in
Abu Qir Bay. The average thickness of sediments reaches 700m, which is thicker than the
underlying rock unit. A discrepancy between the structure pattern and that of the thickness
distribution is apparent, reflecting high rate of sedimentation where thickness increases on
lows and decreases on highs.
Bilqas Formation
Author and type locality:
The type section of this formation is Mit Ghamr-1 well encountered between 20 and 483 m
located in the southern part of the Delta on the eastern side of Damietta branch (lat. 30 41
44 N and long. 31 16 26E). It was drilled by the International Egyptian Oil Company
(IEOC) in 1982 (El-Beialy, 1990).
Lithological characteristics:
The formation is represented by the topmost sands and silts covering the whole delta area.
The average thickness of this rock unit is 50 m. It is composed of sand and silt interbedded
with clay.
Faunal content and age
Its age is Holocene (Zaghloul et al., 1999).
Boundaries:
This formation constitutes the cap rock covering the delta and is unconformably overlyingMit-Ghamr Formation (Zaghloul et al., 1999).
Depositional environments:
The facies vary between coastal lagoonal, swamps and beaches. The isopach map of this
formation indicates a less developed rock thickness averaging 50m and generally thinning in
the central and increasing irregularly towards the eastern and western of the Delta.
3.6. Subsurface Well Correlation
Figures 3.23 and 3.24 are correlation panels through two cross sections A-B and C-D
respectively. These correlations are based on gamma ray and sonic log patterns apart from
Kafr El Sheikh-1X well (cross section C-D) where spontaneous potential (SP) log is used inconjunction with sonic log. Observations through these panels show the level of correlability
between the respective formations across the wells.
-50-
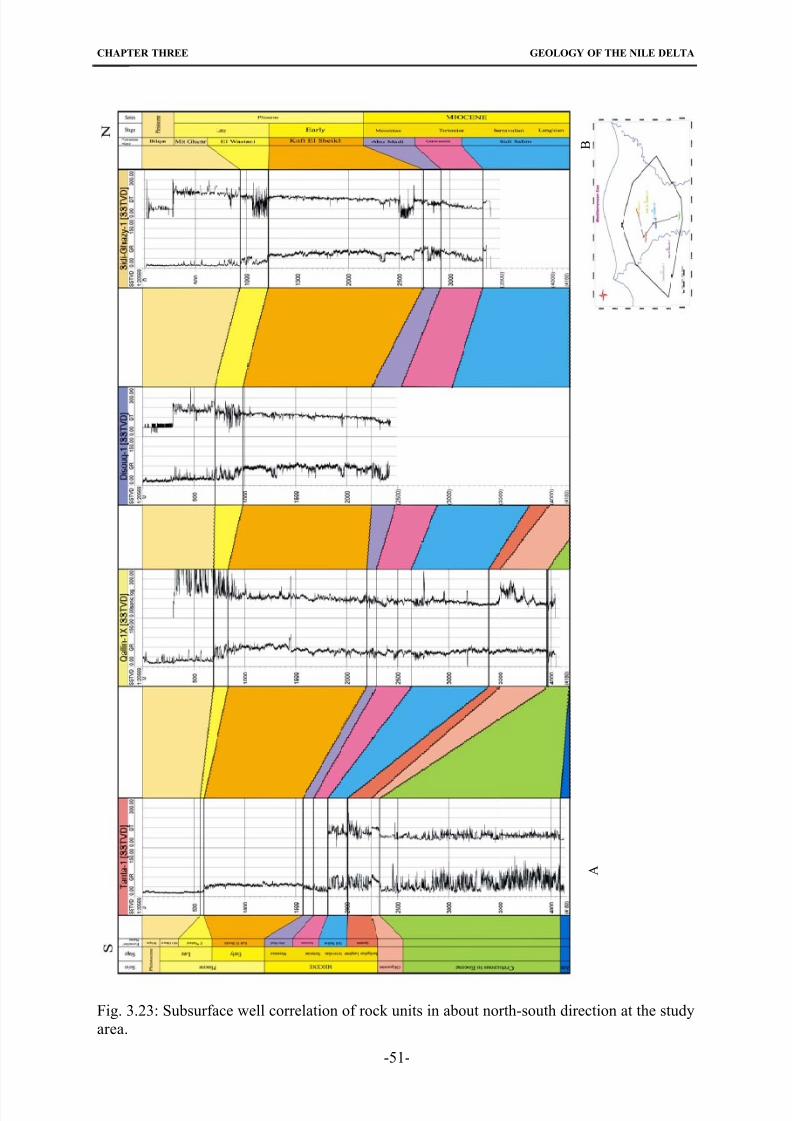
8/22/2019 barakat_moataz.pdf
http://slidepdf.com/reader/full/barakatmoatazpdf 65/158
CHAPTER THREE GEOLOGY OF THE NILE DELTA
B
A
Fig. 3.23: Subsurface well correlation of rock units in about north-south direction at the study
area.
-51-
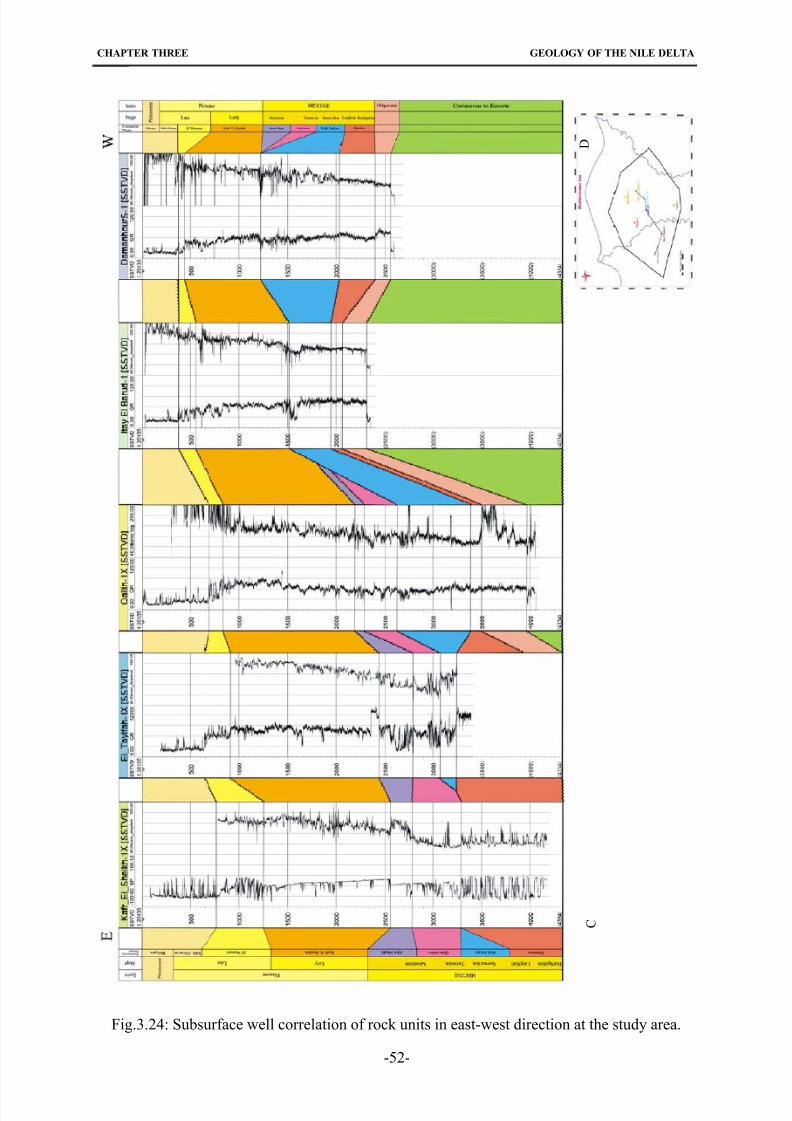
8/22/2019 barakat_moataz.pdf
http://slidepdf.com/reader/full/barakatmoatazpdf 66/158
CHAPTER THREE GEOLOGY OF THE NILE DELTA
D
C
Fig.3.24: Subsurface well correlation of rock units in east-west direction at the study area.
-52-
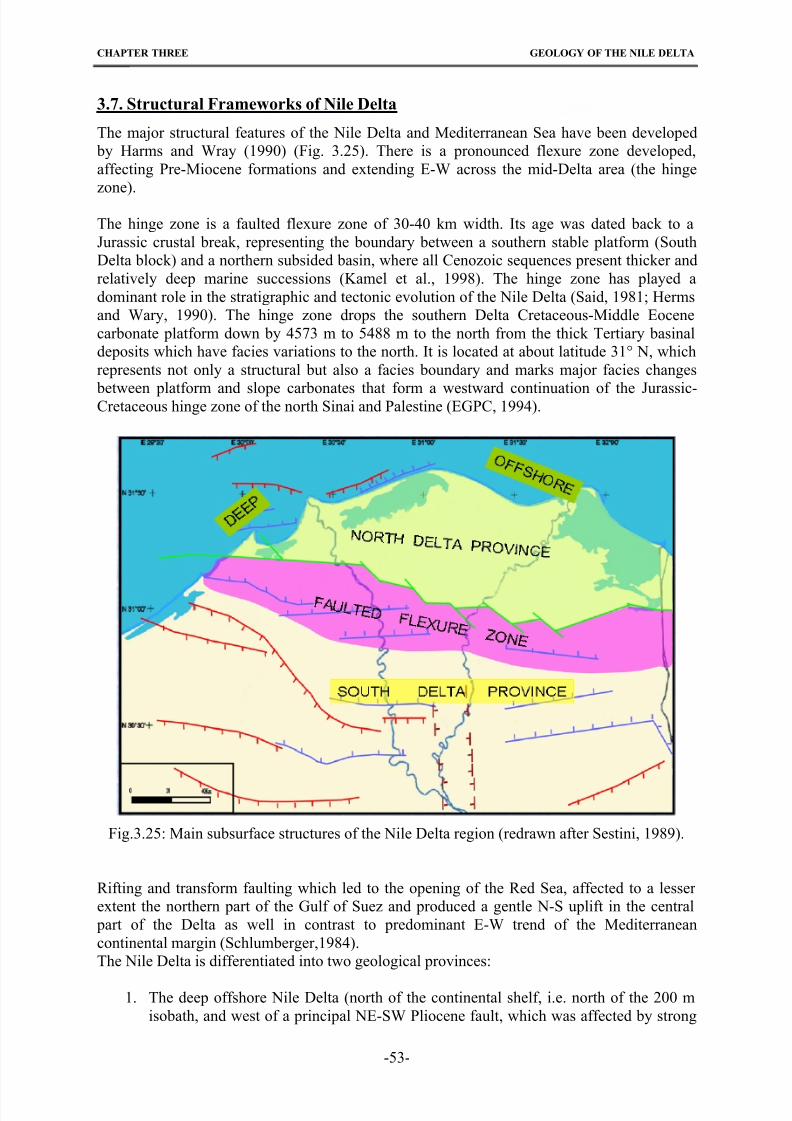
8/22/2019 barakat_moataz.pdf
http://slidepdf.com/reader/full/barakatmoatazpdf 67/158
CHAPTER THREE GEOLOGY OF THE NILE DELTA
3.7. Structural Frameworks of Nile Delta
The major structural features of the Nile Delta and Mediterranean Sea have been developed
by Harms and Wray (1990) (Fig. 3.25). There is a pronounced flexure zone developed,
affecting Pre-Miocene formations and extending E-W across the mid-Delta area (the hinge
zone).
The hinge zone is a faulted flexure zone of 30-40 km width. Its age was dated back to a
Jurassic crustal break, representing the boundary between a southern stable platform (South
Delta block) and a northern subsided basin, where all Cenozoic sequences present thicker and
relatively deep marine successions (Kamel et al., 1998). The hinge zone has played a
dominant role in the stratigraphic and tectonic evolution of the Nile Delta (Said, 1981; Herms
and Wary, 1990). The hinge zone drops the southern Delta Cretaceous-Middle Eocene
carbonate platform down by 4573 m to 5488 m to the north from the thick Tertiary basinal
deposits which have facies variations to the north. It is located at about latitude 31° N, which
represents not only a structural but also a facies boundary and marks major facies changes
between platform and slope carbonates that form a westward continuation of the Jurassic-Cretaceous hinge zone of the north Sinai and Palestine (EGPC, 1994).
Fig.3.25: Main subsurface structures of the Nile Delta region (redrawn after Sestini, 1989).
Rifting and transform faulting which led to the opening of the Red Sea, affected to a lesser
extent the northern part of the Gulf of Suez and produced a gentle N-S uplift in the central
part of the Delta as well in contrast to predominant E-W trend of the Mediterranean
continental margin (Schlumberger,1984).
The Nile Delta is differentiated into two geological provinces:
1. The deep offshore Nile Delta (north of the continental shelf, i.e. north of the 200 m
isobath, and west of a principal NE-SW Pliocene fault, which was affected by strong
-53-
8/22/2019 barakat_moataz.pdf
http://slidepdf.com/reader/full/barakatmoatazpdf 68/158
CHAPTER THREE GEOLOGY OF THE NILE DELTA
Pliocene-Pleistocene sediment loading (3500m in 4-5 m.y.). It displays large-scale
post-Messinian listric faulting, marked rollovers, rotated blocks, slump structures,
especially in the NNE and NE. Shale diaprism (individual swells and walls of over-
pressured Oligocene-Late Miocene shales) is notable over large areas and best
developed beneath the present continental slope. The shale diapirs are often truncated
by the late Middle Miocene unconformity (Sestini, 1995).2. The onshore Nile delta: The onshore Nile Delta region is divided by the flexure zone
which is known as a hinge line into two structural sedimentary sub-provinces: The
South Nile Delta block and the North Nile Delta basin.
2.1.The South Delta Block (10600 km2) is characterized by gradual northward dip
of middle Eocene-carbonates, which is represented by gently asymmetric folds
referred to as the Syrian Arc fold system and extends along an arcuate trend from
the northern Sinai to north of the Gulf of Suez across the southern part of the Delta
into the Western Desert. Some of these flexure zone faults extent to the Pliocene
sediments (Kamel et al, 1998). Just north of the flexure, the Miocene deposits are
dislocated by faults that bound rotated fault blocks and extend to the Serravallian-Tortonian unconformity. They are probably growth faults due to the greater
thickness of Miocene sediments in this belt. The southern Delta block is a
continuation of Western Desert in its stratigraphic sequence and structure (EGPC,
1994).
2.2.The North Delta Basin, encompassing the northern delta and the continental
shelf, about 23000 km2 in size, of which 9200 km2 are onshore. The northward
thickening Oligocene-Miocene sediments are cut by major down-to-basin faults,
often listric, with southward-rotated blocks, that are prominently truncated by a
broad erosional surface formed in late middle Miocene to early late Miocene
times. The domino-style tilted block faulting extends to the offshore inner
continental shelf region (Sestini, 1995). It is characterized by two main structure
patterns as follows: The first is a deep pre-Tortonian fault pattern (possibly to
Eocene - or Late Cretaceous) mainly of E-W fault blocks, prominent among which
are the shelf margin structures, which play a great role on the Miocene subsidence
and sedimentation. The second is a shallow post–Messinian fault pattern; these are
genetically related to sedimentary load of recent sediments at the unstable Delta
margin, which caused growth faulting, slumping and normal faults as well as
diapirism of uncompacted Pliocene and Messinian evaporites (Kamel et al, 1998).
The structural trends of the Nile delta were recognized by Sestini (1995) and Zaghloul et al.,
(2001) as the following:
1. The Tethyan trend, an east-west trend which could be related to the original
continental margin rifting of the south eastern Mediterranean during the early
Mesozoic and probably older. The best known examples for this trend are the Oligo-
Miocene Hinge Zone, Mit Ghamr Fault as well as the northern and southern flexures
of the onshore Nile Delta.
2. The Rosetta trend, a northeast-southwest trend Late Cretaceous age is exemplified by
the Pelusium, Qattara – Eratothenes, and the Gamasa, Idfina and Port Said-Hout lines.
The faults are likely to have originated from one point in the north east corner of the
Mediterranean Sea at Alexandron. In addition to the vertical motion component of
these faults, they exhibit sinistral strikeslip displacement.3. The northwest-southeast trend, active during the Miocene. Its best known example is
Temsah or Bardawil Line in the eastern offshore Nile Delta. The majority of the faults
-54-
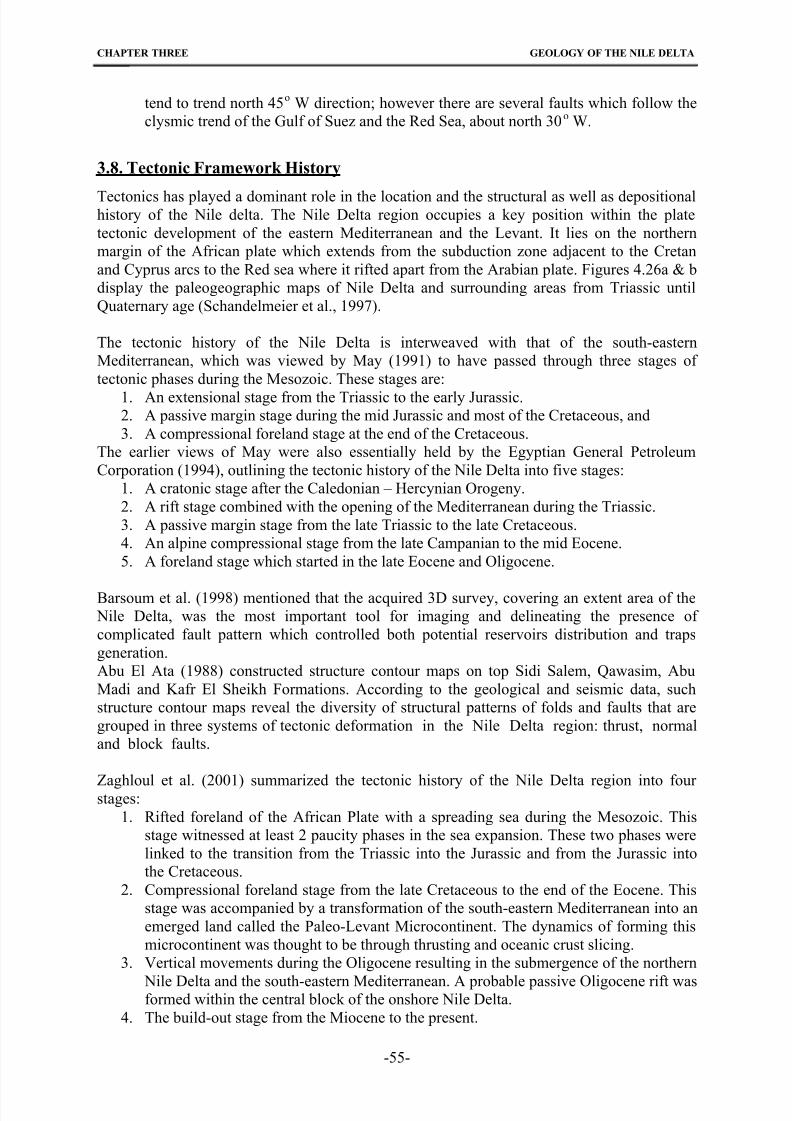
8/22/2019 barakat_moataz.pdf
http://slidepdf.com/reader/full/barakatmoatazpdf 69/158
CHAPTER THREE GEOLOGY OF THE NILE DELTA
tend to trend north 45o W direction; however there are several faults which follow the
clysmic trend of the Gulf of Suez and the Red Sea, about north 30o W.
3.8. Tectonic Framework History
Tectonics has played a dominant role in the location and the structural as well as depositionalhistory of the Nile delta. The Nile Delta region occupies a key position within the plate
tectonic development of the eastern Mediterranean and the Levant. It lies on the northern
margin of the African plate which extends from the subduction zone adjacent to the Cretan
and Cyprus arcs to the Red sea where it rifted apart from the Arabian plate. Figures 4.26a & b
display the paleogeographic maps of Nile Delta and surrounding areas from Triassic until
Quaternary age (Schandelmeier et al., 1997).
The tectonic history of the Nile Delta is interweaved with that of the south-eastern
Mediterranean, which was viewed by May (1991) to have passed through three stages of
tectonic phases during the Mesozoic. These stages are:
1. An extensional stage from the Triassic to the early Jurassic.2. A passive margin stage during the mid Jurassic and most of the Cretaceous, and
3. A compressional foreland stage at the end of the Cretaceous.
The earlier views of May were also essentially held by the Egyptian General Petroleum
Corporation (1994), outlining the tectonic history of the Nile Delta into five stages:
1. A cratonic stage after the Caledonian – Hercynian Orogeny.
2. A rift stage combined with the opening of the Mediterranean during the Triassic.
3. A passive margin stage from the late Triassic to the late Cretaceous.
4. An alpine compressional stage from the late Campanian to the mid Eocene.
5. A foreland stage which started in the late Eocene and Oligocene.
Barsoum et al. (1998) mentioned that the acquired 3D survey, covering an extent area of the
Nile Delta, was the most important tool for imaging and delineating the presence of
complicated fault pattern which controlled both potential reservoirs distribution and traps
generation.
Abu El Ata (1988) constructed structure contour maps on top Sidi Salem, Qawasim, Abu
Madi and Kafr El Sheikh Formations. According to the geological and seismic data, such
structure contour maps reveal the diversity of structural patterns of folds and faults that are
grouped in three systems of tectonic deformation in the Nile Delta region: thrust, normal
and block faults.
Zaghloul et al. (2001) summarized the tectonic history of the Nile Delta region into four stages:
1. Rifted foreland of the African Plate with a spreading sea during the Mesozoic. This
stage witnessed at least 2 paucity phases in the sea expansion. These two phases were
linked to the transition from the Triassic into the Jurassic and from the Jurassic into
the Cretaceous.
2. Compressional foreland stage from the late Cretaceous to the end of the Eocene. This
stage was accompanied by a transformation of the south-eastern Mediterranean into an
emerged land called the Paleo-Levant Microcontinent. The dynamics of forming this
microcontinent was thought to be through thrusting and oceanic crust slicing.
3. Vertical movements during the Oligocene resulting in the submergence of the northern
Nile Delta and the south-eastern Mediterranean. A probable passive Oligocene rift wasformed within the central block of the onshore Nile Delta.
4. The build-out stage from the Miocene to the present.
-55-
8/22/2019 barakat_moataz.pdf
http://slidepdf.com/reader/full/barakatmoatazpdf 70/158
CHAPTER THREE GEOLOGY OF THE NILE DELTA
Fig.4.26a: Paleogeographic maps of Nile Delta and surrounding areas from the Triassic toQuaternary (Schandelmeier et al., 1997).
-56-
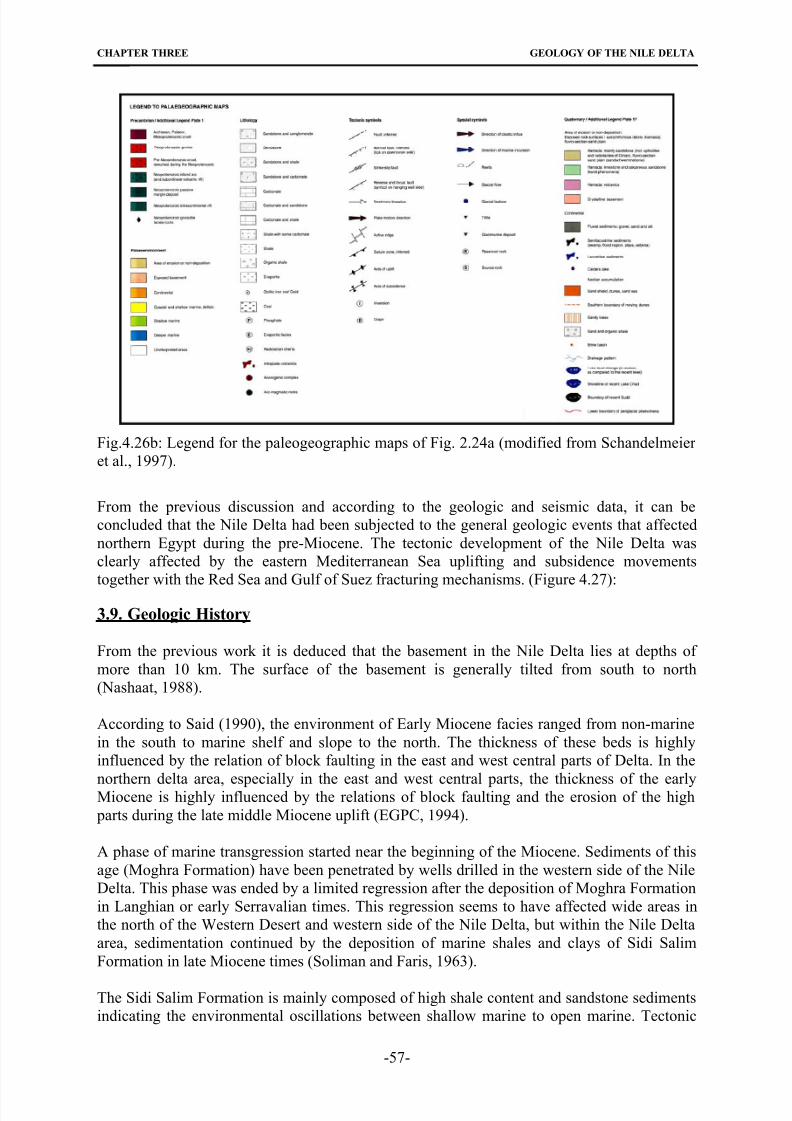
8/22/2019 barakat_moataz.pdf
http://slidepdf.com/reader/full/barakatmoatazpdf 71/158
CHAPTER THREE GEOLOGY OF THE NILE DELTA
Fig.4.26b: Legend for the paleogeographic maps of Fig. 2.24a (modified from Schandelmeier
et al., 1997).
From the previous discussion and according to the geologic and seismic data, it can be
concluded that the Nile Delta had been subjected to the general geologic events that affected
northern Egypt during the pre-Miocene. The tectonic development of the Nile Delta was
clearly affected by the eastern Mediterranean Sea uplifting and subsidence movements
together with the Red Sea and Gulf of Suez fracturing mechanisms. (Figure 4.27):
3.9. Geologic History
From the previous work it is deduced that the basement in the Nile Delta lies at depths of
more than 10 km. The surface of the basement is generally tilted from south to north
(Nashaat, 1988).
According to Said (1990), the environment of Early Miocene facies ranged from non-marine
in the south to marine shelf and slope to the north. The thickness of these beds is highly
influenced by the relation of block faulting in the east and west central parts of Delta. In the
northern delta area, especially in the east and west central parts, the thickness of the earlyMiocene is highly influenced by the relations of block faulting and the erosion of the high
parts during the late middle Miocene uplift (EGPC, 1994).
A phase of marine transgression started near the beginning of the Miocene. Sediments of this
age (Moghra Formation) have been penetrated by wells drilled in the western side of the Nile
Delta. This phase was ended by a limited regression after the deposition of Moghra Formation
in Langhian or early Serravalian times. This regression seems to have affected wide areas in
the north of the Western Desert and western side of the Nile Delta, but within the Nile Delta
area, sedimentation continued by the deposition of marine shales and clays of Sidi Salim
Formation in late Miocene times (Soliman and Faris, 1963).
The Sidi Salim Formation is mainly composed of high shale content and sandstone sediments
indicating the environmental oscillations between shallow marine to open marine. Tectonic
-57-
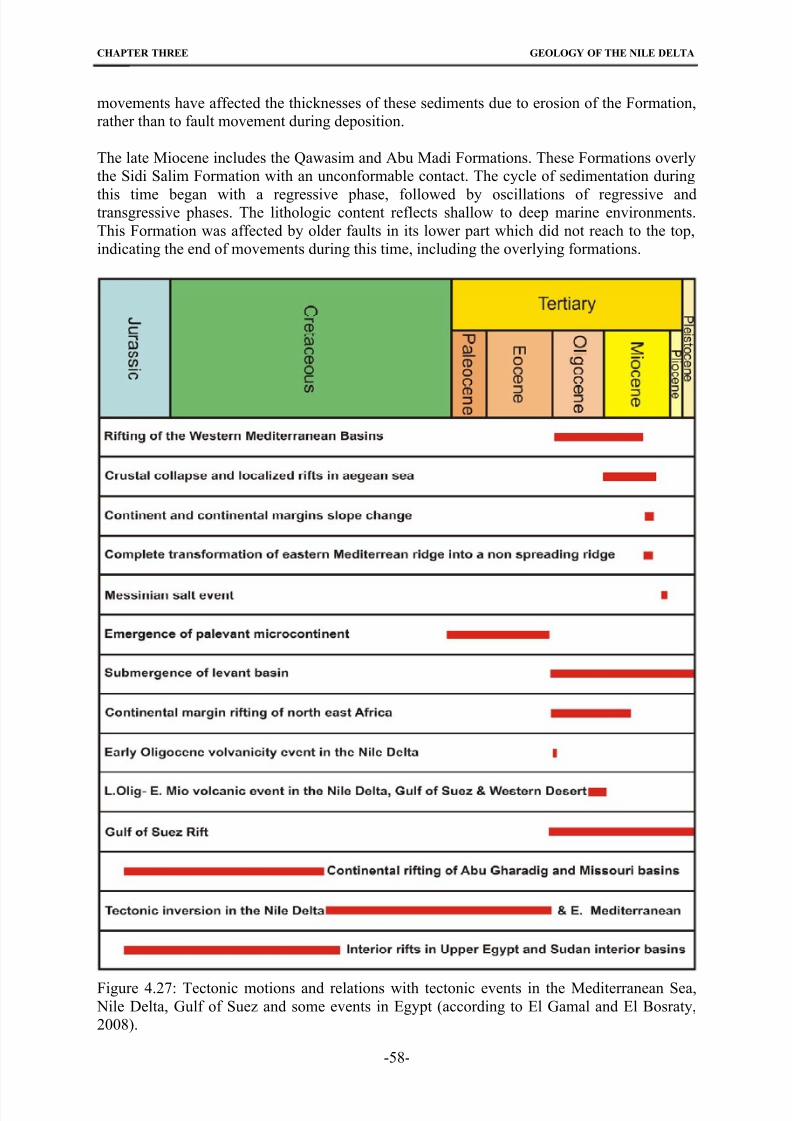
8/22/2019 barakat_moataz.pdf
http://slidepdf.com/reader/full/barakatmoatazpdf 72/158
CHAPTER THREE GEOLOGY OF THE NILE DELTA
movements have affected the thicknesses of these sediments due to erosion of the Formation,
rather than to fault movement during deposition.
The late Miocene includes the Qawasim and Abu Madi Formations. These Formations overly
the Sidi Salim Formation with an unconformable contact. The cycle of sedimentation during
this time began with a regressive phase, followed by oscillations of regressive andtransgressive phases. The lithologic content reflects shallow to deep marine environments.
This Formation was affected by older faults in its lower part which did not reach to the top,
indicating the end of movements during this time, including the overlying formations.
Figure 4.27: Tectonic motions and relations with tectonic events in the Mediterranean Sea,
Nile Delta, Gulf of Suez and some events in Egypt (according to El Gamal and El Bosraty,
2008).
-58-
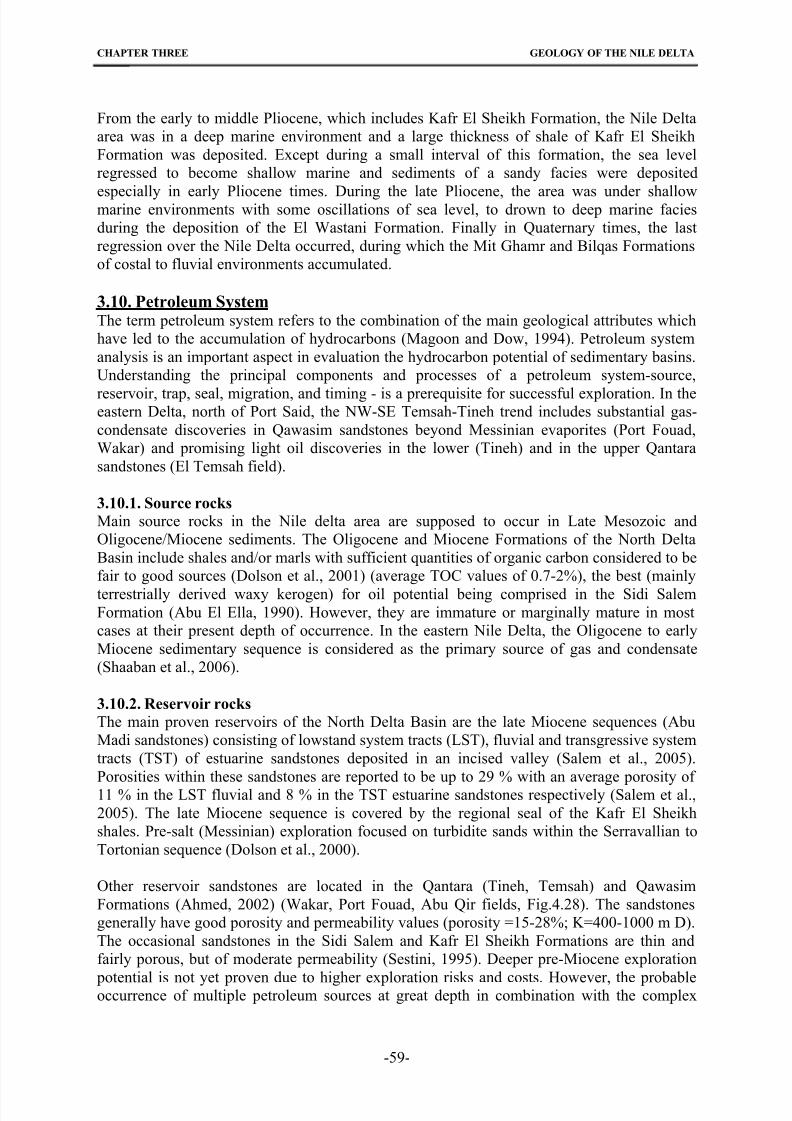
8/22/2019 barakat_moataz.pdf
http://slidepdf.com/reader/full/barakatmoatazpdf 73/158
CHAPTER THREE GEOLOGY OF THE NILE DELTA
From the early to middle Pliocene, which includes Kafr El Sheikh Formation, the Nile Delta
area was in a deep marine environment and a large thickness of shale of Kafr El Sheikh
Formation was deposited. Except during a small interval of this formation, the sea level
regressed to become shallow marine and sediments of a sandy facies were deposited
especially in early Pliocene times. During the late Pliocene, the area was under shallowmarine environments with some oscillations of sea level, to drown to deep marine facies
during the deposition of the El Wastani Formation. Finally in Quaternary times, the last
regression over the Nile Delta occurred, during which the Mit Ghamr and Bilqas Formations
of costal to fluvial environments accumulated.
3.10. Petroleum System
The term petroleum system refers to the combination of the main geological attributes which
have led to the accumulation of hydrocarbons (Magoon and Dow, 1994). Petroleum system
analysis is an important aspect in evaluation the hydrocarbon potential of sedimentary basins.
Understanding the principal components and processes of a petroleum system-source,
reservoir, trap, seal, migration, and timing - is a prerequisite for successful exploration. In theeastern Delta, north of Port Said, the NW-SE Temsah-Tineh trend includes substantial gas-
condensate discoveries in Qawasim sandstones beyond Messinian evaporites (Port Fouad,
Wakar) and promising light oil discoveries in the lower (Tineh) and in the upper Qantara
sandstones (El Temsah field).
3.10.1. Source rocks
Main source rocks in the Nile delta area are supposed to occur in Late Mesozoic and
Oligocene/Miocene sediments. The Oligocene and Miocene Formations of the North Delta
Basin include shales and/or marls with sufficient quantities of organic carbon considered to be
fair to good sources (Dolson et al., 2001) (average TOC values of 0.7-2%), the best (mainly
terrestrially derived waxy kerogen) for oil potential being comprised in the Sidi SalemFormation (Abu El Ella, 1990). However, they are immature or marginally mature in most
cases at their present depth of occurrence. In the eastern Nile Delta, the Oligocene to early
Miocene sedimentary sequence is considered as the primary source of gas and condensate
(Shaaban et al., 2006).
3.10.2. Reservoir rocks
The main proven reservoirs of the North Delta Basin are the late Miocene sequences (Abu
Madi sandstones) consisting of lowstand system tracts (LST), fluvial and transgressive system
tracts (TST) of estuarine sandstones deposited in an incised valley (Salem et al., 2005).
Porosities within these sandstones are reported to be up to 29 % with an average porosity of
11 % in the LST fluvial and 8 % in the TST estuarine sandstones respectively (Salem et al.,
2005). The late Miocene sequence is covered by the regional seal of the Kafr El Sheikh
shales. Pre-salt (Messinian) exploration focused on turbidite sands within the Serravallian to
Tortonian sequence (Dolson et al., 2000).
Other reservoir sandstones are located in the Qantara (Tineh, Temsah) and Qawasim
Formations (Ahmed, 2002) (Wakar, Port Fouad, Abu Qir fields, Fig.4.28). The sandstones
generally have good porosity and permeability values (porosity =15-28%; K=400-1000 m D).
The occasional sandstones in the Sidi Salem and Kafr El Sheikh Formations are thin and
fairly porous, but of moderate permeability (Sestini, 1995). Deeper pre-Miocene exploration
potential is not yet proven due to higher exploration risks and costs. However, the probableoccurrence of multiple petroleum sources at great depth in combination with the complex
-59-
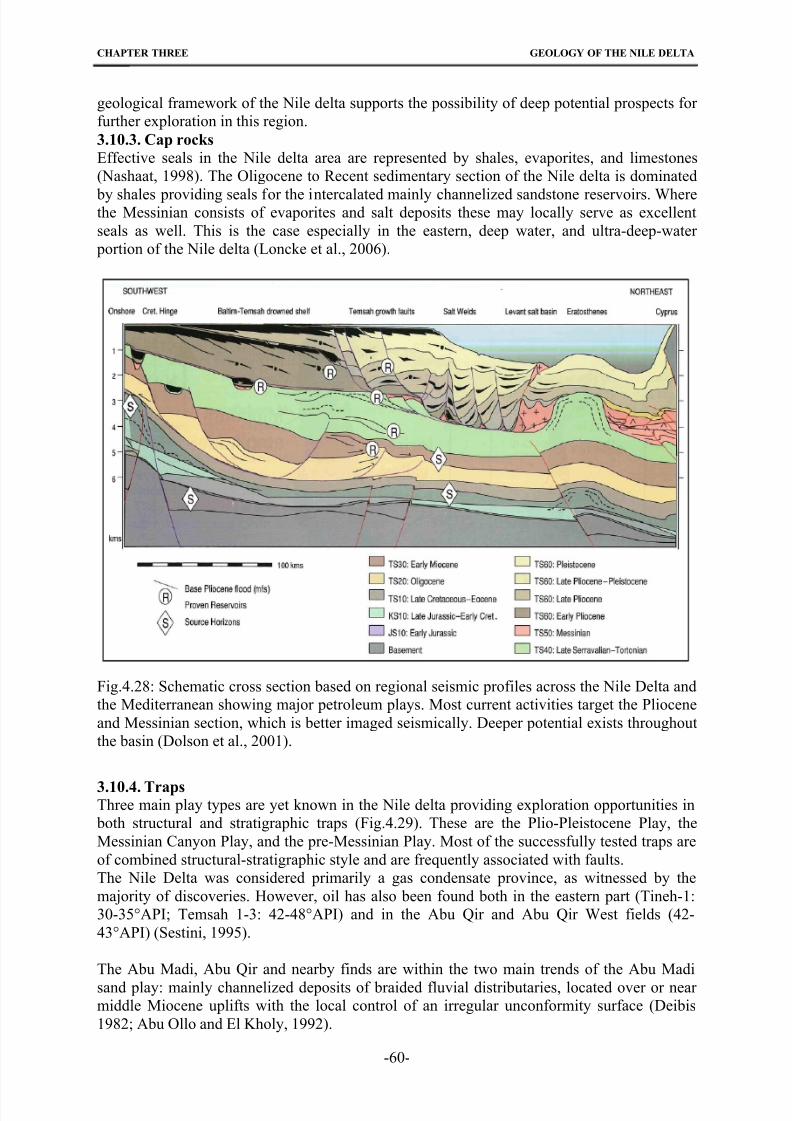
8/22/2019 barakat_moataz.pdf
http://slidepdf.com/reader/full/barakatmoatazpdf 74/158
CHAPTER THREE GEOLOGY OF THE NILE DELTA
geological framework of the Nile delta supports the possibility of deep potential prospects for
further exploration in this region.
3.10.3. Cap rocks
Effective seals in the Nile delta area are represented by shales, evaporites, and limestones
(Nashaat, 1998). The Oligocene to Recent sedimentary section of the Nile delta is dominated
by shales providing seals for the intercalated mainly channelized sandstone reservoirs. Wherethe Messinian consists of evaporites and salt deposits these may locally serve as excellent
seals as well. This is the case especially in the eastern, deep water, and ultra-deep-water
portion of the Nile delta (Loncke et al., 2006).
Fig.4.28: Schematic cross section based on regional seismic profiles across the Nile Delta and
the Mediterranean showing major petroleum plays. Most current activities target the Pliocene
and Messinian section, which is better imaged seismically. Deeper potential exists throughout
the basin (Dolson et al., 2001).
3.10.4. TrapsThree main play types are yet known in the Nile delta providing exploration opportunities in
both structural and stratigraphic traps (Fig.4.29). These are the Plio-Pleistocene Play, the
Messinian Canyon Play, and the pre-Messinian Play. Most of the successfully tested traps are
of combined structural-stratigraphic style and are frequently associated with faults.
The Nile Delta was considered primarily a gas condensate province, as witnessed by the
majority of discoveries. However, oil has also been found both in the eastern part (Tineh-1:
30-35°API; Temsah 1-3: 42-48°API) and in the Abu Qir and Abu Qir West fields (42-
43°API) (Sestini, 1995).
The Abu Madi, Abu Qir and nearby finds are within the two main trends of the Abu Madi
sand play: mainly channelized deposits of braided fluvial distributaries, located over or near middle Miocene uplifts with the local control of an irregular unconformity surface (Deibis
1982; Abu Ollo and El Kholy, 1992).
-60-
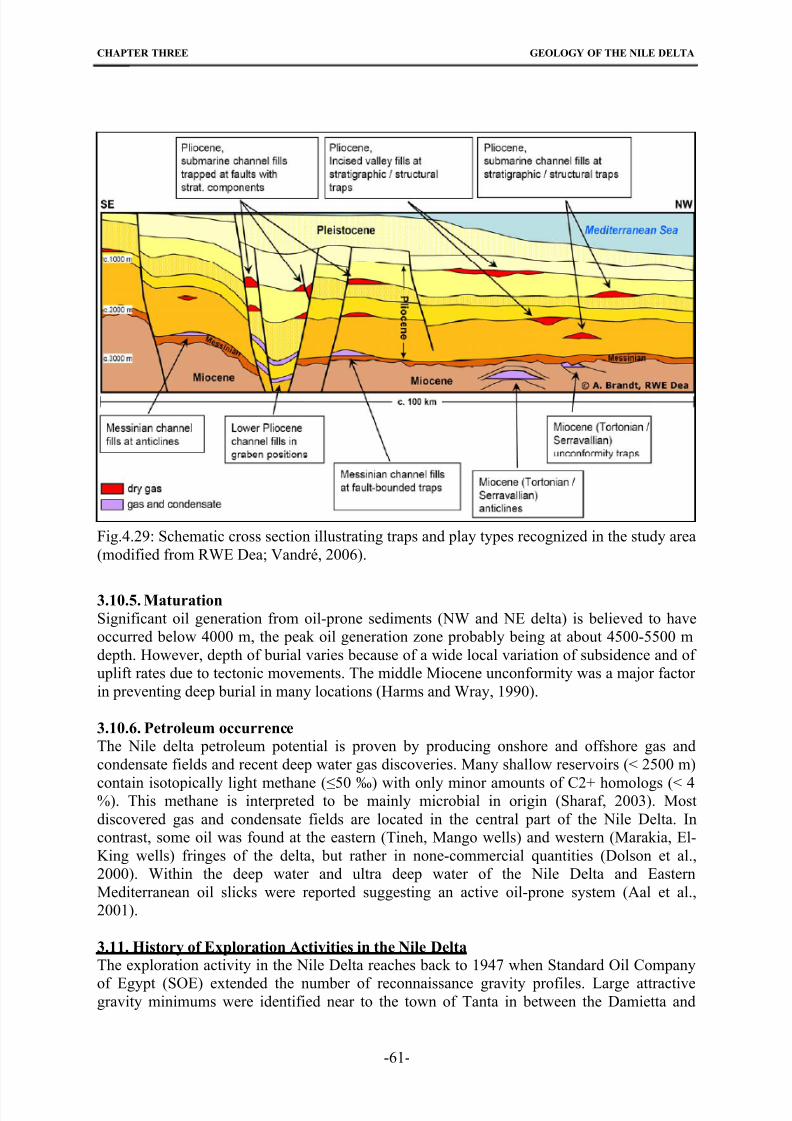
8/22/2019 barakat_moataz.pdf
http://slidepdf.com/reader/full/barakatmoatazpdf 75/158
CHAPTER THREE GEOLOGY OF THE NILE DELTA
Fig.4.29: Schematic cross section illustrating traps and play types recognized in the study area
(modified from RWE Dea; Vandré, 2006).
3.10.5. Maturation
Significant oil generation from oil-prone sediments (NW and NE delta) is believed to have
occurred below 4000 m, the peak oil generation zone probably being at about 4500-5500 m
depth. However, depth of burial varies because of a wide local variation of subsidence and of
uplift rates due to tectonic movements. The middle Miocene unconformity was a major factor
in preventing deep burial in many locations (Harms and Wray, 1990).
3.10.6. Petroleum occurrence
The Nile delta petroleum potential is proven by producing onshore and offshore gas and
condensate fields and recent deep water gas discoveries. Many shallow reservoirs (< 2500 m)
contain isotopically light methane (≤50 ‰) with only minor amounts of C2+ homologs (< 4%). This methane is interpreted to be mainly microbial in origin (Sharaf, 2003). Most
discovered gas and condensate fields are located in the central part of the Nile Delta. In
contrast, some oil was found at the eastern (Tineh, Mango wells) and western (Marakia, El-
King wells) fringes of the delta, but rather in none-commercial quantities (Dolson et al.,
2000). Within the deep water and ultra deep water of the Nile Delta and Eastern
Mediterranean oil slicks were reported suggesting an active oil-prone system (Aal et al.,
2001).
3.11. History of Exploration Activities in the Nile Delta
The exploration activity in the Nile Delta reaches back to 1947 when Standard Oil Company
of Egypt (SOE) extended the number of reconnaissance gravity profiles. Large attractivegravity minimums were identified near to the town of Tanta in between the Damietta and
-61-
8/22/2019 barakat_moataz.pdf
http://slidepdf.com/reader/full/barakatmoatazpdf 76/158
CHAPTER THREE GEOLOGY OF THE NILE DELTA
Rosetta branches of the River Nile. However, the actual explorations activities had not started
until 1963.
3.11.1. First Exploration Phase (1963 - 1972)
Serious exploration activity started 1963 when the first concession, covering the major part of
Nile delta, was granted to Agip. In 1966, the International Egyptian Oil Company (IEOC)drilled the first well Mit Ghamr-l, the first exploratory well in the onshore Delta. Although
gas shows were encountered in Miocene deposits, however, the well was plugged and
abandoned as dry hole. In 1967, the first gas discovery from the late Miocene Abu Madi
Formation in the northeastern part of the onshore Delta in Abu Madi area by drilling the Abu
Madi-1, 3, 5 and 7 wells was observed. The other two wells - Abu Madi -4 and -6 were
considered dry. Through the period from 1966 to 1971, IEOC drilled six more exploratory
wells; these wells were named Kafr El Sheikh, Abu Hammad, EI Wastani, Sidi Salim, S.W.
Bilqas, Shibin EI Kom (EGPC,1994).
In 1963, parallel to IEOC activities, Phillips Petroleum Company acquired large concessions
which consisted mainly of three provinces, namely Burg El Arab, Matruh und Faghur. TheBurg El Arab province included a deltaic onshore and offshore area to the West of the Rosetta
branch, which can be considered geologically related to the Delta proper. In 1969, Phillips
discovered the Abu Qir Gas Field with the first well Abu Qir-l offshore. Later on, the drilling
was extended in the onshore area. In the period 1964-1972, Agip and Philips carried out
seismic surveys for a total of 17,000 km (El Shafei, 2004). Through 1970-1971 Wepco drilled
eight exploratory wells in the onshore Delta. These wells are Kafr El Dawar, S. Damanhur, N.
Dillingat, Hosh Isa, Ita El Baroud, Mahmoudiya, El Tahia and Buseili. In 1975, this company
drilled also Abu Qir-3 as dry hole in the onshore portion of Abu Qir Bay.
3.11.2. Second Exploration Phase (1973 -1980)
Intensive exploration activities started in particular after the establishment of the Ministry of Petroleum in 1973. In 1973 the first agreement about the Abu Madi Gas Field Production was
signed and, according to this agreement, all production from Abu Madi Field are owned by
the Egyptian Government. At the end of the same year two large concession agreements
started in the Mediterranean Sea with two international oil companies. The first concession
was acquired by Esso in the offshore Delta. Esso drilled two deep-water exploratory wells in
1975, namely NDOA-1 and NDOB-1. The second concession was acquired by Mobil in the
northeastern offshore part of the Delta. Mobil drilled 5 exploratory wells.
In 1974, two more large concession areas were acquired by two other international
companies. The first concession was acquired by IEOC mainly in the onshore north Delta and
only partially offshore. IEOC drilled 9 wells; all the wells had been plugged and abandoned as
dry holes except well Qantara-1. The second concession was obtained in 1974 by Conoco in
Mid Delta onshore. Conoco drilled 6 dry holes in this period.
In 1975, the North Alexandria Marine concession was acquired by Elf. This company drilled
five wells among them NAF-1 in 1978, and NAF-3 in 1983 which tested high rates of gas and
condensates from the late Miocene Abu Madi Formation. In 1978 Petrobel drilled 9 wells in
the Abu Madi development lease‚ three of which showed to be dry holes, Abu Madi-9, 12
and 15; while the other six wells produced gas from different levels within Abu Madi
Formation, these were Abu Madi-8, 10, 11, 13, 14 and 16.
Exploration in the southern and western Nile Delta during this time was very limited.
Although no discoveries were made in any of these areas, the drilled wells provided essential
-62-
8/22/2019 barakat_moataz.pdf
http://slidepdf.com/reader/full/barakatmoatazpdf 77/158
CHAPTER THREE GEOLOGY OF THE NILE DELTA
information on the Mesozoic stratigraphy of the Nile Delta indicating the occurrence of a find
basin of potential mature source rocks. It is necessary to mention that all agreement laws until
this time were issued for oil only and any discovered gas was considered to be owned by the
Government.
3.11.3. Third Exploration Phase (1980 -1986)From the 1980’s EGPC started to include a Gas Clause article in the concession agreements to
encourage companies to look for gas as well as oil. The "gas clause" divided which profit on
gas, typically on a basis of approximately 80% - 20% in favor of EGPC was also inserted
retrospectively into some licenses.
In 1982 IEOC drilled El Qara-1, 2 and 3 exploratory wells. The three wells tested commercial
rates of gas and condensates from the Abu Madi Formation. In 1983, Elf Aquitaine also
amended the agreement of North Alexandria Marine concession to add the initial gas articles.
The company succeeded to prove the existence of more than 7 billion SCM of gas reserves in
NAF area. The NAF producing area was added later on to Abu Qir producing field to be
operated by Wepco on the expense of EGPC.
3.11.4. Fourth Exploration Phase (1987-1994)
This exploration phase has already witnessed the worldwide recession in hydrocarbon prices
having started in 1986. The sharp decline in the crude oil price had negatively affected the
investments in the oil industry. Consequently, EGPC introduced the Gas Clause Article as
mentioned before.
IEOC held 3095 km2 of the main Delta Gas concession in 1989 for two more years to drill
two wells which were essentially of exploratory character. The company had the right to
declare commercial gas discovery according to the new Gas Clause Article in both new and
old discoveries. In this concession, IEOC drilled Je 62 -1 and Jd 67 -1 wells in 1989 the two
wells tested commercial gas and condensates, in addition to Nidoco -3 which turned out a dry
hole. In 1989, two more concession areas in the onshore Delta were acquired by Arco, namely
West Delta and South Delta. In the West Delta concession Arco drilled three wells, two of
which had to be classified as dry holes, Sidi Ghazi-1 and Jc 62-1, while the third tested
reasonable amounts of gas from the Abu Madi Formation.
In 1990, IEOC drilled the well Je 65-1 in East Delta concession, which tested reasonable
amounts of gas from the Abu Madi Formation. However, in 1992 the company drilled three
more dry holes, Jb 67 -1, Jc 65 -3 and Jb 64-3. In 1993, IEOC made a successful appraisal
drilling in the Port Fouad and Baltime Concessions.
There was a high level of drilling activity in the North Delta basin during 1989 to 1994. 40
wells had been drilled, where as only 17 wells had seen drilled in 1992. Up to end-1994, the
number of exploration wells had reached to 105 (El Shafei, 2004). The hydrocarbon
production of Egypt developed as follows (Sestini, 1995) Table 3.6. Structural prospects have
been identified in all TWT and depth-structure maps. These are shown in the (Fig.3.30). More
than 135 prospects and leads were delineated in the on- and offshore Delta (EGPC, 1994).
3.11.5. Fifth Exploration Phase (1994-present)
Since 1994, the Nile Delta has witnessed rapidly increasing intensive exploration campaigns.
New discoveries were made because all companies applied improved exploration techniquessuch as 3D seismic acquisition, bright spots and flat spot analysis combined with using the
AVO technique to the new prospects in the offshore Nile Delta.
-63-
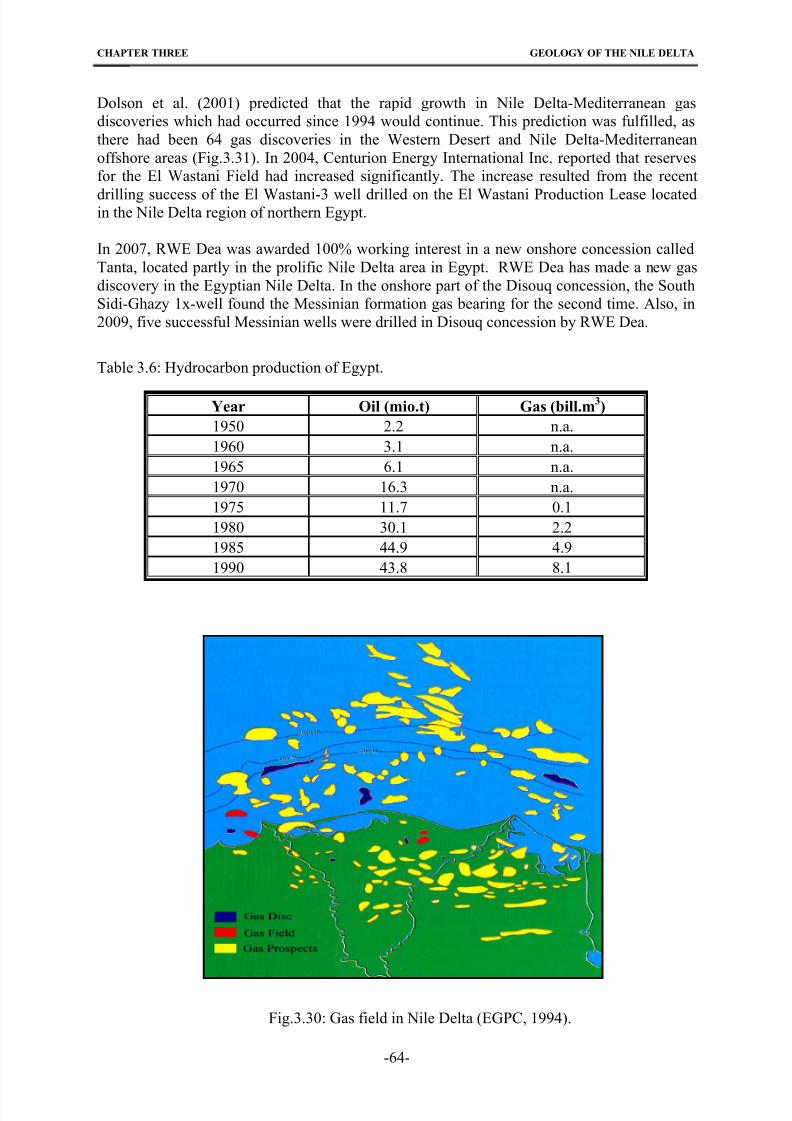
8/22/2019 barakat_moataz.pdf
http://slidepdf.com/reader/full/barakatmoatazpdf 78/158
CHAPTER THREE GEOLOGY OF THE NILE DELTA
Dolson et al. (2001) predicted that the rapid growth in Nile Delta-Mediterranean gas
discoveries which had occurred since 1994 would continue. This prediction was fulfilled, as
there had been 64 gas discoveries in the Western Desert and Nile Delta-Mediterranean
offshore areas (Fig.3.31). In 2004, Centurion Energy International Inc. reported that reserves
for the El Wastani Field had increased significantly. The increase resulted from the recent
drilling success of the El Wastani-3 well drilled on the El Wastani Production Lease locatedin the Nile Delta region of northern Egypt.
In 2007, RWE Dea was awarded 100% working interest in a new onshore concession called
Tanta, located partly in the prolific Nile Delta area in Egypt. RWE Dea has made a new gas
discovery in the Egyptian Nile Delta. In the onshore part of the Disouq concession, the South
Sidi-Ghazy 1x-well found the Messinian formation gas bearing for the second time. Also, in
2009, five successful Messinian wells were drilled in Disouq concession by RWE Dea.
Table 3.6: Hydrocarbon production of Egypt.
Year Oil (mio.t) Gas (bill.m3)
1950 2.2 n.a.
1960 3.1 n.a.
1965 6.1 n.a.
1970 16.3 n.a.
1975 11.7 0.1
1980 30.1 2.2
1985 44.9 4.9
1990 43.8 8.1
Fig.3.30: Gas field in Nile Delta (EGPC, 1994).
-64-
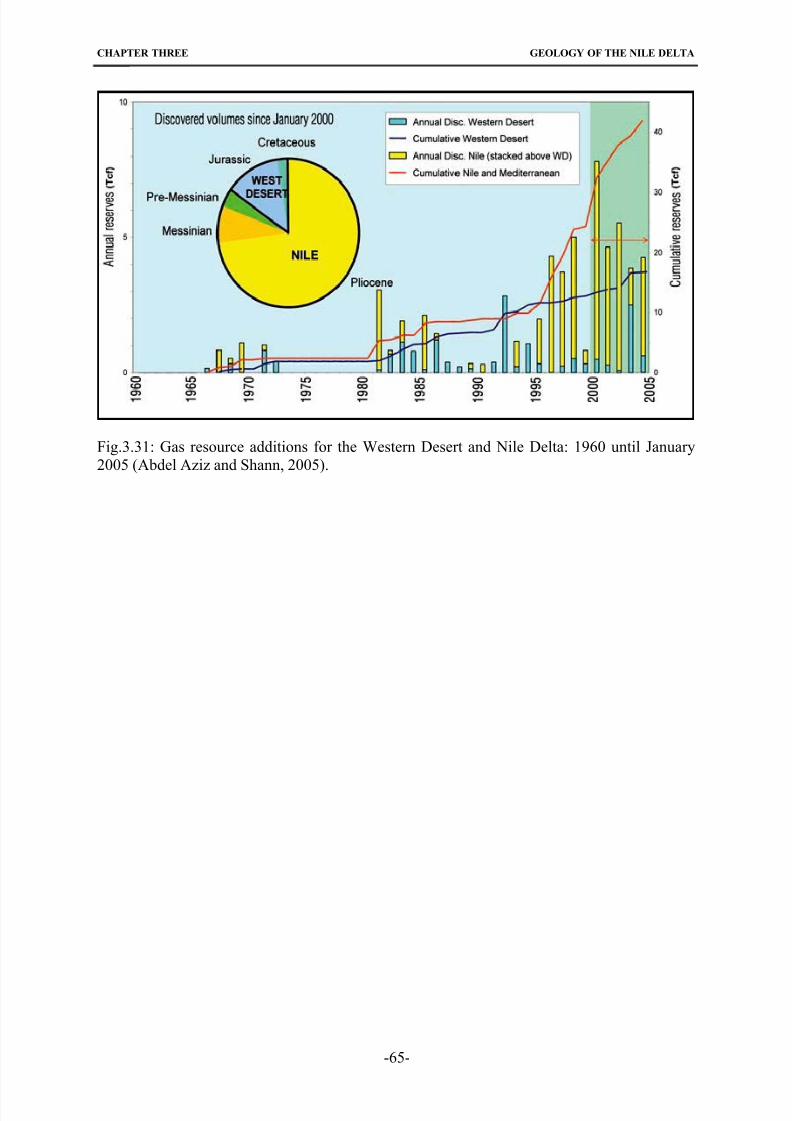
8/22/2019 barakat_moataz.pdf
http://slidepdf.com/reader/full/barakatmoatazpdf 79/158
CHAPTER THREE GEOLOGY OF THE NILE DELTA
-65-
Fig.3.31: Gas resource additions for the Western Desert and Nile Delta: 1960 until January
2005 (Abdel Aziz and Shann, 2005).
8/22/2019 barakat_moataz.pdf
http://slidepdf.com/reader/full/barakatmoatazpdf 80/158
CHAPTER FOUR SEISMIC INVESTIGATIONS
CHAPTER FOUR
SEISMIC INVESTIGATIONS
4.1. General
Seismic surveys were first carried out in the early 1920’s; they provide a clear and uniquely
detailed picture of subsurface geology. Seismic methods are widely applied in exploration
problems involving the detection and mapping of subsurface structures as well as the search
for oil and gas (Peter, 1993).
In seismic surveys, seismic waves are propagated through the earth’s interior and the travel
times of waves are measured that return to the surface after refraction or reflection at
geological boundaries. These travel times may be converted into depth values and, hence, the
distribution of subsurface interfaces of geological interest may be mapped systematically.
Other phenomena add to the picture or interfere and must be taken into account. Some phenomena require correction; some must be attenuated to make the reflections more
interpretable (Coffeen, 1986).
The geological information desired from seismic data is the shape and relative position of the
geologic formations of interest. In areas of good data quality it is possible to detect the
lithology based upon velocity information. The velocities of seismic waves are used to
convert the known reflection times into estimated reflector depths. The use of seismic
reflection data in deducing fold axes, fault trends and structural closures plays also an
important role in subsurface geology.
Deriving a deterministic relationship between the seismic data and geological properties of the subsurface is a difficult task. The relationship is found at the well locations and applied to
the exploration area covered by seismic data. They combine well log properties and seismic
attributes to predict property distributions. The process of interpretation of seismic data,
particularly in the areas of complex geology (stratigraphically and structurally) is very
sensitive to the velocity regime of their sequences (Dix, 1939).
4.2. History of Seismic Activities in the Nile Delta
Seismic activities in the Nile Delta have started in 1963. In the period 1964-1972, Agip and
Philips carried out seismic surveys for a total of 17,000 km. Since the 1980’s about 25,000 km
of land seismic and 27,000 km of offshore seismic lines have been acquired and 55 wells were
drilled. By the early 1980’s the IEOC/Marathon/Conoco partnership considered the Nile Delta
to have all the ingredients of a new hydrocarbon province. Up to end 1994 the number of
exploration wells had reached 105.
Since 1994, the Nile Delta has witnessed a rapidly increasing intensive exploration campaign.
All companies applied new exploration techniques such as 3D seismic acquisition, bright
spots and flat spots combined by using the seismic reflection amplitude versus offset (AVO)
technique to the new prospects in the offshore Nile Delta. In 2000, exploration activity was
concentrated in the western offshore Nile Delta. Approximately 26 TCF of gas have been
discovered in the last five years, an average annual increase of 5.2 TCF of this newlydiscovered gas resource, and approximately 84% was found in the Nile Delta-Mediterranean
areas.
-66-
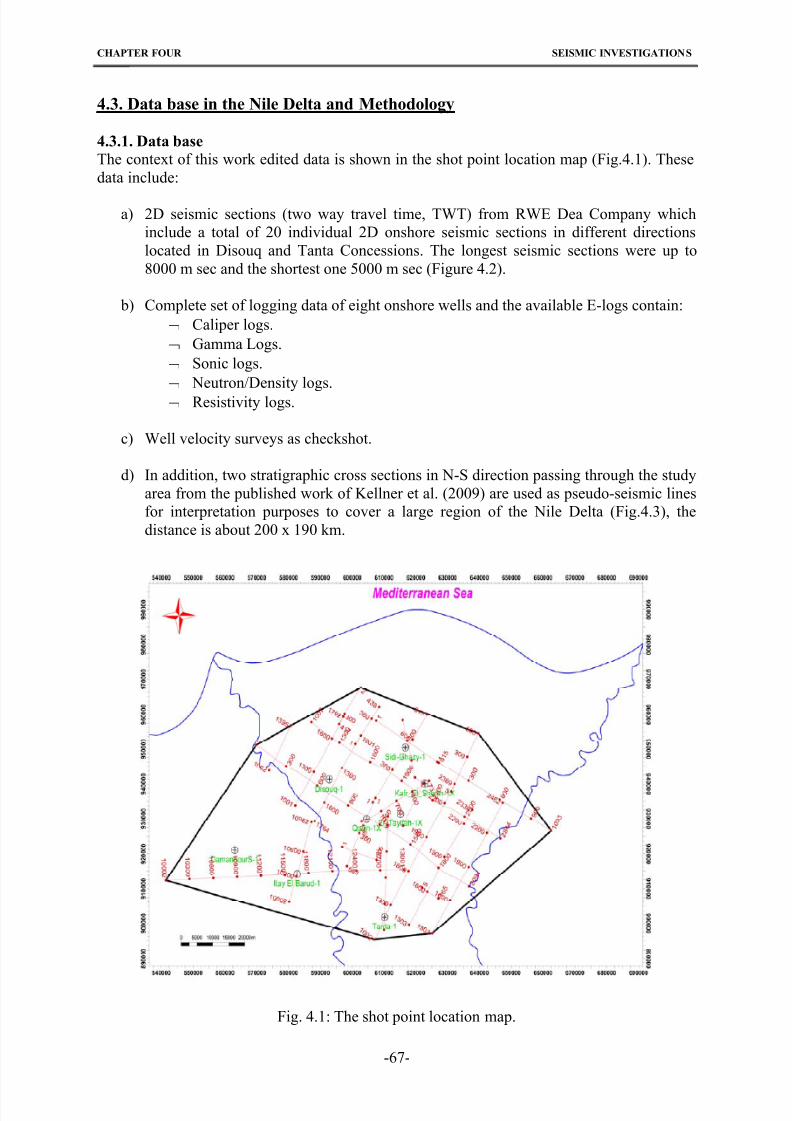
8/22/2019 barakat_moataz.pdf
http://slidepdf.com/reader/full/barakatmoatazpdf 81/158
CHAPTER FOUR SEISMIC INVESTIGATIONS
ethodologyMData base in the Nile Delta and..34
4.3.1. Data base
The context of this work edited data is shown in the shot point location map (Fig.4.1). These
data include:
a) 2D seismic sections (two way travel time, TWT) from RWE Dea Company which
include a total of 20 individual 2D onshore seismic sections in different directions
located in Disouq and Tanta Concessions. The longest seismic sections were up to
8000 m sec and the shortest one 5000 m sec (Figure 4.2).
b) Complete set of logging data of eight onshore wells and the available E-logs contain:
Caliper logs.
Gamma Logs.
Sonic logs.
Neutron/Density logs.
Resistivity logs.
c) Well velocity surveys as checkshot.
d) In addition, two stratigraphic cross sections in N-S direction passing through the study
area from the published work of Kellner et al. (2009) are used as pseudo-seismic lines
for interpretation purposes to cover a large region of the Nile Delta (Fig.4.3), the
distance is about 200 x 190 km.
Fig. 4.1: The shot point location map.
-67-
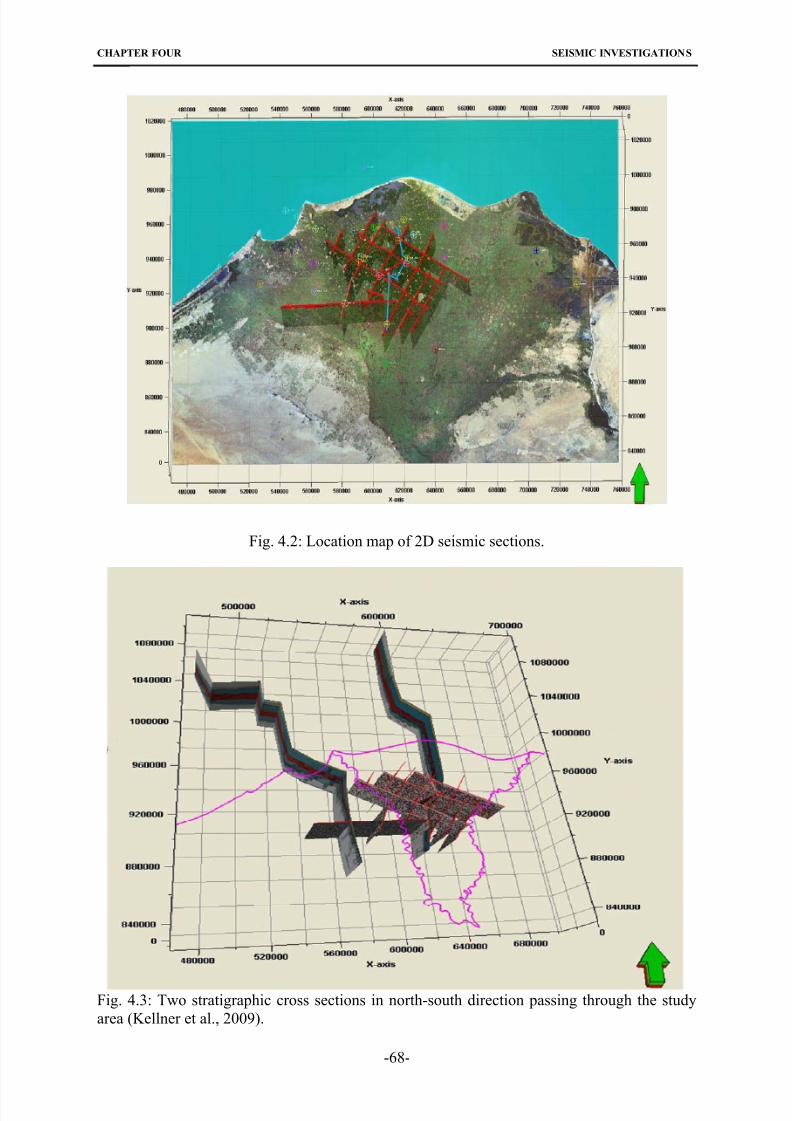
8/22/2019 barakat_moataz.pdf
http://slidepdf.com/reader/full/barakatmoatazpdf 82/158
CHAPTER FOUR SEISMIC INVESTIGATIONS
Fig. 4.2: Location map of 2D seismic sections.
Fig. 4.3: Two stratigraphic cross sections in north-south direction passing through the study
area (Kellner et al., 2009).
-68-
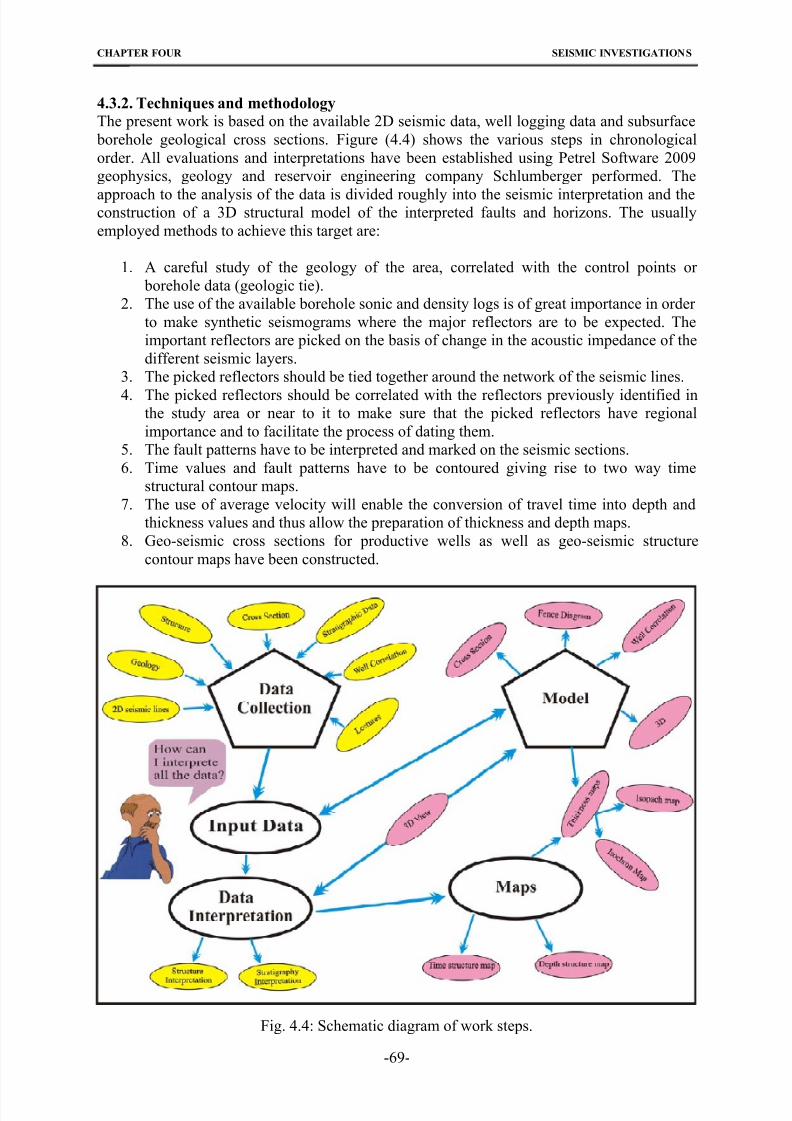
8/22/2019 barakat_moataz.pdf
http://slidepdf.com/reader/full/barakatmoatazpdf 83/158
CHAPTER FOUR SEISMIC INVESTIGATIONS
4.3.2. Techniques and methodology
The present work is based on the available 2D seismic data, well logging data and subsurface
borehole geological cross sections. Figure (4.4) shows the various steps in chronological
order. All evaluations and interpretations have been established using Petrel Software 2009
geophysics, geology and reservoir engineering company Schlumberger performed. The
approach to the analysis of the data is divided roughly into the seismic interpretation and theconstruction of a 3D structural model of the interpreted faults and horizons. The usually
employed methods to achieve this target are:
1. A careful study of the geology of the area, correlated with the control points or
borehole data (geologic tie).
2. The use of the available borehole sonic and density logs is of great importance in order
to make synthetic seismograms where the major reflectors are to be expected. The
important reflectors are picked on the basis of change in the acoustic impedance of the
different seismic layers.
3. The picked reflectors should be tied together around the network of the seismic lines.
4. The picked reflectors should be correlated with the reflectors previously identified inthe study area or near to it to make sure that the picked reflectors have regional
importance and to facilitate the process of dating them.
5. The fault patterns have to be interpreted and marked on the seismic sections.
6. Time values and fault patterns have to be contoured giving rise to two way time
structural contour maps.
7. The use of average velocity will enable the conversion of travel time into depth and
thickness values and thus allow the preparation of thickness and depth maps.
8. Geo-seismic cross sections for productive wells as well as geo-seismic structure
contour maps have been constructed.
Fig. 4.4: Schematic diagram of work steps.
-69-
8/22/2019 barakat_moataz.pdf
http://slidepdf.com/reader/full/barakatmoatazpdf 84/158
CHAPTER FOUR SEISMIC INVESTIGATIONS
4.4. Quality of Seismic Data
The seismic profiles are time sections on which the vertical scale is considerably exaggerated
relative to the horizontal scale. All the vertical depths are given in terms of two-way travel
times (m sec). The profile interpretation is based on the classification of reflections, according
to their degree of reflectivity. The characteristics of the seismic units recorded on the profile
are created by the different types of layers forming the sedimentary sequences. It is therefore
evident that these seismic units represent different lithological sequences, which can be
mapped as stratigraphic units. The reflector character is dependent on the amplitude and
frequency of the returning signal, which is in turn dependent on the physical properties of the
units above and below the reflecting horizon. A large variation in the elastic impedance on
either side of the reflecting horizon is shown by a reflective pulse of the considerable
amplitude and by a darker trace on the seismic record. In practice, the physical parameters
which affect acoustic impedance are grain size, texture, fabric, porosity, water content,
compaction and density.
For the identification of the different structural and stratigraphic boundaries on the seismicdata, a review of the general geo-seismic conditions that effect on a seismic profile must be
realized such as:
4.4.1. Non-continuity of horizons
The non-continuity of horizons displayed by the lateral facies changes, the rapid lateral
change of the lithologic content of the different rock units from coarse clastics to fine clastics
is a conspicuous phenomenon in the deltaic basins, particularly in the Nile Delta. Different
depositional environments with the accompanying lithofacies conditions may occur in the
same lithostratigraphic unit. This variation in lithology constitutes a problematic aspect in
both correlation and interpretation of the seismic data of the studied area.
4.4.2. Cut-off features
Cut-off features are basically created from the dissection of the countered stratigraphic
sequence by artificial structural effects such as faulting. Faulting in the Nile Delta is varied
and ranges from dip faults to listric to secondary antithetic faults and large rotated fault
blocks. These faults can terminate an existing rock unit in a way that it looks like the
truncation of the sedimentary unit or the pinching out or wedging out of horizons. Moreover,
the presence of voluminous amounts of fine clastics, which may fill the produced open zones
of the faults in a way misleading to hide their existence, especially if these faults have died
out at the unit boundaries as the listric and growth faults. These difficulties become more
pronounced when the variation in the structural style is accompanied with comparable change
in the stratigraphic regime.
4.4.3. Thick shale masses
The deposition of thick shale masses and thin sand interbeds in the Delta basin presents
another problem because may modify the wavelet characteristics of the seismic waves.
Moreover, these transitional interferences of sand and shale would increases the loss of
energy due to transmission through a large number of interferences sedimentary section
(Ghoneimi, 1990).
4.5.Velocity Analysis
The velocities of the seismic waves on the different geological sections mainly depend on the
elastic properties of the lithology, porosity, and the material filling the pores of these rocks.
There are two important types of velocity known as the interval and average velocities.
-70-
8/22/2019 barakat_moataz.pdf
http://slidepdf.com/reader/full/barakatmoatazpdf 85/158
CHAPTER FOUR SEISMIC INVESTIGATIONS
4.5.1. Interval velocity (Vi)
Interval velocity (Vi) is the velocity of a wave front through a single homogeneous layer. In
other words, if two reflectors at depth Z1 and Z2 having respective one way times of T1 and T2
Vi results from (Dobrin,1976):
Vi = (Z2-Z1) / (T2-T1) (1)
Where:Z2 & Z1= the upper and lower depth respectively; and
T2 & T1= one way times of the upper and lower depth.
Also the interval velocity within a certain interval is according to Sheriff (1980):
Vi = (∆z / ∆t) (2)
Where:
∆z = formation thickness; and
∆t = one way time.
The interval velocity is obtained by taking the distance between successive detector positions
in the well and divides it by the difference in arrival times at the two depths after the arrival
times have been corrected for angularity or the wave path.
4.5.2. Average velocity (Vav)
Average velocity (Vav) is simply the depth (z) of a reflecting surface below a datum divided
by the observed one-way reflection time (t) from the datum to the surface so that (Dobrin,
1976) concluded:
Vav = (zn / tn) (3)
Where:
Zn : Total thickness of the top (n) layers; and
tn : Total one-way travel time through the (n) layers.
The average velocity is the actual distance from source to receiver divided by the observed
time or the vertical component of distance divided by the appropriately corrected time.
4.5.3. Well velocity survey
The accuracy of seismic data processing and interpretation depends mainly on the velocity
measurement. Erroneous velocity estimations can lead to drastically distorted geological
pictures, for this reason the question of velocity accuracy always demands serious attention.
The relationship between depth and velocity can be determined by two methods:
A) Checkshot survey
Checkshot or well shoot surveys are acquired to increase the reliability of time-depth
conversion. The one way travel time to discrete geophone positions in the well is computed
from the registered and corrected first arrival time. A data point is recorded for geophone positions at every 25 or 50 m along the well (Veeken, 2007). The T-Z curve is constructed
from these time-depth measuring points with depth plotted vertically and time horizontally,
these one way times are doubled to be compared with a seismic section. A continuous
interpolation of the T-Z values is obtained by integrating the sonic log data in the plot. The
interval velocities around the well bore are calculated from these transit time measurements.
In this manner the exact travel times to known depths can be found.
In order to identify seismic reflections of interest interval velocity data are useful in this
manipulation. Vertical change of velocities with depth is helpful to identify reflectors
representing the tops and the bottoms of the different boundaries. Figure (5.5) shows the time
depth curves in the Tanta well.
These curves show the maximum and the minimum values of interval velocity againstdifferent formations making use of the plots relating velocity data (average and interval
velocities) with respect to the TWT.
-71-
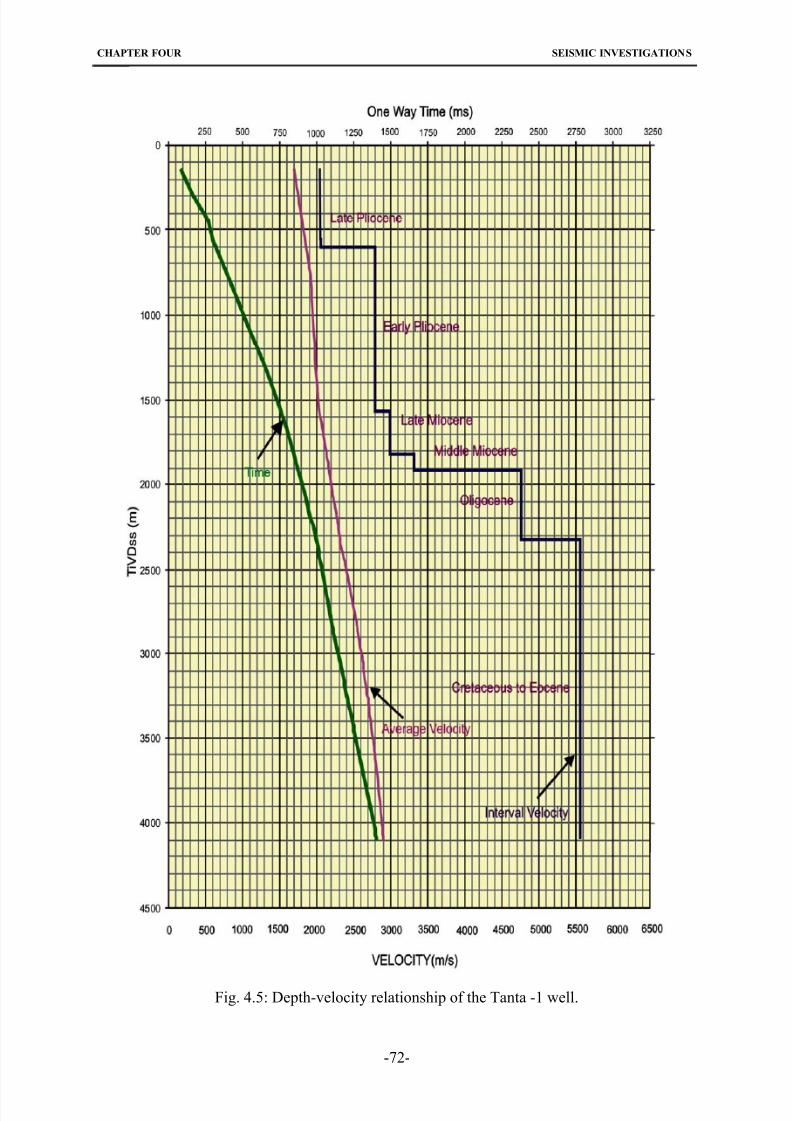
8/22/2019 barakat_moataz.pdf
http://slidepdf.com/reader/full/barakatmoatazpdf 86/158
CHAPTER FOUR SEISMIC INVESTIGATIONS
Fig. 4.5: Depth-velocity relationship of the Tanta -1 well.
-72-
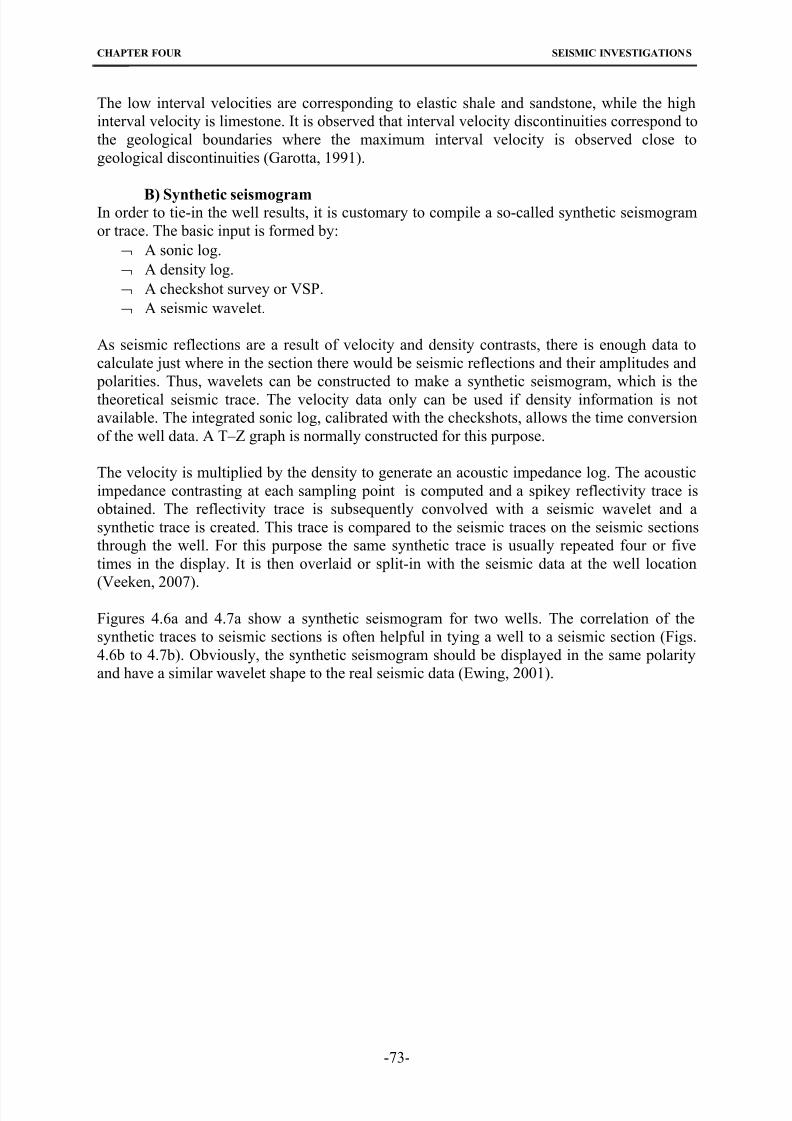
8/22/2019 barakat_moataz.pdf
http://slidepdf.com/reader/full/barakatmoatazpdf 87/158
CHAPTER FOUR SEISMIC INVESTIGATIONS
The low interval velocities are corresponding to elastic shale and sandstone, while the high
interval velocity is limestone. It is observed that interval velocity discontinuities correspond to
the geological boundaries where the maximum interval velocity is observed close to
geological discontinuities (Garotta, 1991).
B) Synthetic seismogramIn order to tie-in the well results, it is customary to compile a so-called synthetic seismogram
or trace. The basic input is formed by:
A sonic log.
A density log.
A checkshot survey or VSP.
A seismic wavelet.
As seismic reflections are a result of velocity and density contrasts, there is enough data to
calculate just where in the section there would be seismic reflections and their amplitudes and
polarities. Thus, wavelets can be constructed to make a synthetic seismogram, which is the
theoretical seismic trace. The velocity data only can be used if density information is not
available. The integrated sonic log, calibrated with the checkshots, allows the time conversion
of the well data. A T–Z graph is normally constructed for this purpose.
The velocity is multiplied by the density to generate an acoustic impedance log. The acoustic
impedance contrasting at each sampling point is computed and a spikey reflectivity trace is
obtained. The reflectivity trace is subsequently convolved with a seismic wavelet and a
synthetic trace is created. This trace is compared to the seismic traces on the seismic sections
through the well. For this purpose the same synthetic trace is usually repeated four or five
times in the display. It is then overlaid or split-in with the seismic data at the well location
(Veeken, 2007).
Figures 4.6a and 4.7a show a synthetic seismogram for two wells. The correlation of the
synthetic traces to seismic sections is often helpful in tying a well to a seismic section (Figs.
4.6b to 4.7b). Obviously, the synthetic seismogram should be displayed in the same polarity
and have a similar wavelet shape to the real seismic data (Ewing, 2001).
-73-
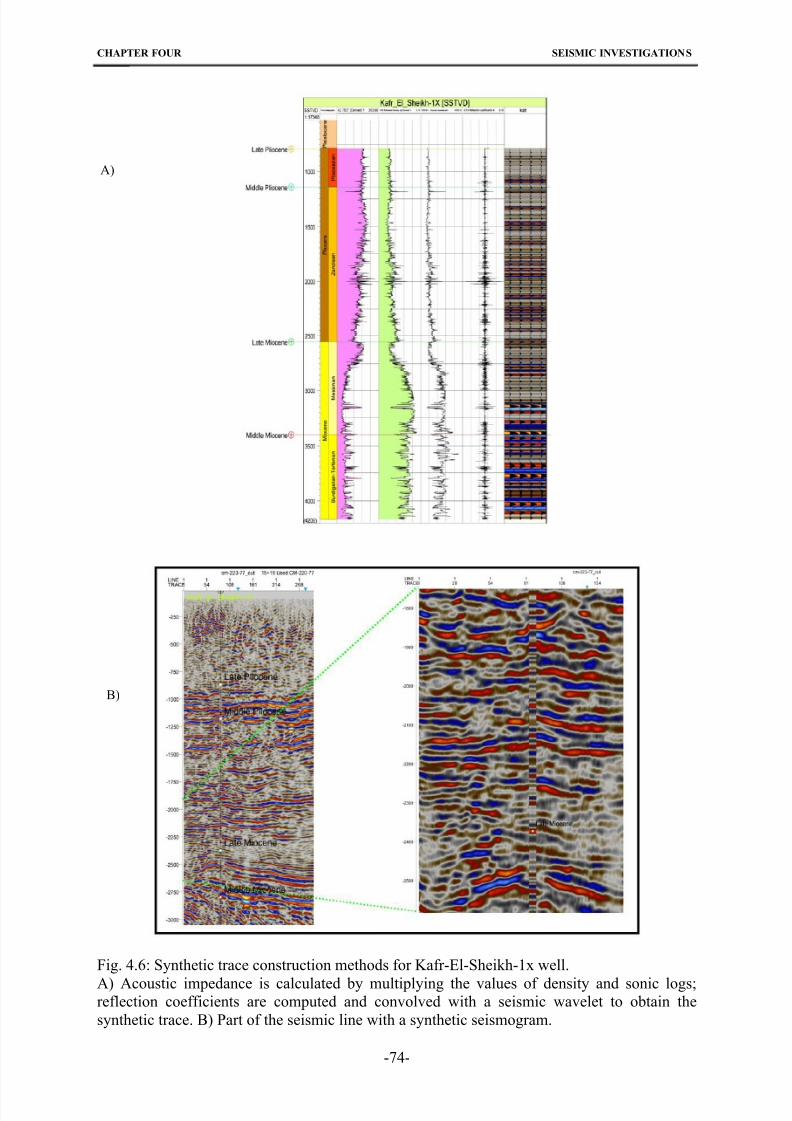
8/22/2019 barakat_moataz.pdf
http://slidepdf.com/reader/full/barakatmoatazpdf 88/158
CHAPTER FOUR SEISMIC INVESTIGATIONS
A)
B)
Fig. 4.6: Synthetic trace construction methods for Kafr-El-Sheikh-1x well.
A) Acoustic impedance is calculated by multiplying the values of density and sonic logs;reflection coefficients are computed and convolved with a seismic wavelet to obtain the
synthetic trace. B) Part of the seismic line with a synthetic seismogram.
-74-
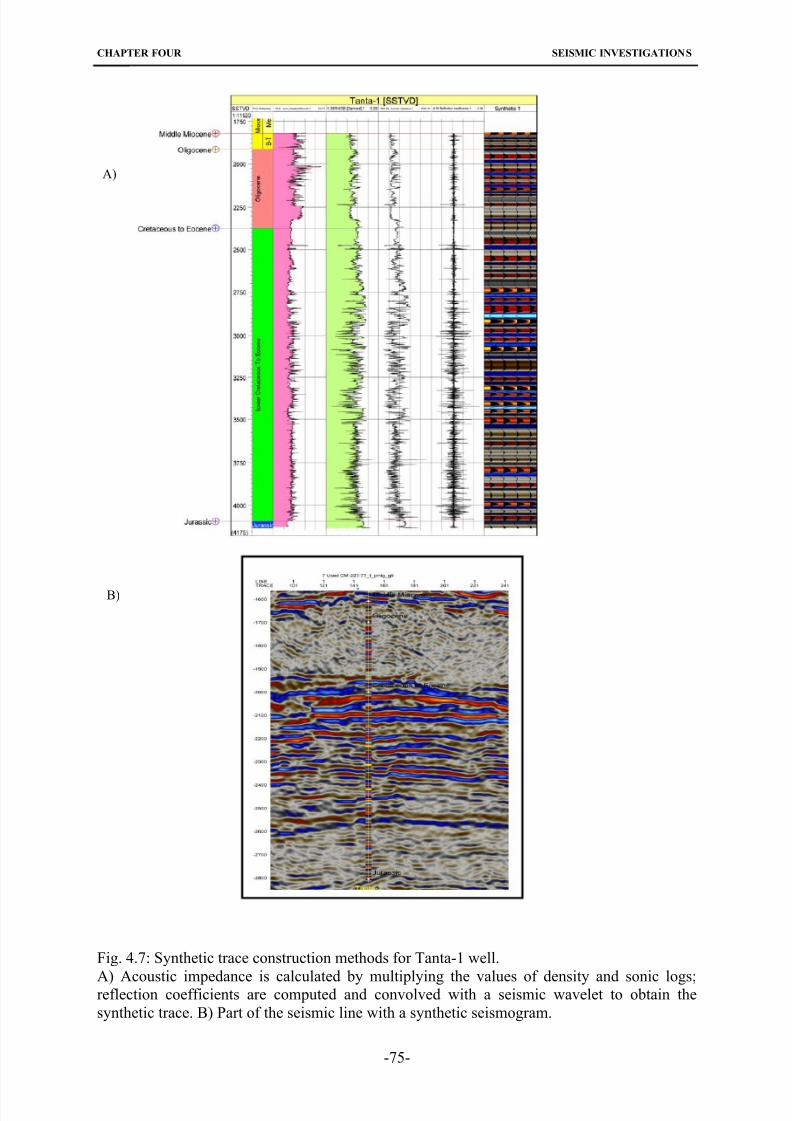
8/22/2019 barakat_moataz.pdf
http://slidepdf.com/reader/full/barakatmoatazpdf 89/158
CHAPTER FOUR SEISMIC INVESTIGATIONS
-75-
A)
B)
Fig. 4.7: Synthetic trace construction methods for Tanta-1 well.
A) Acoustic impedance is calculated by multiplying the values of density and sonic logs;reflection coefficients are computed and convolved with a seismic wavelet to obtain the
synthetic trace. B) Part of the seismic line with a synthetic seismogram.
8/22/2019 barakat_moataz.pdf
http://slidepdf.com/reader/full/barakatmoatazpdf 90/158
CHAPTER FIVE SEISMIC INTERPRETATION
CHAPTER FIVE
SEISMIC INTERPRETATION
5.1. Introduction
The interpretation of seismic reflections is the process of transforming the physical responses
displayed by the seismic lines into geological information of interest concerning either the
structural style or the stratigraphic regime. Seismic reflection analysis has many applications
in interpretation of the subsurface geology. This method is the most powerful in defining the
subsurface structures and geologic settings of the sedimentary successions in the study area.
Identification of unconformities and abnormal features, such as fault trends, fold axes and
closures within the sedimentary rocks may lead to the discovery of oil and gas accumulations.
Stratigraphic and facies analysis assists in the delineation of the paleo-environment of deposition of different rock units. Therefore, the principle aim of seismic interpretation is to
identify the important reflectors and present them as isopach and depth maps (Badely, 1985).
Fitch et al. (1988) thus expressed the fact that tectonics and sedimentation are closely linked,
so that both subjects must be considered together.
5.2. Identification of Seismic Boundaries
In order to start in the interpretation techniques, the identification of the different structural
and stratigraphic boundaries on the seismic data is needed. According to the reflectivity of the
different sediment layers, the subsurface pulses can be divided into different groups,
according to the variations of their characters. These reflectors may have several shapes:irregular, flat, closely spaced and may be separated by an irregular reflecting erosion surface
or unconformity.
The reflection identification process starts by picking a survey by inspecting lines through
boreholes. Not only do the well logs give a useful geological picture, but also show where
strong reflections might be expected. Finally, the picking of the entire survey should be tied
together making sure that all lines intersections are considered by using a closed loop (Badely,
1985).
The main problem encountered during the interpretation and mapping was the mistie constant
and time variant (10 to 30 m sec), mistie was often observed between seismic profiles. Itshould be mentioned that uncertainty worth’s of 10 to 20 msec may cause deviations of 10 to
30 m uncertainty in depth conversion. The misties within the same set of seismic lines are
generally related to different static corrections applied at the lines intersections. The mistie
compensation was applied before going through the mapping stage. This problem was also
considered during the mapping stage.
In the following, the seismic boundaries are described. In this study, seven chrono-
stratigraphic boundaries have been identified (Fig.5.1). They are listed below from the
youngest to the oldest as follows:
1. Late Pliocene.
2. Middle Pliocene.
3. Late Miocene.
4. Middle Miocene.
-76-
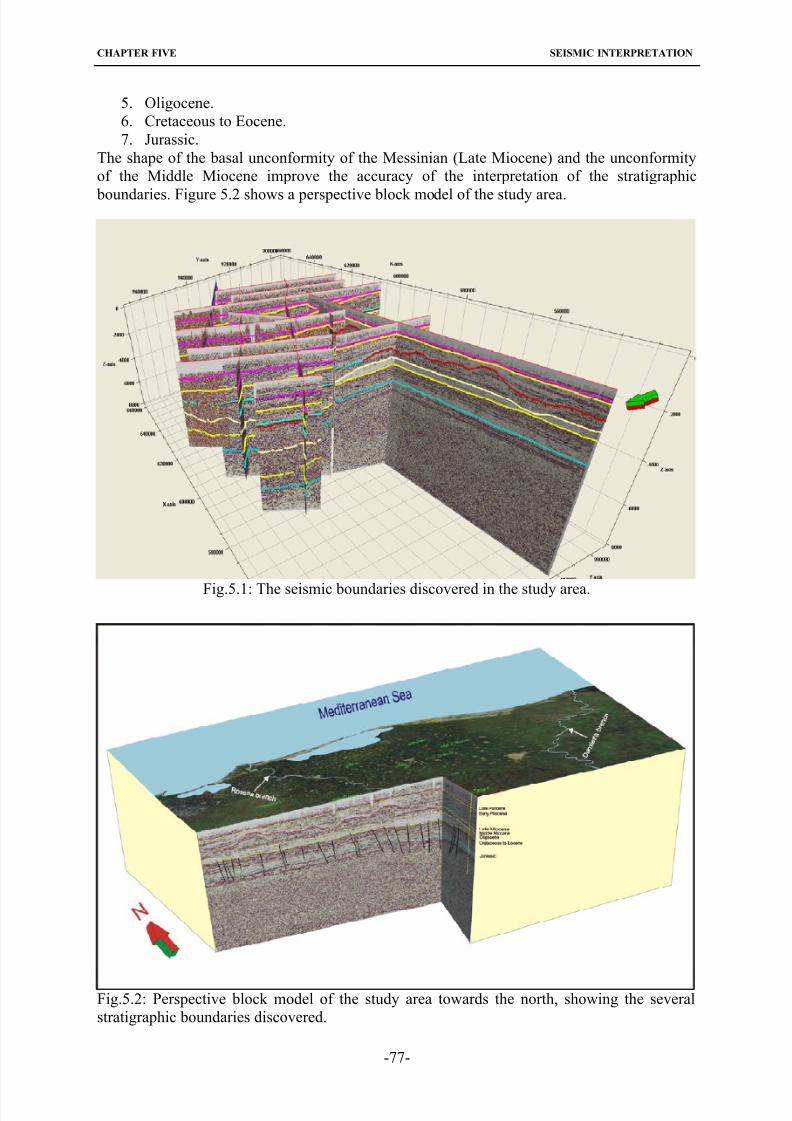
8/22/2019 barakat_moataz.pdf
http://slidepdf.com/reader/full/barakatmoatazpdf 91/158
CHAPTER FIVE SEISMIC INTERPRETATION
5. Oligocene.
6. Cretaceous to Eocene.
7. Jurassic.
The shape of the basal unconformity of the Messinian (Late Miocene) and the unconformity
of the Middle Miocene improve the accuracy of the interpretation of the stratigraphic
boundaries. Figure 5.2 shows a perspective block model of the study area.
Fig.5.1: The seismic boundaries discovered in the study area.
Fig.5.2: Perspective block model of the study area towards the north, showing the several
stratigraphic boundaries discovered.
-77-
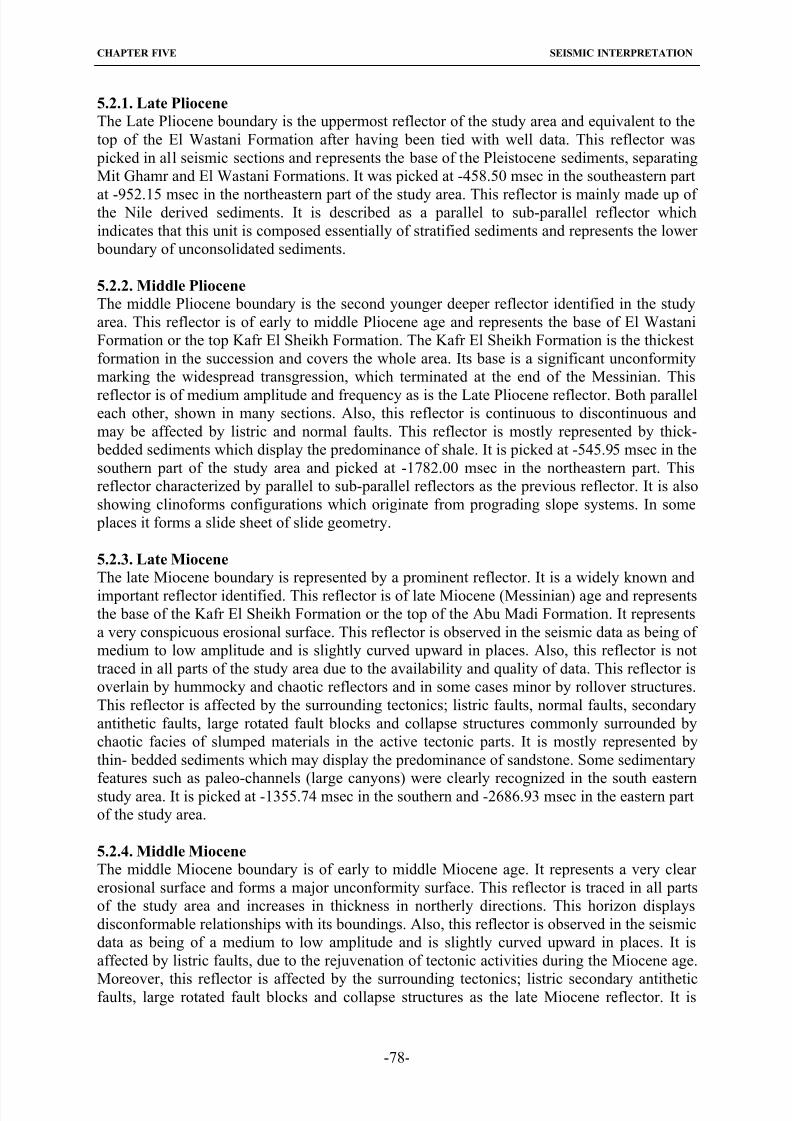
8/22/2019 barakat_moataz.pdf
http://slidepdf.com/reader/full/barakatmoatazpdf 92/158
CHAPTER FIVE SEISMIC INTERPRETATION
5.2.1. Late Pliocene
The Late Pliocene boundary is the uppermost reflector of the study area and equivalent to the
top of the El Wastani Formation after having been tied with well data. This reflector was
picked in all seismic sections and represents the base of the Pleistocene sediments, separating
Mit Ghamr and El Wastani Formations. It was picked at -458.50 msec in the southeastern part
at -952.15 msec in the northeastern part of the study area. This reflector is mainly made up of the Nile derived sediments. It is described as a parallel to sub-parallel reflector which
indicates that this unit is composed essentially of stratified sediments and represents the lower
boundary of unconsolidated sediments.
5.2.2. Middle Pliocene
The middle Pliocene boundary is the second younger deeper reflector identified in the study
area. This reflector is of early to middle Pliocene age and represents the base of El Wastani
Formation or the top Kafr El Sheikh Formation. The Kafr El Sheikh Formation is the thickest
formation in the succession and covers the whole area. Its base is a significant unconformity
marking the widespread transgression, which terminated at the end of the Messinian. This
reflector is of medium amplitude and frequency as is the Late Pliocene reflector. Both paralleleach other, shown in many sections. Also, this reflector is continuous to discontinuous and
may be affected by listric and normal faults. This reflector is mostly represented by thick-
bedded sediments which display the predominance of shale. It is picked at -545.95 msec in the
southern part of the study area and picked at -1782.00 msec in the northeastern part. This
reflector characterized by parallel to sub-parallel reflectors as the previous reflector. It is also
showing clinoforms configurations which originate from prograding slope systems. In some
places it forms a slide sheet of slide geometry.
5.2.3. Late Miocene
The late Miocene boundary is represented by a prominent reflector. It is a widely known and
important reflector identified. This reflector is of late Miocene (Messinian) age and represents
the base of the Kafr El Sheikh Formation or the top of the Abu Madi Formation. It represents
a very conspicuous erosional surface. This reflector is observed in the seismic data as being of
medium to low amplitude and is slightly curved upward in places. Also, this reflector is not
traced in all parts of the study area due to the availability and quality of data. This reflector is
overlain by hummocky and chaotic reflectors and in some cases minor by rollover structures.
This reflector is affected by the surrounding tectonics; listric faults, normal faults, secondary
antithetic faults, large rotated fault blocks and collapse structures commonly surrounded by
chaotic facies of slumped materials in the active tectonic parts. It is mostly represented by
thin- bedded sediments which may display the predominance of sandstone. Some sedimentary
features such as paleo-channels (large canyons) were clearly recognized in the south easternstudy area. It is picked at -1355.74 msec in the southern and -2686.93 msec in the eastern part
of the study area.
5.2.4. Middle Miocene
The middle Miocene boundary is of early to middle Miocene age. It represents a very clear
erosional surface and forms a major unconformity surface. This reflector is traced in all parts
of the study area and increases in thickness in northerly directions. This horizon displays
disconformable relationships with its boundings. Also, this reflector is observed in the seismic
data as being of a medium to low amplitude and is slightly curved upward in places. It is
affected by listric faults, due to the rejuvenation of tectonic activities during the Miocene age.
Moreover, this reflector is affected by the surrounding tectonics; listric secondary antitheticfaults, large rotated fault blocks and collapse structures as the late Miocene reflector. It is
-78-
8/22/2019 barakat_moataz.pdf
http://slidepdf.com/reader/full/barakatmoatazpdf 93/158
CHAPTER FIVE SEISMIC INTERPRETATION
picked at -687.10 msec in the southern part and -3124.44 msec in the eastern part of the study
area.
5.2.5. Oligocene
This reflector represents the early Miocene and/or the top of Oligocene sediments. It is very
difficult to differentiate between them without paleontological studies. It is irregularly curved,of medium to high amplitude, continuous to discontinuous; and in deeper parts it is difficult to
identify this reflector due to the availability and quality of data (white zone). This reflector is
affected by normal faults and secondary antithetic faults. A lot of noises and diffractions
obscure the identification of this reflector. In some places it terminates against the shale
diaprism. The Oligocene unit is eroded at its top and composed mainly of hummocky facies,
chaotic and slumping deposits. This reflector is in concordance to folded structure baselaps of
the Oligocene sediments. It is picked at -1527.04 msec in the southern part and -4315.76 msec
in the eastern part of the study area.
5.2.6. Cretaceous to Eocene
The differentiation between the Eocene and Cretaceous carbonates is very difficult, so it isconsidered herein as one boundary. This boundary forms a major unconformity. Furthermore,
this boundary is mostly affected by the ENE Syrian arc system. This reflector has a strong to
medium appearance and high frequency. It is characterized by its continuity, which is
obscured by faulting to form broken discontinuous reflectors. This reflector is overlain by a
package of wavy reflectors and by hummocky to chaotic reflectors in other parts as shown in
many plates. In the southern part it is characterized by parallel to sub-parallel reflectors. It is
picked at -1857.27 msec in the southern part and -5938.80 msec in the eastern part of the
study area.
5.2.7. Jurassic
The Jurassic/Cretaceous boundary represents the top Jurassic reflector and is the lowest
reflector recorded in the study area. This reflector is slightly curved, mostly faulted and
uplifted. This boundary is mostly affected by the ENE Syrian arc system. Its continuity is also
affected by shale diaprism and tectonics. A lot of noises and diffractions have obscured the
identification of this reflector. This reflector can be distinguished by a package of parallel
reflectors of a quite zone directly lying above it. The continuity of this boundary was
disturbed by faulting and diaprism. It can be traced on the seismic lines at more than -2750.86
msec in the southern part and -6195.80 msec in the southern part of the study area.
5.3. Structural Features and Their Causes in the Study Area
The study area is situated in a relatively quiet tectonic zone in the onshore Nile Delta. The
subsurface structural setting of the study area was analyzed by 2D interpreted seismic
sections. In the Nile Delta, a number of major structural features were identified, such as
growth faults, antithetic faults and anticline rollover structures. The structural evolution of the
Nile Delta has been controlled by two main alignments:
1) The Tethyan trend, an east-west trend which could be related to the original continental
margin rifting of the south eastern Mediterranean during the early Mesozoic. The best known
example for this trend is the Oligo-Miocene Hinge Zone, the northern and southern flexure of
the onshore Nile Delta.2) The northwest-southeast trend; related to the Gulf of Suez trend,called the Temsah fault by
Abdel Aal et al. (2004).
-79-
8/22/2019 barakat_moataz.pdf
http://slidepdf.com/reader/full/barakatmoatazpdf 94/158
CHAPTER FIVE SEISMIC INTERPRETATION
The structural features observed on the seismic profiles indicate two types of structures
according to their origin and development: 1) gravity transport structures which include
slumps, debris flows and turbidities, 2) syndepositional tectonic and erosional structures
which involve listric faults, tilted and rotated fault blocks, secondary antithetical faults and
erosional channels.
5.3.1. Gravity transport structures
Slumps
Slumps are downslope movements of sediments above a basal shear surface, where there is a
significant internal distortion of bedding (Stow, 1985). The slumps form above a basal shear
surface, the depth to which is decided mainly by the pressure gradient in the sediments.
Omran and Fathy (1996) concluded that the mechanism of sediment deformation (slumps) on
a slope depends on many factors: the availability of sediment supply, overloading of
sediments on slopes, instability of the margin, mobility of the sediment, water circulation,
climatic variations, local or regional tectonics and sea level fluctuations. Slumps appear as
discrete block movements, whereas slides usually break up and slip downslope. The term'slump' is also used to refer to the material that breaks off during a slide.
Slumped sediments are widely distributed in the study area either on the shallow shelf parts or
at the deeper slope parts. The causes of slumps appear to differ from place to place; slumps
close to the shelf and beneath the upper slope are referred to gravity transport processes, north
they are referred to tectonic reasons (Fig.5.3). Slumped strata in this figure illustrate a high
degree of deformation and are usually formed of contorted to hummocky and chaotic or
reflection-free seismic facies.
Some slumps show spoonshape or appear as sheets or blocks of slumped materials separated
by faults. Slumps also exist in the collapse structures and within the tilted and rotated fault
blocks.
Debris flows
Debris flow deposits are cohesive masses of relatively unsorted debris that can flow on very
low slopes. The term debris flow was used by Middleton and Hampton (1973) for sediments,
inferred to have flowed in the form of granular solids mixed with water in response to the pull
of gravity. Debris flows are the process where granular solids mixed with clay, entrained
water and possibly air move rapidly on low slopes. Debris flows are slurry like mixtures of
water and sediment, which move downslope because of its density difference. Omran (2001)concluded that debris flow deposits usually appear transparent to chaotic in seismic sections
due to their poor sorting or lack of distinctive internal structures. Their surface morphology
varies from hummocky to relatively smooth. Debris flows are common on many modern
course- grained delta slopes and on continental slopes (Masson et al., 1993).
Debris flows are observed within the Pliocene and Quaternary sequence of the Nile Delta as
sheets (Fig.5.4). These units exist also in the Oligocene in the northern parts directions of the
study area (Fig.5.3).
-80-
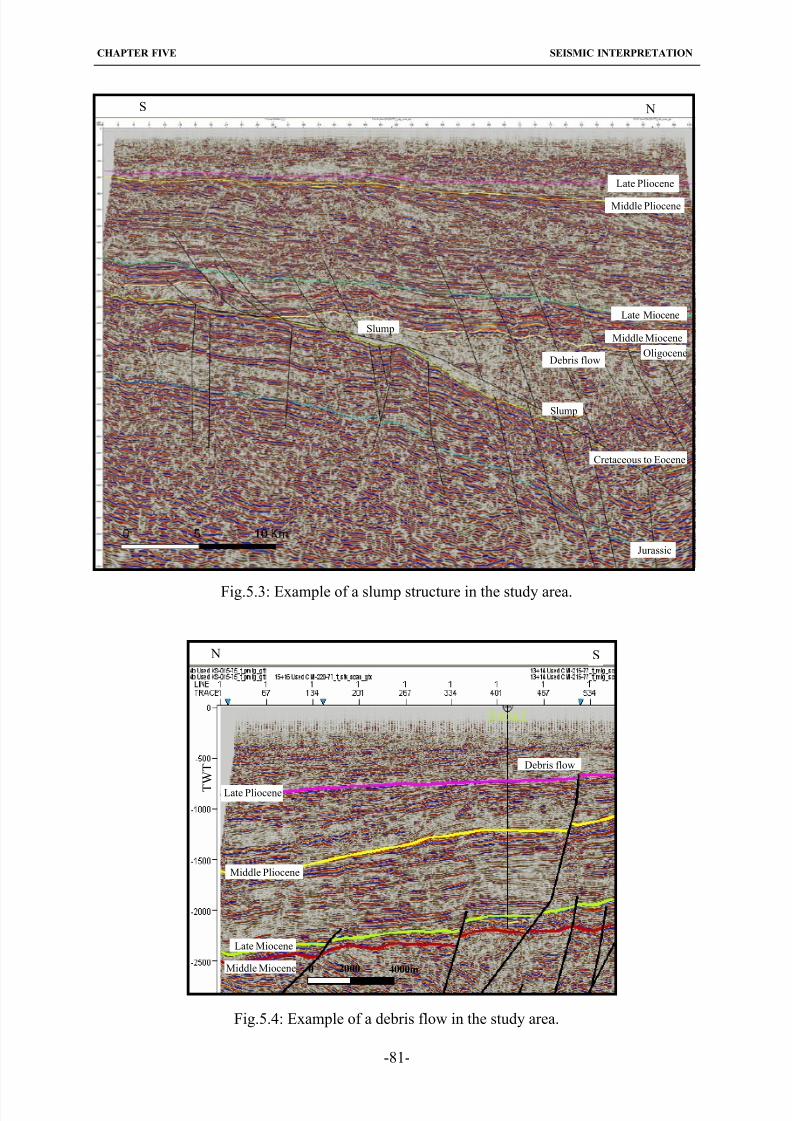
8/22/2019 barakat_moataz.pdf
http://slidepdf.com/reader/full/barakatmoatazpdf 95/158
CHAPTER FIVE SEISMIC INTERPRETATION
-81-
S N
Late Pliocene
Middle Pliocene
Late Miocene
SlumpMiddle Miocene
OligoceneDebris flow
Slump
Cretaceous to Eocene
Jurassic
Fig.5.3: Example of a slump structure in the study area.
Fig.5.4: Example of a debris flow in the study area.
S N
Late Miocene
Middle Miocene
Late Pliocene
Middle Pliocene
Debris flow
20000 4000m
T W T
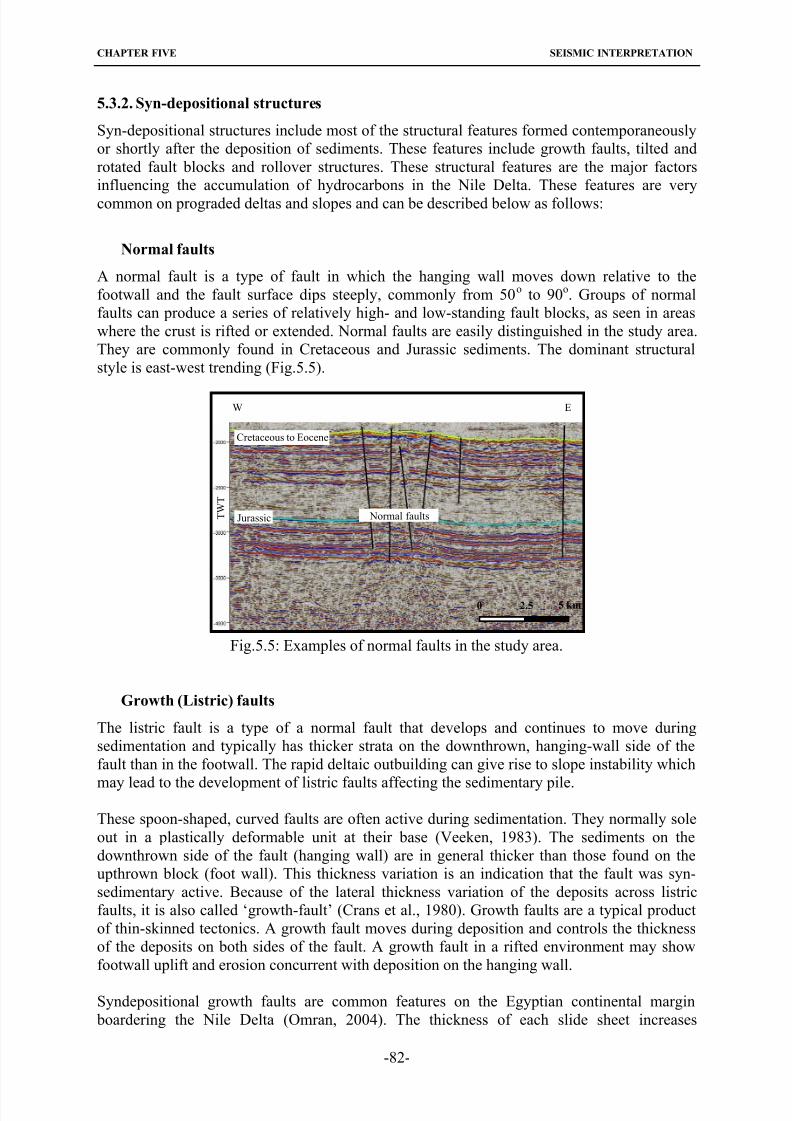
8/22/2019 barakat_moataz.pdf
http://slidepdf.com/reader/full/barakatmoatazpdf 96/158
CHAPTER FIVE SEISMIC INTERPRETATION
-82-
5.3.2. Syn-depositional structures
Syn-depositional structures include most of the structural features formed contemporaneously
or shortly after the deposition of sediments. These features include growth faults, tilted and
rotated fault blocks and rollover structures. These structural features are the major factors
influencing the accumulation of hydrocarbons in the Nile Delta. These features are very
common on prograded deltas and slopes and can be described below as follows:
Normal faults
A normal fault is a type of fault in which the hanging wall moves down relative to the
footwall and the fault surface dips steeply, commonly from 50o to 90o. Groups of normal
faults can produce a series of relatively high- and low-standing fault blocks, as seen in areas
where the crust is rifted or extended. Normal faults are easily distinguished in the study area.
They are commonly found in Cretaceous and Jurassic sediments. The dominant structural
style is east-west trending (Fig.5.5).
Fig.5.5: Examples of normal faults in the study area.
Growth (Listric) faults
The listric fault is a type of a normal fault that develops and continues to move during
sedimentation and typically has thicker strata on the downthrown, hanging-wall side of the
fault than in the footwall. The rapid deltaic outbuilding can give rise to slope instability which
may lead to the development of listric faults affecting the sedimentary pile.
These spoon-shaped, curved faults are often active during sedimentation. They normally sole
out in a plastically deformable unit at their base (Veeken, 1983). The sediments on the
downthrown side of the fault (hanging wall) are in general thicker than those found on the
upthrown block (foot wall). This thickness variation is an indication that the fault was syn-
sedimentary active. Because of the lateral thickness variation of the deposits across listric
faults, it is also called ‘growth-fault’ (Crans et al., 1980). Growth faults are a typical product
of thin-skinned tectonics. A growth fault moves during deposition and controls the thickness
of the deposits on both sides of the fault. A growth fault in a rifted environment may show
footwall uplift and erosion concurrent with deposition on the hanging wall.
Syndepositional growth faults are common features on the Egyptian continental margin
boardering the Nile Delta (Omran, 2004). The thickness of each slide sheet increases
EW
0 5 km2.5
Cretaceous to Eocene
Jurassic Normal faults T W T
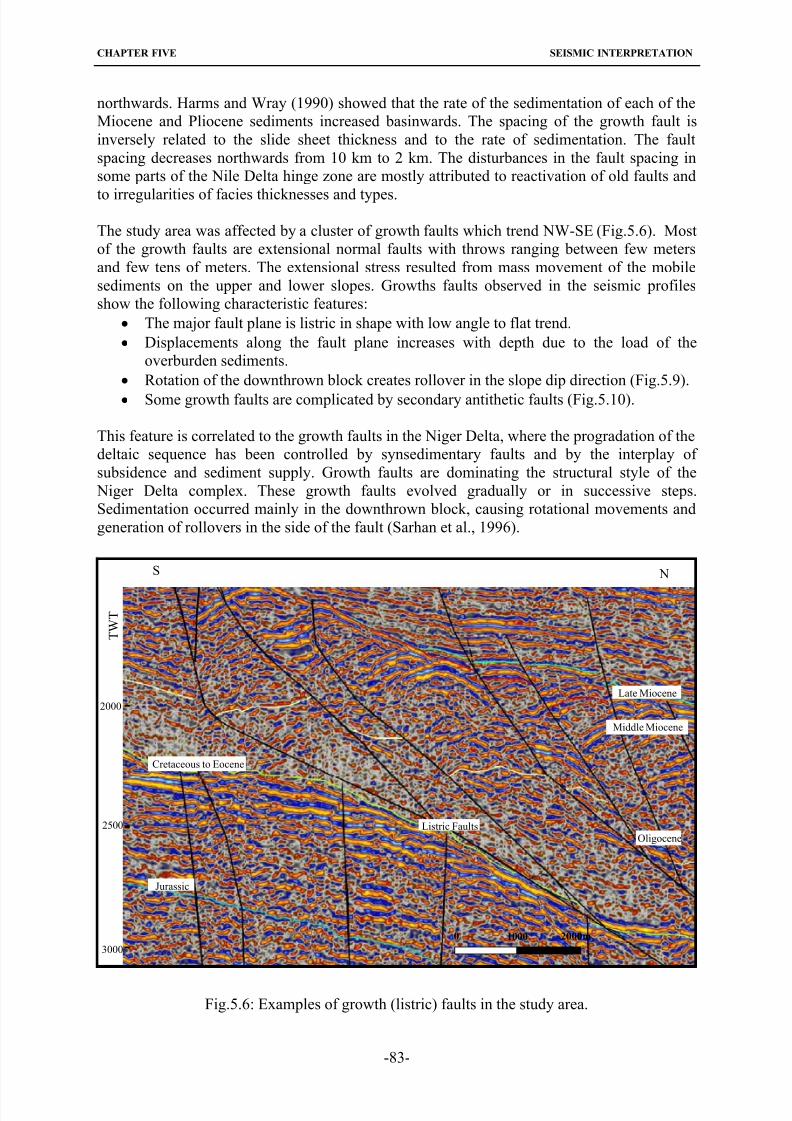
8/22/2019 barakat_moataz.pdf
http://slidepdf.com/reader/full/barakatmoatazpdf 97/158
CHAPTER FIVE SEISMIC INTERPRETATION
-83-
northwards. Harms and Wray (1990) showed that the rate of the sedimentation of each of the
Miocene and Pliocene sediments increased basinwards. The spacing of the growth fault is
inversely related to the slide sheet thickness and to the rate of sedimentation. The fault
spacing decreases northwards from 10 km to 2 km. The disturbances in the fault spacing in
some parts of the Nile Delta hinge zone are mostly attributed to reactivation of old faults and
to irregularities of facies thicknesses and types.
The study area was affected by a cluster of growth faults which trend NW-SE (Fig.5.6). Most
of the growth faults are extensional normal faults with throws ranging between few meters
and few tens of meters. The extensional stress resulted from mass movement of the mobile
sediments on the upper and lower slopes. Growths faults observed in the seismic profiles
show the following characteristic features:
The major fault plane is listric in shape with low angle to flat trend.
Displacements along the fault plane increases with depth due to the load of the
overburden sediments.
Rotation of the downthrown block creates rollover in the slope dip direction (Fig.5.9).
Some growth faults are complicated by secondary antithetic faults (Fig.5.10).
This feature is correlated to the growth faults in the Niger Delta, where the progradation of the
deltaic sequence has been controlled by synsedimentary faults and by the interplay of
subsidence and sediment supply. Growth faults are dominating the structural style of the
Niger Delta complex. These growth faults evolved gradually or in successive steps.
Sedimentation occurred mainly in the downthrown block, causing rotational movements and
generation of rollovers in the side of the fault (Sarhan et al., 1996).
Fig.5.6: Examples of growth (listric) faults in the study area.
S N
T W T
Late Miocene
Listric Faults
Middle Miocene
Cretaceous to Eocene
Oligocene
Jurassic
2000m10000
2500
2000
3000
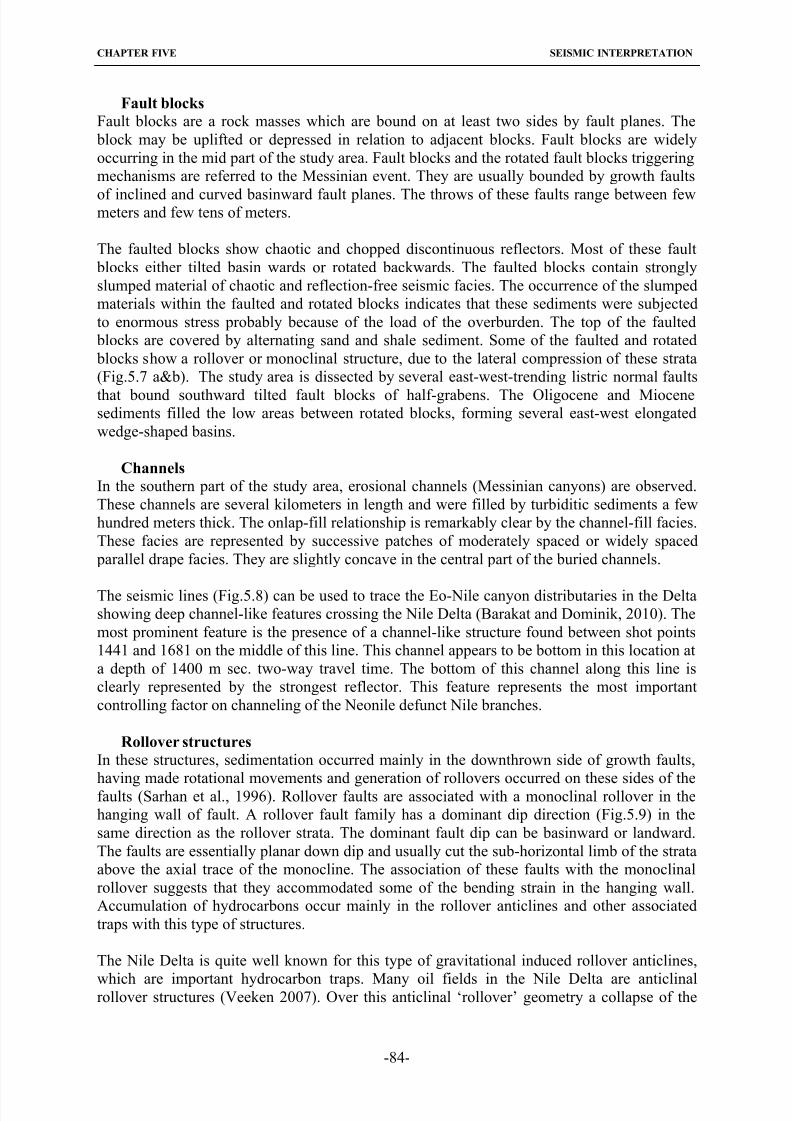
8/22/2019 barakat_moataz.pdf
http://slidepdf.com/reader/full/barakatmoatazpdf 98/158
CHAPTER FIVE SEISMIC INTERPRETATION
Fault blocks
Fault blocks are a rock masses which are bound on at least two sides by fault planes. The
block may be uplifted or depressed in relation to adjacent blocks. Fault blocks are widely
occurring in the mid part of the study area. Fault blocks and the rotated fault blocks triggering
mechanisms are referred to the Messinian event. They are usually bounded by growth faults
of inclined and curved basinward fault planes. The throws of these faults range between fewmeters and few tens of meters.
The faulted blocks show chaotic and chopped discontinuous reflectors. Most of these fault
blocks either tilted basin wards or rotated backwards. The faulted blocks contain strongly
slumped material of chaotic and reflection-free seismic facies. The occurrence of the slumped
materials within the faulted and rotated blocks indicates that these sediments were subjected
to enormous stress probably because of the load of the overburden. The top of the faulted
blocks are covered by alternating sand and shale sediment. Some of the faulted and rotated
blocks show a rollover or monoclinal structure, due to the lateral compression of these strata
(Fig.5.7 a&b). The study area is dissected by several east-west-trending listric normal faults
that bound southward tilted fault blocks of half-grabens. The Oligocene and Miocenesediments filled the low areas between rotated blocks, forming several east-west elongated
wedge-shaped basins.
Channels
In the southern part of the study area, erosional channels (Messinian canyons) are observed.
These channels are several kilometers in length and were filled by turbiditic sediments a few
hundred meters thick. The onlap-fill relationship is remarkably clear by the channel-fill facies.
These facies are represented by successive patches of moderately spaced or widely spaced
parallel drape facies. They are slightly concave in the central part of the buried channels.
The seismic lines (Fig.5.8) can be used to trace the Eo-Nile canyon distributaries in the Delta
showing deep channel-like features crossing the Nile Delta (Barakat and Dominik, 2010). The
most prominent feature is the presence of a channel-like structure found between shot points
1441 and 1681 on the middle of this line. This channel appears to be bottom in this location at
a depth of 1400 m sec. two-way travel time. The bottom of this channel along this line is
clearly represented by the strongest reflector. This feature represents the most important
controlling factor on channeling of the Neonile defunct Nile branches.
Rollover structures
In these structures, sedimentation occurred mainly in the downthrown side of growth faults,
having made rotational movements and generation of rollovers occurred on these sides of thefaults (Sarhan et al., 1996). Rollover faults are associated with a monoclinal rollover in the
hanging wall of fault. A rollover fault family has a dominant dip direction (Fig.5.9) in the
same direction as the rollover strata. The dominant fault dip can be basinward or landward.
The faults are essentially planar down dip and usually cut the sub-horizontal limb of the strata
above the axial trace of the monocline. The association of these faults with the monoclinal
rollover suggests that they accommodated some of the bending strain in the hanging wall.
Accumulation of hydrocarbons occur mainly in the rollover anticlines and other associated
traps with this type of structures.
The Nile Delta is quite well known for this type of gravitational induced rollover anticlines,
which are important hydrocarbon traps. Many oil fields in the Nile Delta are anticlinalrollover structures (Veeken 2007). Over this anticlinal ‘rollover’ geometry a collapse of the
-84-
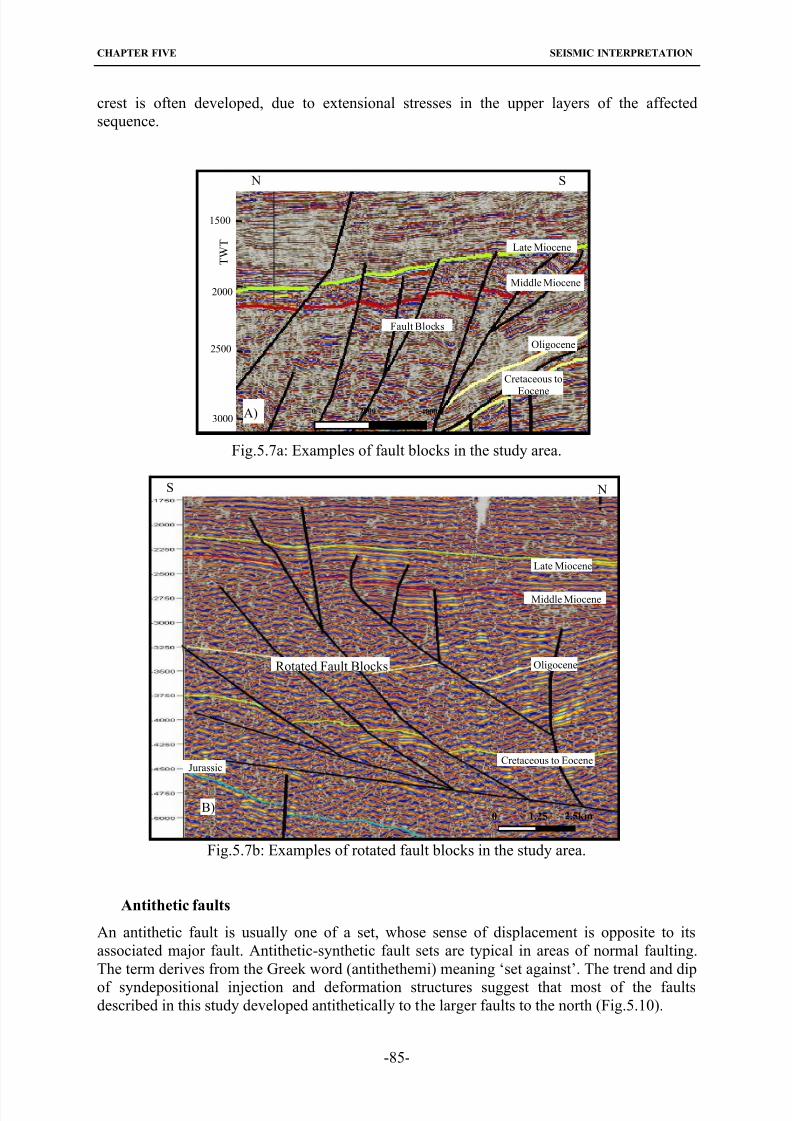
8/22/2019 barakat_moataz.pdf
http://slidepdf.com/reader/full/barakatmoatazpdf 99/158
CHAPTER FIVE SEISMIC INTERPRETATION
-85-
crest is often developed, due to extensional stresses in the upper layers of the affected
sequence.
Fig.5.7a: Examples of fault blocks in the study area.
Fig.5.7b: Examples of rotated fault blocks in the study area.
Antithetic faults
An antithetic fault is usually one of a set, whose sense of displacement is opposite to its
associated major fault. Antithetic-synthetic fault sets are typical in areas of normal faulting.
The term derives from the Greek word (antithethemi) meaning ‘set against’. The trend and dip
of syndepositional injection and deformation structures suggest that most of the faultsdescribed in this study developed antithetically to the larger faults to the north (Fig.5.10).
S N
Late Miocene
Middle Miocene
Oligocene
Cretaceous to
Eocene
A)
T W T
2500
2000
3000
1500
Fault Blocks
20000 4000m
S N
Late Miocene
Middle Miocene
OligoceneRotated Fault Blocks
Cretaceous to EoceneJurassic
B)0 1.25 2.5km
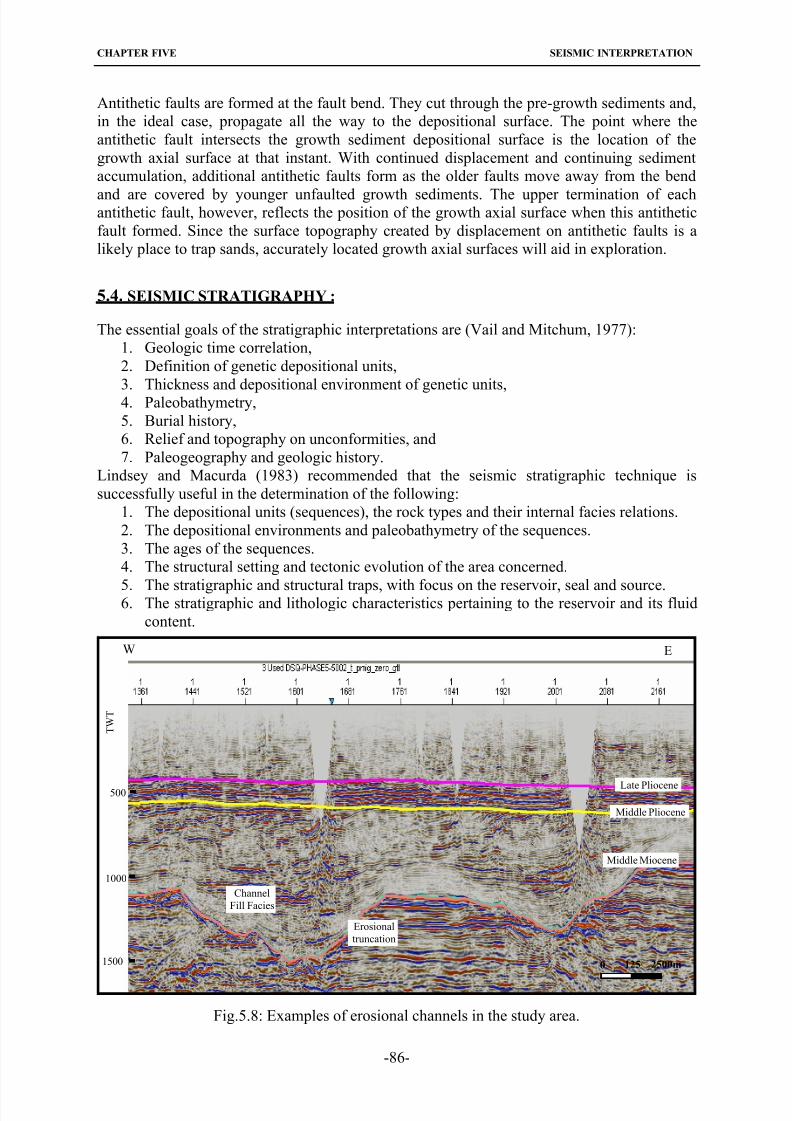
8/22/2019 barakat_moataz.pdf
http://slidepdf.com/reader/full/barakatmoatazpdf 100/158
CHAPTER FIVE SEISMIC INTERPRETATION
-86-
Antithetic faults are formed at the fault bend. They cut through the pre-growth sediments and,
in the ideal case, propagate all the way to the depositional surface. The point where the
antithetic fault intersects the growth sediment depositional surface is the location of the
growth axial surface at that instant. With continued displacement and continuing sediment
accumulation, additional antithetic faults form as the older faults move away from the bend
and are covered by younger unfaulted growth sediments. The upper termination of eachantithetic fault, however, reflects the position of the growth axial surface when this antithetic
fault formed. Since the surface topography created by displacement on antithetic faults is a
likely place to trap sands, accurately located growth axial surfaces will aid in exploration.
5.4. SEISMIC STRATIGRAPHY :
The essential goals of the stratigraphic interpretations are (Vail and Mitchum, 1977):
1. Geologic time correlation,
2. Definition of genetic depositional units,
3. Thickness and depositional environment of genetic units,
4. Paleobathymetry,
5. Burial history,
6. Relief and topography on unconformities, and
7. Paleogeography and geologic history.
Lindsey and Macurda (1983) recommended that the seismic stratigraphic technique is
successfully useful in the determination of the following:
1. The depositional units (sequences), the rock types and their internal facies relations.
2. The depositional environments and paleobathymetry of the sequences.
3. The ages of the sequences.
4. The structural setting and tectonic evolution of the area concerned.
5. The stratigraphic and structural traps, with focus on the reservoir, seal and source.6. The stratigraphic and lithologic characteristics pertaining to the reservoir and its fluid
content.
Fig.5.8: Examples of erosional channels in the study area.
EW
2500m1250
1000
T W T
1500
500
Channel
Fill Facies
Late Pliocene
Middle Pliocene
Middle Miocene
Erosional
truncation
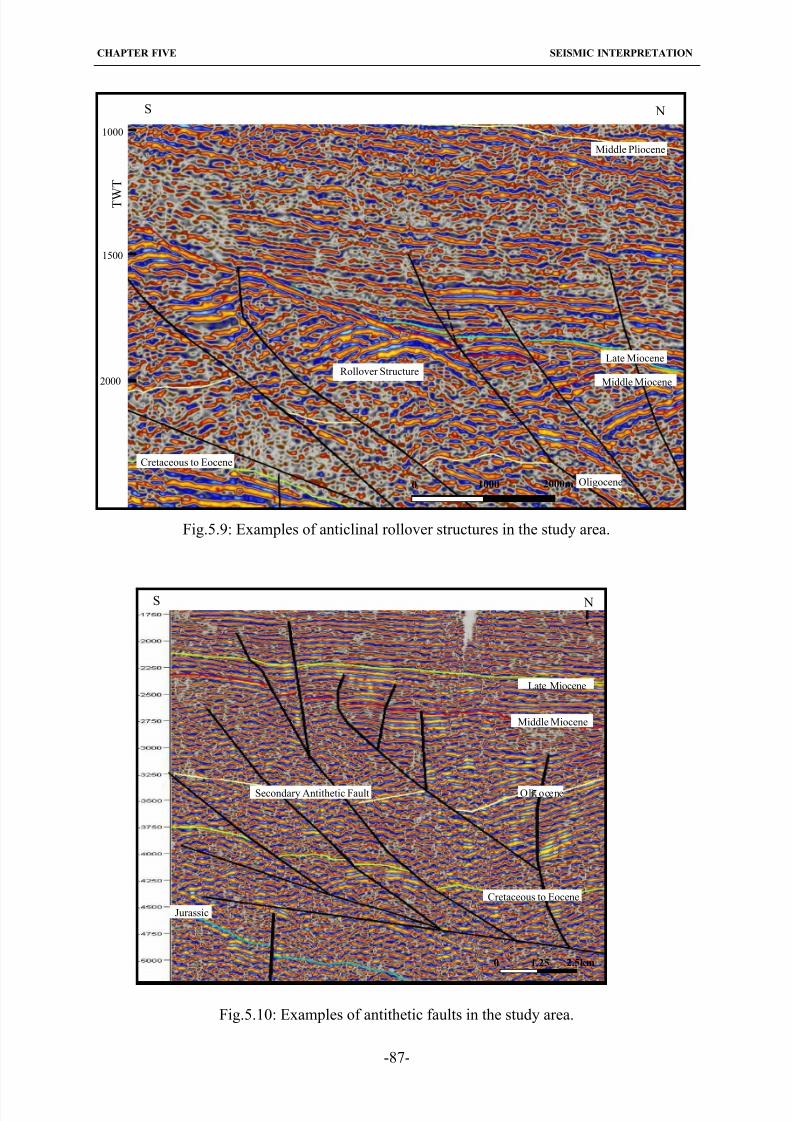
8/22/2019 barakat_moataz.pdf
http://slidepdf.com/reader/full/barakatmoatazpdf 101/158
CHAPTER FIVE SEISMIC INTERPRETATION
-87-
NS
Middle Pliocene
Late Miocene
Middle Miocene
Oligocene
Cretaceous to Eocene
Rollover Structure
1500
2000
1000
T W
T
2000m10000
Fig.5.9: Examples of anticlinal rollover structures in the study area.
Fig.5.10: Examples of antithetic faults in the study area.
Secondary Antithetic Fault
Late Miocene
Middle Miocene
Oli ocene
Cretaceous to Eoce
N
ne
S
Jurassic
0 2.5km1.25
8/22/2019 barakat_moataz.pdf
http://slidepdf.com/reader/full/barakatmoatazpdf 102/158
CHAPTER FIVE SEISMIC INTERPRETATION
5.5. The Interpretation Technique
Seismic stratigraphy is not just a descriptive technique but permits the construction of
predictive models which can be tested against current knowledge or new data. Such a tool is
of great value in hydrocarbon exploration. The recent development of the discipline of
seismic stratigraphy has given exploration a powerful tool especially in areas with limitedwell control. By the use of seismic stratigraphy, sedimentary basins can be analyzed in
systematic detail. The stratigraphy and rock facies help in the delineation of the paleo-
environment of deposition.
5.5.1. Seismic reflection terminations of stratigraphic features
The application of the seismic stratigraphic approaches on the seismic reflection data of the
study area requires, at first, the recognition, correlation, determination, mapping and
subdivision of the area under investigation into zones of varying seismic facies units. After
that, it is plausible to tie the deduced zones with comparable sediment types encountered by
the drilled wells. This is not only useful for translating the reflection characteristics of these
units into definite sediment types, but also beneficial in following their lateral variations,hence outlining the lateral extension of their lithofacies through the interpretation of these
parameters between the wells and all over the study area.
By picking the key surfaces of reflection termination, the interpreter divides the stratigraphy
into number of depositional packages. Each package contains a suite of relatively
conformable reflections of similar or gently changing character and geometry which is
bounded by surfaces marking the reorganisation of reflection geometry (Omran, 2004).
5.5.2. Internal reflection configuration
By using the internal configuration of the individual seismic reflections and the external forms
of the seismic facies units, number of seismic facies from this study has been identified as
described below:
Mitchum et al., (1977) introduced the terms lapout, truncation, baselap, toplap, onlap and
downlap to describe reflection termination styles.
Lapout is the lateral termination of a reflector (generally a bedding plane) at its depositional
limit, while truncation implies the reflector originally extended further and has either been
eroded (erosional truncation) or truncated by a fault plane, a slump surface, a contact with
mobile salt or shale, or an igneous intrusion (Mitchum et al., 1977).
Baselap is the lapout of reflections against an underlying seismic surface (which marks the
base of the seismic package). Baselap can consist of downlap, where the dip of the surface is
less than the dip of the overlying strata, or onlap, where the dip of the surface is greater
(Mitchum et al., (1977).
Downlap is commonly seen at the base of prograding clinoforms and usually represents the
progradation of a basin-margin slope system into deep water (Fig 5.11). It therefore represents
a change from marine slope deposition to marine condensation or non-deposition. The surface
of downlap represents a marine condensed unit. It is extremely difficult to generate downlap
in a subaerial environment. But it may be easy to confuse true depositional downlap and
original onlap rotated by later tectonism.
Onlap is recognised on seismic data by the termination of low-angle reflections against a
steeper seismic surface and may be of marine or coastal origin. Onlap-fill seismic facies are
common features on the Egyptian continental margin and slope. Numerous old channels are
-88-
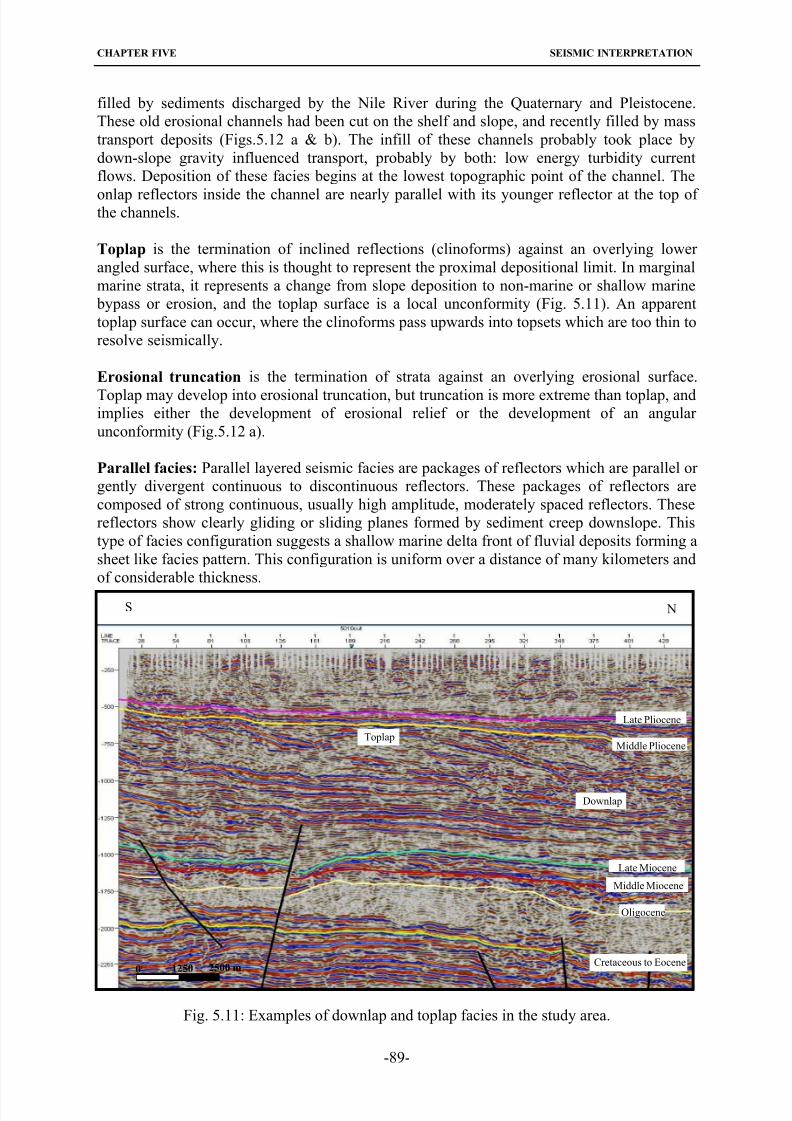
8/22/2019 barakat_moataz.pdf
http://slidepdf.com/reader/full/barakatmoatazpdf 103/158
CHAPTER FIVE SEISMIC INTERPRETATION
-89-
filled by sediments discharged by the Nile River during the Quaternary and Pleistocene.
These old erosional channels had been cut on the shelf and slope, and recently filled by mass
transport deposits (Figs.5.12 a & b). The infill of these channels probably took place by
down-slope gravity influenced transport, probably by both: low energy turbidity current
flows. Deposition of these facies begins at the lowest topographic point of the channel. The
onlap reflectors inside the channel are nearly parallel with its younger reflector at the top of the channels.
Toplap is the termination of inclined reflections (clinoforms) against an overlying lower
angled surface, where this is thought to represent the proximal depositional limit. In marginal
marine strata, it represents a change from slope deposition to non-marine or shallow marine
bypass or erosion, and the toplap surface is a local unconformity (Fig. 5.11). An apparent
toplap surface can occur, where the clinoforms pass upwards into topsets which are too thin to
resolve seismically.
Erosional truncation is the termination of strata against an overlying erosional surface.
Toplap may develop into erosional truncation, but truncation is more extreme than toplap, andimplies either the development of erosional relief or the development of an angular
unconformity (Fig.5.12 a).
Parallel facies: Parallel layered seismic facies are packages of reflectors which are parallel or
gently divergent continuous to discontinuous reflectors. These packages of reflectors are
composed of strong continuous, usually high amplitude, moderately spaced reflectors. These
reflectors show clearly gliding or sliding planes formed by sediment creep downslope. This
type of facies configuration suggests a shallow marine delta front of fluvial deposits forming a
sheet like facies pattern. This configuration is uniform over a distance of many kilometers and
of considerable thickness.
Fig. 5.11: Examples of downlap and toplap facies in the study area.
Late Pliocene
Middle Pliocene
Late Miocene
Middle Miocene
Oligocene
Cretaceous to Eocene
Downlap
Toplap
NS
2500 m12500
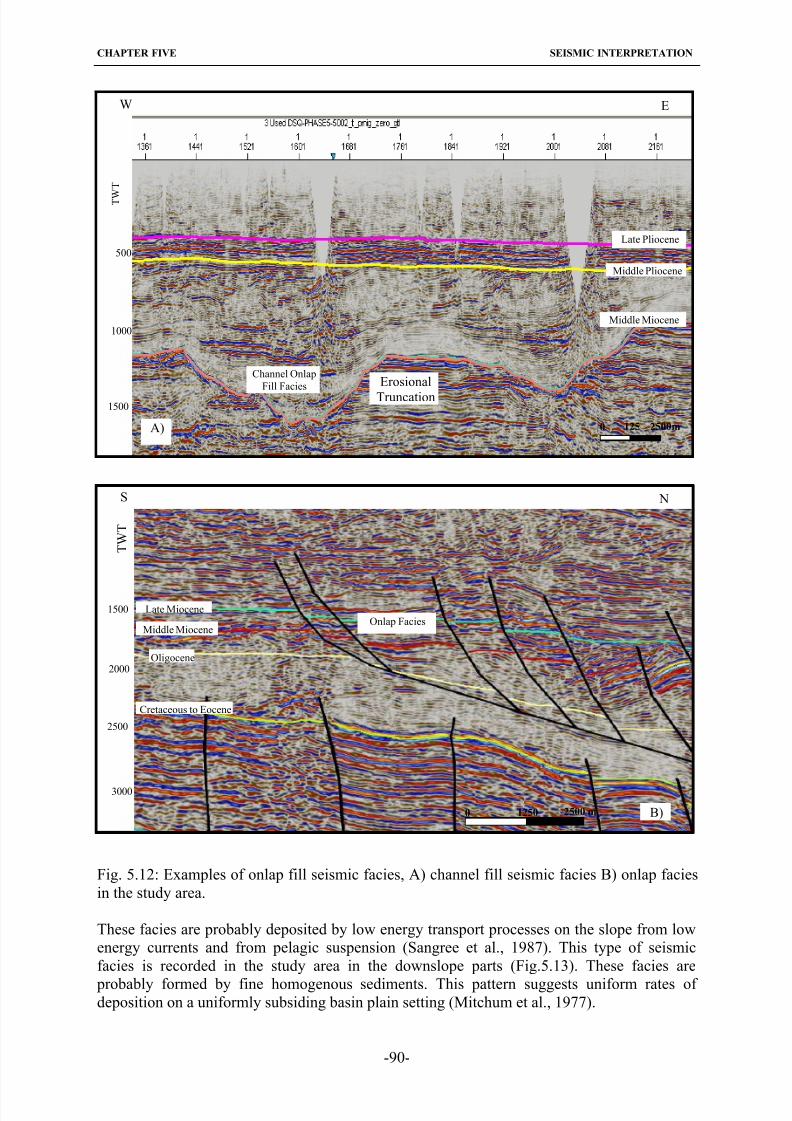
8/22/2019 barakat_moataz.pdf
http://slidepdf.com/reader/full/barakatmoatazpdf 104/158
CHAPTER FIVE SEISMIC INTERPRETATION
-90-
EW
2500m1250
1000
T W
T
1500
500
Channel Onlap
Fill Facies
Late Pliocene
Middle Pliocene
Middle Miocene
A)
Erosional
Truncation
Fig. 5.12: Examples of onlap fill seismic facies, A) channel fill seismic facies B) onlap facies
in the study area.
These facies are probably deposited by low energy transport processes on the slope from low
energy currents and from pelagic suspension (Sangree et al., 1987). This type of seismic
facies is recorded in the study area in the downslope parts (Fig.5.13). These facies are
probably formed by fine homogenous sediments. This pattern suggests uniform rates of deposition on a uniformly subsiding basin plain setting (Mitchum et al., 1977).
NS
2000
T W T
2500
1500
3000
1250 2500 m0
Onlap Facies
Late Miocene
Middle Miocene
Oligocene
Cretaceous to Eocene
B)
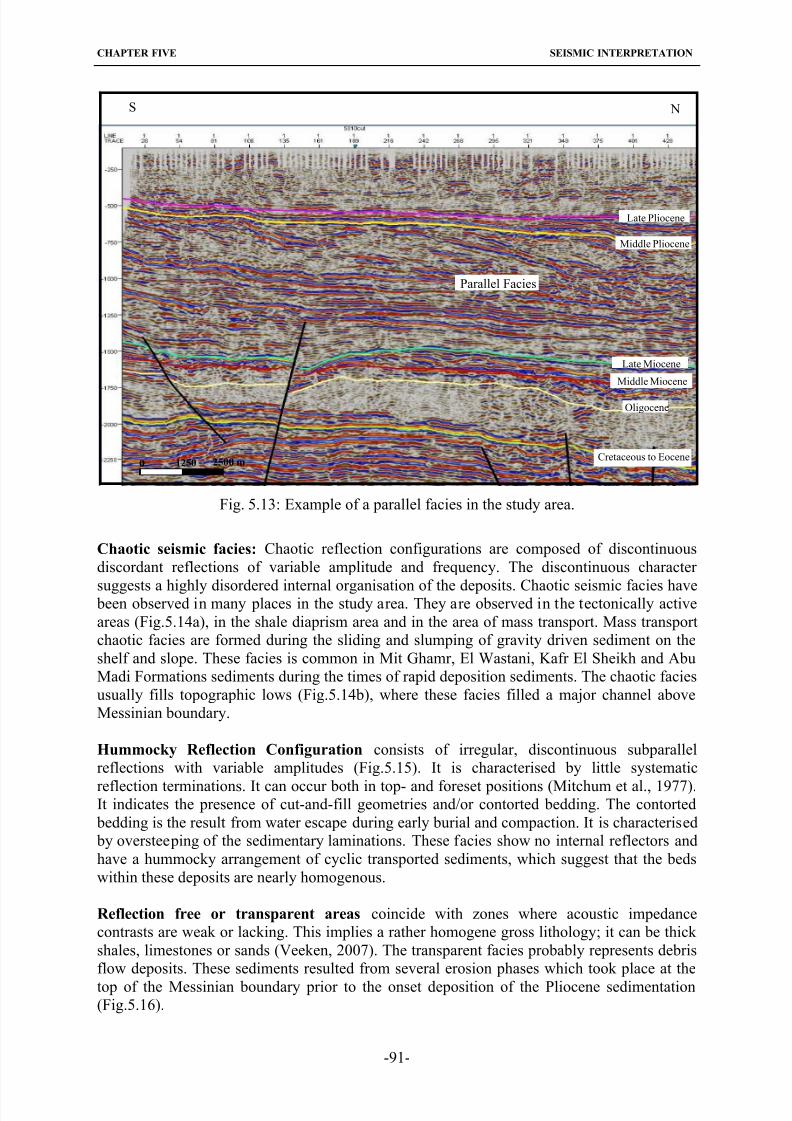
8/22/2019 barakat_moataz.pdf
http://slidepdf.com/reader/full/barakatmoatazpdf 105/158
CHAPTER FIVE SEISMIC INTERPRETATION
-91-
Fig. 5.13: Example of a parallel facies in the study area.
Chaotic seismic facies: Chaotic reflection configurations are composed of discontinuous
discordant reflections of variable amplitude and frequency. The discontinuous character
suggests a highly disordered internal organisation of the deposits. Chaotic seismic facies have been observed in many places in the study area. They are observed in the tectonically active
areas (Fig.5.14a), in the shale diaprism area and in the area of mass transport. Mass transport
chaotic facies are formed during the sliding and slumping of gravity driven sediment on the
shelf and slope. These facies is common in Mit Ghamr, El Wastani, Kafr El Sheikh and Abu
Madi Formations sediments during the times of rapid deposition sediments. The chaotic facies
usually fills topographic lows (Fig.5.14b), where these facies filled a major channel above
Messinian boundary.
Hummocky Reflection Configuration consists of irregular, discontinuous subparallel
reflections with variable amplitudes (Fig.5.15). It is characterised by little systematic
reflection terminations. It can occur both in top- and foreset positions (Mitchum et al., 1977).It indicates the presence of cut-and-fill geometries and/or contorted bedding. The contorted
bedding is the result from water escape during early burial and compaction. It is characterised
by oversteeping of the sedimentary laminations. These facies show no internal reflectors and
have a hummocky arrangement of cyclic transported sediments, which suggest that the beds
within these deposits are nearly homogenous.
Reflection free or transparent areas coincide with zones where acoustic impedance
contrasts are weak or lacking. This implies a rather homogene gross lithology; it can be thick
shales, limestones or sands (Veeken, 2007). The transparent facies probably represents debris
flow deposits. These sediments resulted from several erosion phases which took place at the
top of the Messinian boundary prior to the onset deposition of the Pliocene sedimentation(Fig.5.16).
S
2500 m12500
N
Late Pliocene
Middle Pliocene
Parallel Facies
Late Miocene
Middle Miocene
Oligocene
Cretaceous to Eocene
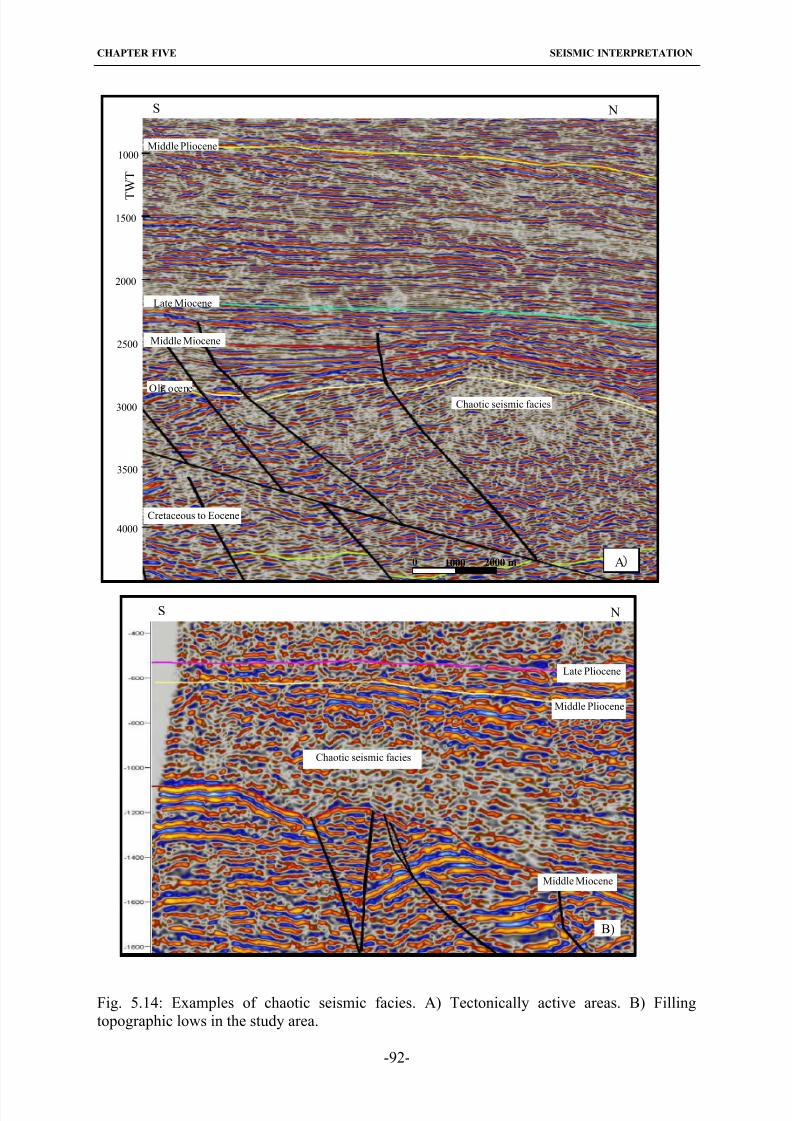
8/22/2019 barakat_moataz.pdf
http://slidepdf.com/reader/full/barakatmoatazpdf 106/158
CHAPTER FIVE SEISMIC INTERPRETATION
-92-
2000
T
W T
2500
1500
3000
Middle Pliocene
Late Miocene
Middle Miocene
Oli ocene
Cretaceous to Eocene
Chaotic seismic facies
A
1000
3500
4000
NS
0 1000 2000 m
Fig. 5.14: Examples of chaotic seismic facies. A) Tectonically active areas. B) Filling
topographic lows in the study area.
S N
B)
Late Pliocene
Middle Pliocene
Middle Miocene
Chaotic seismic facies
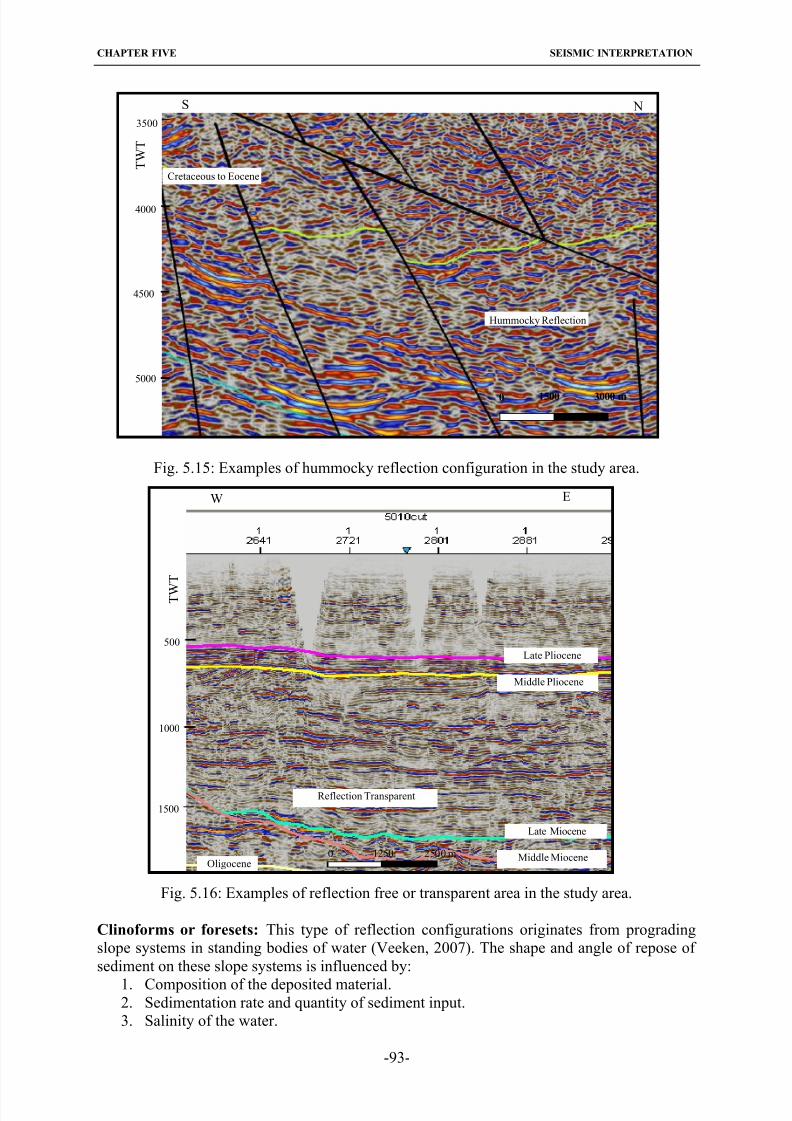
8/22/2019 barakat_moataz.pdf
http://slidepdf.com/reader/full/barakatmoatazpdf 107/158
CHAPTER FIVE SEISMIC INTERPRETATION
Cretaceous to Eocene
Hummocky Reflection
1500 3000 m0
4000
T W T
4500
3500
5000
NS
Fig. 5.15: Examples of hummocky reflection configuration in the study area.
Fig. 5.16: Examples of reflection free or transparent area in the study area.
Clinoforms or foresets: This type of reflection configurations originates from prograding
slope systems in standing bodies of water (Veeken, 2007). The shape and angle of repose of
sediment on these slope systems is influenced by:
1. Composition of the deposited material.2. Sedimentation rate and quantity of sediment input.
3. Salinity of the water.
EW
T W
T
Late Pliocene
Middle Pliocene
Late Miocene
Middle MioceneOligocene
Reflection Transparent
1000
500
1500
0 1250 2500 m
-93-
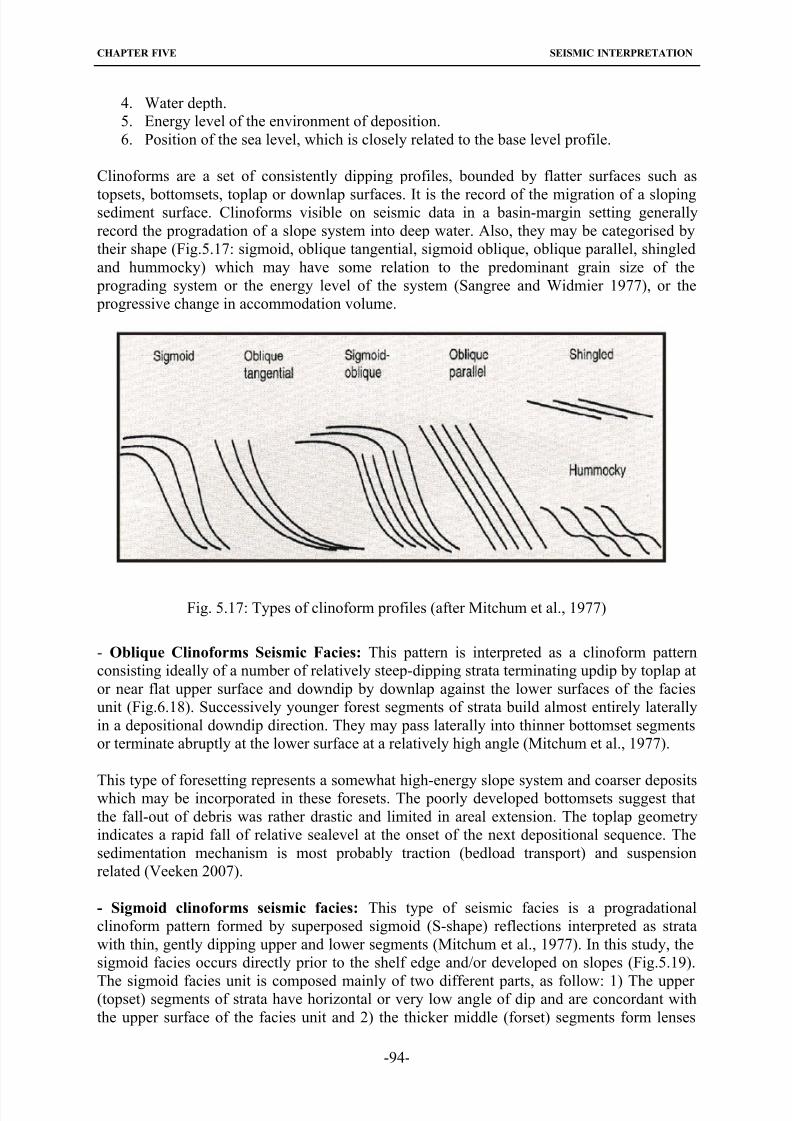
8/22/2019 barakat_moataz.pdf
http://slidepdf.com/reader/full/barakatmoatazpdf 108/158
CHAPTER FIVE SEISMIC INTERPRETATION
-94-
4. Water depth.
5. Energy level of the environment of deposition.
6. Position of the sea level, which is closely related to the base level profile.
Clinoforms are a set of consistently dipping profiles, bounded by flatter surfaces such as
topsets, bottomsets, toplap or downlap surfaces. It is the record of the migration of a slopingsediment surface. Clinoforms visible on seismic data in a basin-margin setting generally
record the progradation of a slope system into deep water. Also, they may be categorised by
their shape (Fig.5.17: sigmoid, oblique tangential, sigmoid oblique, oblique parallel, shingled
and hummocky) which may have some relation to the predominant grain size of the
prograding system or the energy level of the system (Sangree and Widmier 1977), or the
progressive change in accommodation volume.
Fig. 5.17: Types of clinoform profiles (after Mitchum et al., 1977)
- Oblique Clinoforms Seismic Facies: This pattern is interpreted as a clinoform pattern
consisting ideally of a number of relatively steep-dipping strata terminating updip by toplap at
or near flat upper surface and downdip by downlap against the lower surfaces of the facies
unit (Fig.6.18). Successively younger forest segments of strata build almost entirely laterally
in a depositional downdip direction. They may pass laterally into thinner bottomset segments
or terminate abruptly at the lower surface at a relatively high angle (Mitchum et al., 1977).
This type of foresetting represents a somewhat high-energy slope system and coarser depositswhich may be incorporated in these foresets. The poorly developed bottomsets suggest that
the fall-out of debris was rather drastic and limited in areal extension. The toplap geometry
indicates a rapid fall of relative sealevel at the onset of the next depositional sequence. The
sedimentation mechanism is most probably traction (bedload transport) and suspension
related (Veeken 2007).
- Sigmoid clinoforms seismic facies: This type of seismic facies is a progradational
clinoform pattern formed by superposed sigmoid (S-shape) reflections interpreted as strata
with thin, gently dipping upper and lower segments (Mitchum et al., 1977). In this study, the
sigmoid facies occurs directly prior to the shelf edge and/or developed on slopes (Fig.5.19).
The sigmoid facies unit is composed mainly of two different parts, as follow: 1) The upper (topset) segments of strata have horizontal or very low angle of dip and are concordant with
the upper surface of the facies unit and 2) the thicker middle (forset) segments form lenses
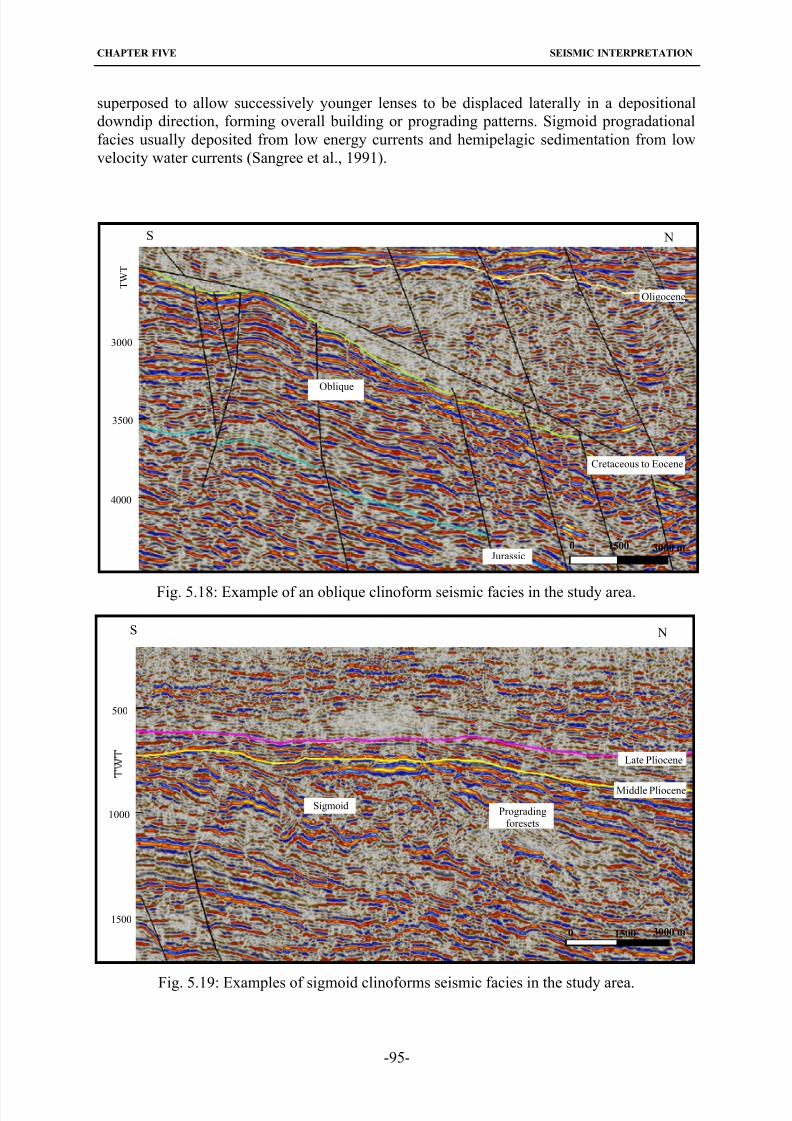
8/22/2019 barakat_moataz.pdf
http://slidepdf.com/reader/full/barakatmoatazpdf 109/158
CHAPTER FIVE SEISMIC INTERPRETATION
-95-
superposed to allow successively younger lenses to be displaced laterally in a depositional
downdip direction, forming overall building or prograding patterns. Sigmoid progradational
facies usually deposited from low energy currents and hemipelagic sedimentation from low
velocity water currents (Sangree et al., 1991).
Fig. 5.18: Example of an oblique clinoform seismic facies in the study area.
Fig. 5.19: Examples of sigmoid clinoforms seismic facies in the study area.
Jurassic
Oligocene
Cretaceous to Eocene
Oblique
3500
T W T
4000
3000
NS
15000 3000 m
S N
Late Pliocene
Middle Pliocene
SigmoidPrograding
foresets
0 1500 3000 m
500
1000
1500
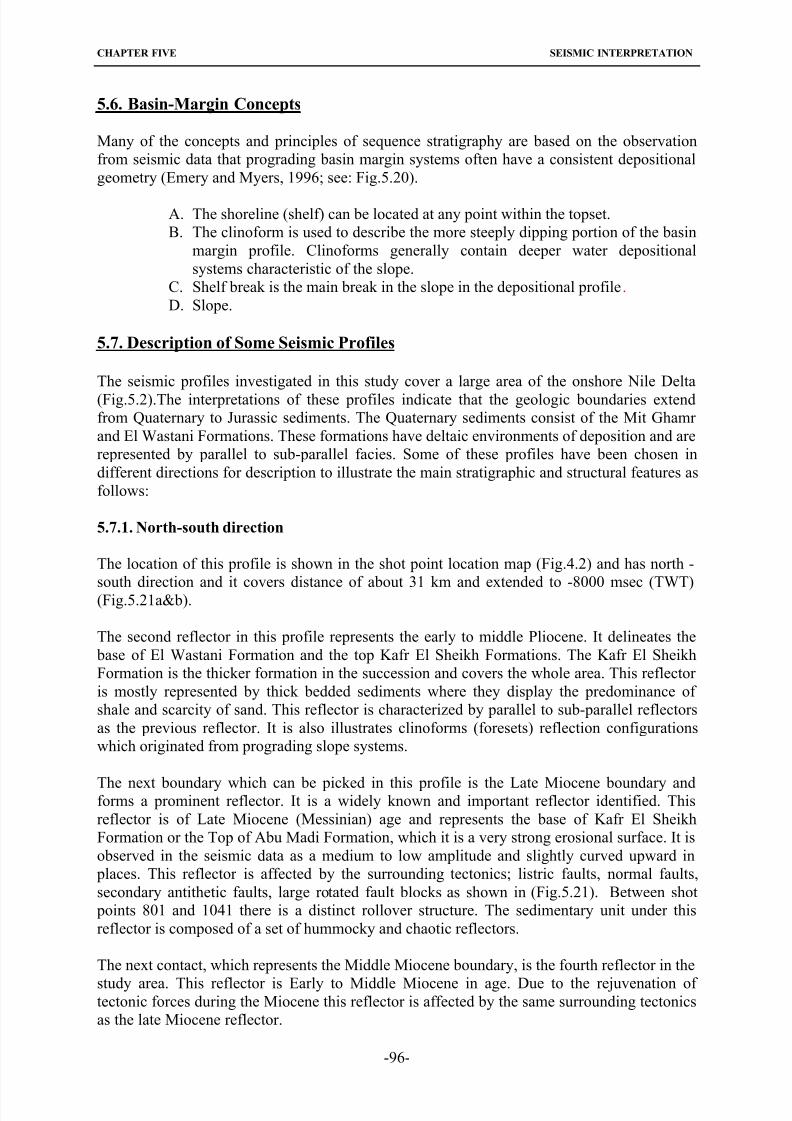
8/22/2019 barakat_moataz.pdf
http://slidepdf.com/reader/full/barakatmoatazpdf 110/158
CHAPTER FIVE SEISMIC INTERPRETATION
5.6. Basin-Margin Concepts
Many of the concepts and principles of sequence stratigraphy are based on the observation
from seismic data that prograding basin margin systems often have a consistent depositional
geometry (Emery and Myers, 1996; see: Fig.5.20).
A. The shoreline (shelf) can be located at any point within the topset.
B. The clinoform is used to describe the more steeply dipping portion of the basin
margin profile. Clinoforms generally contain deeper water depositional
systems characteristic of the slope.
C. Shelf break is the main break in the slope in the depositional profile .
D. Slope.
5.7. Description of Some Seismic Profiles
The seismic profiles investigated in this study cover a large area of the onshore Nile Delta
(Fig.5.2).The interpretations of these profiles indicate that the geologic boundaries extend
from Quaternary to Jurassic sediments. The Quaternary sediments consist of the Mit Ghamr
and El Wastani Formations. These formations have deltaic environments of deposition and are
represented by parallel to sub-parallel facies. Some of these profiles have been chosen in
different directions for description to illustrate the main stratigraphic and structural features as
follows:
5.7.1. North-south direction
The location of this profile is shown in the shot point location map (Fig.4.2) and has north -
south direction and it covers distance of about 31 km and extended to -8000 msec (TWT)(Fig.5.21a&b).
The second reflector in this profile represents the early to middle Pliocene. It delineates the
base of El Wastani Formation and the top Kafr El Sheikh Formations. The Kafr El Sheikh
Formation is the thicker formation in the succession and covers the whole area. This reflector
is mostly represented by thick bedded sediments where they display the predominance of
shale and scarcity of sand. This reflector is characterized by parallel to sub-parallel reflectors
as the previous reflector. It is also illustrates clinoforms (foresets) reflection configurations
which originated from prograding slope systems.
The next boundary which can be picked in this profile is the Late Miocene boundary andforms a prominent reflector. It is a widely known and important reflector identified. This
reflector is of Late Miocene (Messinian) age and represents the base of Kafr El Sheikh
Formation or the Top of Abu Madi Formation, which it is a very strong erosional surface. It is
observed in the seismic data as a medium to low amplitude and slightly curved upward in
places. This reflector is affected by the surrounding tectonics; listric faults, normal faults,
secondary antithetic faults, large rotated fault blocks as shown in (Fig.5.21). Between shot
points 801 and 1041 there is a distinct rollover structure. The sedimentary unit under this
reflector is composed of a set of hummocky and chaotic reflectors.
The next contact, which represents the Middle Miocene boundary, is the fourth reflector in the
study area. This reflector is Early to Middle Miocene in age. Due to the rejuvenation of tectonic forces during the Miocene this reflector is affected by the same surrounding tectonics
as the late Miocene reflector.
-96-
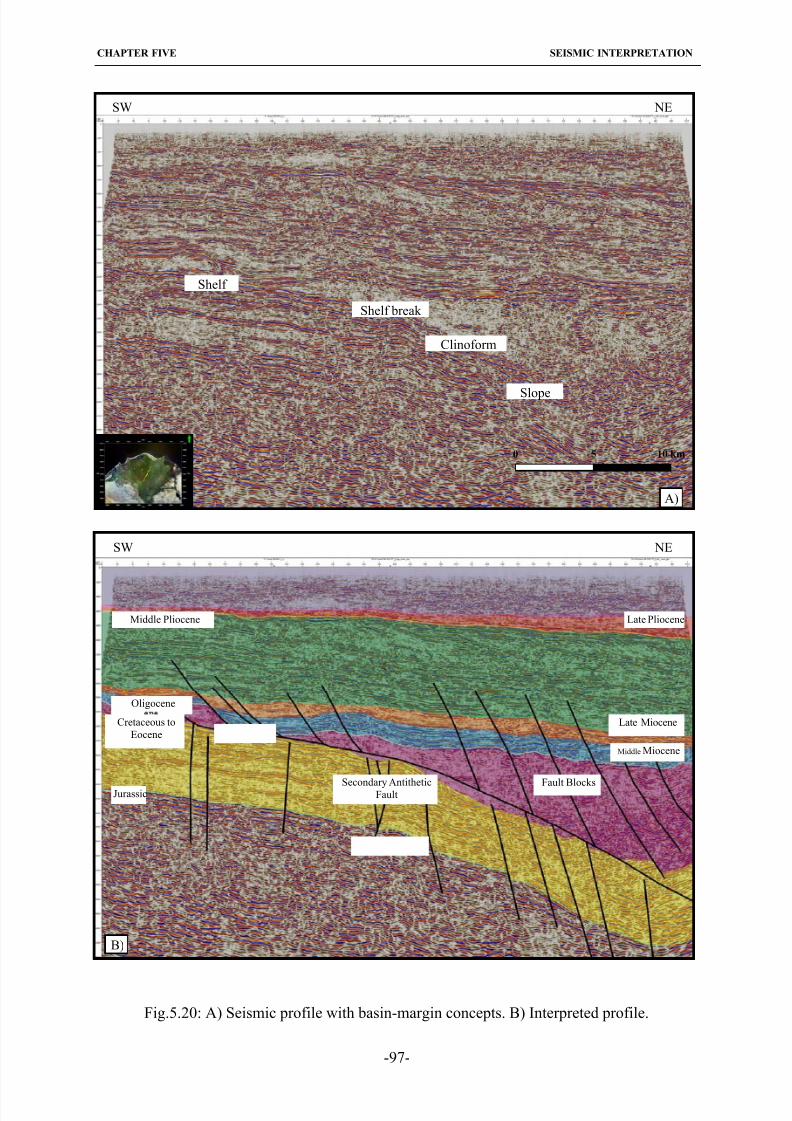
8/22/2019 barakat_moataz.pdf
http://slidepdf.com/reader/full/barakatmoatazpdf 111/158
CHAPTER FIVE SEISMIC INTERPRETATION
-97-
SW NE
0 10 km5
Shelf
Shelf break
Clinoform
Slope
A)
Fig.5.20: A) Seismic profile with basin-margin concepts. B) Interpreted profile.
SW NE
Middle Pliocene Late Pliocene
Oligocene
Late MioceneCretaceous to
Eocene Listric faultMiddle Miocene
Jurassic Secondary AntitheticFault Fault Blocks
Normal faults
B)
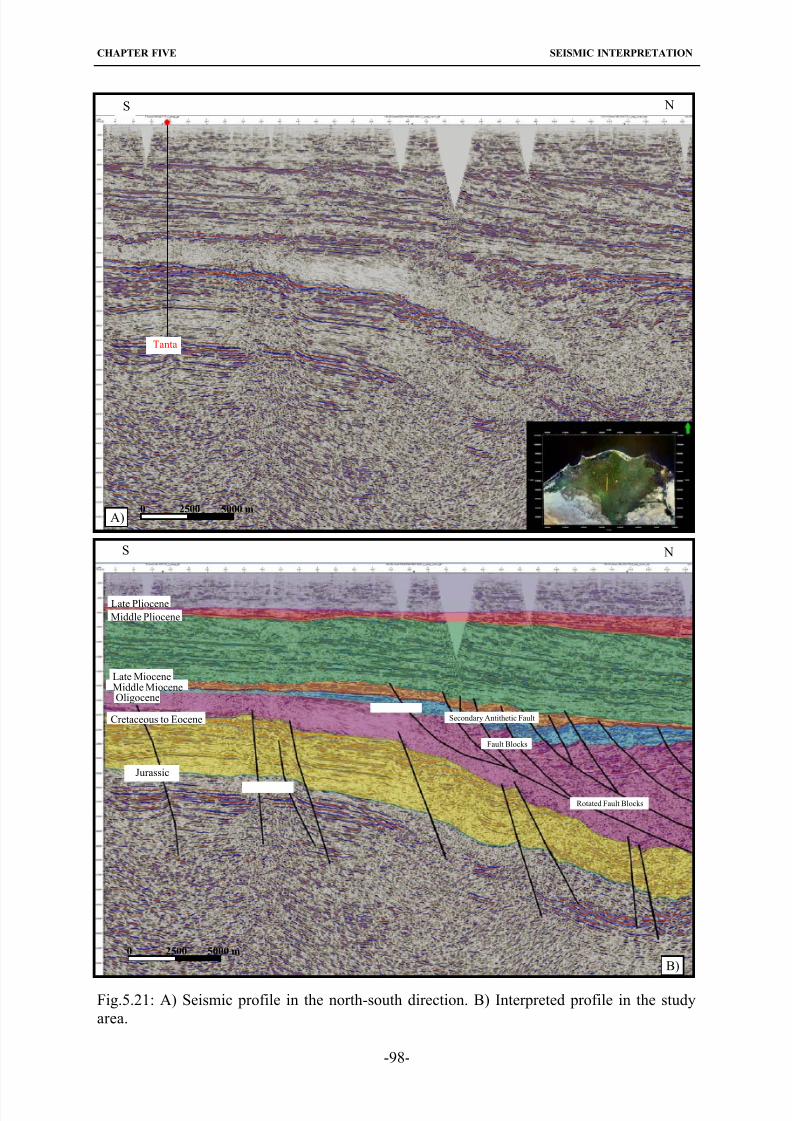
8/22/2019 barakat_moataz.pdf
http://slidepdf.com/reader/full/barakatmoatazpdf 112/158
CHAPTER FIVE SEISMIC INTERPRETATION
-98-
5000 m25000
NS
Tanta
A)
Fig.5.21: A) Seismic profile in the north-south direction. B) Interpreted profile in the study
area.
Late MioceneMiddle MioceneOligocene
Cretaceous to Eocene
Jurassic
Late Pliocene
Middle Pliocene
NS
5000 m25000
Secondary Antithetic Fault
Rotated Fault Blocks
Fault Blocks
Normal faults
Listric fault
B)
8/22/2019 barakat_moataz.pdf
http://slidepdf.com/reader/full/barakatmoatazpdf 113/158
CHAPTER FIVE SEISMIC INTERPRETATION
The next reflector shows the early Miocene and /or the top of Oligocene sediments. The
Miocene is very difficult to differentiate in between them. It is irregularly curved, medium to
high amplitude, continuous to discontinuous and in deeper parts it is difficult to identify this
reflector due to the poor availability and the quality data (white zone). This reflector was
affected also as the above two reflectors by the same rotated fault blocks. The Oligocene unit
is eroded at its top and composed mainly of hummocky facies, chaotic and slumping deposits.It is concordance to folded structure baselaps of the Oligocene sediments.
The sixth boundary (K/T) is difficult to distinguish without supplementary detailed
paleontological studies between the Eocene and Cretaceous as in being within carbonate
sediments. This reflector has a strong to medium appearance and high frequency. It is
characterized by its continuity and parallel to sub-parallel reflectors, which obscured by
normal faulting to form broken discontinuous reflector.
The last boundary which can be determined is the top of Jurassic. This reflector is slightly
curved, mostly faulted and uplifted. This boundary is mostly affected by the ENE Syrian arc
system like the K/T boundary.
5.7.2. East-west direction
This profile illustrates all the boundaries and it is shown in the shot point location map
(Fig.4.2) with east-west direction and it covers distance of about 70 km and extended to -8000
msec (TWT; Fig.5.22a&b). In this profile it is easy to trace its reflectors due to the presence
of Itay El- Barud well data.
The first reflector is representing the Late Pliocene boundary and has the same characteristic
of the other profile in the south-east direction (Fig.5.21). The second reflector represents the
early to middle Pliocene. It appears in some places as a transparent unit or reflection-free
facies.
The Late Miocene boundary (Messinian age) is a very clear erosional surface. This reflector is
only picked between shot points 2641 and 2961 with the hanging wall of the major listric fault
in the study area.
The next reflector represents the Early to Middle Miocene. Also in this case there is no
structure feature to determine like for the previous boundary; only between shot points 2641
and 2961 it can be determined by major listric faults and rotated fault blocks. This reflector
represents the sedimentary infill of a fluvial plaeo-valley developing from south to north.Also, it is characterised by stacked fluvio-deltaic sandstones and shales onlapping landward
and to the valley flanks against the basal erosional surface. This indicates that the Messinian
(Eo-Nile) canyons distributaries were a persistent topographic (or geomorphic) feature until
historical western Nile Delta branches (Barakat and Dominik, 2010).
The Early Miocene and the top of Oligocene are represented by a white zone. This reflector is
characterized by transparent unit or reflection-free facies. It is also affected also by the same
structures of the above two reflectors. The next boundary is the K/T boundary, which has a
strong to medium appearance and high frequency. It is easy to determine this reflector due to
the continuity and parallel to sub-parallel reflectors, which are obscured by normal faulting to
form broken discontinuous reflectors.
-99-
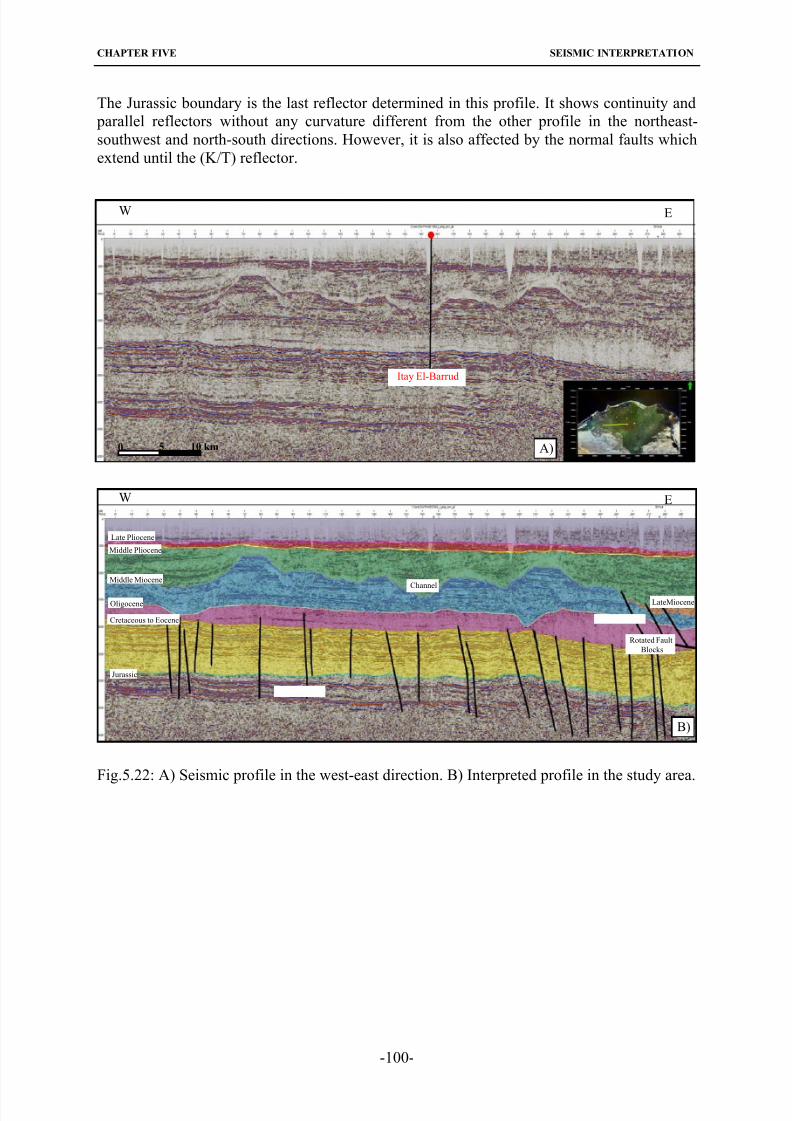
8/22/2019 barakat_moataz.pdf
http://slidepdf.com/reader/full/barakatmoatazpdf 114/158
CHAPTER FIVE SEISMIC INTERPRETATION
-100-
The Jurassic boundary is the last reflector determined in this profile. It shows continuity and
parallel reflectors without any curvature different from the other profile in the northeast-
southwest and north-south directions. However, it is also affected by the normal faults which
extend until the (K/T) reflector.
Fig.5.22: A) Seismic profile in the west-east direction. B) Interpreted profile in the study area.
Late Pliocene
Middle Pliocene
LateMiocene
Middle Miocene
Oligocene
Cretaceous to Eocene
Jurassic
EW
Normal faults
Listric fault
Channel
Rotated Fault
Blocks
B)
EW
0 10 km5 A)
Itay El-Barrud
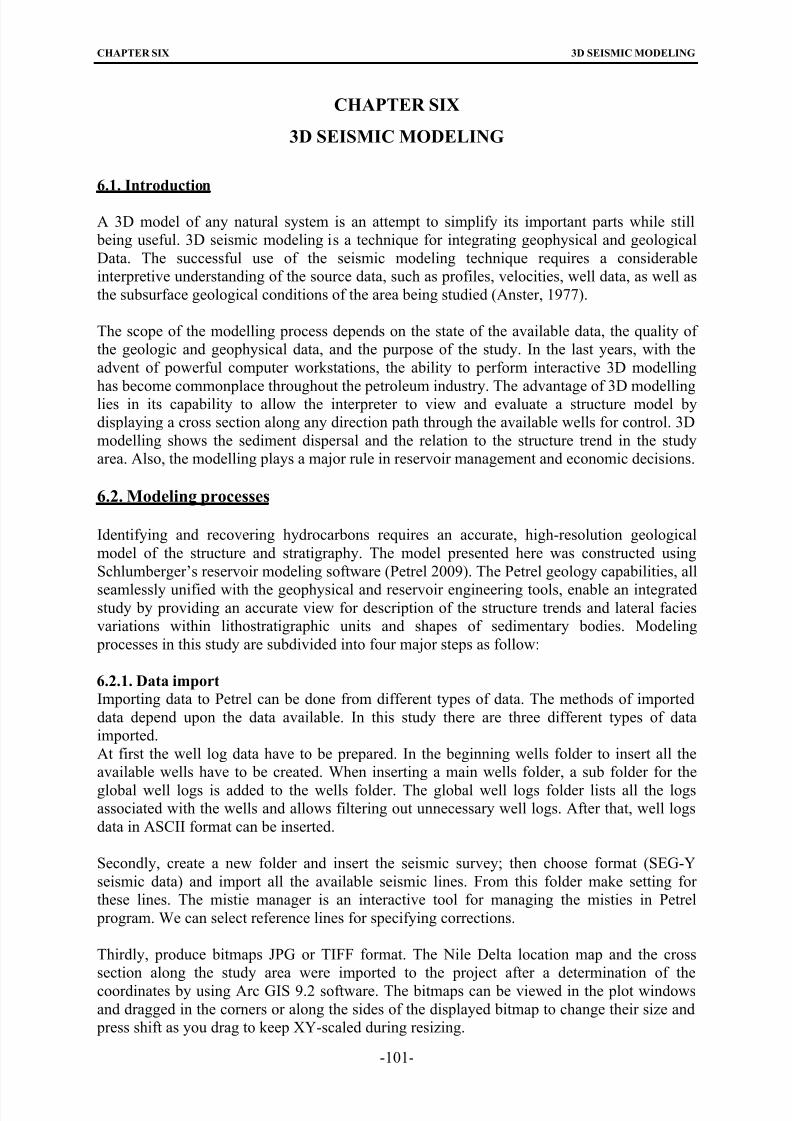
8/22/2019 barakat_moataz.pdf
http://slidepdf.com/reader/full/barakatmoatazpdf 115/158
CHAPTER SIX 3D SEISMIC MODELING
CHAPTER SIX
3D SEISMIC MODELING
6.1. Introduction
A 3D model of any natural system is an attempt to simplify its important parts while still
being useful. 3D seismic modeling is a technique for integrating geophysical and geological
Data. The successful use of the seismic modeling technique requires a considerable
interpretive understanding of the source data, such as profiles, velocities, well data, as well as
the subsurface geological conditions of the area being studied (Anster, 1977).
The scope of the modelling process depends on the state of the available data, the quality of
the geologic and geophysical data, and the purpose of the study. In the last years, with the
advent of powerful computer workstations, the ability to perform interactive 3D modelling
has become commonplace throughout the petroleum industry. The advantage of 3D modellinglies in its capability to allow the interpreter to view and evaluate a structure model by
displaying a cross section along any direction path through the available wells for control. 3D
modelling shows the sediment dispersal and the relation to the structure trend in the study
area. Also, the modelling plays a major rule in reservoir management and economic decisions.
6.2. Modeling processes
Identifying and recovering hydrocarbons requires an accurate, high-resolution geological
model of the structure and stratigraphy. The model presented here was constructed using
Schlumberger’s reservoir modeling software (Petrel 2009). The Petrel geology capabilities, all
seamlessly unified with the geophysical and reservoir engineering tools, enable an integratedstudy by providing an accurate view for description of the structure trends and lateral facies
variations within lithostratigraphic units and shapes of sedimentary bodies. Modeling
processes in this study are subdivided into four major steps as follow:
6.2.1. Data import
Importing data to Petrel can be done from different types of data. The methods of imported
data depend upon the data available. In this study there are three different types of data
imported.
At first the well log data have to be prepared. In the beginning wells folder to insert all the
ilable wells have to be created. When inserting a main wells folder, a sub folder for the
global well logs is added to the wells folder. The global well logs folder lists all the logsassociated with the wells and allows filtering out unnecessary well logs. After that, well logs
data in ASCII format can be inserted.
Secondly, create a new folder and insert the seismic survey; then choose format (SEG-Y
seismic data) and import all the available seismic lines. From this folder make setting for
these lines. The mistie manager is an interactive tool for managing the misties in Petrel
program. We can select reference lines for specifying corrections.
Thirdly, produce bitmaps JPG or TIFF format. The Nile Delta location map and the cross
section along the study area were imported to the project after a determination of the
coordinates by using Arc GIS 9.2 software. The bitmaps can be viewed in the plot windows
and dragged in the corners or along the sides of the displayed bitmap to change their size and
press shift as you drag to keep XY-scaled during resizing.
ava
-101-
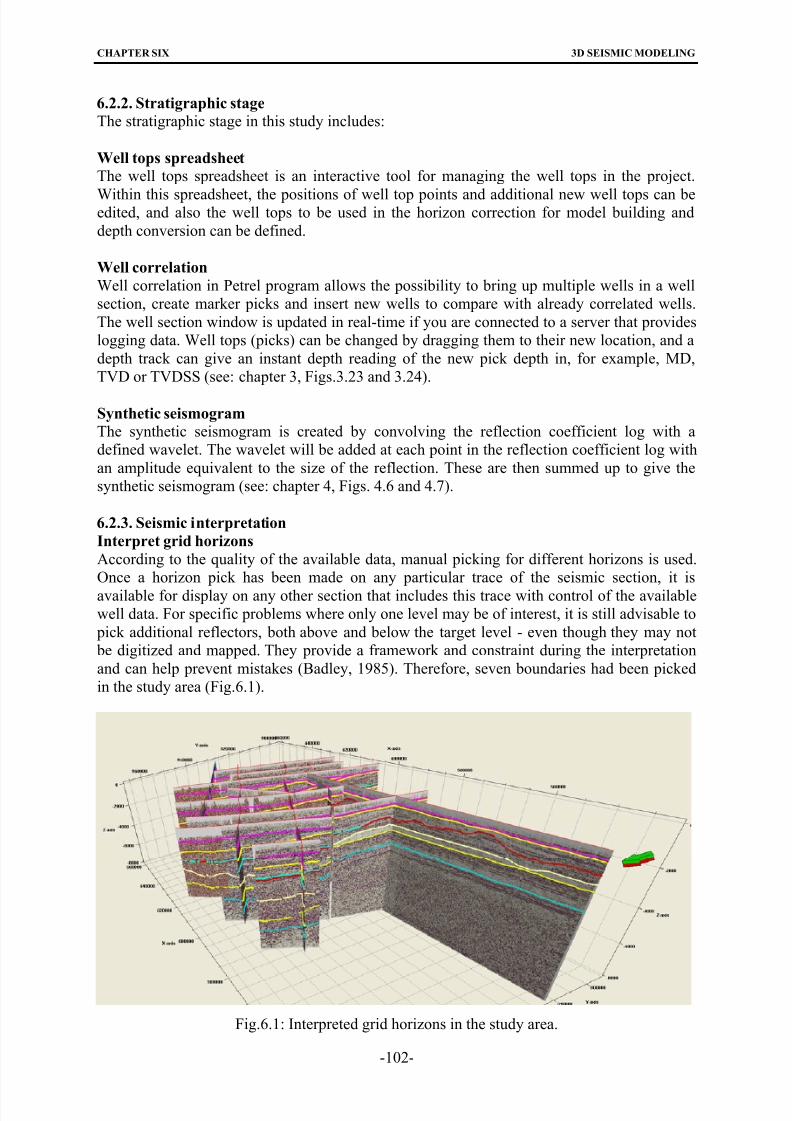
8/22/2019 barakat_moataz.pdf
http://slidepdf.com/reader/full/barakatmoatazpdf 116/158
CHAPTER SIX 3D SEISMIC MODELING
6.2.2. Stratigraphic stage The stratigraphic stage in this study includes:
Well tops spreadsheet
The well tops spreadsheet is an interactive tool for managing the well tops in the project.
Within this spreadsheet, the positions of well top points and additional new well tops can beedited, and also the well tops to be used in the horizon correction for model building and
depth conversion can be defined.
Well correlation
Well correlation in Petrel program allows the possibility to bring up multiple wells in a well
section, create marker picks and insert new wells to compare with already correlated wells.
The well section window is updated in real-time if you are connected to a server that provides
logging data. Well tops (picks) can be changed by dragging them to their new location, and a
depth track can give an instant depth reading of the new pick depth in, for example, MD,
TVD or TVDSS (see: chapter 3, Figs.3.23 and 3.24).
Synthetic seismogram
The synthetic seismogram is created by convolving the reflection coefficient log with a
defined wavelet. The wavelet will be added at each point in the reflection coefficient log with
an amplitude equivalent to the size of the reflection. These are then summed up to give the
synthetic seismogram (see: chapter 4, Figs. 4.6 and 4.7).
6.2.3. Seismic interpretation
Interpret grid horizons
According to the quality of the available data, manual picking for different horizons is used.
Once a horizon pick has been made on any particular trace of the seismic section, it is
available for display on any other section that includes this trace with control of the available
well data. For specific problems where only one level may be of interest, it is still advisable to
pick additional reflectors, both above and below the target level - even though they may not
be digitized and mapped. They provide a framework and constraint during the interpretation
and can help prevent mistakes (Badley, 1985). Therefore, seven boundaries had been picked
in the study area (Fig.6.1).
Fig.6.1: Interpreted grid horizons in the study area.
-102-
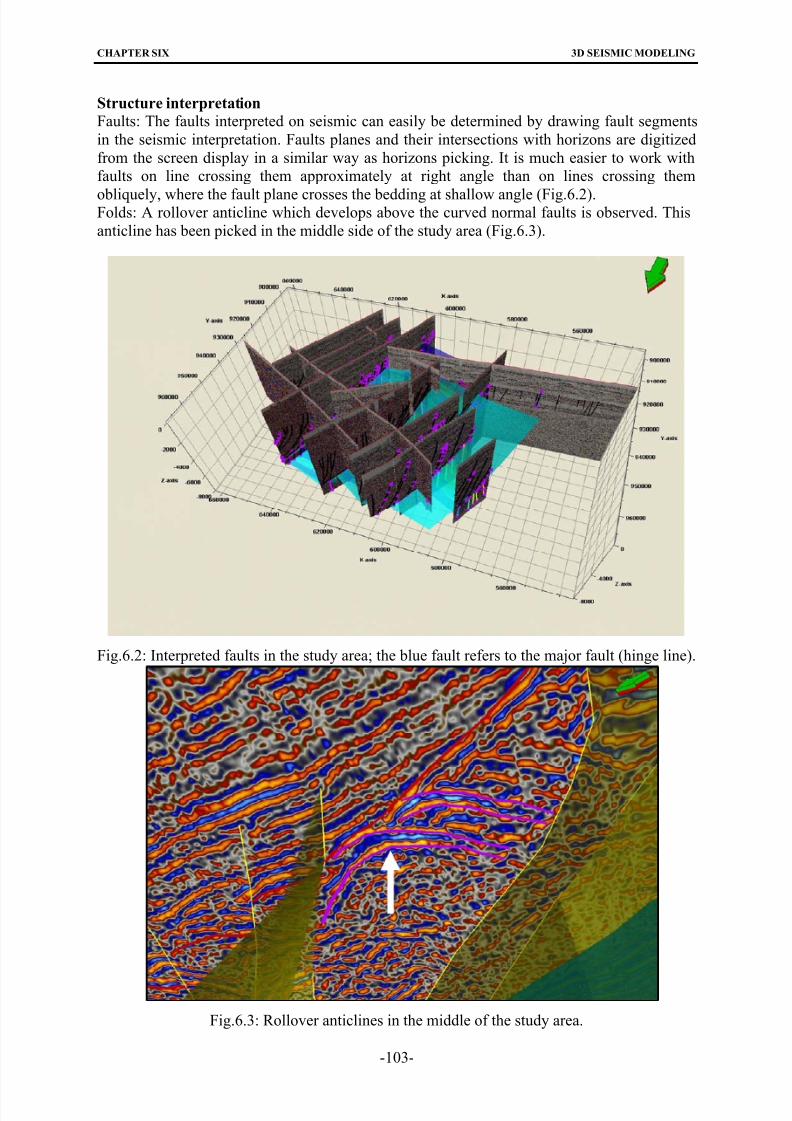
8/22/2019 barakat_moataz.pdf
http://slidepdf.com/reader/full/barakatmoatazpdf 117/158
CHAPTER SIX 3D SEISMIC MODELING
-103-
Structure interpretation
Faults: The faults interpreted on seismic can easily be determined by drawing fault segments
in the seismic interpretation. Faults planes and their intersections with horizons are digitized
from the screen display in a similar way as horizons picking. It is much easier to work with
faults on line crossing them approximately at right angle than on lines crossing them
obliquely, where the fault plane crosses the bedding at shallow angle (Fig.6.2).Folds: A rollover anticline which develops above the curved normal faults is observed. This
anticline has been picked in the middle side of the study area (Fig.6.3).
Fig.6.2: Interpreted faults in the study area; the blue fault refers to the major fault (hinge line).
Fig.6.3: Rollover anticlines in the middle of the study area.
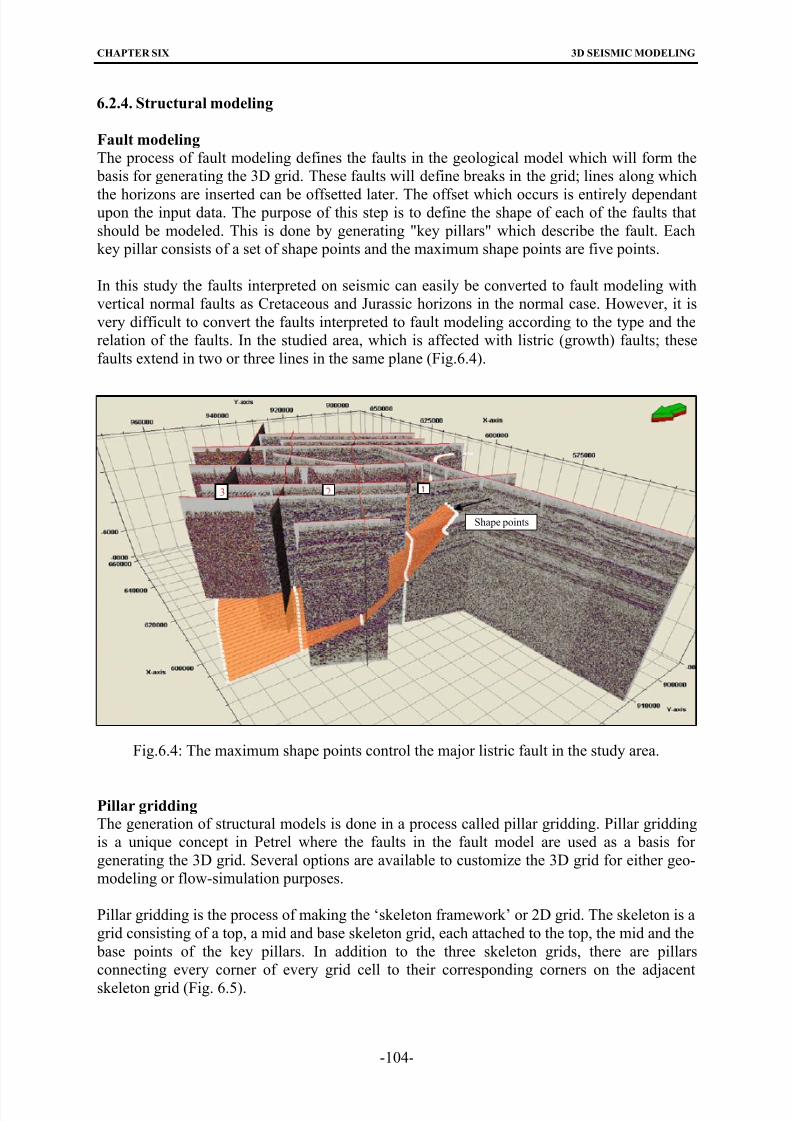
8/22/2019 barakat_moataz.pdf
http://slidepdf.com/reader/full/barakatmoatazpdf 118/158
CHAPTER SIX 3D SEISMIC MODELING
-104-
6.2.4. Structural modeling
Fault modeling
The process of fault modeling defines the faults in the geological model which will form the
basis for generating the 3D grid. These faults will define breaks in the grid; lines along which
the horizons are inserted can be offsetted later. The offset which occurs is entirely dependantupon the input data. The purpose of this step is to define the shape of each of the faults that
should be modeled. This is done by generating "key pillars" which describe the fault. Each
key pillar consists of a set of shape points and the maximum shape points are five points.
In this study the faults interpreted on seismic can easily be converted to fault modeling with
vertical normal faults as Cretaceous and Jurassic horizons in the normal case. However, it is
very difficult to convert the faults interpreted to fault modeling according to the type and the
relation of the faults. In the studied area, which is affected with listric (growth) faults; these
faults extend in two or three lines in the same plane (Fig.6.4).
Fig.6.4: The maximum shape points control the major listric fault in the study area.
Pillar gridding
The generation of structural models is done in a process called pillar gridding. Pillar gridding
is a unique concept in Petrel where the faults in the fault model are used as a basis for
generating the 3D grid. Several options are available to customize the 3D grid for either geo-
modeling or flow-simulation purposes.
Pillar gridding is the process of making the ‘skeleton framework’ or 2D grid. The skeleton is a
grid consisting of a top, a mid and base skeleton grid, each attached to the top, the mid and the
base points of the key pillars. In addition to the three skeleton grids, there are pillars
connecting every corner of every grid cell to their corresponding corners on the adjacent
skeleton grid (Fig. 6.5).
3
Shape points
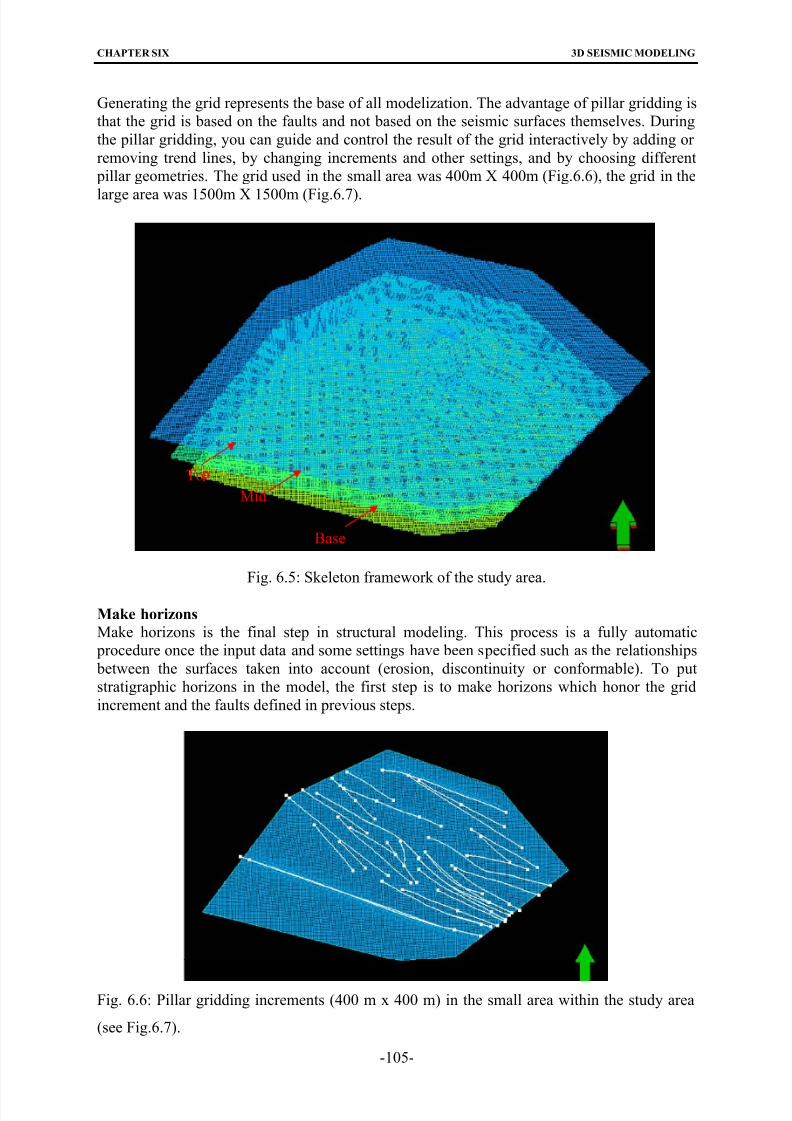
8/22/2019 barakat_moataz.pdf
http://slidepdf.com/reader/full/barakatmoatazpdf 119/158
CHAPTER SIX 3D SEISMIC MODELING
-105-
Generating the grid represents the base of all modelization. The advantage of pillar gridding is
that the grid is based on the faults and not based on the seismic surfaces themselves. During
the pillar gridding, you can guide and control the result of the grid interactively by adding or
removing trend lines, by changing increments and other settings, and by choosing different
Fig. 6.5: Skeleton framework of the study area.
Make horizons
Make horizons is the final step in structural modeling. This process is a fully automatic
procedure once the input data and some settings have been specified such as the relationships
between the surfaces taken into account (erosion, discontinuity or conformable). To put
stratigraphic horizons in the model, the first step is to make horizons which honor the grid
increment and the faults defined in previous steps.
pillar geometries. The grid used in the small area was 400m X 400m (Fig.6.6), the grid in the
large area was 1500m X 1500m (Fig.6.7).
To
Mid
Base
Fig. 6.6: Pillar gridding increments (400 m x 400 m) in the small area within the study area
(see Fig.6.7).
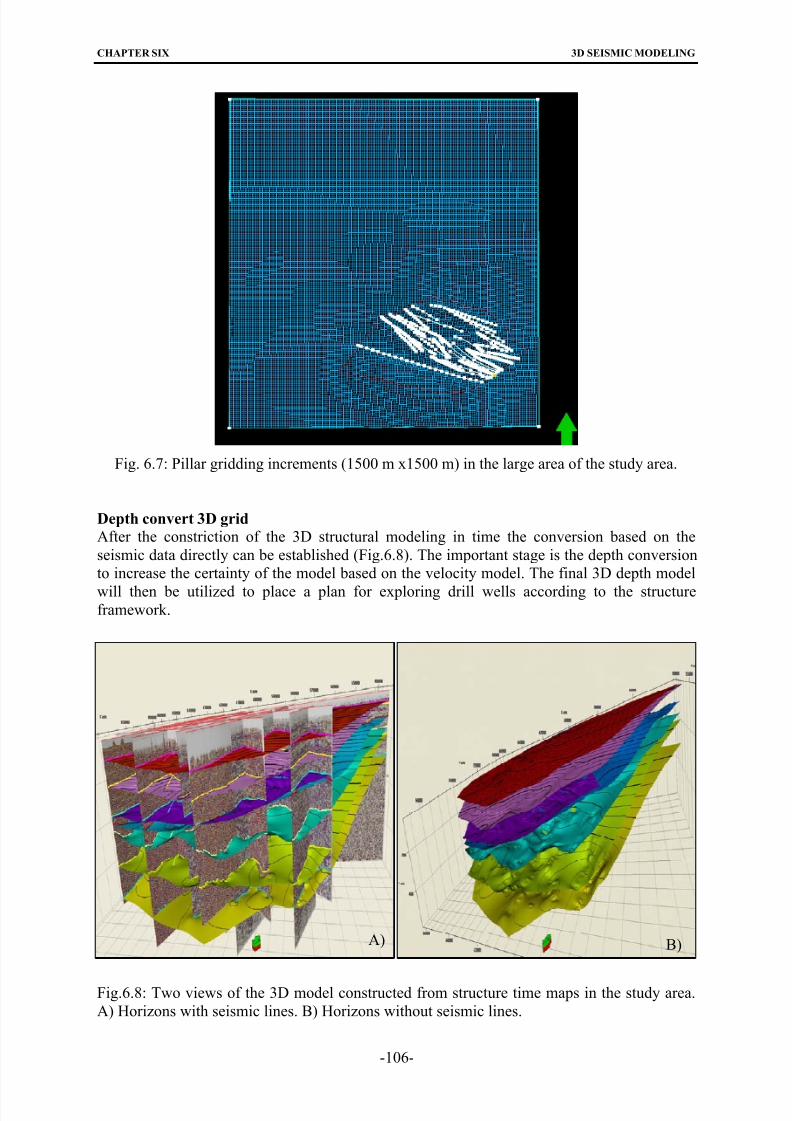
8/22/2019 barakat_moataz.pdf
http://slidepdf.com/reader/full/barakatmoatazpdf 120/158
CHAPTER SIX 3D SEISMIC MODELING
-106-
Fig. 6.7: Pillar gridding increments (1500 m x1500 m) in the large area of the study area.
Depth convert 3D grid
After the constriction of the 3D structural modeling in time the conversion based on the
seismic data directly can be established (Fig.6.8). The important stage is the depth conversion
to increase the certainty of the model based on the velocity model. The final 3D depth model
will then be utilized to place a plan for exploring drill wells according to the structureframework.
Fig.6.8: Two views of the 3D model constructed from structure time maps in the study area.
A) Horizons with seismic lines. B) Horizons without seismic lines.
B)A)
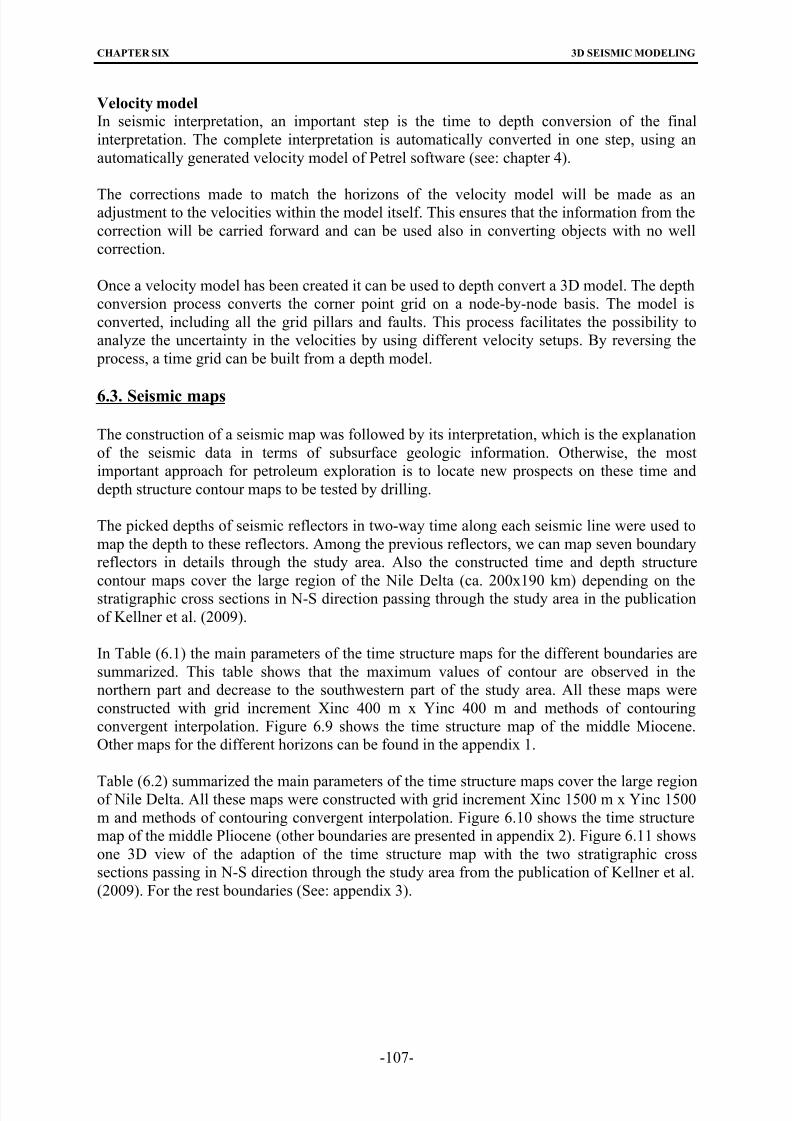
8/22/2019 barakat_moataz.pdf
http://slidepdf.com/reader/full/barakatmoatazpdf 121/158
CHAPTER SIX 3D SEISMIC MODELING
Velocity model In seismic interpretation, an important step is the time to depth conversion of the final
interpretation. The complete interpretation is automatically converted in one step, using an
automatically generated velocity model of Petrel software (see: chapter 4).
The corrections made to match the horizons of the velocity model will be made as anadjustment to the velocities within the model itself. This ensures that the information from the
correction will be carried forward and can be used also in converting objects with no well
correction.
Once a velocity model has been created it can be used to depth convert a 3D model. The depth
conversion process converts the corner point grid on a node-by-node basis. The model is
converted, including all the grid pillars and faults. This process facilitates the possibility to
analyze the uncertainty in the velocities by using different velocity setups. By reversing the
process, a time grid can be built from a depth model.
6.3. Seismic maps
The construction of a seismic map was followed by its interpretation, which is the explanation
of the seismic data in terms of subsurface geologic information. Otherwise, the most
important approach for petroleum exploration is to locate new prospects on these time and
depth structure contour maps to be tested by drilling.
The picked depths of seismic reflectors in two-way time along each seismic line were used to
map the depth to these reflectors. Among the previous reflectors, we can map seven boundary
reflectors in details through the study area. Also the constructed time and depth structure
contour maps cover the large region of the Nile Delta (ca. 200x190 km) depending on the
stratigraphic cross sections in N-S direction passing through the study area in the publication
of Kellner et al. (2009).
In Table (6.1) the main parameters of the time structure maps for the different boundaries are
summarized. This table shows that the maximum values of contour are observed in the
northern part and decrease to the southwestern part of the study area. All these maps were
constructed with grid increment Xinc 400 m x Yinc 400 m and methods of contouring
convergent interpolation. Figure 6.9 shows the time structure map of the middle Miocene.
Other maps for the different horizons can be found in the appendix 1.
Table (6.2) summarized the main parameters of the time structure maps cover the large regionof Nile Delta. All these maps were constructed with grid increment Xinc 1500 m x Yinc 1500
m and methods of contouring convergent interpolation. Figure 6.10 shows the time structure
map of the middle Pliocene (other boundaries are presented in appendix 2). Figure 6.11 shows
one 3D view of the adaption of the time structure map with the two stratigraphic cross
sections passing in N-S direction through the study area from the publication of Kellner et al.
(2009). For the rest boundaries (See: appendix 3).
-107-
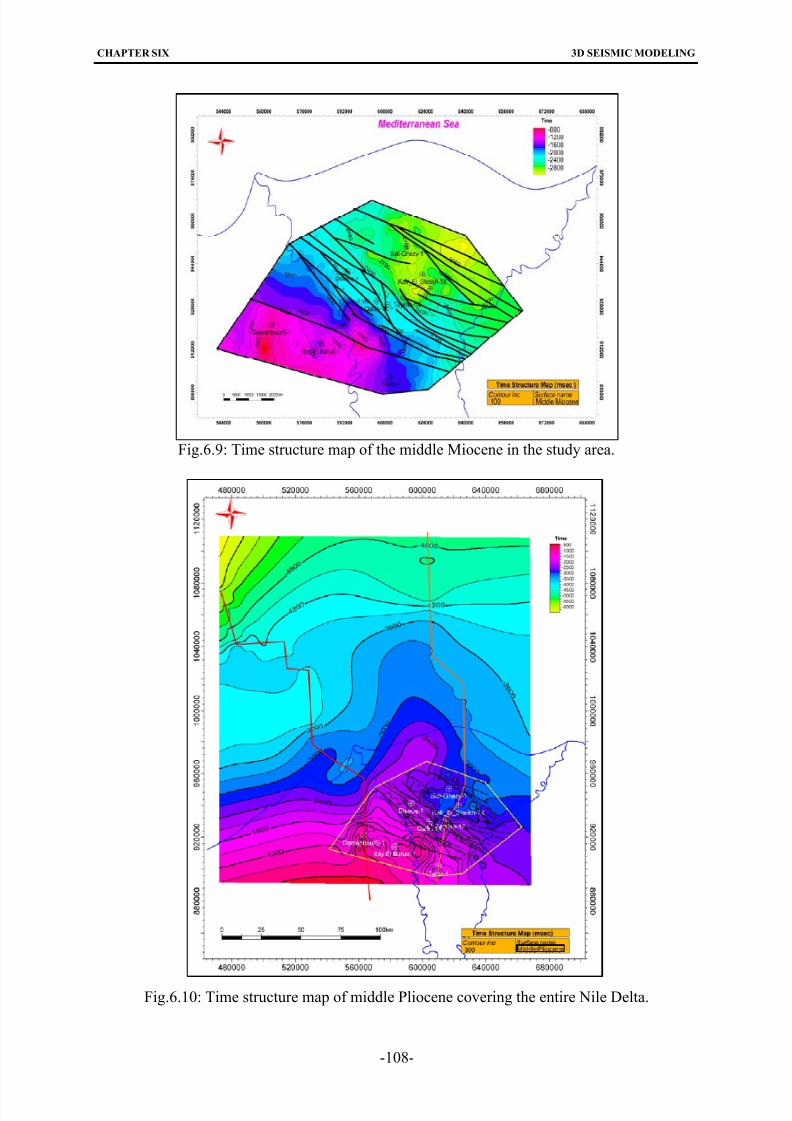
8/22/2019 barakat_moataz.pdf
http://slidepdf.com/reader/full/barakatmoatazpdf 122/158
CHAPTER SIX 3D SEISMIC MODELING
-108-
Fig.6.9: Time structure map of the middle Miocene in the study area.
Fig.6.10: Time structure map of middle Pliocene covering the entire Nile Delta.

8/22/2019 barakat_moataz.pdf
http://slidepdf.com/reader/full/barakatmoatazpdf 123/158
CHAPTER SIX 3D SEISMIC MODELING
Table 6.1: Main parameters of the time structure maps in the study area.
C o m m e n t s
t h e y o u n g e s t r e f l e c t o r n o t
a f f e c t e d
b y f a u l t s
t h e s e c o n d o l d e r b o u n d a r y i n t h e
s t u d y a r e a
t h e m a j o r u n c o n f o r m i t y
i n t h e
w e s t e r n p o r t i o n
u n c o n f o r m i t y
g r o w t h f a u l t s a n d s e c o n d a r y
a n t i t h e t i c
f a u l t s
l a r g e c h a n g e s i n t h e m a x i m
u m a n d
m i n i m u m v a l u e s d u e t o t h
e s l i d i n g
o f t h e s e d i m e n t a l o n g t h e s l o p e
n o r m a l f a u l t s s t a r t e d f r o m J u r a s s i c a n d
e x t e n d e d u n t i l E o c e n e t i m e s
C . I .
( m s e c ) 2
5 5 0
5 0
1 0 0
1 0 0
1 5 0
1 5 0
D e c r e a s e
d i r e c t i o n
s o u t h w e s t e r n
p o r t i o n
s o u t h w e s t e r n
p o r t i o n
s o u t h w e s t e r n
p o r t i o n
s o u t h w e s t e r n
p o r t i o n
s o u t h e r n
p o r t i o n
s o u t h w e s t e r n
p o r t i o n
s o u t h w e s t e r n
p o r t i o n
I n c r e a s e
d i r e c t i o
n
n o r t h e r n
p o r t i o n
n o r t h a n
d
n o r t h e a s t e r n
p o r t i o n s
n o r t h e r n
p o r t i o n
n o r t h e r n
p o r t i o n
n o r t h w e s t e r n
p o r t i o n
n o r t h e r n a n d
n o r t h e a s t e r n
p o r t i o n s
n o r t h e r n a n d
n o r t h e a s t e r n
p o r t i o n s
T i m e v a r i a t i o n
( m s e c )
- 3 9 2 . 5 3
t o
- 9 7 5 . 4 5
- 4 7 6 . 2 8
t o
- 1
8 1 7 . 7 7
- 1
0 6 6 . 8 0
t o
- 2
6 8 6 . 0 5
- 6 5 1 . 9 5
t o
- 3
1 5 1 . 0 1
- 1
4 6 6 . 1 6
t o
- 4
2 8 6 . 0 3
- 1
8 1 2 . 9 0
t o
- 5
1 0 0 . 4 3
- 2
6 9 2 . 8 9
t o
- 5
9 4 8 . 0 8
B o u
n d a r y n a m e
L a
t e P l i o c e n e
M i d
d l e P l i o c e n e
( P o s t - M e s s i n i a n )
L a
t e M i o c e n e
( p r e
- M e s s i n i a n )
M i d
d l e M i o c e n e
O
l i g o c e n e
C r e t a c
e o u s t o E o c e n e
J u r a s s i c
-109-

8/22/2019 barakat_moataz.pdf
http://slidepdf.com/reader/full/barakatmoatazpdf 124/158
CHAPTER SIX 3D SEISMIC MODELING
Table 6.2: Main parameters of time structure maps covering the entire Nile Delta.
C o m m e n t
t h e y o u n g e s t r e f l e
c t o r , n o t
a f f e c t e d b y f a
u l t s .
t h e m a j o r u n c o n f o r m i t y i n
t h e w e s t e r n p o
r t i o n
u n c o n f o r m i t y a n
d m a n y
g r o w t h f a u l t s , d u
e t o t h e
o v e r l o a d i n g o f s e
d i m e n t s
a n d t h e i r s l i d i n g a l o n g t h e
s l o p e
g r o w t h f a u l t s a n d s e c o n d a r y
a n t i t h e t i c f a u l t s
b i g c h a n g e s i n t h e
m a x i m u m a n d m
i n i m u m
v a l u e s d u e t o t h e s l i d i n g o f
t h e s e d i m e n t a l o n g t h e
s l o p e
n o r m a l f a u l t s s t a r t e d f r o m
J u r a s s i c a n d e x t e n d e d t o t h e
E o c e n e
C . I .
( m s e c )
2 0 0
3 0 0
3 0 0
4 0 0
4 0 0
5 0 0
D e c r e a s e
d i r e c t i o n
s o u t h w e s t e r n
p o r t i o n
s o u t h e r n p o r t i o n
s o u t h e r n p o r t i o n
s o u t h e r n p o r t i o n
s o u t h e r n p o r t i o n
s o u t h e r n p o r t i o n
I n c r e a s e
d i r e
c t i o n
n o r t h w
e s t e r n
p o r t i o n
n o r t h w
e s t e r n
p o r t i o n
n o r t h w
e s t e r n
p o r t i o n
n o r t h w
e s t e r n
p o r t i o n
n o r t h w
e s t e r n
p o r t i o n
n o r t h w
e s t e r n
p o r t i o n
T i m e v a r i a t i o n
( m s e c )
- 5 3 6 1 . 8 9 t o
- 1 1 4 . 0 5
- 1 0 6 6 . 8 0 t o
- 2 6 8 6 . 0 5
- 4 1 6 . 8 6 t o
- 6 4 6 9 . 0 0
- 5 8 7 . 9 6 t o
- 7 0 9 3 . 7 6
- 4 6 5 . 0 3 t o
- 8 0 3 1 . 8 6
- 8 7 1 5 . 4 6 t o
- 1 1 2 3 . 2 4
B o u n d a r y n a m e
P l i o c e n e
( p o s t - M e s s i n i a n )
L a t e M i o c e n e
( p r e - M e s s i n i a n )
M i d d l e M i o c e n e
O l i g o c e n e
E o c e n e /
C r e t a c e o u s
J u r a s s i c
-110-
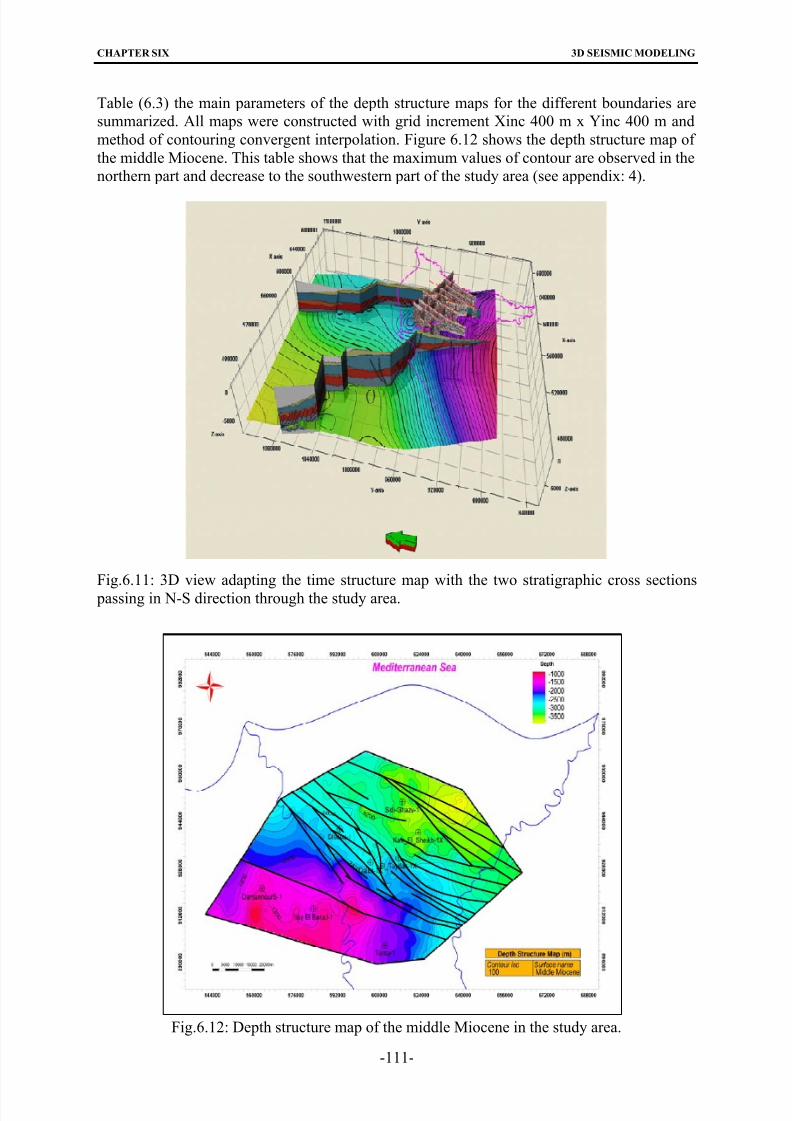
8/22/2019 barakat_moataz.pdf
http://slidepdf.com/reader/full/barakatmoatazpdf 125/158
CHAPTER SIX 3D SEISMIC MODELING
-111-
Table (6.3) the main parameters of the depth structure maps for the different boundaries are
summarized. All maps were constructed with grid increment Xinc 400 m x Yinc 400 m and
method of contouring convergent interpolation. Figure 6.12 shows the depth structure map of
the middle Miocene. This table shows that the maximum values of contour are observed in the
northern part and decrease to the southwestern part of the study area (see appendix: 4).
Fig.6.11: 3D view adapting the time structure map with the two stratigraphic cross sections
passing in N-S direction through the study area.
Fig.6.12: Depth structure map of the middle Miocene in the study area.

8/22/2019 barakat_moataz.pdf
http://slidepdf.com/reader/full/barakatmoatazpdf 126/158
CHAPTER SIX 3D SEISMIC MODELING
Table 6.3: The main parameters for all of the depth structure maps of this study.
C o m m e n t s
t h e y o u n g e s t r e f l e c t o r , n o t a f f e c t e d b y
f a u l t s .
t h e s e c o n d o l d e r b o u n d a r y i n
t h e s t u d y
a r e a .
t h e m a j o r u n c o n f o r m i t y i n t h
e w e s t e r n
p o r t i o n
u n c o n f o r m i t y
g r o w t h f a u l t s a n d s e c o n d a r y
a n t i t h e t i c
f a u l t s
b i g c h a n g e s i n t h e m a x . a n
d m i n .
v a l u e s d u e t o t h e s l i d i n g
o f t h e
s e d i m e n t a l o n g t h e s l o
p e
n o r m a l f a u l t i n g s t a r t e d f r o m
J u r a s s i c
a n d e x t e n d e d u n t i l t h e E o c e n e
C . I .
( m )
5 0
5 0
5 0
1 0 0
1 5 0
1 5 0
2 0 0
D e c r e a s e
d i r e c t i o n
s o u t h e r n w e s t
p o r t i o n
s o u t h e a s t e r n
p o r t i o n
s o u t h w e s t e r n
p o r t i o n
s o u t h w e s t e r n
p o r t i o n
s o u t h w e s t e r n
p o r t i o n
s o u t h w e s t e r n
p o r t i o n
s o u t h w e s t e r n
p o r t i o n
I n c r e a s e
d i r e c t i o n
n o r t h e r n
p o r t i o n
n o r t h e r n a n d
n o r t h e a s t e r n
p o r t i o n s
n o r t h e r n
p o r t i o n
n o r t h e a s t e r n
p o r t i o n
n o r t h e r n
p o r t i o n
n o r t h e r n
p o r t i o n
n o r t h e a s t e r n a n d
n o r t h w e s t e r n
p o r t i o n s
D e p t h v a
r i a t i o n
( m
)
- 2 6 3 . 6 3
t o - 1 2 7 7
. 8 1
- 4 0 9 . 3 5
t o -
1 5 1 6 . 1 7
- 1 0 6 6
. 8 0
t o - 2 6 8 6
. 0 5
- 5 5 6 . 9 5
t o - 3 5 8 3
. 6 5
- 1 5 5 2
. 8 5
t o - 4 6 9 7
. 2 1
- 2 0 5 7 . 0 1 t o
- 6 0 7 3
. 0 6
- 3 8 3 1
. 8 7
t o - 1 6 1 9 . 2 5
B o u n d a r y n a m e
L a t e P l i o c e n e
M i d d l e P l i o c e n e
( P o s t - M e s s i n i a n )
L a t e M i o c e n e
( p r e - M e s s i n i a n )
M i d d l e M i o c e n e
O l i g o c e n e
E
o c e n e / C r e t a c e o u s
J u r a s s i c
-112-
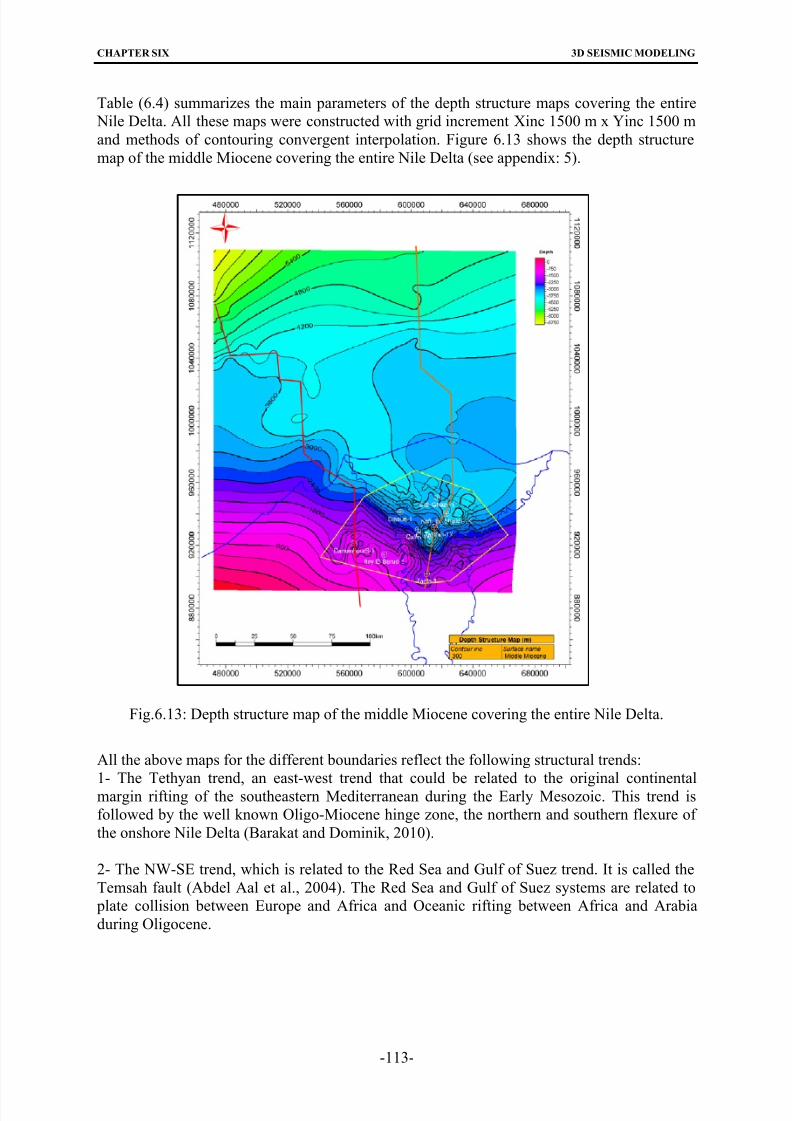
8/22/2019 barakat_moataz.pdf
http://slidepdf.com/reader/full/barakatmoatazpdf 127/158
CHAPTER SIX 3D SEISMIC MODELING
-113-
Table (6.4) summarizes the main parameters of the depth structure maps covering the entire
Nile Delta. All these maps were constructed with grid increment Xinc 1500 m x Yinc 1500 m
and methods of contouring convergent interpolation. Figure 6.13 shows the depth structure
map of the middle Miocene covering the entire Nile Delta (see appendix: 5).
Fig.6.13: Depth structure map of the middle Miocene covering the entire Nile Delta.
All the above maps for the different boundaries reflect the following structural trends:
1- The Tethyan trend, an east-west trend that could be related to the original continentalmargin rifting of the southeastern Mediterranean during the Early Mesozoic. This trend is
followed by the well known Oligo-Miocene hinge zone, the northern and southern flexure of
the onshore Nile Delta (Barakat and Dominik, 2010).
2- The NW-SE trend, which is related to the Red Sea and Gulf of Suez trend. It is called the
Temsah fault (Abdel Aal et al., 2004). The Red Sea and Gulf of Suez systems are related to
plate collision between Europe and Africa and Oceanic rifting between Africa and Arabia
during Oligocene.
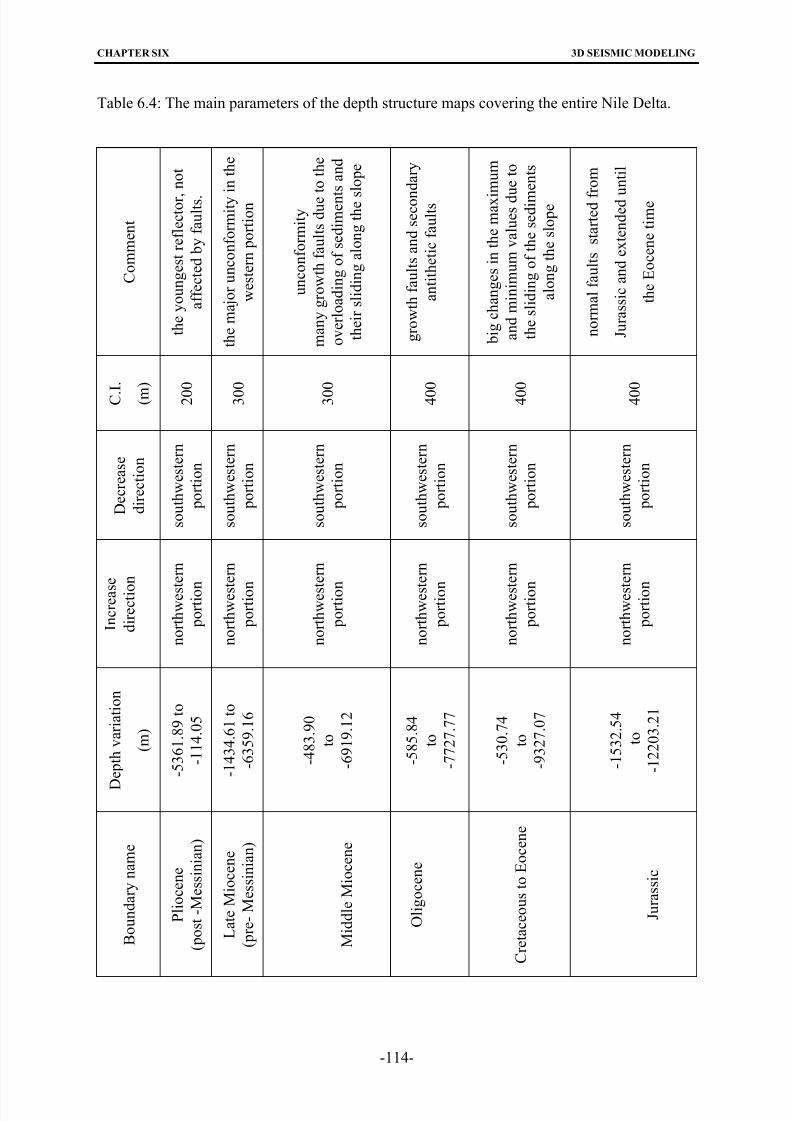
8/22/2019 barakat_moataz.pdf
http://slidepdf.com/reader/full/barakatmoatazpdf 128/158
CHAPTER SIX 3D SEISMIC MODELING
Table 6.4: The main parameters of the depth structure maps covering the entire Nile Delta.
C o m m e n t
t h e y o u n g e s t r e f l e c t o r ,
n o t
a f f e c t e d b y f a u l t s .
t h e m a j o r u n c o n f o r m i t y i n t h e
w e s t e r n p o r t i o n
u n c o n f o r m i t y
m a n y g r o w t h f a u l t s d u e t o t h e
o v e r l o a d i n g o f s e d i m e n t s a n d
t h e i r s l i d i n g a l o n g t h e s
l o p e
g r o w t h f a u l t s a n d s e c o n
d a r y
a n t i t h e t i c f a u l t s
b i g c h a n g e s i n t h e m a x i m u m
a n d m i n i m u m v a l u e s d u
e t o
t h e s l i d i n g o f t h e s e d i m
e n t s
a l o n g t h e s l o p e
n o r m a l f a u l t s s t a r t e d f r o m
J u r a s s i c a n d e x t e n d e d u
n t i l
t h e E o c e n e t i m e
C . I .
( m
)
2 0 0
3 0 0
3 0 0
4 0 0
4 0 0
4 0 0
D e c r e a s e
d i r e c t i o n
s o u t h w e s t e r n
p o r t i o n
s o u t h w e s t e r n
p o r t i o n
s o u t h w e s t e r n
p o r t i o n
s o u t h w e s t e r n
p o r t i o n
s o u t h w e s t e r n
p o r t i o n
s o u t h w e s t e r n
p o r t i o n
I n c r e a s e
d i r e c t i o
n
n o r t h w e s t e r n
p o r t i o n
n o r t h w e s t e r n
p o r t i o n
n o r t h w e s t e r n
p o r t i o n
n o r t h w e s t e r n
p o r t i o n
n o r t h w e s t e r n
p o r t i o n
n o r t h w e s t e r n
p o r t i o n
D
e p t h v a r i a t i o n
( m )
- 5 3 6 1 . 8 9 t o
- 1 1 4 . 0 5
- 1 4 3 4 . 6 1 t o
- 6 3 5 9 . 1 6
- 4 8 3 . 9 0
t o
- 6 9 1 9 . 1 2
- 5 8 5 . 8 4
t o
- 7 7 2 7 . 7 7
- 5 3 0 . 7 4
t o
- 9 3 2 7 . 0 7
- 1 5 3 2 . 5 4
t o
- 1 2 2 0 3 . 2 1
B o u n d a r y n a m e
P l i o c e n e
( p o s t - M e s s i n i a n )
L a t e M i o c e n e
( p r e - M e s s i n i a n )
M i d d l e M i o c e n e
O l i g o c e n e
C r e t a c e o u s t o E o c e n e
J u r a s s i c
-114-
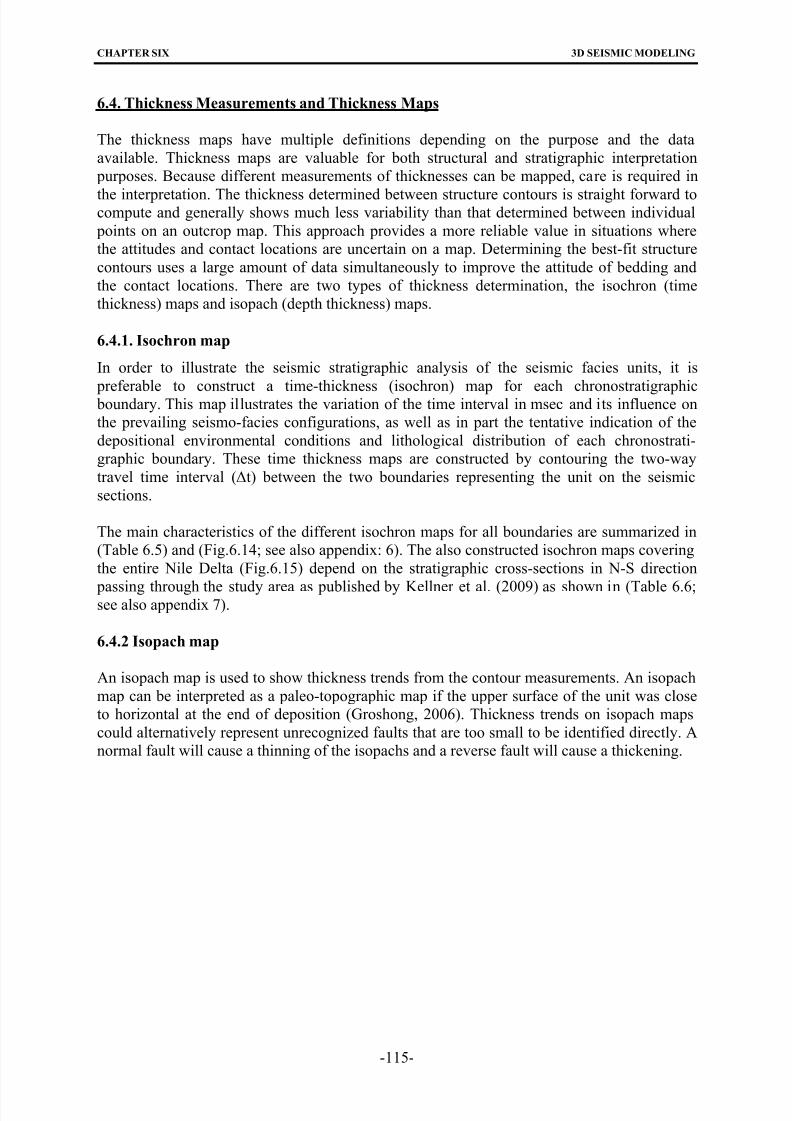
8/22/2019 barakat_moataz.pdf
http://slidepdf.com/reader/full/barakatmoatazpdf 129/158
CHAPTER SIX 3D SEISMIC MODELING
6.4. Thickness Measurements and Thickness Maps
The thickness maps have multiple definitions depending on the purpose and the data
available. Thickness maps are valuable for both structural and stratigraphic interpretation
purposes. Because different measurements of thicknesses can be mapped, care is required in
the interpretation. The thickness determined between structure contours is straight forward tocompute and generally shows much less variability than that determined between individual
points on an outcrop map. This approach provides a more reliable value in situations where
the attitudes and contact locations are uncertain on a map. Determining the best-fit structure
contours uses a large amount of data simultaneously to improve the attitude of bedding and
the contact locations. There are two types of thickness determination, the isochron (time
thickness) maps and isopach (depth thickness) maps.
6.4.1. Isochron map
In order to illustrate the seismic stratigraphic analysis of the seismic facies units, it is
preferable to construct a time-thickness (isochron) map for each chronostratigraphic boundary. This map illustrates the variation of the time interval in msec and its influence on
the prevailing seismo-facies configurations, as well as in part the tentative indication of the
depositional environmental conditions and lithological distribution of each chronostrati-
graphic boundary. These time thickness maps are constructed by contouring the two-way
travel time interval (Δt) between the two boundaries representing the unit on the seismic
sections.
The main characteristics of the different isochron maps for all boundaries are summarized in
(Table 6.5) and (Fig.6.14; see also appendix: 6). The also constructed isochron maps covering
the entire Nile Delta (Fig.6.15) depend on the stratigraphic cross-sections in N-S direction
passing through the study area as published by Kellner et al. (2009) as shown in (Table 6.6;see also appendix 7).
6.4.2 Isopach map
An isopach map is used to show thickness trends from the contour measurements. An isopach
map can be interpreted as a paleo-topographic map if the upper surface of the unit was close
to horizontal at the end of deposition (Groshong, 2006). Thickness trends on isopach maps
could alternatively represent unrecognized faults that are too small to be identified directly. A
normal fault will cause a thinning of the isopachs and a reverse fault will cause a thickening.
-115-
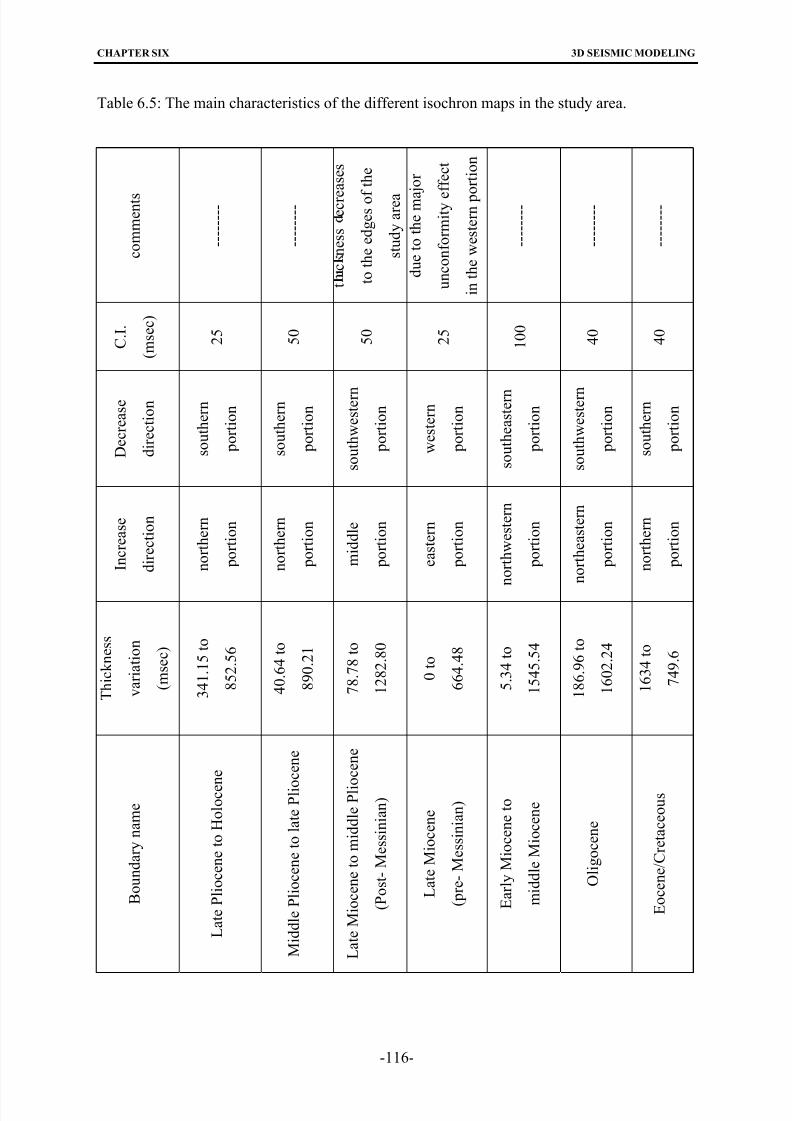
8/22/2019 barakat_moataz.pdf
http://slidepdf.com/reader/full/barakatmoatazpdf 130/158
CHAPTER SIX 3D SEISMIC MODELING
Table 6.5: The main characteristics of the different isochron maps in the study area.
c o m m e n t s
- - - - - - - -
- - - - - - - -
t c n e s s e c r e
a s e s
t o t h e e d g e s o f
t h e
s t u d y a r e a
d u e t o t h e m a j o r
u n c o n f o r m i t y e f f e c t
i n t h e w e s t e r n p o r t i o n
- - - - - - - -
- - - - - - - -
- - - - - - - -
C . I .
( m s e c )
2 5
5 0
5 0
2 5
1 0 0
4 0
4 0
D e c r e a s e
d i r e c t i o n
s o u t h e r n
p o r t i o n
s o u t h e r n
p o r t i o n
s o u t h w e s t e r n
p o r t i o n
w e s t e r n
p o r t i o n
s o u t h e a s t e r n
p o r t i o n
s o u t h w e s t e r n
p o r t i o n
s o u t h e r n
p o r t i o n
I n c r e a s e
d i r e c t i o n
n o r t h e r n
p o r t i o n
n o r t h e r n
p o r t i o n
m i d d l e
p o r t i o n
e a s t e r n
p o r t i o n
n o r t h w e s t e r n
p o r t i o n
n o r t h e a s t e r n
p o r t i o n
n o r t h e r n
p o r t i o n
T h i c k n e s s
v a r i a t i o n
( m s e c )
3 4 1 . 1 5 t o
8 5 2 . 5 6
4 0 . 6 4 t o
8 9 0 . 2 1
7 8 . 7 8 t o
1 2 8 2 . 8 0
0 t o
6 6 4 . 4 8
5 . 3 4 t o
1 5 4 5 . 5 4
1 8 6 . 9 6 t o
1 6 0 2 . 2 4
1 6 3 4 t o
7 4 9 . 6
B o u n d a r y n a m e
L a t e P l i o c e n e t o H o l o c e n
e
M i d d l e P l i o c e n e t o l a t e P l i o
c e n e
L a t e M i o c e n e t o m i d d l e P l i o
c e n e
( P o s t - M e s s i n i a n )
L a t e M i o c e n e
( p r e - M e s s i n i a n )
E a r l y M i o c e n e t o
m i d d l e M i o c e n e
O l i g o c e n e
E o c e n e / C r e t a c e o u s
-116-
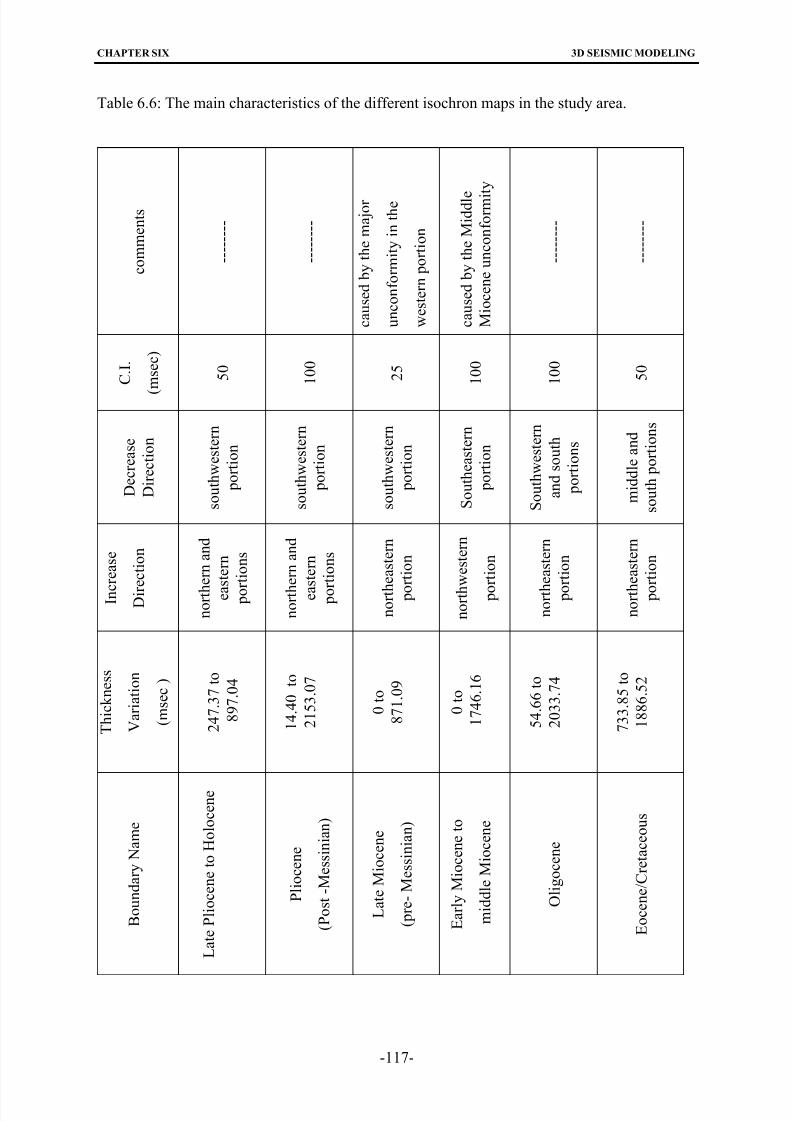
8/22/2019 barakat_moataz.pdf
http://slidepdf.com/reader/full/barakatmoatazpdf 131/158
CHAPTER SIX 3D SEISMIC MODELING
Table 6.6: The main characteristics of the different isochron maps in the study area.
c o m m e n t s
- - - - - - - -
- - - - - - - -
c a u s e d b y t h e m a j o r
u n c o n f o r m i t y i n t h e
w e s t e r n p o r t i o n
c a u s e d b y t h e M i d d l e
M i o c e n e u n c o n f o r m i t y
- - - - - - - -
- - - - - - - -
C . I .
( m s e c )
5 0
1 0 0
2 5
1 0 0
1 0 0
5 0
D e c r e a s e
D i r e c t i o n
s o u t h w e s t e r n
p o r t i o n
s o u t h w e s t e r n
p o r t i o n
s o u t h w e s t e r n
p o r t i o n
S o u t h e a s t e r n
p o r t i o n
S o u t h w e s t e r n
a n d s o u t h
p o r t i o n s
m i d d l e a n d
s o u t h p o r t i o n s
I n c
r e a s e
D i r e c t i o n
n o r t h e r n a n d
e a s t e r n
p o r
t i o n s
n o r t h e r n a n d
e a s t e r n
p o r
t i o n s
n o r t h
e a s t e r n
p o r t i o n
n o r t h w e s t e r n
p o r t i o n
n o r t h
e a s t e r n
p o r t i o n
n o r t h
e a s t e r n
p o r t i o n
T h i c k n e s s
V a r i a t i o n
( m s e c )
2 4 7 . 3 7 t o
8 9 7 . 0 4
1 4 . 4 0 t o
2 1 5 3 . 0 7
0 t o
8 7 1 . 0 9
0 t o
1 7 4 6 . 1 6
5 4 . 6 6 t o
2 0 3 3 . 7 4
7 3 3 . 8 5 t o
1 8 8 6 . 5 2
B o u n d a r y N a m e
L a t e P l i o c e n e t o H o l o c e n e
P l i o c e n e
( P o s t - M e s s i n i a n )
L a t e M i o c e n e
( p r e - M e s s i n i a n )
E a r l y M i o c e n e t o
m i d d l e M i o c e n e
O l i g o c e n e
E o c e n e / C r e t a c e o u s
-117-
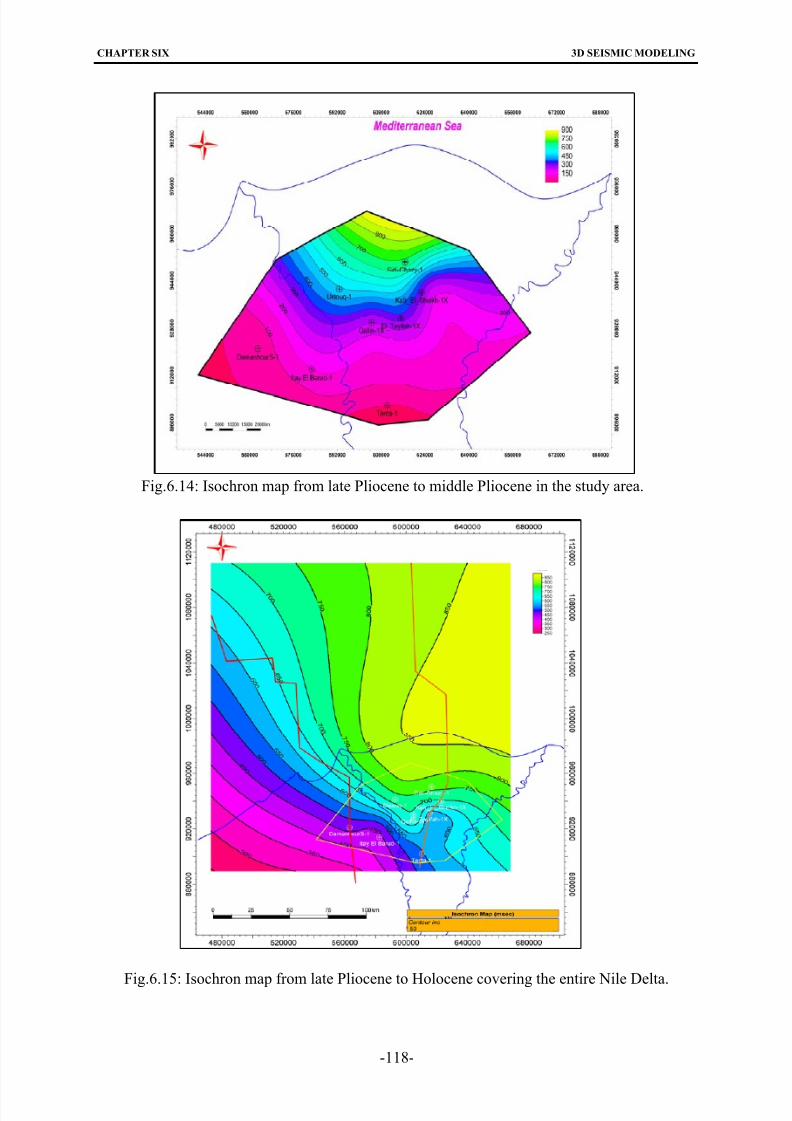
8/22/2019 barakat_moataz.pdf
http://slidepdf.com/reader/full/barakatmoatazpdf 132/158
CHAPTER SIX 3D SEISMIC MODELING
-118-
Fig.6.14: Isochron map from late Pliocene to middle Pliocene in the study area.
Fig.6.15: Isochron map from late Pliocene to Holocene covering the entire Nile Delta.
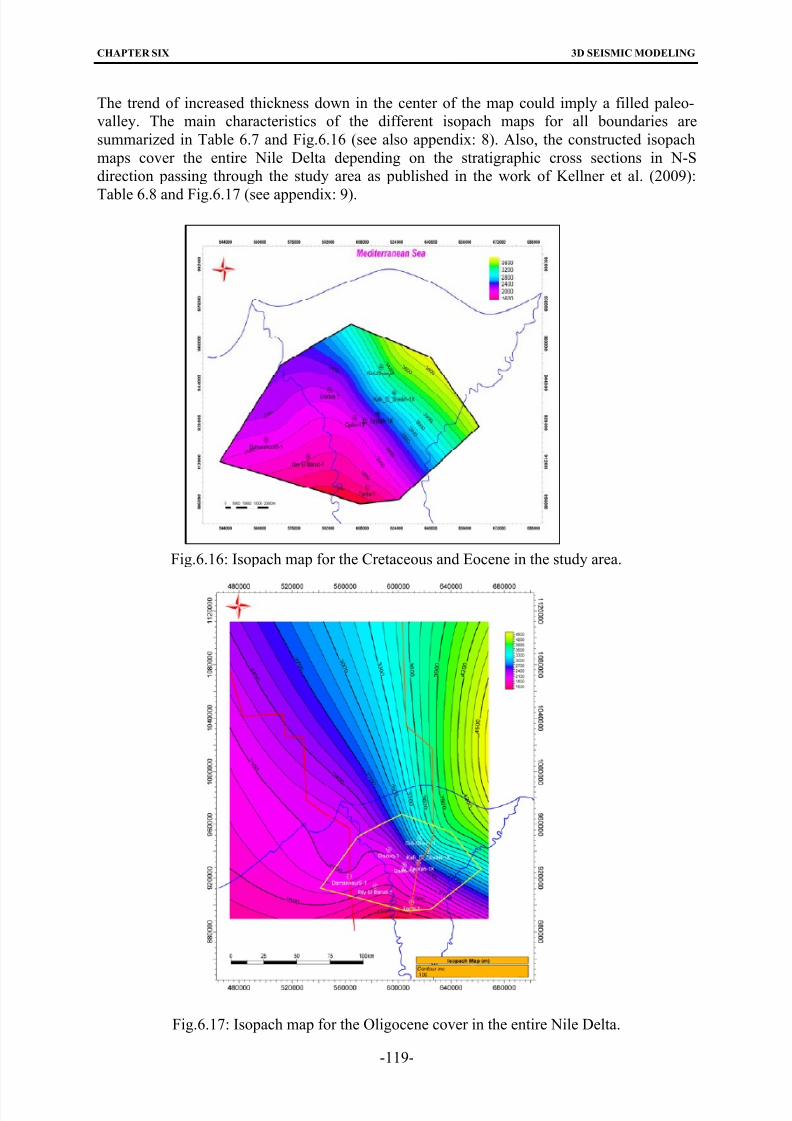
8/22/2019 barakat_moataz.pdf
http://slidepdf.com/reader/full/barakatmoatazpdf 133/158
CHAPTER SIX 3D SEISMIC MODELING
-119-
The trend of increased thickness down in the center of the map could imply a filled paleo-
valley. The main characteristics of the different isopach maps for all boundaries are
summarized in Table 6.7 and Fig.6.16 (see also appendix: 8). Also, the constructed isopach
maps cover the entire Nile Delta depending on the stratigraphic cross sections in N-S
direction passing through the study area as published in the work of Kellner et al. (2009):
Table 6.8 and Fig.6.17 (see appendix: 9).
Fig.6.16: Isopach map for the Cretaceous and Eocene in the study area.
Fig.6.17: Isopach map for the Oligocene cover in the entire Nile Delta.
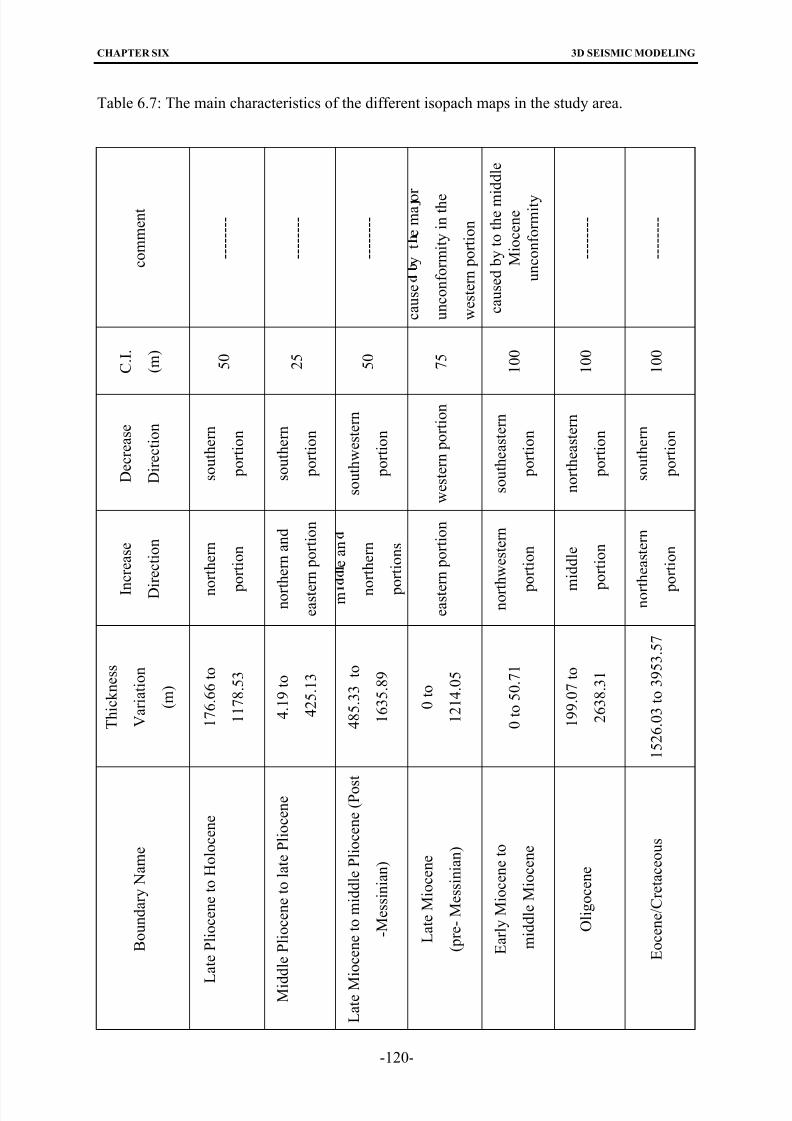
8/22/2019 barakat_moataz.pdf
http://slidepdf.com/reader/full/barakatmoatazpdf 134/158
CHAPTER SIX 3D SEISMIC MODELING
Table 6.7: The main characteristics of the different isopach maps in the study area.
c o m m e n t
- - - - - - - -
- - - - - - - -
- - - - - - - -
c a u s e y t e m a o r
u n c o n f o r m i t y i n t h e
w e s t e r n p o r t i o n
c a u s e d b y t o t h e m i d d l e
M i o c e n e
u n c o n f o r m i t y
- - - - - - - -
- - - - - - - -
C . I .
( m )
5 0
2 5
5 0
7 5
1 0 0
1 0 0
1 0 0
D e c r e a s e
D i r e c t i o n
s o u t h e r n
p o r t i o n
s o u t h e r n
p o r t i o n
s o u t h w e s t e r n
p o r t i o n
w e s t e r n p o r t i o n
s o u t h e a s t e r n
p o r t i o n
n o r t h e a s t e r n
p o r t i o n
s o u t h e r n
p o r t i o n
I n
c r e a s e
D i r e c t i o n
n o r t h e r n
p
o r t i o n
n o r t h e r n a n d
e a s t e r n p o r t i o n
m
e a n
n o r t h e r n
p o r t i o n s
e a s t e r n p o r t i o n
n o r t h w e s t e r n
p
o r t i o n
m
i d d l e
p
o r t i o n
n o r t h e a s t e r n
p
o r t i o n
T h i c k n e s s
V a r i a t i o n
( m )
1 7 6 . 6 6 t o
1 1 7 8 . 5 3
4 . 1 9 t o
4 2 5 . 1 3
4 8 5 . 3 3 t o
1 6 3 5 . 8 9
0 t o
1 2 1 4 . 0 5
0 t o 5 0 . 7 1
1 9 9 . 0 7 t o
2 6 3 8 . 3 1
1 5 2 6 . 0 3 t o 3 9 5 3 . 5 7
B o u n d a r y N a m e
L
a t e P l i o c e n e t o H o l o c e n e
M i d
d l e P l i o c e n e t o l a t e P l i o c e n e
L a t e M
i o c e n e t o m i d d l e P l i o c e n e ( P o s
t
- M e s s i n i a n )
L a t e M i o c e n e
( p r e - M e s s i n i a n )
E a r l y M i o c e n e t o
m i d d l e M i o c e n e
O l i g o c e n e
E o c e n e / C r e t a c e o u s
-120-
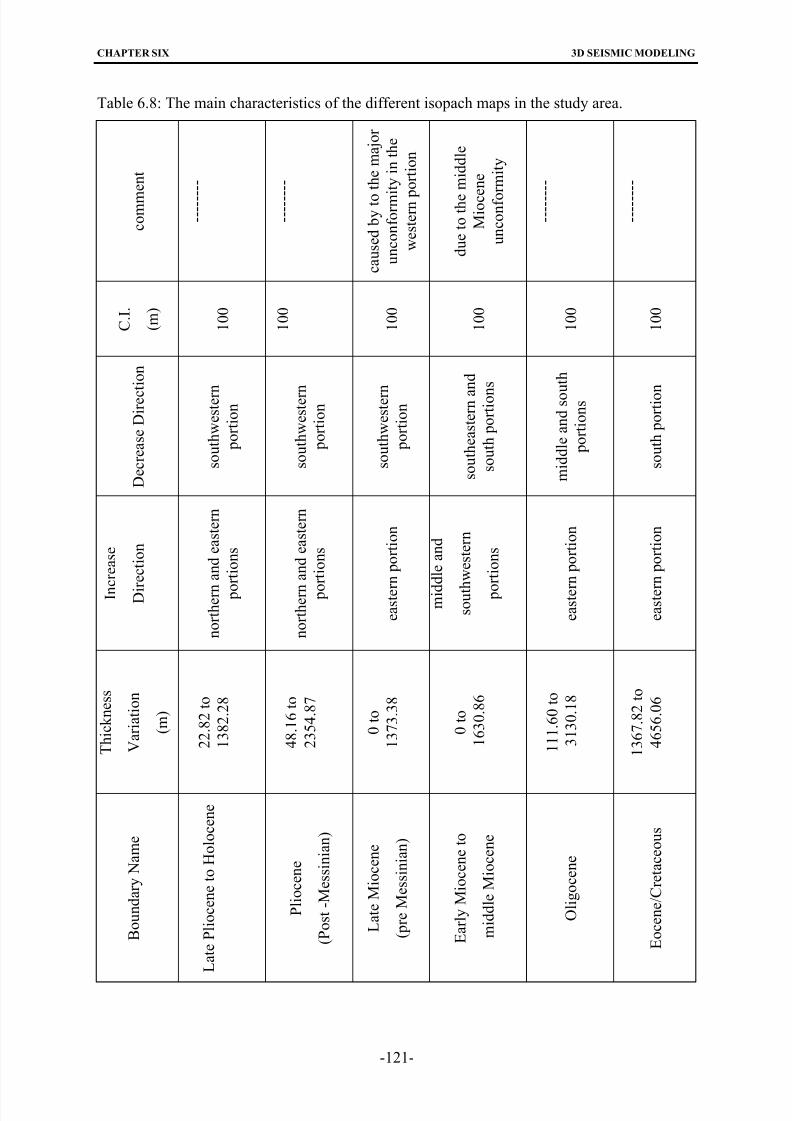
8/22/2019 barakat_moataz.pdf
http://slidepdf.com/reader/full/barakatmoatazpdf 135/158
CHAPTER SIX 3D SEISMIC MODELING
Table 6.8: The main characteristics of the different isopach maps in the study area.
c o m m
e n t
- - - - - -
- -
- - - - - -
- -
c a u s e d b y t o
t h e m a j o r
u n c o n f o r m i t y i n t h e
w e s t e r n p
o r t i o n
d u e t o t h e
m i d d l e
M i o c e
n e
u n c o n f o r m i t y
- - - - - -
- -
- - - - - -
- -
C . I .
( m )
1 0 0
1 0 0
1 0 0
1 0 0
1 0 0
1 0 0
D e c r e a s e D i r e c t i o n
s o u t h w e s t e r n
p o r t i o n
s o u t h w e s t e r n
p o r t i o n
s o u t h w e s t e r n
p o r t i o n
s o u t h e a s t e r n a n d
s o u t h p o r t i o n
s
m i d d l e a n d s o u
t h
p o r t i o n s
s o u t h p o r t i o n
I n c r e a s e
D i r e c t i o n
n o r t h e r n
a n d e a s t e r n
p o
r t i o n s
n o r t h e r n
a n d e a s t e r n
p o
r t i o n s
e a s t e r
n p o r t i o n
m i d
d l e a n d
s o u t h
w e s t e r n
p o
r t i o n s
e a s t e r
n p o r t i o n
e a s t e r
n p o r t i o n
T h i c k n e s s
V a r i a t i o n
( m )
2 2 . 8 2 t o
1 3 8 2 . 2 8
4 8 . 1 6 t o
2 3 5 4 . 8 7
0 t o
1 3 7 3 . 3 8
0 t o
1 6 3 0 . 8 6
1 1 1 . 6 0 t o
3 1 3 0 . 1 8
1 3 6 7 . 8 2 t o
4 6 5 6 . 0 6
B o u n d a r y N a m e
L a t e P l i o c e n e t o H o l o c e n e
P l i o c e n e
( P o s t - M e s s i n i a n )
L a t e M i o c e n e
( p r e M e s s i n i a n )
E a r l y M i o c e n e t o
m i d d l e M i o c e n e
O l i g o c e n e
E o c e n e / C r e t a c e o u s
-121-
8/22/2019 barakat_moataz.pdf
http://slidepdf.com/reader/full/barakatmoatazpdf 136/158
CHAPTER SIX 3D SEISMIC MODELING
6.4.3. Fence diagram
A fence diagram is a three-dimensional depiction of the study area, resembling an open area
surrounded by a ‘wall’ or ‘fence’, showing the locations and relationships of its sedimentary
deposits. The diagram is constructed from several stratigraphic sections drawn in positions
corresponding to their actual locations and their strata are joined. Fence diagrams are effectivein demonstrating changes in facies, pinchouts and truncations of units, unconformities, and
thickness relationships occurring in an area (Fig.6.18 A&B). Figure 6.18B demonstrates that
the thickness of sediments of Cretaceous and Jurassic age increase to the south and decrease
towards the north.
6.5. 3D Structural Model
As exploration concentrates along the seismic interpretation, the need develops for an analysis
which derives structure without relying on the seismic section as a photographic image. This
need is satisfied by the role of seismic modeling. In the last years, with the advent of powerful
computer workstations, the ability to perform interactive 3D modeling has become
commonplace through out the petroleum industry. This change in modeling capabilityrepresents a profound expansion of the modeler’s ability to comprehend the seismic response
to complex structure. The advantage of 3D modeling lies in its capability to allow the
interpreter to view and evaluate a structure model by displaying a cross-section along any line
of section and through any well control.
The 3D structure model of the study area had been done using Petrel software, which
represents a complex structural pattern. The faults play the major role in this model
(Fig.6.19). The structural elements can be summarized as follows:
1. Faults: The study area is affected with a major fault (hinge line), which represents
the boundary between a southern steady platform (South Delta block) and a
northern subsident basin. The Hinge line has played a dominant role in all the
stratigraphic and tectonic evolution of the study area. The configuration of the
studied area is controlled by NW-SE and E-W trends. Most of these faults are
dipping to the north and northeast.
2. Faulted Fold: Folding plays a minor role in the definition of the structural setting.
Rollover faulted anticlines developed above the curved listric faults.
6.6. Cross sections
Two cross-sections (A-B) and (C-D) were reconstructed in south-north direction of the modeland represent the main structure in the study area (Fig.6.20).
The first cross-section (A-B) was constructed in the south to north direction passing through
well Tanta-1(Fig.6.21).
The second cross-section (C-D) was constructed in the south to north direction passing
through wells Itay El Barud-1, Disouq-1 (Fig.6.22).
-122-
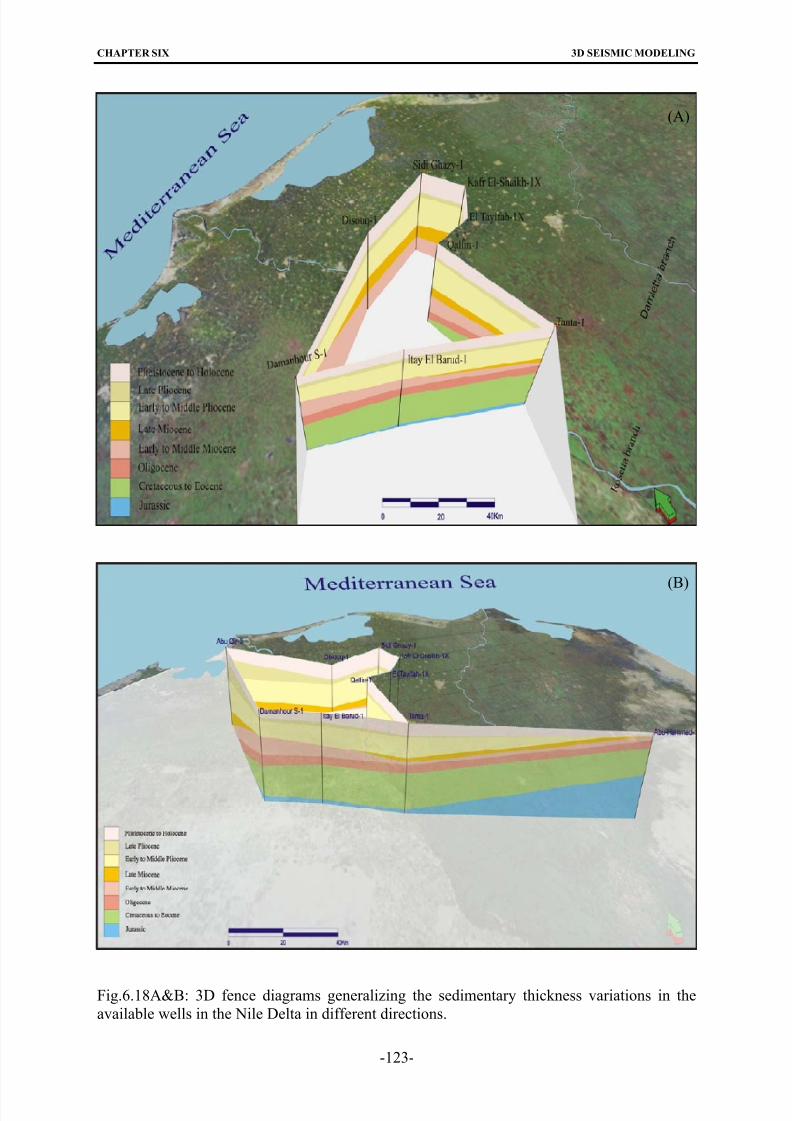
8/22/2019 barakat_moataz.pdf
http://slidepdf.com/reader/full/barakatmoatazpdf 137/158
CHAPTER SIX 3D SEISMIC MODELING
-123-
Fig.6.18A&B: 3D fence diagrams generalizing the sedimentary thickness variations in the
available wells in the Nile Delta in different directions.
(A)
(B)
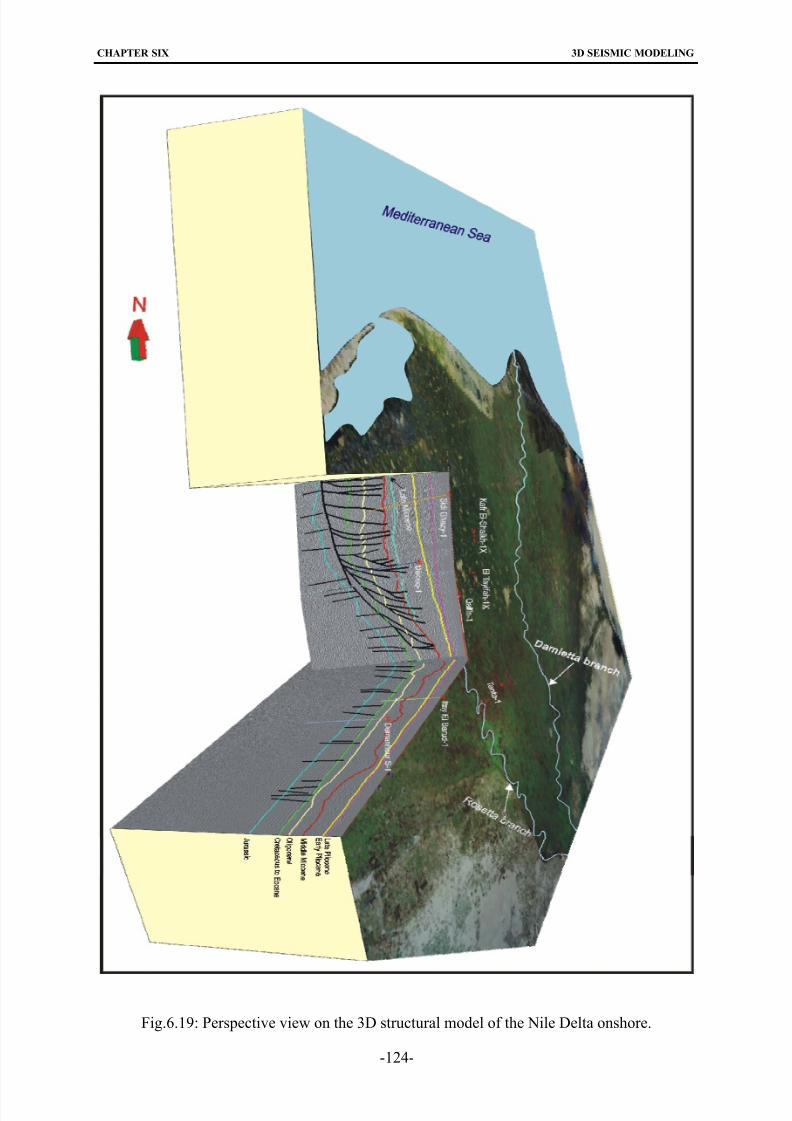
8/22/2019 barakat_moataz.pdf
http://slidepdf.com/reader/full/barakatmoatazpdf 138/158
CHAPTER SIX 3D SEISMIC MODELING
-124-
Fig.6.19: Perspective view on the 3D structural model of the Nile Delta onshore.
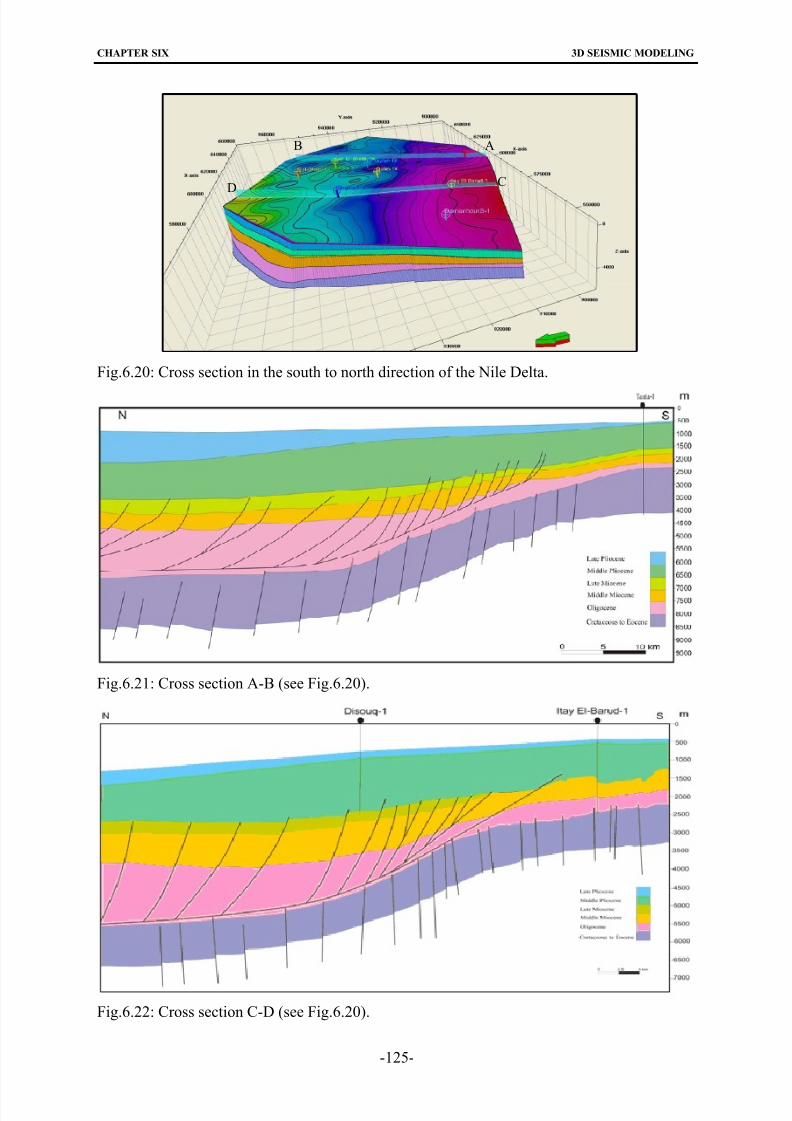
8/22/2019 barakat_moataz.pdf
http://slidepdf.com/reader/full/barakatmoatazpdf 139/158
CHAPTER SIX 3D SEISMIC MODELING
-125-
Fig.6.20: Cross section in the south to north direction of the Nile Delta.
Fig.6.21: Cross section A-B (see Fig.6.20).
Fig.6.22: Cross section C-D (see Fig.6.20).
AB
CD
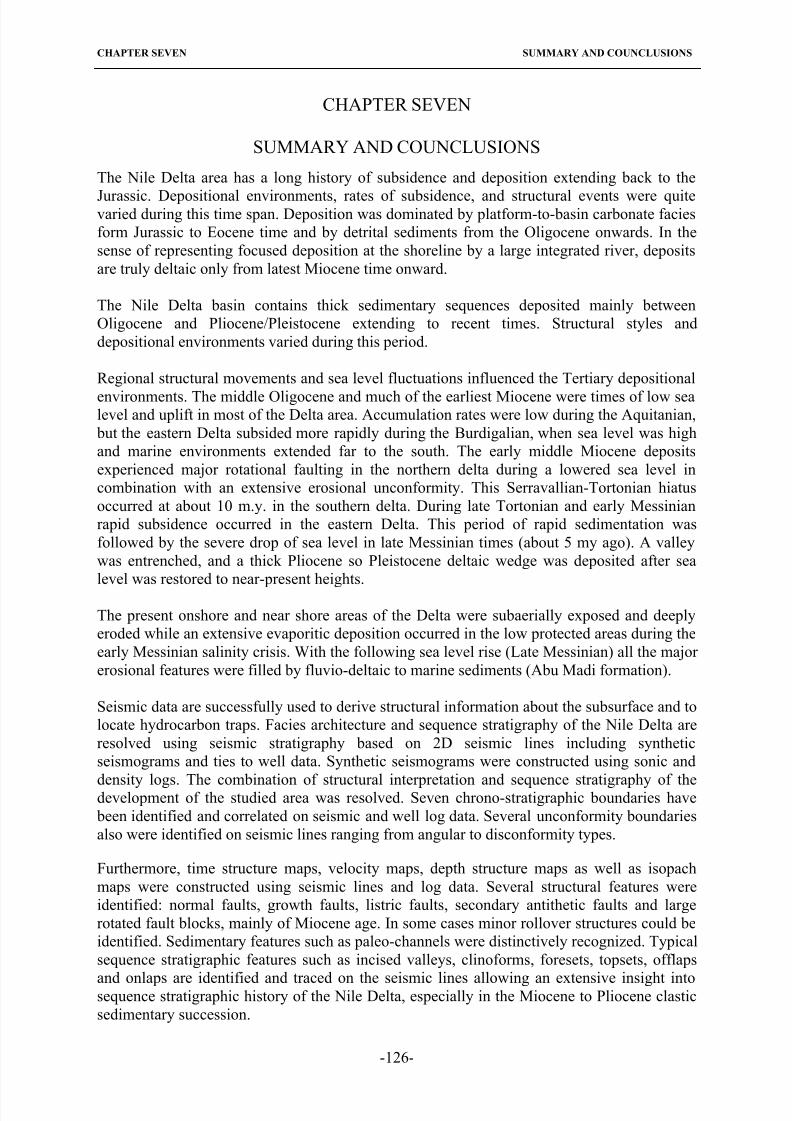
8/22/2019 barakat_moataz.pdf
http://slidepdf.com/reader/full/barakatmoatazpdf 140/158
CHAPTER SEVEN SUMMARY AND COUNCLUSIONS
CHAPTER SEVEN
SUMMARY AND COUNCLUSIONS
The Nile Delta area has a long history of subsidence and deposition extending back to the
Jurassic. Depositional environments, rates of subsidence, and structural events were quitevaried during this time span. Deposition was dominated by platform-to-basin carbonate facies
form Jurassic to Eocene time and by detrital sediments from the Oligocene onwards. In the
sense of representing focused deposition at the shoreline by a large integrated river, deposits
are truly deltaic only from latest Miocene time onward.
The Nile Delta basin contains thick sedimentary sequences deposited mainly between
Oligocene and Pliocene/Pleistocene extending to recent times. Structural styles and
depositional environments varied during this period.
Regional structural movements and sea level fluctuations influenced the Tertiary depositional
environments. The middle Oligocene and much of the earliest Miocene were times of low sealevel and uplift in most of the Delta area. Accumulation rates were low during the Aquitanian,
but the eastern Delta subsided more rapidly during the Burdigalian, when sea level was high
and marine environments extended far to the south. The early middle Miocene deposits
experienced major rotational faulting in the northern delta during a lowered sea level in
combination with an extensive erosional unconformity. This Serravallian-Tortonian hiatus
occurred at about 10 m.y. in the southern delta. During late Tortonian and early Messinian
rapid subsidence occurred in the eastern Delta. This period of rapid sedimentation was
followed by the severe drop of sea level in late Messinian times (about 5 my ago). A valley
was entrenched, and a thick Pliocene so Pleistocene deltaic wedge was deposited after sea
level was restored to near-present heights.
The present onshore and near shore areas of the Delta were subaerially exposed and deeply
eroded while an extensive evaporitic deposition occurred in the low protected areas during the
early Messinian salinity crisis. With the following sea level rise (Late Messinian) all the major
erosional features were filled by fluvio-deltaic to marine sediments (Abu Madi formation).
Seismic data are successfully used to derive structural information about the subsurface and to
locate hydrocarbon traps. Facies architecture and sequence stratigraphy of the Nile Delta are
resolved using seismic stratigraphy based on 2D seismic lines including synthetic
seismograms and ties to well data. Synthetic seismograms were constructed using sonic and
density logs. The combination of structural interpretation and sequence stratigraphy of thedevelopment of the studied area was resolved. Seven chrono-stratigraphic boundaries have
been identified and correlated on seismic and well log data. Several unconformity boundaries
also were identified on seismic lines ranging from angular to disconformity types.
Furthermore, time structure maps, velocity maps, depth structure maps as well as isopach
maps were constructed using seismic lines and log data. Several structural features were
identified: normal faults, growth faults, listric faults, secondary antithetic faults and large
rotated fault blocks, mainly of Miocene age. In some cases minor rollover structures could be
identified. Sedimentary features such as paleo-channels were distinctively recognized. Typical
sequence stratigraphic features such as incised valleys, clinoforms, foresets, topsets, offlaps
and onlaps are identified and traced on the seismic lines allowing an extensive insight intosequence stratigraphic history of the Nile Delta, especially in the Miocene to Pliocene clastic
sedimentary succession.
-126-
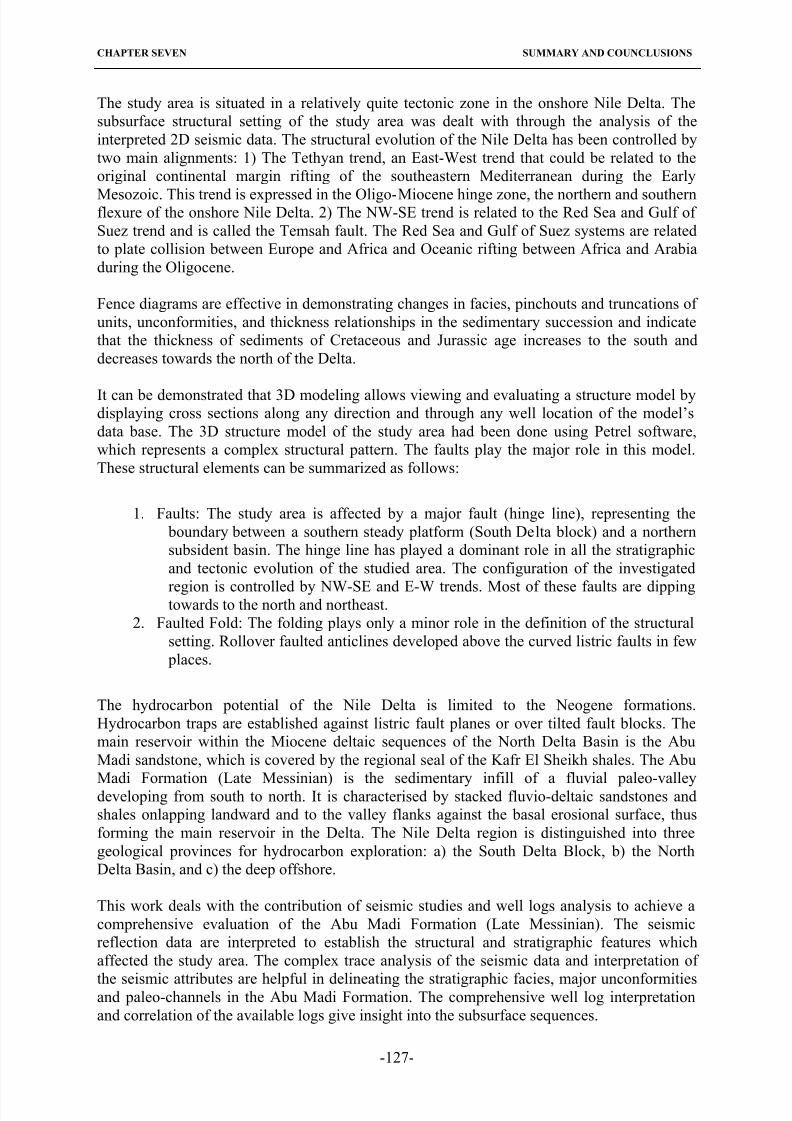
8/22/2019 barakat_moataz.pdf
http://slidepdf.com/reader/full/barakatmoatazpdf 141/158
CHAPTER SEVEN SUMMARY AND COUNCLUSIONS
-127-
The study area is situated in a relatively quite tectonic zone in the onshore Nile Delta. The
subsurface structural setting of the study area was dealt with through the analysis of the
interpreted 2D seismic data. The structural evolution of the Nile Delta has been controlled by
two main alignments: 1) The Tethyan trend, an East-West trend that could be related to the
original continental margin rifting of the southeastern Mediterranean during the Early
Mesozoic. This trend is expressed in the Oligo-Miocene hinge zone, the northern and southernflexure of the onshore Nile Delta. 2) The NW-SE trend is related to the Red Sea and Gulf of
Suez trend and is called the Temsah fault. The Red Sea and Gulf of Suez systems are related
to plate collision between Europe and Africa and Oceanic rifting between Africa and Arabia
during the Oligocene.
Fence diagrams are effective in demonstrating changes in facies, pinchouts and truncations of
units, unconformities, and thickness relationships in the sedimentary succession and indicate
that the thickness of sediments of Cretaceous and Jurassic age increases to the south and
decreases towards the north of the Delta.
It can be demonstrated that 3D modeling allows viewing and evaluating a structure model bydisplaying cross sections along any direction and through any well location of the model’s
data base. The 3D structure model of the study area had been done using Petrel software,
which represents a complex structural pattern. The faults play the major role in this model.
These structural elements can be summarized as follows:
1. Faults: The study area is affected by a major fault (hinge line), representing the
boundary between a southern steady platform (South Delta block) and a northern
subsident basin. The hinge line has played a dominant role in all the stratigraphic
and tectonic evolution of the studied area. The configuration of the investigated
region is controlled by NW-SE and E-W trends. Most of these faults are dippingtowards to the north and northeast.
2. Faulted Fold: The folding plays only a minor role in the definition of the structural
setting. Rollover faulted anticlines developed above the curved listric faults in few
places.
The hydrocarbon potential of the Nile Delta is limited to the Neogene formations.
Hydrocarbon traps are established against listric fault planes or over tilted fault blocks. The
main reservoir within the Miocene deltaic sequences of the North Delta Basin is the Abu
Madi sandstone, which is covered by the regional seal of the Kafr El Sheikh shales. The Abu
Madi Formation (Late Messinian) is the sedimentary infill of a fluvial paleo-valleydeveloping from south to north. It is characterised by stacked fluvio-deltaic sandstones and
shales onlapping landward and to the valley flanks against the basal erosional surface, thus
forming the main reservoir in the Delta. The Nile Delta region is distinguished into three
geological provinces for hydrocarbon exploration: a) the South Delta Block, b) the North
Delta Basin, and c) the deep offshore.
This work deals with the contribution of seismic studies and well logs analysis to achieve a
comprehensive evaluation of the Abu Madi Formation (Late Messinian). The seismic
reflection data are interpreted to establish the structural and stratigraphic features which
affected the study area. The complex trace analysis of the seismic data and interpretation of
the seismic attributes are helpful in delineating the stratigraphic facies, major unconformitiesand paleo-channels in the Abu Madi Formation. The comprehensive well log interpretation
and correlation of the available logs give insight into the subsurface sequences.
8/22/2019 barakat_moataz.pdf
http://slidepdf.com/reader/full/barakatmoatazpdf 142/158
REFERENCES
REFERENCES
Aal, A., El Barkooky, A., Gerrits, M., Meyer, H.J., Schwander, M. and Zaki, H. (2001): Tectonic evolution of
the Eastern Mediterranean Basin and its significance for the hydrocarbon prospectivity of the Nile delta deep-water area. – Geo Arabia 6: 363-384.
Abd El Aal, A., Aadland, A.J. and Hassan, N. (1990): The structural setting and hydrocarbon potential of theKattanya horst and El Gindi Basin, Western Desert, Egypt. - Paper presented at the 10
thExploration and
Production Conference, EGPC, Cairo, pp.23-50.
Abd El Aal, A., Day, R.A. and Lelek, J.J. (1992): Structural evolution and styles of the Northern Sinai, Egypt. -
Paper presented at the 7th
Exploration and Production Conference, EGPC, Cairo: pp. 546-562.
Abd El Aal, A., Roger, J., Price, Jon; Vaitl, D. and Shrallow Jeffery, A. (1994): Tectonic evaluation of the NileDelta, its impact on sedimentation and hydrocarbon potential.- Gulf of Suez Petroleum Company, 12 th Exploration and production Conference, EGPC, Cairo: 19-34.
Abdel Aziz, H. and Shann, M. (2005): Egypt: Gas discoveries since 2000-continued, consistent success. - The
Leading Edge (3): 242-244.
Abdel-Moati, M.A.R. and El-Sammak, A.A. (1997): Man-made impact on the geochemistry of the Nile deltalakes. - A study of metals concentrations in sediments. - In: Water, Air, and Soil Pollution 97: 413-429.Kluwer Acad. Publishers, Netherlands.
Abu El Ata A.A. (1988): The relation between the local tectonics of Egypt and plate tectonics of the surrounding
regions using geophysical and geological data. - 6th Ann. meet. EGS: 92-112.
Abu El Ella, R. (1990): The Neogene Quaternary section in the Nile Delta, Egypt: geology and hydrocarbon
potential. - Journ. Petr. Geol. 13: 329-340.
Abu El Naga, M. (1984): In Paleozoic and Mesozoic depocenters and hydrocarbon generating areas, northernWestern Desert. - Paper presented at the 7th Petroleum and Exploration Seminar, EGPC, Cairo: 269-287.
Abu Ollo, S. and El Kholy, H. (1992): In West Abu Qir discovery, its exploration, significance and case history.
- Paper presented at the 11th
Exploration and Production Conference, EGPC, Cairo. Vol. 2: 514-543.
Abu Shagar, S. (2002): Some facies parameters as guides for hydrocarbon exploration of some intervals,northern Nile Delta. - Egypt Jour. Appl. Geophys., 1: p.53.
Ahmed, A.M. (2002): Petrophysical characteristics and hydrocarbon potentialities of the subsurface Miocenereservoirs in the northeastern part of the Nile Delta-Egypt; using borehole geophysics. - M. Sc. Thesis
Mansoura Univ. Egypt: 176 pp.
Alsharhan, S., and Salah G. M. (1997): Lithostratigraphy, sedimentology and hydrocarbon habitat of the Pre-Cenomanian Nubian sandstone in the Gulf of Suez oil province, Egypt.- Geo Arabia 2 (4): 385- 400.
Anster, N.A. (1977): Seismic interpretation, the physical aspects. - Inter. Hum. Res. Dev. Conf., Boston, U.S.A.:237.
Awad, G.H. and Said, R. (1963): Egypt. - Lexique Stratigraphique International, Afrique, Vol. 4: 1-32, Paris
Azzam, S.S. (1994): An integrated seismo- facies and seismo- tectonic study of the Nile Delta of Egypt.utilizing common- depth point seismic reflection data. - Ph. D. Thesis, Ain Shams Univ: 240 pp.
Badely, M.E. (1985): Practical seismic interpretation. - Publication International human resources developmentcorporation Boston, VI: 266 pp.
Ball, J. (1952): Contribution to the geography of Egypt. - Egypt Survey Dept. (reprint): 308 pp.
Barakat, H. (1982): In Geochemical criteria for source rocks, Gulf of Suez. Paper presented at the 6th
ExplorationSeminar, EGPC, Cairo, pp.224-250.
-128-
8/22/2019 barakat_moataz.pdf
http://slidepdf.com/reader/full/barakatmoatazpdf 143/158
REFERENCES
Barakat, M. Kh. (2003): petrophysical and seismic studies on the Lower Miocene rocks in Abu Rudeis area, Gulf of Suez, Egypt. - M.Sc. Thesis, Tanta Univ., Egypt: 216 pp.
Barakat, M. Kh. and Dominik, W. R. (2010): Seismic Studies on the Messinian Rocks in the Onshore Nile Delta,Egypt.- 72
nd EAGE Conference and Exhibition, Barcelona, extended abstract: 5 pp., Spain.
Barber, P. M. (1981): Messinian subaerial erosion of the proto-Nile Delta. - Marine Geol 44: 253–272.
Barnard, P. (1992): Thermal maturity development and source rock occurrence in the Red Sea and Gulf of Aden.
- Rev. J. Petrol. Geol. 9: 474-485.
Barsoum, K.; Aiolfi, C.; Della, S. and Kamal, M. (1998): Evolution of hydrocarbon occurrence in the Plio –Pleistocene succession of the Egyptian Mediterranean margin: Examples from the Nile Delta basin. -Proceedings of the 14
thpetro. Conf.: 385 – 402
Bayoumi, A. I. and Lotfy, H. I. (1989): Modes of structural evolution of Abu Gharadig Basin, Western Desert of Egypt, as deduced from seismic data. – Jour. Afr. Earth Sci. 9: 273-287.
Bayoumi, T. (1996): The influence of interaction of depositional environment and syn-sedimentary tectonics on
the development of some Late Cretaceous source rocks, Abu Gharadig basin, Western Desert, Egypt. - Paper presented at the 13
thPetroleum Exploration and Production Conference, EGPC: 475-496, Cairo.
Bhattacharya, J. P., and Walker, R. G. (1992): Deltas. - In: Walker, R.G. and James, N.P. (Eds.): Facies Models:Response to Sea Level Change: 157–177, Geological Association of Canada.
Boote, D. R. D.; Clark Lowes, D. D.; and Traut, W. M. (1998): Palaeozoic petroleum systems of North Africa. –
In: Macgregor, S.D.; Moody, J.T.R. and Clark Lowes, D.D. (Eds.): Petroleum geology of North Africa(Special Publication No. 132: 7-68, Geological Society, London.
Buday, T. (1980): The regional geology of Iraq. - Vol.1: stratigraphy and palaeogeography: State Organisationfor Minerals Baghdad, Iraq. 445pp.
Clifford, A. C. (1986): African oil: past, present and future. – In: Halbouty, M.T. (Ed.): Future petroleum provinces of the world. AAPG Mem. 40: 339-372.
Coffeen, J. A. (1986): Seismic Exploration Fundamentals. – 360 pp. - Pennwell Books, Tulsa, Oklahoma.
Coleman, J. M. & Wright, L. D. (1975): Modern river deltas: variability of processes and sand bodies. – In:
Broussard, M.L., (Ed.): Deltas, models for exploration. - Houston Geological Society, p. 99-149, Houston.
Crans, W.; Mandl, G. and Haremboure, J. (1980): On the theory of growth faulting: a geomechanical model based on gravity sliding. – J. Petrol. Geol. 2 (3), 265–307.
Dalrymple, R. W.; Boyd, R., and Zaitlin, B. A. (1992): Estuarine facies models: Conceptual basis andstratigraphic implications. - J. Sediment. Petrol. 62: 1130–1146.
Deibis, S., (1982): Abu Qir Bay, a potential gas province area, offshore Mediterranean, Egypt. - Paper presentedat the 6
th Exploration Seminar, EGPC Cairo: pp.50-66.
Dix, C. H., (1939): Analysis of spectral characteristics of a thin-bedded Sequence, in seismic wave propagationin real media. - Consultants Bureau, New York and London, pp.68-86.
Dobrin, M. B. (1976): Introduction to geophysical prospecting. Mc- Graw-Hill Book Company, 3rd edition NewYork.630 pp.
Dolson, C. J.; Shaan, V. M.; Matbouly, S.; Harwood, C.; Rashed, R. and Hammouda, H. (2001): The petroleum potential of Egypt. – In: Downey, W.M.; Threet, C. J. and Morgan, A. W. (Eds.): Petroleum provinces of the
twenty-first century., Memoir No. 74, 453-482, American Association of Petroleum Geologists, Tulsa,
Oklahoma.
Egyptian General Petroleum Corporation (1992): Western Desert oil and gas fields, a comprehensive overview. -Paper presented at the 11th Petroleum Exploration and Production Conference, EGPC, Cairo. pp. 1-431.
-129-
8/22/2019 barakat_moataz.pdf
http://slidepdf.com/reader/full/barakatmoatazpdf 144/158
REFERENCES
Egyptian General Petroleum Corporation (1994): Nile Delta north Sinai fields, discoveries and hydrocarbon potentialities (as comprehensive overview). EGPC-Cairo, Egypt. 387 pp.
El-Ayouty, M. K. (1990): Petroleum geology. - In: Said, R. (Ed.): Geology of Egypt, A. A.Balkema/Rotterdam/Brookfield: 567-599.
El-Beialy, S. Y. (1990): Tertiary dinoflagellate cysts from the Mit Ghamr-1 well, Nile Delta, Egypt. – J. of Palaeobotany and Palynology. Volume No. 63, pp. 259-267.
El-Gamal, M. and El-Bosraty, M. (2008): The driving forces behind the tectonics and evolution of thesoutheastern Mediterranean, with the hydrocarbon systems relationship and future discoveries.- Mediterranean
Offshore Conf. Alexandria, Egypt. p. 69.
El-Gezeery, M. N.; Mohsen, S.M. and Farid, M. I. (1972): Sedimentary basins in Egypt and their Petroleum prospects. - 8th Arab Pet. Cong., Algiers, vol. 2, No. 83, pp. 1-13.
El-Heiny, I. and Enani, H., (1996): Regional stratigraphic interpretation pattern of Neogene sediments, Northern Nile Delta. - Egypt.13th Exploration and production conference, EGPC, Cairo, Egypt, pp.
El-Heiny, I., and Morsi, S. (1992): Stratigraphic correlation of Neogene sediments in the eastern Nile Delta andGulf of Suez, Egypt. - 11
thExploration International Conference, EGPC, Cairo, pp. 166-193.
El-Nady, M. M. and Hammad, M .M. (2000): Evaluation of Cretaceous hydrocarbon source rocks in Badr El Dinconcession, North Western Desert, Egypt. – J. Environment. Sci. 20: 25-51.
El-Shafei, I. (2004): Geophysical Studies and GIS Application on Abu Madi gas field, Nile Delta, Egypt. - M.Sc.
Thesis, Geology Department, Faculty of Science, Helwan University, Egypt, 162 pp
El-Sisi, Z.; Lobna, S. H.; Yehia, D. and Al Moatez, B. (1997): Source of clastic supply to the Sidi Salem andAbu Madi reservoir of the Nile Delta a provenance study. - Exploration and production Conf., EGPC, Cairo, pp.291-296.
El-Mahmoudi, A. and Gabr, A. (2008): Geophysical surveys to investigate the relation between the Quaternary Nile channels and the Messinian Nile canyon at East Nile Delta, Egypt. – Arab. J. Geo. sci. 2: 53-67.
Elliott, T. (1986): Deltas: Reading, H. G. (Ed.): Sedimentary environments and facies. - Blackwell ScientificPublications, Oxford, U.K.: 113–154.
Emery, D. and Myers, K. J. (1996): Sequence Stratigraphy. - Blackwell Scientific, 297 pp.
Ewing, T. E. (2001): Synthetic seismograms: Preparation, calibration, and associated issues. - Articles fromGeophysical Corner (GC) in AAPG Explorer, pp. 2017–2043
Fitch, F. J.; Heard, J. L. and Miller, J. A. (1988): Basaltic magmatism of Late Cretaceous and Palaeogene agerecorded in wells NNE of the Shetlands. - In: Morton, A. C., and Parson, L. M., (eds.): Early Tertiary
volcanism and opening of the NE Atlantic: 253 – 262. Geological Society of London, Special Publication 39.
Galloway, W. E. (1975): Process framework for describing the morphologic and stratigraphic evolution of deltaic depositional systems. – In: Broussard, M.L. (Ed.): Deltas, models for exploration. - Houston GeologicalSociety: 87–98, Houston, Texas.
Ganz, H. H.; Luger, P.; Schrank, E.; Brooks, P. and Fowler, M. (1990): Facies evolution of Late Cretaceous
black shales from SE Egypt. - In Huc, A.Y., (Ed.): Deposition of organic facies. - Studies in Geology 30: 217-229, AAPG, Tulsa, Oklahoma.
Garotta, R. (1991): Selection of seismic Picking based upon the dip move out and amplitude of each event.-Geophysical Prosp. 19: 357- 370.
Geologic Research and Mining Dept. (1963): Aeromagnetic map of the Nile Delta. Egypt. AAPG Bulletin63:967-974.
-130-
8/22/2019 barakat_moataz.pdf
http://slidepdf.com/reader/full/barakatmoatazpdf 145/158
REFERENCES
Ghanem, M. F. (1985): Subsurface geology of the Cretaceous sediments in the north Western Desert of Egyptand its hydrocarbon potentialities.- 131pp., Geology Department, Cairo University, Cairo.
Ghonemi, A. A. (1990): Using the seismic reflection technique in delineation the structural and stratigraphicsetup of the Eastern offshore of the Nile Delta, Egypt. - Ph.D. Thesis, 170 pp., Geology Department, Faculty of Science, Zagazig University, Egypt.
Ginsburg, A., and Gwirtzman, G., (1979): Changes in the crust and the sedimentary cover across the transitionfrom the Arabian platform to the Mediterranean basin. - Sed. Geol. 23: 19-36.
Groshong, H. R. (2006): 3D Structural Geology, a Practical Guide to Quantitative Surface and Subsurface Map
Interpretation.-386 pp., 2nd
Edition. Springer-Verlag Berlin Heidelberg. the Netherlands.
Hamza W (2001): Mediterranean Forecasting System Pilot Project UALEX-FS-DES, final scientific report.MFSPP-ISAO-CRN-EU. Project. 172 pp.
Haq, B. U.; Hardenbol, J. and Vail, P. R. (1987): Chronology of fluctuating sea levels since the Triassic. -
Science 235: 1156-1166.
Harms, J. and Wray, J. (1990): Nile Delta – In: R. Said, (Ed.): Geology of Egypt., 329-343, A. A.Balkema/Rotterdam/Brookfield.
Hsu, K. J.; Montadert, L.; Bernoulli, D.; Cita, M. B.; Erickson, A.; Garrison, R. E.; Kidd, R.; Melieres, F.;Muller, C. and Wright, R. (1978): In History of the Messinain salinity crisis. - In: Hsu, K. J. and Montadert, L.(Eds.): Initial Reports of the Deep Sea Drilling project, US Government Printing Office: 1053-1078.
International Egyptian Oil Company (1967): Rock stratigraphy of the Miocene in the Nile Delta, Egypt. –Egyptian J. Geol., No.18: pp.12-15.
International Egyptian Oil Company (1969): Rock stratigraphy of the Miocene (and possible Miocene) in the Nile Delta, Egypt. - J. Geol., 20: pp.18-25.
Issawi, B.; El Hinnawi M.; Francis, M., and Mazhar, A. (1999): The Phanerozoic geology of Egypt. Ageodynamic Approach - Egypt Geol. Surv. Special Publication76: 461 pp.
Kamel, H.; Eita, T. and Sarhan, M. (1998): Nile Delta hydrocarbon potentialities. - 14th
Exploration and production Conf., EGPC, Cairo, pp. 485-503.
Keeley, L. M. and Massoud, S. M. (1998): Tectonic controls on the petroleum geology of NE Africa. – In:Macgregor, S. D.; Moody, J. T. R. and Clark Lowes, D. D., (Eds.): Petroleum geology of North Africa. SpecialPublication 132: Geological Society, London. pp. 265-281.
Keheila, E. and Riad, S. (1988): Tectonic events and evolution of the Miocene sedimentary basins in the NileDelta area. Egypt. , 4
thExploration and production conference, EGPC, Cairo, Egypt, p.337.
Kellner, A.; El Khawaga, H.; Brink, G.; Brink-Larsen, S.; Maksoud Hesham, M.; Abu El Saad, H.; Atef, A.;Young, H. and Finlayson, B. (2009): Depositional History of the West Nile Delta-Upper Oligocene to Upper Pliocene. - AAPG International Conference and Exhibition, Cape Town, South Africa, pp.1-25
Kerdany, M. T. and Cherif, O. H. (1990): Mesozoic. - In Said, R. (Ed.). Geology of Egypt, A. A. Balkema/Rotterdam / Brookfield, pp. 407 - 450.
Kholeif, W.; Work, J G. and Sanad, S. (1986): Meleiha Its accumulations of the Early Cretaceous Alameinhistory and its significance.- Paper presented at the 8th Exploration Seminar, Egyptian General PetroleumCorporation, Cairo. pp. 17-34.
Klitzsch, E. (1986): Plate tectonics and cratonal geology in north-eastern Africa (Egypt, Sudan). - Geol. Rdsch,75: 755-768.
Kora, M. (1980): Geology of Tertiary-Quaternary subsurface sedimentary succession, West Nile Delta area. M.Sc. Thesis Mansoura Univ. Egypt. 114 pp.
-131-
8/22/2019 barakat_moataz.pdf
http://slidepdf.com/reader/full/barakatmoatazpdf 146/158
REFERENCES
Kostandi, A. B. (1959): Facies maps for the study of the Palaeozoic and Mesozoic sedimentary basins in theEgypt region.-1st Arab Pet. Cong., Egypt, p. 12.
Krebs, W. N.; Wescott, A. W.; Nummedahl, D.; Gaafar, I.; Azazi, G. and Karamat, A. S. (1996): Graphiccorrelation and sequence stratigraphy of Neogene rocks in the Gulf of Suez. – In: Youssef, M.I., (Ed.),Proceedings of the 13th Petroleum Conference: 214-226, EGPC, Cairo.
Le Pichon, X. and Cochran, J. R. (1988): The Gulf of Suez and Red Sea rifting. - Tectonophysics 153: 1-4.
Lindsey, J. P. and Macurda, J. D. (1983): Applied Seismic stratigraphy Interpretation. - Geo-Quest InternationalInc. Houston, Texas.
Loncke, L.; Gaullier, G.; Bellaiche, G. and Mascle, J. (2002): Recent depositional patterns of the Nile deep-seafan from echo-character mapping. AAPG Bull. 86: 1165-1186.
Lüning, S.; Kolonic, S.; Belhadj, M. E.; Belhadj, Z.; Cota, L.; Baric, G., and Wagner, T. (2004): Integrateddepostional model for the Cenomanian –Turonian organic-rich strata in North Africa. - Earth Science Reviews
64: 51-117.
Macgregor, S. D. and Moody, J. T. R. (1998): Mesozoic and Cenozoic petroleum system of North Africa. – In:Macgregor, S. D.; Moody, J. T. R. and Clark Lowes, D. D. (Eds.): Petroleum geology of North Africa.Geological Society Special Publication 132: 201-216, London.
Magoon, L. B. and Dow, W. G. (1994): The Petroleum System - From Source to Trap. - AAPG Mem 60: 655 p.
Masson, D. G.; Huggett, Q. J. and Brunsden, D. (1993): The surface texture of the Saharan debris flow depositsand some speculations on submarine debris flow processes. Sedimentology 40 pp.583-598
May, P. R. (1991): The eastern Mediterranean Mesozoic basin evolution and oil habitat – AAPG Bull 75: 1215-
1232
Meshref, W. M. (1990): Tectonic framework of Egypt. – In: Said, R. (Ed): The Geology of Egypt, A. A.
Balkema /Rotterdam / Brookfield: 113-156.
Misdorp, R. and Sestini, G. (1976): Topography of the continental shelf of the Nile Delta. - Proceedings of the
Seminar on Nile Delta Sedimentology. UNESCO, Alexandria, pp. 145-161.
Mitchum, R, M.; Vail, P. R. and Sangree, J. B. (1977): Stratigraphic interpretation of seismic reflection patternsin depositional sequences. - In: Pyton, C. E. (Ed.) Seismic Stratigraphic application to hydrocarbonexploration. AAPG Mem. 26: 117-143.
Morgan, P.; Boulos, K. and Sanberg, C. A. (1983): Regional geothermal exploration in Egypt. - Review EAGE31, 361-376.
Mostafa, A. R.; Klitzsch, E. and Matheis, G. (1993): Origin and evaluation of hydrocarbons in the Gulf of Suez
basin. – In: Thorweihe, U. and Schandelmaier, H. (Eds.): Geoscientific research in the Northeast Africa: 267-275, Balkema, Rotterdam.
Moussa, H. (1986): Evolution of the sedimentary basins of the northern Western, Egypt. - Paper presented at the
8th Exploration and Production Conference, EGPC, Cairo: 66-84.
Nashaat, M. (1988): Geodynamic aspects of western side of Nile Delta, on and offshore. - 9th
Exploration and production Conference, EGPC, Cairo: 1- 18.
Omran, M. A. (2001): Crustal modeling of the continental Margin of the central Nile Delta region. - Annals of
the Geological Survey of Egypt xxiii: 381 – 387.
Omran, M. A. (2004): The deformation of the post-Messinian deposition on the Mediterranean Egyptian margin,Analytical study from seismic data. - 3rd International Symposium on Geophysics, Tanta Univ.: 7- 24.
-132-
8/22/2019 barakat_moataz.pdf
http://slidepdf.com/reader/full/barakatmoatazpdf 147/158
REFERENCES
Omran, M. A. and Fathy, H. (1996): Seismic Stratigraphy of the Nile Cone sediments.- Journal of King Abed El-Aziz University, Earth Science 9: 87 - 112.
Orton, G., and Reading, H. G. (1993): Variability of deltaic processes in terms of sediment supply, with particular emphasis on grain size. Sedimentology 40: 475–512.
Ouda, K. H. and Obaidalla, N. (1995): The geologic evolution of the Nile Delta area during the Oligocene-Miocene of Egypt. - J. Geol. 93: 77-111.
Peter, M. D. (1993): Basic Seismic Processing. – In: Morton, T. and Woods, A. M. (Eds.): DevelopmentGeology Reference Manual. - Am. Assoc. Petrol. Geol., Tulsa, U.S.A.: 364-371.
Posamentier, W. and Walker, R. G. (2006): Facies models revisited. - SEPM Special Publication 84 Tulsa,Oklahoma, U.S.A, 532 pp.
Reading, H. G. (1986): Sedimentary environments and facies. - 615 pp. Blackwell Scientific Publications,Oxford, U.K.
Reading H. G. and Collinson, J. D. (1996): Clastic Coasts. In: Reading, H. G. (Ed): Sedimentary Environments;
Processes, Facies and Stratigraphy, 3rd
Edition: 154–231, Oxford, U.K., Blackwell Science.
Rizzini, A.; Vezzani, F.; Cococcetta, V. and Milad, G. (1978): Stratigraphy and sedimentation of Neogene-Qaternary section in the Nile Delta area. - Marine Geology 27: 327-348.
Ross, D. A. and Uchupi, E. (1977): The structure and sedimentary of the southeastern Mediterranean Sea. –AAPG (Mem.?) 16: 872-709.
Said, R. (1962): The Geology of Egypt - 377 pp., Elsevier, New York
Said, R. (1981): The geological Evolution of the River Nile -Springer, 151pp.Texas, USA
Said, R. (1990): The Geology of Egypt - 734 pp. A. Balkema Publishers, USA
Salah, G. M. and Alsharhan, A. S. (1996): Structural influence on hydrocarbon entrapment in the north-westernRed Sea, Egypt.-AAPG Bull 80: 101-118.
Salem, A. M.; Ketzer, J. M.; Morad, S.; Rizk, R.R. and Al-Aasm, I. S. (2005): Diagenesis and reservoir-qualityevolution of incised valley sandstones: evidence from the Abu Madi gas reservoirs (Upper Miocene), the Nile
Delta Basin, Egypt.- J. Sed. Res. 75: 572-584.
Salem. M. (1976): Evolution of the Eocene-Miocene sedimentation pattern in northern Egypt. - AAPG-Bull. 60:34-64.
Sangree, J. B. and Widmier, J. M. (1977): Seismic interpretation of clastic depositional facies. - AAPG. Mem.26: 165 - 184.
Sangree, J. B.; Vail, P. R., and Mitchum, R. M. (1987): Summary of exploration applications of sequencestratigraphy. - In: Sequence stratigraphy as an exploration tool: Concepts and practices from the Gulf Coast. -In: Armentrout, J. M. and Perkins, B. F. (Eds.) - Eleventh Annual research conference Gulf Coast section.Society of Economic Paleontologists and Mineralogists: 321-327.
Sarhan, M.; Barsoum, K.; Betrello, F.; Talaat, M. and Nobili, M. (1996): The Pliocene play in the Mediterranean
offshore. Structural setting and growth faults controlled hydrocarbon accumulations in the Nile Delta Basin-Acomparison with the Niger Delta basin. - Petrobel Company, Cairo, Egypt: 121-139.
Schandelmeier, H.; Reynolds, P. O. and Semtner, A. K. (1997): Palaeogeographic-Palaeotectonic Atlas of North-Eastern Africa, Arabia, and Adjacent Areas- Late Neoproterozoic to Holocene. - 17 plates, 160 p., A.A.Balkema, Rotterdam, Netherland
Schlumberger (1984): Geology of Egypt pp.1-64. - Paper presented at the Well Evaluation Conference,Schlumberger, Cairo
-133-
8/22/2019 barakat_moataz.pdf
http://slidepdf.com/reader/full/barakatmoatazpdf 148/158
REFERENCES
Schlumberger (1995): Geology of Egypt: 58-66. - Paper presented at the Well Evaluation Conference,Schlumberger, Cairo
Sestini, G. (1989): Nile Delta: depositional environments and geological history. - In: Pickering, K., andWhateley, T. (Eds.): Deltas: sites and traps for fossil fuel. - Geol. Soc. London Spec. Publ. 41: 99-128,Blackwell Scientific Publications, London.
Sestini, G., (1995): Egypt. In: Kulke, H. (Ed.): Regional Petroleum Geology of The World, Part II: Africa,America, Australia and Antarctica (Beiträge zur regionalen Geologie der Erde 22: 66-87, Gebrüder
Borntraeger Verlagsbuchhandlung, Stuttgart.
Shaaban, F.; Lutz, R.; Littke, R.; Bueker, C. and Odisho, K. (2006): Source rock evaluation and basin modellingin NE Egypt (NE Nile Delta and Northern Sinai).-Journ. Petr. Geol. 29:.1-22.
Shabaan, M. (2007): Sedimentological and biostratigraphical studies on the Miocene rocks in northern Egypt.-
250 pp. - Ph.D Thesis, Geology Department, Faculty of Science, Tanta University, Egypt.
Shahin, A. N.; Shehab, M. M. and Mansour, H. F. (1988): In Quantitative evolution and timing of petroleumgeneration in Abu Gharadig basin. - Paper presented at the 8
thExploration seminar, EGPC, Cairo. pp. 134-163.
Sharaf, L. M. (2003): Source rock evaluation and geochemistry of condensates and natural gases, offshore Niledelta, Egypt. -Journ. Petrol. Geol.26: 189-209.
Sherief, R. (1972): A Geophysical Study on the Nile Delta Area, for Petroleum Prospection.-204 pp., Ph.D.,Thesis, Cairo University, Egypt.
Sheriff, R. E. (1980): Glossary of terms used in geophysical exploration. – Society of Expl. Geol., Tulsa,Oklahoma, U S A
Soliman, S. M. and Faris, M. I. (1963): The geological history of the Nile Delta area and its evolution for prospecting. - 1
stArab Petr. Congr., Egypt: p. 12.
Stow, D. A. (1985): Fine grained sediments in deep water: An overview of processes and facies models. - Geo-Marine letters 5: 17 – 23.
Stratigraphic Subcommittee of National Committee of Geological Science (1974): Miocene rock stratigraphy of Egypt. - Egypt. Jour. Geol. 18: 1-59.
Sultan, N. and Abd El Halim, M. (1988): Tectonic framework of Northern Western Desert, Egypt and its effecton hydrocarbon accumulations. - Paper presented at the 8th Exploration and Production Conference, EGPC,Cairo: 20-23.
Tawfik, N. (1988): An exploration outlook on the Northern Gulf of Suez, Egypt. pp. 154-231. Paper presented atthe 9
thExploration Seminar, Egyptian General Petroleum Corporation, Cairo. Third Edition: Oxford, U.K.,
Blackwell Science.
Traut, W. M.; Boote, D. R. D. and Clark Lowes, D. D. (1998): Exploration history of the Palaeozoic petroleumsystems of North Africa. - In: Macgregor, S.D.; Moody, J. T. R. and Clark Lowes, D. D. (Eds.): Petroleumgeology of North Africa. - Geological Society Special Publication No. 132: 69-78, London.
Tyler, N. and Finley, R. J. (1991): Architectural controls on the recovery of hydrocarbons from sandstonereservoirs. - In: Miall, A.D. and Tyler, N. (Eds.): The Three-dimensional Facies Architecture of TerrigenousClastic Sediments, and its Implications for Hydrocarbon Discovery and Recovery. – SEPM: Concepts andModels in Sedimentology and Paleontology 3: 1–5.
Vail, P. R. and Mitchum, R. M. (1977): Overview of seismic stratigraphy and global changes of sea level.-AAPG. Mem. 26: 49-52.
Vandré, C.; Cramer, B.; Gerling, P. and Winsemann, J. (2007): Natural gas formation in the western Nile delta(Eastern Mediterranean): Thermogenic versus microbial. - Jour. Organic Geochemistry 38: 523–539.
-134-
8/22/2019 barakat_moataz.pdf
http://slidepdf.com/reader/full/barakatmoatazpdf 149/158
REFERENCES
-135-
Veeken, P. C. H. (1983): Gravity Gliding-Guyana Basin, Offshore NE South America. - In: Bally, A.W. (Ed.):Seismic Expression of Structural Styles. - AAPG Studies in Geology Series 15: 1–2.
Veeken, P. H. (2007): Seismic stratigraphy, basin analysis and reservoir characterization. Vol. 37: 509 pp. -Elsevier, Oxford, UK
Walker, R. G. (1984): Facies models, 2nd Edition - 317 pp., The Geological Association of Canada.
Wallis, W. E. (1939): Geological survey, Anqabiya area Cairo-Suez district, Standard oil of Egypt. - Internal rep.
No. 21, 24 pp.
Ward, L. N. (1996): Reservoir characteristics of the Abu Madi sandstone Nile Delta Egypt. - 13th
Explorationand production Conference, EGPC, Cairo: pp. 257-268.
Zaghloul, Z. M. (1976): Stratigraphy of the Nile Delta. - Seminar Nile Delta Sediment, UNESCO, Alexandria,Egypt: pp. 40-49.
Zaghloul, Z. M.; Elgamal, M. M.; Shaaban, F. F. and Yossef, A. F. A. (2001): Plates interactions and petroleum potentials in the Nile Delta. – In: Zaghloul, Z. and El-Gamal, M. (Eds.): Deltas (ancient and modern): pp.41-
53.
Zaghloul, M. Z.; Gheith, A. M.; Abd El Daiem, A. A. and El Asmar, H. M. (1986): The pattern of sedimentationof the Quaternary Nile Delta. - 5
thSymp. Mansoura. Univ. Egypt, p. 1.
Zaghloul, M. Z.; Shaaban, F. F. and Yousef, A. F. (1999): Mesozoic and Cenozoic Sedimentary Basins, NileDelta, Egypt. - Proc. of the 1st International Symp. Mansoura. Univ. Egypt: pp. 13-20.
Zaghloul, Z. M.; Taha, A. A. and Gheith, A. M. (1977a): Microfacies studies and paleoenvironmental trends on
the subsurface sediments of Kafr El Sheikh well No. 1, Nile Delta area. - Bull. Mansoura Uni. 5: 113-138.
Zaghloul, Z. M.; Taha, A. A.; Hegab, O. and El Fawal, F. (1977b): The Neogene-Quaternary sedimentary basinsof the Nile Delta Egypt. - J. Geol. 21: 1-19.
WEB SITE
http://www.eia.doe.gov/emeu/cabs/Egypt/pdf.pdf date: 5/12/09.
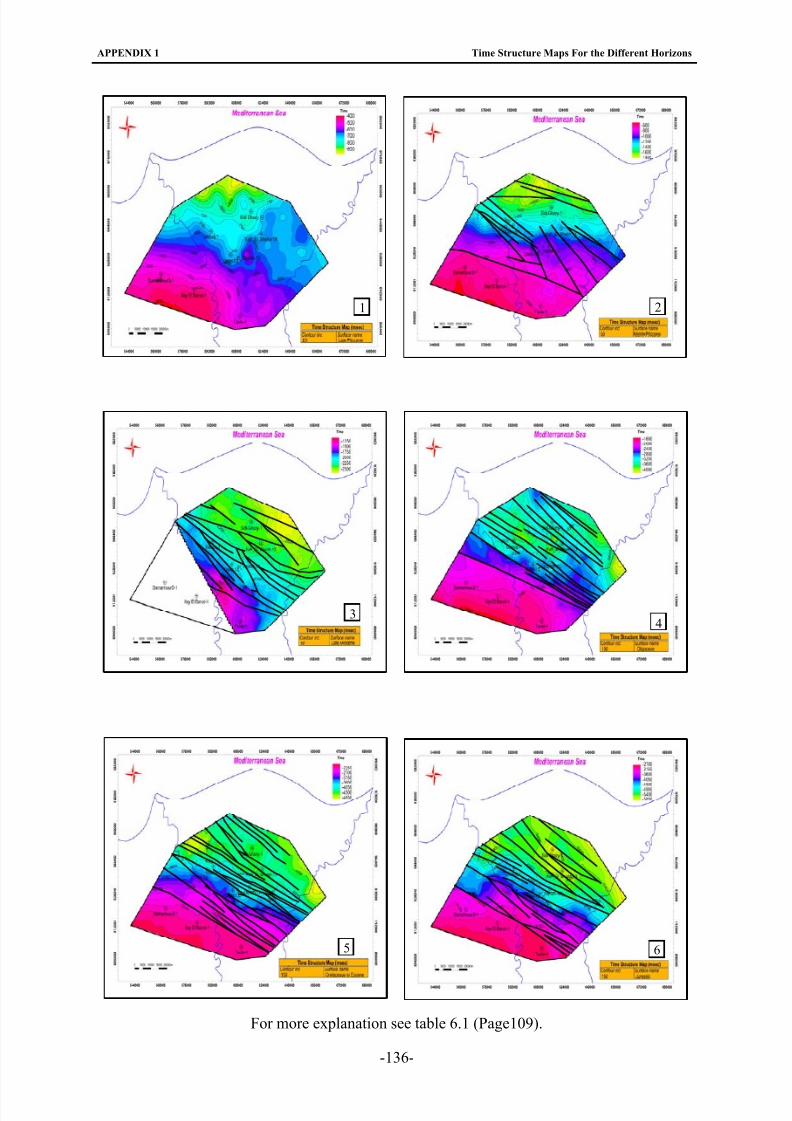
8/22/2019 barakat_moataz.pdf
http://slidepdf.com/reader/full/barakatmoatazpdf 150/158
APPENDIX 1 Time Structure Maps For the Different Horizons
21
34
5 6
For more explanation see table 6.1 (Page109).
-136-
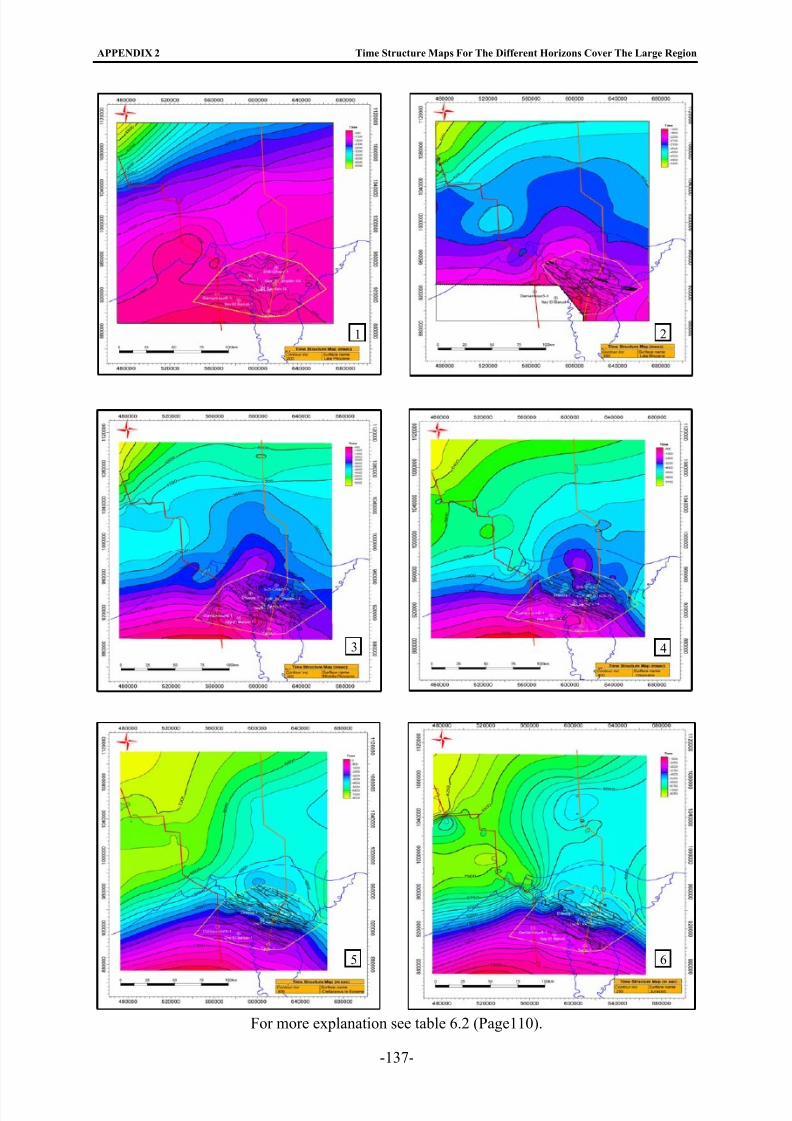
8/22/2019 barakat_moataz.pdf
http://slidepdf.com/reader/full/barakatmoatazpdf 151/158
APPENDIX 2 Time Structure Maps For The Different Horizons Cover The Large Region
21
3 4
5 6
For more explanation see table 6.2 (Page110).
-137-
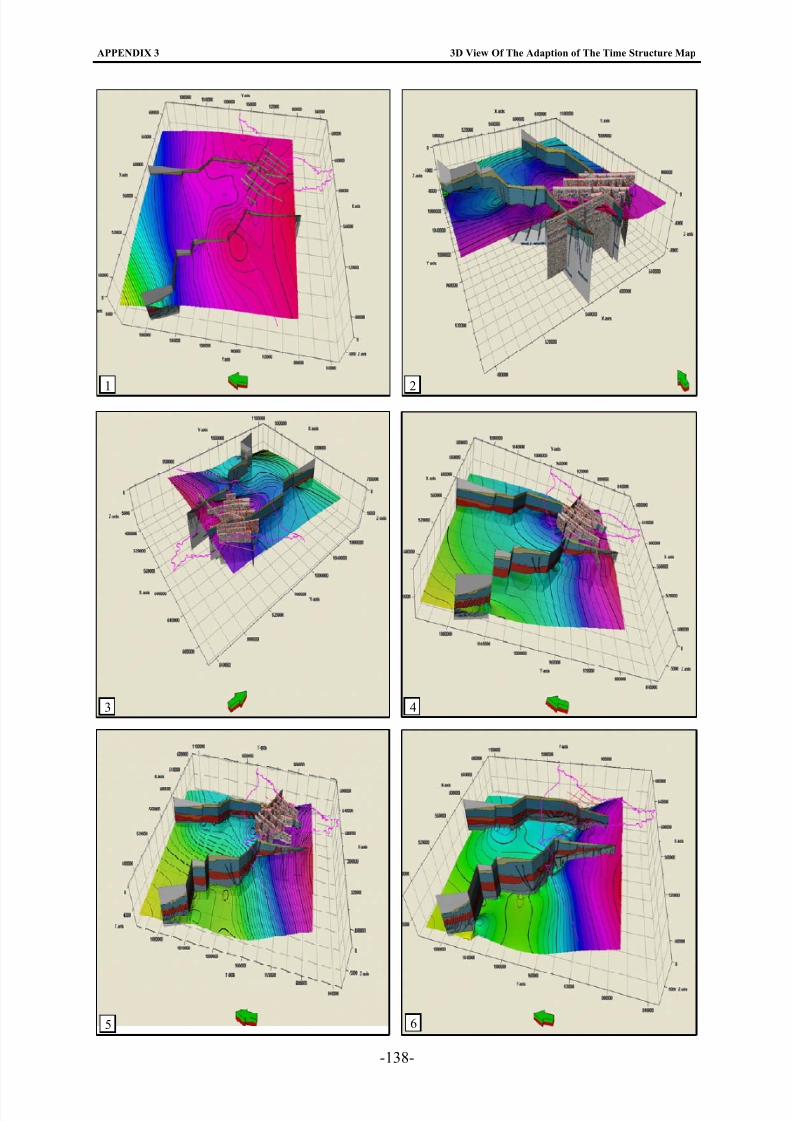
8/22/2019 barakat_moataz.pdf
http://slidepdf.com/reader/full/barakatmoatazpdf 152/158
APPENDIX 3 3D View Of The Adaption of The Time Structure Map
-138-
1 2
3 4
65
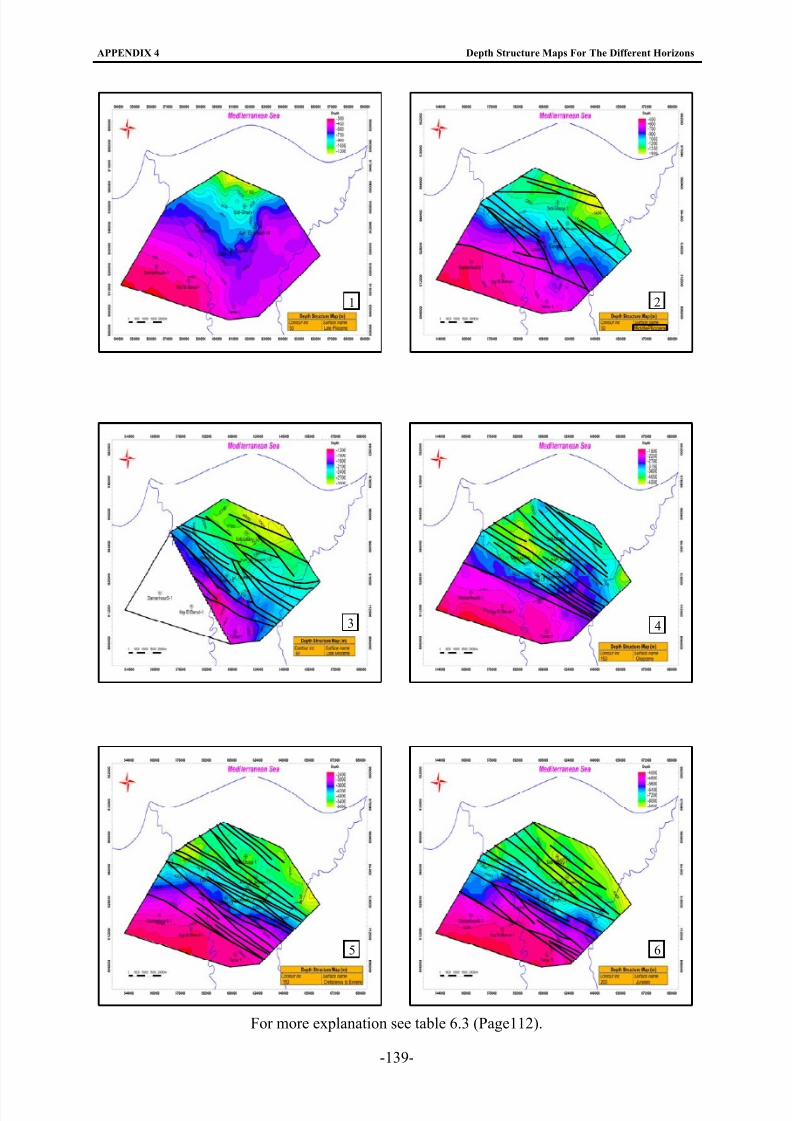
8/22/2019 barakat_moataz.pdf
http://slidepdf.com/reader/full/barakatmoatazpdf 153/158
APPENDIX 4 Depth Structure Maps For The Different Horizons
21
3 4
5 6
For more explanation see table 6.3 (Page112).
-139-
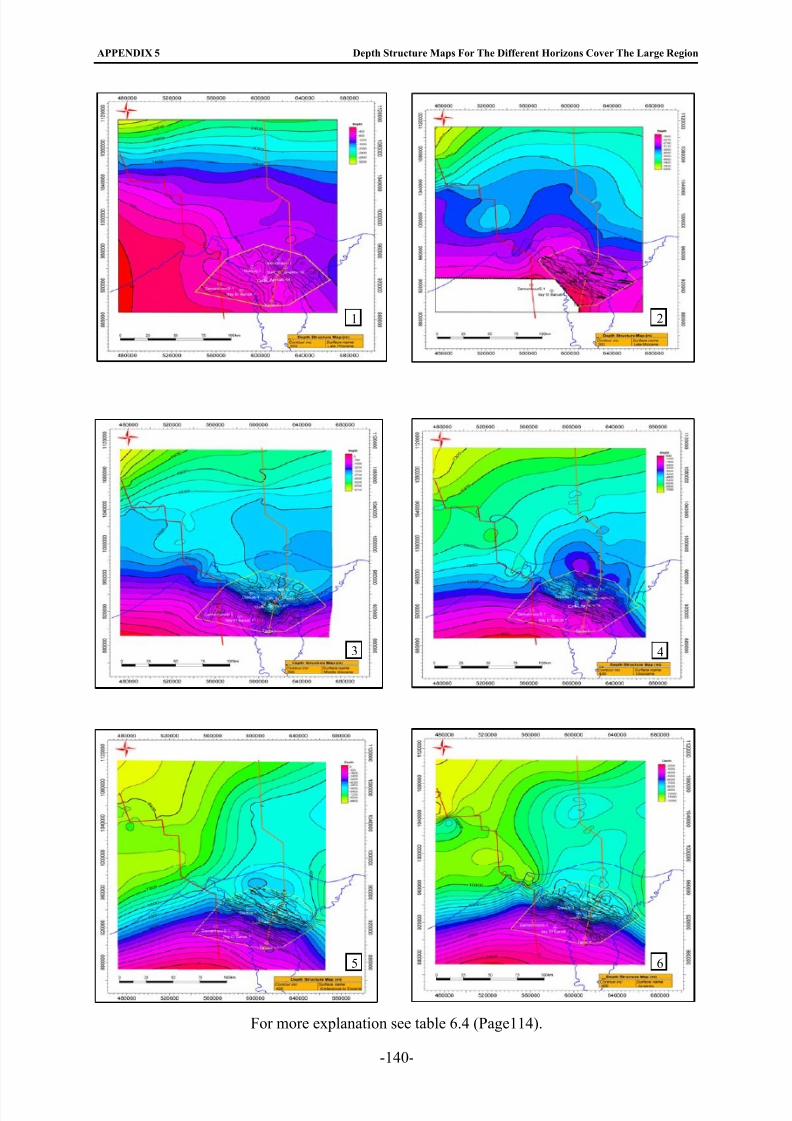
8/22/2019 barakat_moataz.pdf
http://slidepdf.com/reader/full/barakatmoatazpdf 154/158
APPENDIX 5 Depth Structure Maps For The Different Horizons Cover The Large Region
21
3 4
5 6
For more explanation see table 6.4 (Page114).
-140-
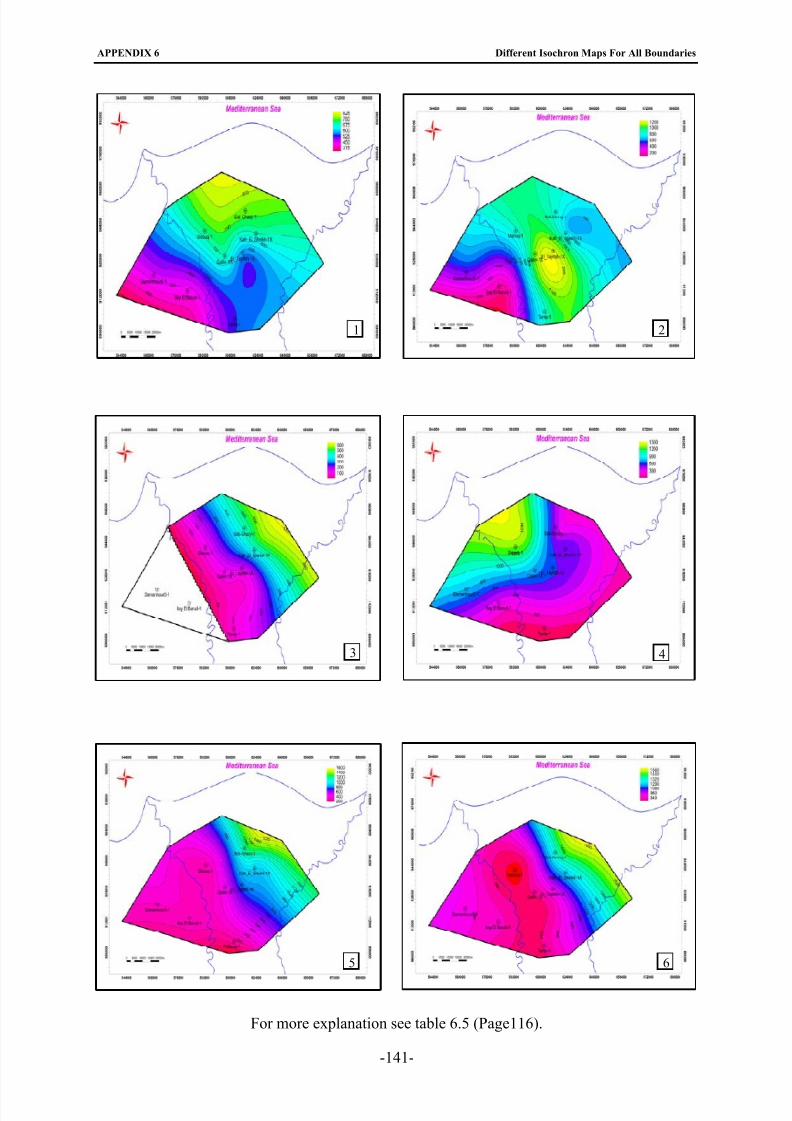
8/22/2019 barakat_moataz.pdf
http://slidepdf.com/reader/full/barakatmoatazpdf 155/158
APPENDIX 6 Different Isochron Maps For All Boundaries
6
4
5
3
21
For more explanation see table 6.5 (Page116).
-141-
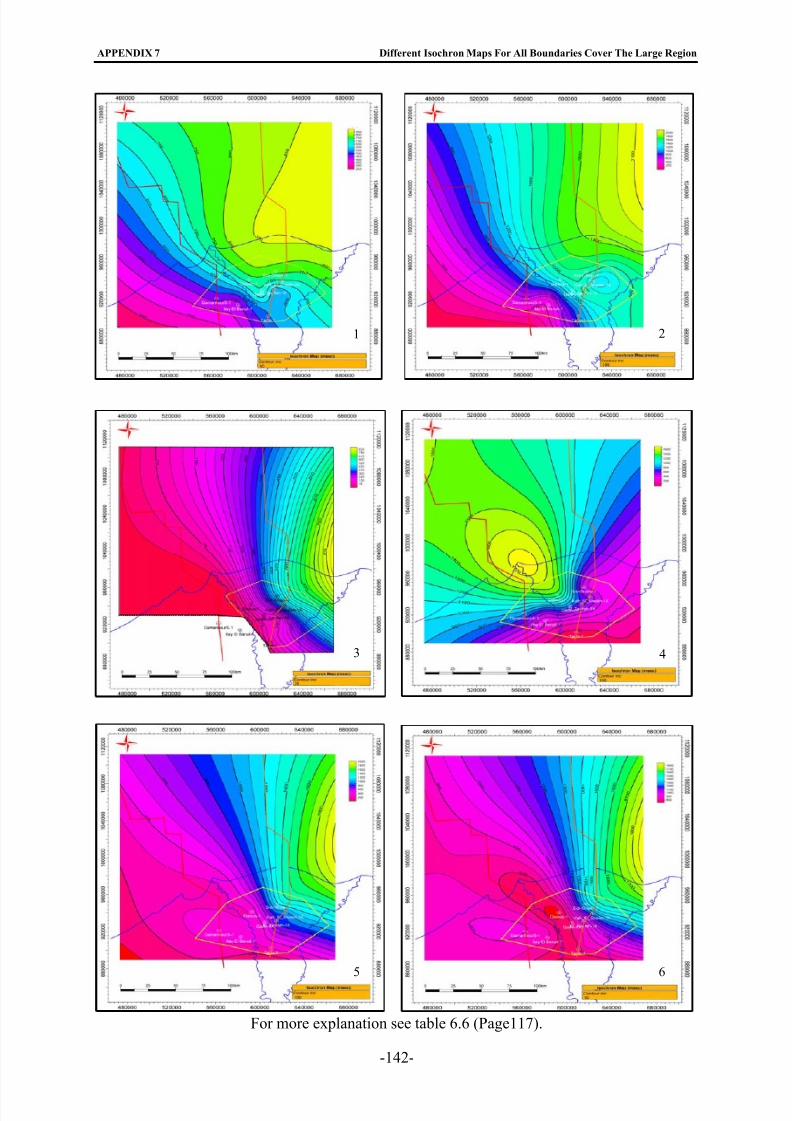
8/22/2019 barakat_moataz.pdf
http://slidepdf.com/reader/full/barakatmoatazpdf 156/158
APPENDIX 7 Different Isochron Maps For All Boundaries Cover The Large Region
For more explanation see table 6.6 (Page117).
1 2
3 4
5 6
-142-
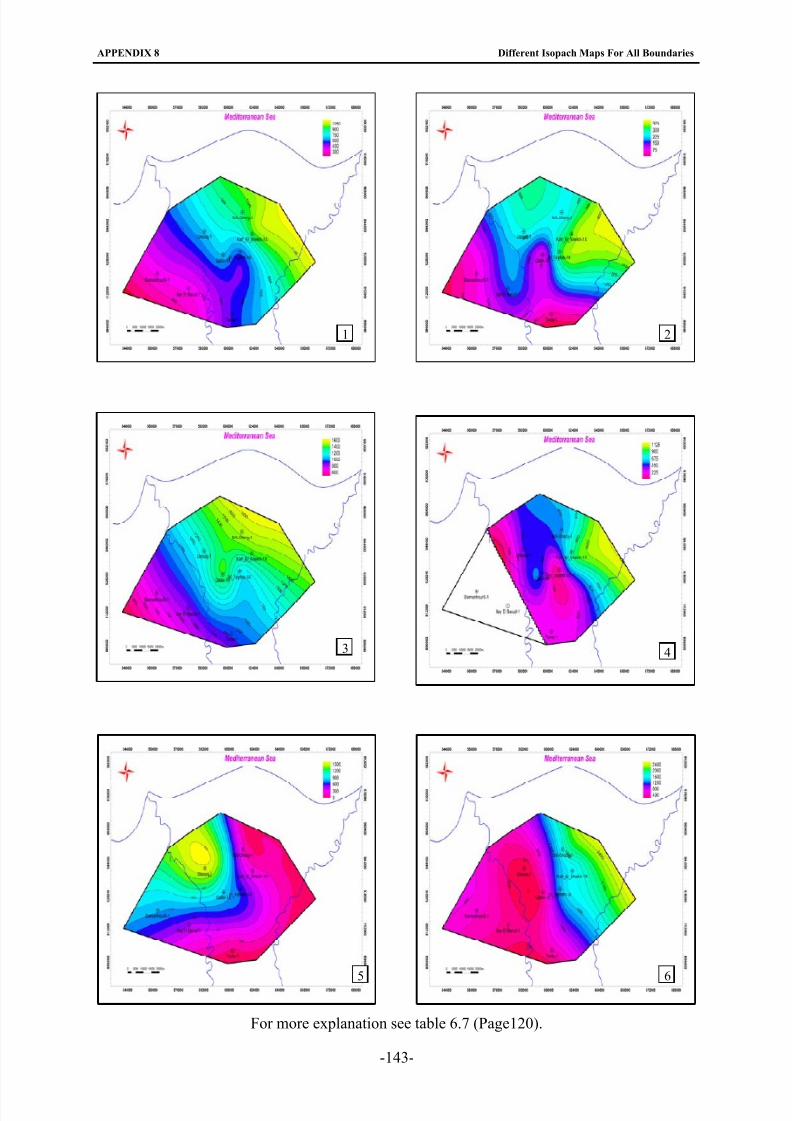
8/22/2019 barakat_moataz.pdf
http://slidepdf.com/reader/full/barakatmoatazpdf 157/158
APPENDIX 8 Different Isopach Maps For All Boundaries
1 2
3 4
5 6
For more explanation see table 6.7 (Page120).
-143-
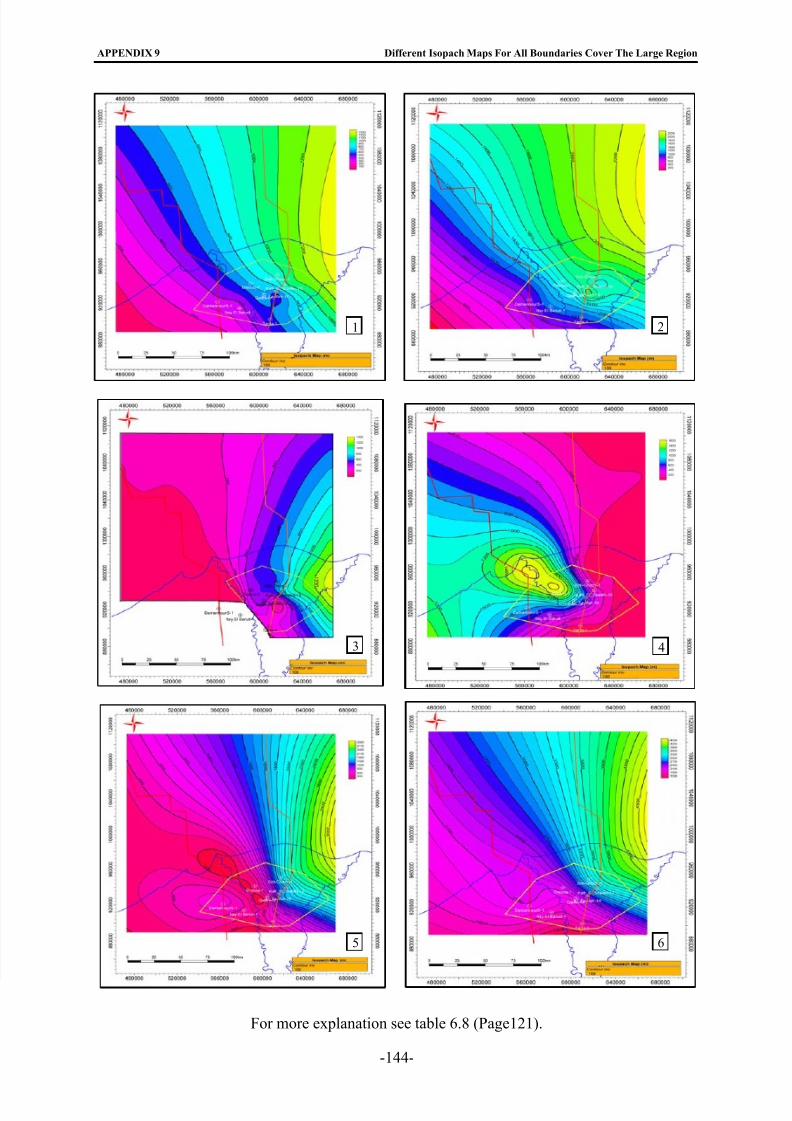
8/22/2019 barakat_moataz.pdf
http://slidepdf.com/reader/full/barakatmoatazpdf 158/158
APPENDIX 9 Different Isopach Maps For All Boundaries Cover The Large Region
21