Embed Size (px)
Citation preview
HZDR-114
JOINT PROJECT:GEOCHEMICAL RETENTION OF RADIONUCLIDES ONCEMENT ALTERATION PHASES (GRAZ)
- SUBPROJECT B -
WISSENSCHAFTLICH- TECHNISCHE BERICHTE
Katja Schmeide, Thimo Philipp, Jan-Martin Wolter,
Jérôme Kretzschmar, Paul Dullies, Holger Lippold,
Stefan Schymura, Thorsten Stumpf
Wis
sens
chaf
tlich
-Tec
hnis
che
Beri
chte
H
ZDR-
114
· 202
1 · I
SSN
219
1-87
08

Wissenschaftlich-Technische BerichteHZDR-114
Katja Schmeide, Thimo Philipp, Jan-Martin Wolter,Jérôme Kretzschmar, Paul Dullies,
Holger Lippold, Stefan Schymura, Thorsten Stumpf
JOINT PROJECT:GEOCHEMICAL RETENTION OF RARR DIONUCLIDES
ON CEMENT ALTERATION PRR HASES (GRAZ)
- SUBPROJECT B -
Final Report
BMWi Project No.: 02E11415B
Joint project: Geochemical retention of radionuclides on
cement alteration phases (GRaZ)
- Subproject B -
Katja Schmeide, Thimo Philipp, Jan-Martin Wolter, Jérôme Kretzschmar, Paul Dullies, Holger Lippold,
Stefan Schymura, Thorsten Stumpf
Helmholtz-Zentrum Dresden-Rossendorf, Institute of Resource Ecology, Bautzner Landstr. 400, 01328 Dresden, Germany

Das diesem Bericht zugrundeliegende Vorhaben wurde mit Mitteln des Bundesministeriums für Wirtschaft und Energie unter dem Förderkennzeichen 02E11415B gefördert. Die Verantwortung für den Inhalt dieser Veröffentlichung liegt bei den Autoren.
Vorhaben:
VERBUNDPROJEKT: Geochemische Radionuklidrückhaltung an Zementalterationsphasen (GRaZ), Teilprojekt B
Laufzeit des Vorhabens: 01.09.2015 bis 29.02.2020
Projektleiter: Dr. Katja Schmeide
Institut für Ressourcenökologie, Helmholtz-Zentrum Dresden-Rossendorf

I
Content
List of abbreviations and symbols .......................................................................................... V
Summary ............................................................................................................................... VII
Zusammenfassung ................................................................................................................. XI
1. Introduction and objectives ............................................................................................ 1
2. Complexation of U(VI) by citric acid ............................................................................ 7
2.1. Experimental ............................................................................................................................... 7
2.1.1. Materials .......................................................................................................................... 7
2.1.2. Methods ........................................................................................................................... 7
2.1.2.1. NMR spectroscopy .................................................................................................. 7
2.1.2.2. UV-Vis spectroscopy .............................................................................................. 7
2.1.2.3. ATR FT-IR spectroscopy ........................................................................................ 8
2.1.2.4. Stability constant determination .............................................................................. 8
2.1.2.5. Quantum chemical calculation ................................................................................ 8
2.2. Results and discussion ................................................................................................................ 8
2.2.1. Complex structures and dynamics ................................................................................... 8
2.2.2. Stability constants ......................................................................................................... 13
3. U(VI) retention by Ca-bentonite at (hyper)alkaline conditions ................................ 15
3.1. Experimental (relates to chapters 3, 4 and 5) ............................................................................ 15
3.1.1. Materials ........................................................................................................................ 15
3.1.2. Bentonite surface charge and stability at (hyper)alkaline conditions ............................ 17
3.1.2.1. Zeta potential ......................................................................................................... 17
3.1.2.2. Leaching at (hyper)alkaline conditions ................................................................. 17
3.1.2.3. X-ray diffraction (XRD) ........................................................................................ 18
3.1.3. Batch sorption experiments ........................................................................................... 18
3.1.3.1. S/L ratio dependence ............................................................................................. 23
3.1.3.2. Kinetic sorption experiments ................................................................................. 23
3.1.3.3. Sorption isotherms ................................................................................................. 23
3.1.3.4. pH dependency of sorption .................................................................................... 23
3.1.3.5. Desorption ............................................................................................................. 24
3.1.4. Solubility tests ............................................................................................................... 24
3.1.5. TRLFS ........................................................................................................................... 25
3.1.6. In situ ATR FT-IR spectroscopy ................................................................................... 26
II
3.1.7. EXAFS spectroscopy ..................................................................................................... 26
3.1.8. CTR/RAXR ................................................................................................................... 28
3.2. Results and discussion ............................................................................................................... 29
3.2.1. Bentonite surface charge and stability at (hyper)alkaline conditions ............................ 29
3.2.1.1. Zeta potential ......................................................................................................... 29
3.2.1.2. Powder X-ray diffraction (PXRD) ......................................................................... 29
3.2.1.3. Leaching ................................................................................................................ 30
3.2.2. Sorption of U(VI) on Ca-bentonite at (hyper)alkaline conditions ................................. 32
3.2.2.1. Batch sorption experiments ................................................................................... 32
3.2.2.2. Aqueous speciation of U(VI) investigated with TRLFS ....................................... 39
3.2.2.3. Solubility of U(VI) ................................................................................................ 42
3.2.2.4. U(VI) surface speciation ........................................................................................ 44
4. Influence of Ca(II) on U(VI) and Np(VI) sorption on clay minerals at
(hyper)alkaline conditions ........................................................................................... 61
4.1. Experimental ............................................................................................................................. 61
4.2. Results and discussion ............................................................................................................... 61
4.2.1. Ca(II) sorption on Ca-bentonite at (hyper)alkaline conditions ...................................... 61
4.2.2. Effect of Ca(II) on U(VI) sorption on montmorillonite, kaolinite and muscovite ......... 64
4.2.2.1. Batch sorption experiments ................................................................................... 64
4.2.2.2. Site-selective TRLFS of Ca-induced U(VI) surface complexes ............................ 69
4.2.3. Effect of Ca(II) on Np(VI) sorption on muscovite ........................................................ 77
5. Influence of isosaccharinic acid (ISA) on U(VI) sorption on Ca-bentonite at
(hyper)alkaline conditions ........................................................................................... 83
5.1. Experimental ............................................................................................................................. 83
5.2. Results and discussion ............................................................................................................... 83
6. Influence of polymeric cement additives on Eu(III) mobility at
(hyper)alkaline conditions ........................................................................................... 87
6.1. Experimental ............................................................................................................................. 87
6.1.1. Materials ........................................................................................................................ 87
6.1.2. Complexation experiments ............................................................................................ 88
6.1.3. Sorption experiments ..................................................................................................... 88
6.2. Results and discussion ............................................................................................................... 90
6.2.1. Complexation of Eu(III) with PCE ................................................................................ 90
6.2.2. Vial sorption effects ....................................................................................................... 92
6.2.3. Sorption of Eu(III) on Ca-bentonite .............................................................................. 94
III
7. Stability of U(VI) doped C-S-H phases at high ionic strength conditions ............... 97
7.1. Experimental ............................................................................................................................. 97
7.1.1. Material, device and technique descriptions (relates to chapters 7, 8 and 9) ................ 97
7.1.2. Synthesis of U(VI) doped C-S-H phases ..................................................................... 100
7.1.2.1. Direct synthesis of U(VI) doped C-S-H phases .................................................. 100
7.1.2.2. Sorption of U(VI) onto C-S-H phases ................................................................. 100
7.1.3. Batch leaching of U(VI) doped C-S-H phases ............................................................ 100
7.2. Results and discussion ............................................................................................................ 101
7.2.1. Composition of U(VI) doped C-S-H phases ............................................................... 101
7.2.2. Leaching of U(VI) doped C-S-H phases ..................................................................... 107
7.2.2.1. Leaching in water, 2.5 M NaCl and 2.5 M NaCl/0.02 M Na2SO4 ....................... 107
7.2.2.2. Leaching in 0.02 M NaHCO3 and 2.5 M NaCl/0.02 M NaHCO3 ....................... 111
8. Stability of Cm(III) doped C-S-H phases at high ionic strength conditions .......... 117
8.1. Experimental ........................................................................................................................... 117
8.1.1. Direct synthesis of Cm(III) doped C-S-H phases ........................................................ 117
8.1.2. Batch leaching of Cm(III) doped C-S-H phases.......................................................... 117
8.2. Results and discussion ............................................................................................................ 117
8.2.1. Composition of Cm(III) doped C-S-H phases ............................................................. 117
8.2.2. Leaching of Cm(III) doped C-S-H phases .................................................................. 122
8.2.2.1. Leaching in 0.02 M NaHCO3 and 2.5 M NaCl/0.02 M NaHCO3 ....................... 122
9. Stability of U(VI) doped C-A-S-H phases at high ionic strength conditions ......... 127
9.1. Experimental ........................................................................................................................... 127
9.1.1. Synthesis of U(VI) doped C-A-S-H and Al-tobermorite ............................................ 127
9.1.1.1. Sample synthesis at room temperature ................................................................ 127
9.1.1.2. Sample synthesis under hydrothermal conditions ............................................... 127
9.1.1.3. U(VI) incorporation into C-A-S-H and Al-tobermorite ...................................... 128
9.1.2. Batch leaching of U(VI) doped C-A-S-H and Al-tobermorite .................................... 128
9.2. Results and discussion ............................................................................................................ 128
9.2.1. Composition of U(VI) doped C-A-S-H and Al-tobermorite phases............................ 128
9.2.2. Leaching of U(VI) doped Al-tobermorite ................................................................... 136
9.2.2.1. Leaching in 2.5 M NaCl ...................................................................................... 136
9.2.2.2. Leaching in 2.5 M NaCl/0.02 M NaHCO3 .......................................................... 137
10. References .................................................................................................................... 139
11. Publications of the Helmholtz-Zentrum Dresden-Rossendorf (HZDR) ................ 153

IV
Acknowledgements............................................................................................................... 155
V
List of abbreviations and symbols
A/S aluminum-to-silicon a.u. arbitrary units ATR FT-IR attenuated total reflectance Fourier transform infrared BET Brunauer Emmet Teller C-S-H calcium silicate hydrate C-A-S-H calcium aluminate silicate hydrate CLQ cross-linking quotients Cm curium cryo cryogenic (refers to low temperatures) C/S calcium-to-silicon CT charge transfer CTR crystal truncation rod DIC dissolved inorganic carbon DSC differential scanning calorimetry E resonant electronic transition line EDX energy dispersive X-ray spectroscopy ESI-MS electrospray ionization mass spectrometry ESR electron spin resonance ESRF European Synchrotron Radiation Facility EXAFS extended X-ray absorption fine structure EXSY exchange spectroscopy (NMR) FEP fluorinated ethylene propylene GHS Gipshut solution Glenium MasterGlenium 51® HC high carbonate concentration HCP hardened cement paste HOMO highest occupied molecular orbital HT hydrothermal IC internal conversion ICP-MS inductively coupled plasma mass spectrometry IND semi-empirical indicator function ISA isosaccharinic acid ISC inter system crossing ITFA iterative target transformation factor analysis ITT iterative target test LC low carbonate concentration LSC liquid scintillation counting LUMO lowest unoccupied molecular orbital M metal MAS magic angle spinning MCL mean chain length M/L metal-to-ligand MS multiple scattering M-S-H magnesium silicate hydrate N2 experiments in nitrogen atmosphere NMR nuclear magnetic resonance PCE polycarboxylate ether PCS photon correlation spectroscopy PE polyethylene RAXR resonant anomalous X-ray reflectivity

VI
RN radionuclide RT room temperature S a) surface, b) lines of vibronic progression in uranyl luminescence S/L solid to liquid ratio SCM surface complexation modelling SEM scanning electron microscopy SIT specific ion interaction TGA thermogravimetric analysis TIC total inorganic carbonate TRLFS time-resolved laser-induced luminescence spectroscopy VR vibrational relaxation XANES X-ray absorption near-edge structure XAS X-ray absorption spectroscopy XRD X-ray diffraction U uranium A pH correction parameter aeq equilibrium amount of substance sorbed on a solid in mol/L am maximum amount of substance that can be sorbed on a solid stability constant
b Langmuir sorption coefficient c0 initial concentration in mol/L ceq equilibrium concentration in mol/L CN coordination number d sample thickness dL distance between crystallographic units E0 ionization energy in eV Eh redox potential F structure factor in X-ray reflectivity measurements f atomic scattering factor in X-ray reflectivity measurements h (6.626×10 34 I a) ionic strength in mol/L, b) intensity k wavenumber of photoelectron in Å-1
Kd distribution coefficient in L/kg KF Freundlich coefficient in m3/kg wavelength in nm
m mass in kg E absorption coefficient
n number of components nF Freundlich exponent
s total symmetric stretch vibration in cm-1
q momentum transfer in Å-1
R radial distance between atoms 2 Debye-Waller factor luminescence lifetime in s
ti delay time V volume in L (E) EXAFS function
z charge of an ion
VII
Summary
The present report summarizes the results obtained by the Institute of Resource Ecology of
the Helmholtz-Zentrum Dresden-Rossendorf within the BMWi-financed Joint Research
(no.
02E11415B). The work presented here is a continuation of the studies performed in the
previous BMWi project ( Retention of radionuclides relevant for final disposal in natural clay
rock and saline systems , no. 02E10971), already focusing on increased ionic strengths
(Schmeide et al., 2016). In the GRaZ project the focus was still on increased ionic strengths
but extended to hyperalkaline conditions and moreover, beside clay materials (mainly Ca-
bentonite as buffer material) also cementitious materials (
C-(A-)S-H) as main phases of hardened cement paste) were included in the radionuclide
retention studies.
Thus, the objective of the GRaZ project was to study the influence of increased salinities and
of hyperalkaline conditions on interaction processes in the system radionuclides organics
clay/cementitious materials aquifer. For this purpose, complexation, sorption and desorption
studies were performed at alkaline to hyperalkaline pH conditions (pH 8-13) and under
variation of the ionic strength (0.1 to 4 M) applying complex solution compositions.
Molecular structures of U(VI) citrate species dominating in the pH range 2-9 were studied by
spectroscopic methods (1H, 13C, 17O, 23Na NMR, UV-Vis, FT-IR). As dominating species 2:2,
3:3, 3:2 and, above critical concentrations also 6:6 and 9:6 U(VI) citrate complexes were
identified or confirmed by application of complementing methods and complex formation
constants were determined.
U(VI) sorption on Ca-bentonite at (hyper)alkaline conditions in mixed electrolyte solutions
( M NaCl, 0.02 M CaCl2, 0.02 M Na2SO4, and
0.0051 M KCl) was studied by means of batch sorption experiments as function of sorption
time, S/L ratio, U(VI) concentration, pH value, and carbonate concentration. In addition, the
influence of calcium on U(VI) and Np(VI) sorption on Ca-bentonite, Na-montmorillonite,
synthetic kaolinite and/or muscovite was studied at (hyper)alkaline conditions. In further
experiments, the effect of isosaccharinic acid polycarboxylate ether on U(VI) and Eu(III)
sorption, respectively, on Ca-bentonite was studied. Spectroscopic methods were applied to
obtain information on aqueous speciation as well as on the underlying retention mechanisms
and the local coordination environment of the retained actinide species.
The batch sorption experiments showed that U(VI) retention on Ca-bentonite can be very
effective at pH>10, even in the presence of carbonate and despite the prevalence of anionic
aqueous uranyl species. Above a certain pH, depending on the concentration of carbonate in
solution, carbonate does not play a role in the aqueous U(VI) speciation anymore due to the
predominance of hydrolysis. TRLFS measurements revealed a clear correlation between
VIII
sorption behavior and aqueous U(VI) speciation, showing that retention reaches a maximum
at pH 10-12, where
in situ -
2×10 5 M and
5×10 5 M, respectively),
-
- -
-
-
-
-
- -
-
-
-
-
-
- - -
-
- -
- -
- -
-
isosaccharinic acid - at
different ISA concentrations (up to 50 mM ISA) at pH 8-13. Batch sorption experiments were
complemented with TRLFS spectroscopic investigations on the aqueous U(VI) speciation in
the presence of ISA. The results showed that a
-
IX
Interaction of Eu(III) with a commercial cement superplasticizer of the polycarboxylate ether
class was investigated by ultrafiltration using 152Eu as a radiotracer. Based on the binding
isotherm, complexation was parameterized according to the Charge Neutralization Model
with respect to the content of carboxyl groups. At low ionic strength, interaction is
comparable to humic substances. Potential mobilizing effects in case of release are, however,
strongly counteracted by the high electrolyte contents typical of cement systems. The
influence of the plasticizer on adsorption of Eu(III) onto Ca-bentonite was examined in the
presence of NaCl and CaCl2 (up to 4 M) at pH 9-13 under exclusion of CO2. Already at
moderate ionic strengths, the mobility of the metal is exclusively determined by the
electrolyte effect, i.e., complexation is fully suppressed. Consequently, owing to the aqueous
conditions in the vicinity of leached cement materials, carrier effects can be ruled out even if
the polymers are set free in an intact state.
- - -
2.5 M NaCl, 2.5 M NaCl/0.02 M Na2SO4, 2.5 M NaCl/0.02 M NaHCO3
or 0.02 M NaHCO3 which simulate the contact with North German
claystone formation water - - -
TRLFS measurements of U(VI) doped C-S-H phases with various C/S ratios (0.6-2.0),
representing different alteration stages of concrete, showed that U(VI) is mainly incorporated
into the interlayer structure of C-S-H as well as sorbed on C-S-H surface. The leaching
experiments showed that the composition of the leaching solution had a direct influence on
the alteration of the C-S-H structure and U(VI) binding. 2.5 M NaCl led to an increased
release of calcium from C-S-H gel, although the C-S-H structure remained intact. The U(VI)
retention was largely unaffected due to formation of a uranophane-like phase detected by
TRLFS. The additional presence of Na2SO4 did not show further effects on U(VI)/C-S-H
stability. In the presence of carbonate (0.02 M), U(VI) retention was coupled to the alteration
stage of the C-S-H structure as well as to pH evolution of leaching solution. In the case of C-
S-H gel with a C/S ratio of 2, carbonate reacted preferentially with portlandite to form calcite
and vaterite while the C-S-H structure and U(VI) binding remained largely unchanged. Only
in the additional presence of 2.5 M NaCl, the U(VI) release was slightly increased due to an
increased calcite solubility. In case of a C-S-H gel with lower C/S ratio, the polyhedral CaO
plane of the C-S-H structure was increasingly destabilized due to a release of calcium into the
carbonate-containing solution connected with an enhanced release of U(VI). Secondary
CaCO3 phases were formed, here mainly calcite and aragonite. The secondary CaCO3 phases
X
contributed to a certain extent to U(VI) retention. At further increased carbonate
concentrations (0.075 M), calcium uranyl tricarbonate was detected in solution by TRLFS.
Site-selective TRLFS measurements of Cm(III) doped C-S-H phases (C/S 1.0 and 2.0)
identified at least two Cm(III) sorption sites: (i) Cm(III) with two to three water molecules in
the first coordination sphere substituted against Ca2+ from the C-S-H interlayer and (ii)
Cm(III) incorporated in the polyhedral CaO plane of the C-S-H structure with a total loss of
the hydration sphere. The observed luminescence line-narrowing effect is an indication that
beside the two main binding sites there are numerous, chemically similar binding sites for
Cm(III) in the C-S-H phases which can be attributed to the amorphous to semi-crystalline
structure of C-S-H gel. Furthermore, the C-S-H sample with a C/S ratio of 2.0 showed a co-
incorporation of Cm(III) into portlandite. The Cm(III) mobilization due to leaching of the
Cm(III) doped C-S-H gel in 0.02 M NaHCO3 or 2.5 M NaCl/0.02 M NaHCO3 was very low
(0.1 to 0.7% after 60 d) regardless of C/S ratio, ionic strength, carbonate presence, or leaching
time. Site-selective TRLFS investigations after leaching showed that Cm(III) was still
incorporated in C-S-H gel and additionally either still partially incorporated in portlandite (at
C/S 2.0) or partially incorporated into the secondary phase aragonite (at C/S 1.0). An
incorporation of Cm(III) into calcite, which was clearly present in all samples as shown with
XRD, was expected but could not be verified by TRLFS due to the overlap of the
luminescence signals of Cm(III) incorporated in calcite with those of Cm(III) incorporated in
C-S-H phases.
The C-A-S-H phases synthesized with different A/S ratios (0.06-0.18) and at different
temperatures (RT and 200 °C) showed that high temperatures favor the formation of
tobermorite over C-S-H whereby with increasing A/S ratio Al-tobermorite was increasingly
formed. Al was identified to enter the bridging positions in the silica chain of C-S-H and
tobermorite while a cross-linking between sheets was only observed at very high temperatures
and A/S ratios. The U(VI) incorporation into tobermorite was decreased in comparison to C-
S-H gel. Furthermore, TRLFS investigations of U(VI) doped Al-tobermorite suggest that at
high A/S ratios U(VI) is sorbed on the Al-tobermorite surface and not in its interlayers. Under
carbonate-containing leaching conditions Al-rich tobermorite possessed a lower retention
capability for U(VI) probably due to interlayers cross-linked by Al which made the
tobermorite interlayers inaccessible for U(VI). Instead the U(VI), sorbed on the tobermorite
surface, was faster removed by carbonate compared to U(VI) that was bound in the
tobermorite interlayer.
XI
Zusammenfassung
Im vorliegenden Bericht sind die vom Institut für Ressourcenökologie des Helmholtz-
Zentrum Dresden-Rossendorf innerhalb des BMWi-finanzierten Verbundprojektes
02E11415B) erzielten Ergebnisse zusammengefasst. Die hier präsentierten Studien stellen
eine Weiterführung der im vorherigen BMWi-Projekt ( Rückhaltung endlagerrelevanter
Radionuklide im natürlichen Tongestein und in salinaren Systemen , Nr. 02E10971)
durchgeführten Untersuchungen dar, welche bereits auf erhöhte Ionenstärken fokussierten
(Schmeide et al., 2016). Innerhalb des GRaZ-Projektes lag der Fokus weiterhin auf erhöhten
Ionenstärken, wurde aber auf hyperalkaline Bedingungen erweitert und neben Ton
(hauptsächlich Ca-Bentonit als Verfüllmaterial) wurden nun auch zementrelevante
Materialien ( C-(A-)S-H) als Hauptphasen von
Zementstein) in Radionuklid-Retentionsuntersuchen einbezogen.
Ziel des GRaZ-Projektes war es den Einfluss erhöhter Salinitäten und hyperalkaliner
Bedingungen auf Wechselwirkungsprozesse im System Radionuklid Organika
Ton/Zement Aquifer zu untersuchen. Deshalb wurden Komplexierungs-, Sorptions- und
Desorptionsstudien unter (hyper)alkalinen Bedingungen (pH 8-13) und bei variierenden
Ionenstärken (0.1 bis 4 M) in komplex zusammengesetzten Lösungen durchgeführt.
Molekulare Strukturen von im pH-Bereich 2-9 dominierenden U(VI)-Citrat-Spezies wurden
mittels spektroskopischer Methoden (1H-, 13C-, 17O-, 23Na-NMR, UV-Vis, FT-IR) untersucht.
Als dominierende Spezies wurden mehrkernige U(VI)-Citrat 2:2-, 3:3- und 3:2-, oberhalb
einer kritischen Konzentration auch 6:6- und 9:6-Komplexe identifiziert bzw. durch
Anwendung komplementärer Methoden bestätigt und Komplexbildungskonstanten bestimmt.
Die U(VI)-Sorption an Ca-Bentonit wurde unter (hyper)alkalinen Bedingungen in komplexen
Elektrolytlösungen verdünnter Gipshut- 2.5 M NaCl, 0.02 M CaCl2, 0.02 M
Na2SO4, 0.0051 M KCl) mittels Batch-Sorptionsexperimenten als Funktion von Sorptionszeit,
S/L-Verhältnis, U(VI)-Konzentration, pH-Wert und Carbonat-Konzentration untersucht.
Zusätzlich wurde der Einfluss von Calcium auf die U(VI)- und Np(VI)-Sorption an Ca-
Bentonit, Na-Montmorillonit, synthetischem Kaolinit bzw. Muskovit unter (hyper)alkalinen
Bedingungen untersucht. In weiteren Experimenten wurde der Einfluss von Isosaccharinsäure
Polycarboxylatether auf die U(VI)- bzw. Eu(III)-Sorption an Ca-Bentonit untersucht.
Spektroskopische Methoden wurden angewendet, um die aquatische Actinidenspeziation
sowie zugrundeliegende Rückhaltemechanismen und lokale Koordinationsumgebungen der
gebundenen Actinidenspezies zu ermitteln.
Die Sorptionsexperimente zeigten, dass die U(VI)-Rückhaltung an Ca-Bentonit bei pH>10
sehr effektiv sein kann, auch in Gegenwart von Carbonat und obwohl anionische
Uranylspezies in Lösung vorliegen. Oberhalb eines bestimmten pH-Wertes, welcher von der
XII
Carbonatkonzentration in Lösung bestimmt wird, bilden sich keine Carbonatspezies mehr
sondern Hydrolysespezies. Es wurde eine starke Korrelation der U(VI)-Sorption mit der
U(VI)-Speziation in Lösung gefunden. Das Sorptionsmaximum wird bei pH 10-12
beobachtet, wo -
in situ - -
2×10 5 M bzw. 5×10 5 M) erfordern, wurde lediglich -
Mittels site-selektiver TRLFS und EXAFS wurde
hingegen die Bildung von zwei nicht-äquivalenten U(VI)-Oberflächenkomplexen bei pH 8-13
nachgewiesen und Oberflächenausfällung ausgeschlossen. -
- -
- -
-
-
-
-
- -
-
- -
- - -
- - Eine Erhöhung der Sorption in Anwesenheit von
Calcium wurde auch für die Np(VI)-Sorption an Muskovit gezeigt.
sosaccharinsäure - -
ISA-Konzentrationen (bis 50 mM ISA) im pH-Bereich 8-13 untersucht.
Sorptionsexperimente wurden mit TRLFS-spektroskopischen Untersuchungen der
aquatischen U(VI)-Speziation in Gegenwart von ISA ergänzt. Die Ergebnisse zeigten, dass
eine U(VI)-Mobilisierung bei
- -
-
Die Komplexbildung von Eu(III) mit einem kommerziellen Zement-Superplasticizer auf
Polycarboxylatether-Basis wurde mittels Ultrafiltration und 152Eu als Radiotracer
konzentrationsabhängig vermessen und auf der Grundlage des Ladungsneutralisationsmodells
mit Bezug auf den Carboxylgruppengehalt parametrisiert. Bei geringer Ionenstärke besteht
demnach ein hohes Mobilisierungspotential im Freisetzungsfall, vergleichbar mit
Huminstoffen. Die für Zementsysteme typischen hohen Elektrolytgehalte schränken den
XIII
Effekt allerdings stark ein. Die Auswirkung des Plasticizers auf das Adsorptionsverhalten von
Eu(III) an Ca-Bentonit als Puffermaterial wurde in Gegenwart von NaCl und CaCl2 (bis 4 M)
unter CO2-Ausschluss im pH-Bereich 9-13 untersucht. Die Mobilität des Metalls wird bereits
bei moderaten Ionenstärken ausschließlich durch den Elektrolyteffekt bestimmt, eine
Komplexbildung also vollständig unterbunden. Somit ist aufgrund des chemischen Milieus im
Umfeld von gelaugten Zementmaterialien selbst im Falle einer Freisetzung der intakten
Polymere nicht von Carrier-Effekten auszugehen.
- - - - - -
2.5 M NaCl, 2.5 M NaCl/0.02 M
Na2SO4, 2.5 M NaCl/0.02 M NaHCO3 bzw. 0.02 M NaHCO3)
Tonsteinformationswasser simulieren sollen - -
- - -
TRLFS-Messungen U(VI)-dotierter C-S-H-Phasen mit variierenden C/S-Verhältnissen (0.6-
2.0, unterschiedliche Alterungsgrade von Beton darstellend) zeigten, dass das U(VI)
hauptsächlich in die C-S-H-Zwischenschichten eingebaut ist und auch an die C-S-H-
Oberfläche sorbiert. Laugungsexperimente zeigten, dass die Lösungszusammensetzung einen
direkten Einfluss auf eine Änderung der C-S-H-Struktur und der U(VI)-Bindung hat. 2.5 M
NaCl führte zu einer verstärkten Freisetzung von Calcium aus dem C-S-H-Gel, wobei die C-
S-H-Struktur intakt blieb. Die U(VI)-Rückhaltung blieb weitestgehend unbeeinflusst, da sich
eine Uranophan-artige Phase bildete. Die zusätzliche Anwesenheit von Na2SO4 zeigte keine
weiteren Einflüsse auf die U(VI)/C-S-H-Stabilität. In Gegenwart von Carbonat (0.02 M) war
die U(VI)-Rückhaltung mit dem Alterungsgrad der C-S-H-Struktur und mit dem pH-Wert in
Lösung gekoppelt. Bei C-S-H mit einem C/S-Verhältnis von 2 reagierte das Carbonat
bevorzugt mit Portlandit unter Bildung von Calcit und Vaterit, wobei die C-S-H-Struktur und
die U(VI)-Bindung weitestgehend unverändert blieben. Nur bei zusätzlicher Anwesenheit von
2.5 M NaCl war die U(VI)-Freisetzung aufgrund einer erhöhten Calcit-Löslichkeit leicht
erhöht. Bei C-S-H mit niedrigeren C/S-Verhältnissen wurde die oktaedrische CaO-Schicht der
C-S-H-Struktur aufgrund der Freisetzung von Calcium in die carbonathaltige Lösung
zunehmend destabilisiert, was zu einer erhöhten Freisetzung von U(VI) führte. CaCO3-
Sekundärphasen, hauptsächlich Calcit und Aragonit, wurden gebildet und trugen in gewissem
Maße zur U(VI)-Rückhaltung bei. Bei weiterer Erhöhung der Carbonat-Konzentration
(0.075 M) wurde Calciumuranyltricarbonat mittels TRLFS in Lösung nachgewiesen.
Mittels site-selektiver TRLFS wurden in Cm(III)-dotierten C-S-H-Phasen (C/S 1.0 und 2.0)
mindestens zwei Cm(III)-Sorptionsstellen identifiziert: (i) Cm(III) mit 2-3 Wassermolekülen
in der ersten Koordinationssphäre ausgetauscht gegen Ca2+ aus der C-S-H-Zwischenschicht
und (ii) Cm(III) eingebaut in die oktaedrische CaO-Schicht der C-S-H-Struktur mit totalem
XIV
Verlust der Hydratationssphäre. Der beobachtete - ist ein
Hinweis darauf, dass es neben den beiden Hauptbindungsstellen zahlreiche chemisch sehr
ähnliche Bindungsstellen für Cm(III) in den C-S-H-Phasen gibt, was auf die amorphe bis
halbkristalline Struktur von C-S-H zurückgeführt werden kann. Die C-S-H-Probe mit einem
C/S-Verhältnis von 2.0 zeigte weiterhin einen Co-Einbau von Cm(III) in Portlandit. Die
Cm(III)-Mobilisierung aufgrund einer Laugung der Cm(III)-dotierten C-S-H-Gele in 0.02 M
NaHCO3 oder 2.5 M NaCl/0.02 M NaHCO3 war sehr gering (0.1 bis 0.7% nach 60 d)
unabhängig vom C/S-Verhältnis, der Ionenstärke, Anwesenheit von Carbonat oder
Laugungszeit. Site-selektive TRLFS-Messungen nach der Laugung zeigten, dass das Cm(III)
immer noch im C-S-H-Gel und zusätzlich entweder teilweise im Portlandit eingebaut war (bei
C/S 2.0) oder teilweise in der Sekundärphase Aragonit eingebaut war (bei C/S 1.0). Obwohl
Calcit in allen C-S-H-Proben mittels XRD nachgewiesen wurde, konnte ein Cm(III)-Einbau
in Calcit mittels TRLFS nicht bestätigt werden, da die Lumineszenzsignale für Cm(III)-
Einbau in Calcit mit denen für Cm(III)-Einbau in C-S-H-Phasen überlagerten.
Die bei unterschiedlichen A/S-Verhältnissen (0.06-0.18) und unterschiedlichen Temperaturen
(RT bzw. 200 °C) synthetisierten C-A-S-H-Phasen zeigten, dass hohe Temperaturen die
Bildung von Tobermorit gegenüber der Bildung von C-S-H-Phasen begünstigen, wobei mit
steigendem A/S-Verhältnis zunehmend Al-Tobermorit gebildet wird. Es konnte gezeigt
werden, dass Aluminium verbrückende Positionen in den Silicatketten von C-S-H und
Tobermorit einnimmt, wohingegen eine Vernetzung der Tobermorit-Zwischenschichten nur
bei hohen Temperaturen und hohen A/S-Verhältnissen beobachtet wurde. Im Vergleich zu C-
S-H-Gel wird in Tobermorit weniger U(VI) eingebaut. Zudem zeigten TRLFS-
Untersuchungen von U(VI)-dotiertem Al-Tobermorit, dass bei hohen A/S-Verhältnissen das
U(VI) an der Al-Tobermorit-Oberfläche sorbiert und nicht in die Zwischenschichten
eingebaut wird. In carbonathaltigen Lösungen zeigte Al-reiches Tobermorit ein geringeres
U(VI)-Retentionsvermögen, da die vernetzten Zwischenschichten nicht für U(VI) zugänglich
waren. Das an der Tobermorit-Oberfläche sorbierte U(VI) wurde durch Carbonat leichter
freigesetzt, als in den Tobermorit-Zwischenschichten eingebautes U(VI).
1 Introduction and objectives 1
1. Introduction and objectives
The final disposal of high-level nuclear waste in deep geological formations behind multiple
protective barriers is followed worldwide as preferred approach for the long-term
management of such wastes. Objective is to ensure long-term confinement of the waste to
protect people and environment. The multi-barrier system consists of three principal parts, an
engineered barrier (steel or copper containers enclosing the nuclear waste), a geo-engineered
barrier (low-permeability bentonite clay buffer surrounding the canisters as well as
cementitious materials to ensure mechanical stability and sealing of disposal tunnels), and the
geological barrier (argillaceous, crystalline or salt host rock).
Water ingress into the repository is regarded as a worst case scenario which could result in a
mobilization of radionuclides. Thus, for a reliable long-term safety assessment of nuclear
waste repositories the migration behavior of potentially released radionuclides in the near and
far field environment has to be known. An important mechanism for retarding migration of
radionuclides is the retention of radionuclides by the various components of the multi-barrier
system by sorption and incorporation processes. Thus, parameters and processes that govern
sorption and incorporation processes (e.g., pH value, ionic strength, initial radionuclide
concentration, presence of inorganic or organic complexing ligands, colloid formation, redox
conditions, kind and concentration of mineral surface sites) have to be studied.
The present project focuses on the retention behavior of Ca-bentonite and cementitious
material, both constituents of the geo-engineered barrier, towards radionuclides. Due to large
specific surface areas, high cation exchange capacities and availability of sorption sites these
materials show high retention capacities towards radionuclides. So far, radionuclide retention
was mainly studied under simplified laboratory conditions, such as pure minerals and
electrolyte solutions, low ionic strengths and acidic to neutral pH conditions. There is still a
lack of understanding with regard to radionuclide retention and migration at conditions
prevailing in the near-field of a repository, where pore waters can be highly saline and
alkaline and contain a number of different ions.
The current research aligns to conditions reported by the AnSichT project, which evaluated
the feasibility of a repository in German clay formations (Jobmann et al., 2017). According to
-bentonite will be used in the geo-engineered barrier as
buffer material and borehole sealing. Concrete will be emplaced at different places within the
repository for sealing and stabilization (Lommerzheim and Jobmann, 2014). Moreover,
cementitious materials are commonly used for the solidification of low and intermediate level
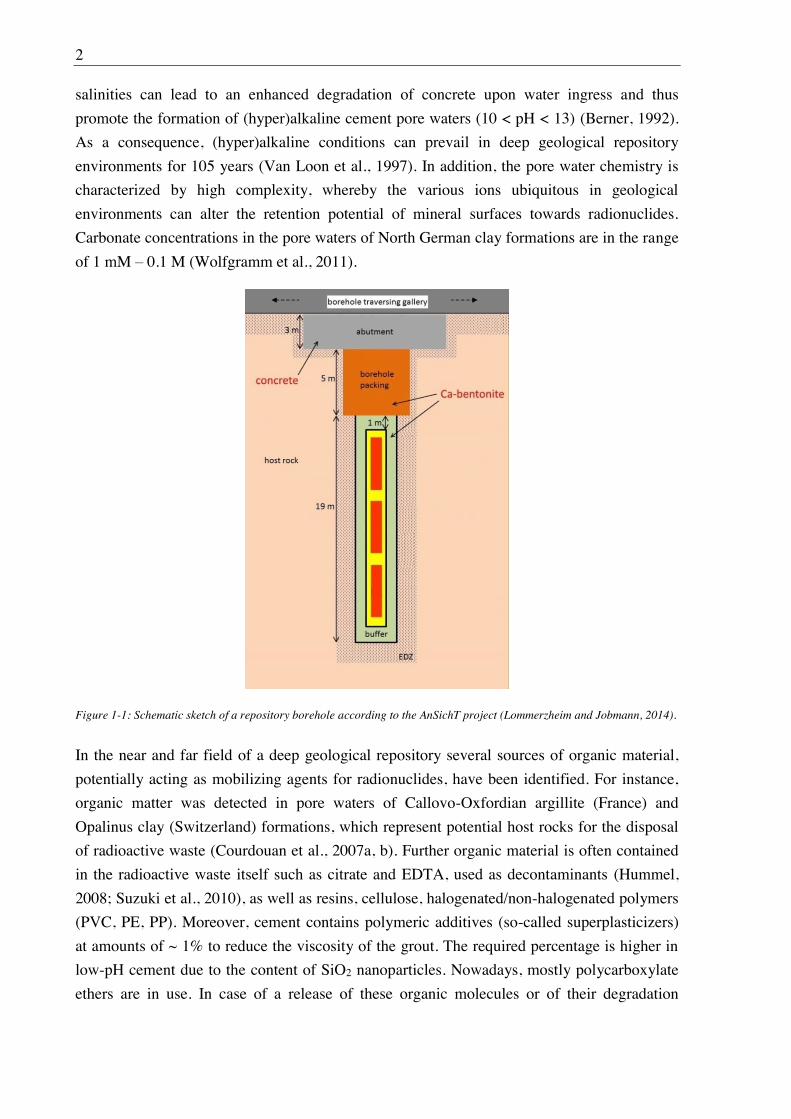
radioactive waste. A schematic sketch of a reposition borehole is depicted in Figure 1-1. Pore
waters in cretaceous clay formations in the North German Basin at repository depth (~800 m)
are characterized by high ionic strengths (Brewitz, 1982), with salinities of approx. 150 g/L
(Jahn and Sönnke, 2013; Nowak and Maßmann, 2013; Wolfgramm et al., 2011)). These high
2
salinities can lead to an enhanced degradation of concrete upon water ingress and thus
promote the formation of (hyper)alkaline cement pore waters (10 < pH < 13) (Berner, 1992).
As a consequence, (hyper)alkaline conditions can prevail in deep geological repository
environments for 105 years (Van Loon et al., 1997). In addition, the pore water chemistry is
characterized by high complexity, whereby the various ions ubiquitous in geological
environments can alter the retention potential of mineral surfaces towards radionuclides.
Carbonate concentrations in the pore waters of North German clay formations are in the range
of 1 mM 0.1 M (Wolfgramm et al., 2011).
Figure 1-1: Schematic sketch of a repository borehole according to the AnSichT project (Lommerzheim and Jobmann, 2014).
In the near and far field of a deep geological repository several sources of organic material,
potentially acting as mobilizing agents for radionuclides, have been identified. For instance,
organic matter was detected in pore waters of Callovo-Oxfordian argillite (France) and
Opalinus clay (Switzerland) formations, which represent potential host rocks for the disposal
of radioactive waste (Courdouan et al., 2007a, b). Further organic material is often contained
in the radioactive waste itself such as citrate and EDTA, used as decontaminants (Hummel,
2008; Suzuki et al., 2010), as well as resins, cellulose, halogenated/non-halogenated polymers
(PVC, PE, PP). Moreover, cement contains polymeric additives (so-called superplasticizers)
at amounts of ~ 1% to reduce the viscosity of the grout. The required percentage is higher in
low-pH cement due to the content of SiO2 nanoparticles. Nowadays, mostly polycarboxylate
ethers are in use. In case of a release of these organic molecules or of their degradation
1 Introduction and objectives 3
products they can act as ligands for radionuclides, leading to the formation of highly soluble
and mobile radionuclide complexes.
Thus, for a realistic safety assessment of deep geological repositories, all these parameters and
factors expected to influence radionuclide mobility in complex natural systems have to be
considered in laboratory experiments and modelling.
Citric acid as a hydroxy-tricarboxylic acid ranks among the most prominent ubiquitous
molecules in environmental processes and, eponymous for the citric acid cycle as the
paramount metabolic pathway in aerobic organisms, it is also an essential and highly
concentrated constituent in vivo. Based on its suitability for both multi-fashion and stable
metal-ion complexation by its four functional groups, it is applied as a chelating and
stabilizing agent or used as a model molecule for artificial substances or to mimic high
molecular mass biomolecules such as humic acids or cell surfaces of microorganisms.
Accordingly, and against the background of uranium being the most relevant actinide for both
its environmental abundance in general and its importance in industrial applications as raw
material, such as (spent) nuclear fuel in particular, the uranium citric acid system has been
and is still employed for studying actinide interaction. For instance, the aqueous chemistry of
the uranium citric acid system has been investigated for about 70 years by potentiometry,
diffraction and multi-spectroscopic methods (Allen et al., 1996; Basile et al., 2015; Berto et
al., 2012; Feldman et al., 1954; Feldman and Neuman, 1951; Hummel et al., 2005; Kakihana
et al., 1987; Nunes and Gil, 1987; Pasilis and Pemberton, 2003; Rajan and Martell, 1965;
Vanura and Kuca, 1980). However, the aqueous chemistry of the uranium citrate system is
complex, as evidenced by both still controversial discussions on speciation, i.e. the
The compilation of thermodynamic data represents a resume of 50 years of research in this
area (Hummel et al., 2005). However, since this work discarded various publications for
different reasons such as unspecified experimental parameters (temperature, concentrations,
pH, ionic strength, etc.) or lacking structural evidence for species merely proposed but in
later publications verified for some critical species log ° values are poorly determined. So
far, only the 1:1 and 2:2 species [(UO2)(Cit)] and [(UO2)2(Cit)2]2 , respectively, are well-
9). Furthermore, upon
increasing pH values also ternary complex species [(UO2)x(Cit)y(OH)z] form, but are poorly
investigated.
The objective is, therefore, a rigorous structure determination of the U(VI) citrate species
over the entire pH range and, where possible, to provide critical thermodynamic constants for
a better modelling of the migration behavior for adequate safety and risk assessment.
Bentonite is defined as rock that mainly consists of smectite (i.e. montmorillonite) (Hiltmann
and Stribrny, 1998). Additionally it can contain variable amounts of illite, kaolinite, chlorite,
4
quartz, feldspars and carbonate minerals. It occurs naturally as in situ degradation product of
volcanic ash (Jasmund and Lagaly, 1993) and can be subdivided into Na-bentonite and Ca-
bentonite, depending on the montmorillonite interlayer cations. While the sorption behavior
of U(VI) by bentonite and its main constituent montmorillonite has been extensively studied
at up to weakly alkaline conditions (e.g. (Chisholm-Brause et al., 2004; Marques Fernandes et
al., 2012; Tournassat et al., 2018)), its sorption affinity and the underlying mechanisms are
largely unknown at hyperalkaline conditions. Moreover, no U(VI) sorption studies on clay
minerals exist, which would additionally consider the effect of carbonate in the pH range 10-
13.
Thus, the U(VI) sorption on Ca-bentonite at (hyper)alkaline conditions in mixed electrolyte
solutions is studied by means of batch sorption experiments. Thereby, the effect of various
experimental parameters (sorption time, S/L ratio, U(VI) concentration, pH value, carbonate
concentration) on U(VI) sorption is assessed. Moreover, at (hyper)alkaline conditions the
stability and surface charge of Ca-bentonite is studied and U(VI) solubility tests are
performed. In addition, the influence of calcium on U(VI) and Np(VI) sorption on Ca-
bentonite, Na-montmorillonite, synthetic kaolinite and/or muscovite is studied at
(hyper)alkaline conditions. In further experiments, the effect of isosaccharinic acid, as a
cellulose degradation product that might be released from radioactive waste, on U(VI)
sorption on Ca-bentonite is studied. Polycarboxylate ether, a representative superplasticizer
used as additive in cement production, was applied for Eu(III) complexation studies as well as
to study its effect on Eu(III) sorption on Ca-bentonite. The aqueous actinide speciation is
investigated with TRLFS, while the surface actinide speciation is studied applying ATR FT-
IR, site-selective TRLFS, EXAFS and CTR/RAXR in order to clarify retention mechanisms
on a molecular level.
Concrete is an artificial rock-like composite material that consists of hardened cement paste
(HCP) and additives like sand, gravel or stones. Calcium silicate hydrate (C-S-H) is the main
phase of HCP formed during hydration of cement. In modern concretes, calcium aluminate
silicate hydrate (C-A-S-H) is formed since Al-containing compounds like fly ash or blast
furnace slag are used to substitute sand to reduce resource consumption and the carbon
dioxide footprint of the product. C-S-H is a sheet silicate consisting of polyhedral CaO planes,
SiO tetrahedral chains or dimers, and interlayers filled with water or cations such as Na+, K+
or Ca2+, similar to a defected 14 Å tobermorite-like structure. C-S-H properties are
determined by the C/S ratio. In presence of Al-rich additives, Al tetrahedra can occupy
bridging positions of the Si chain and cross-linking positions. C-S-H phases show a high
immobilization potential for tri-, tetra- and hexavalent actinides such as Cm(III), Am(III),
Np(IV), Pu(IV) and U(VI) potentially released from spent nuclear fuel (e.g. (Gaona et al.,
2011; Pointeau et al., 2004; Stumpf et al., 2004)). The stability of C-(A-)S-H phases at high
ionic strengths conditions, however, is hardly studied so far. High ionic strengths pore waters
could modify dissolution/recrystallization processes of C-S-H gel leading to formation of
1 Introduction and objectives 5
secondary phases, thus affecting the stability of C-(A-)S-H gel combined with a changed
actinide retention behavior.
Thus, the influence of high ionic strength pore water on the C-(A-)S-H phase stability and
their U(VI) and Cm(III) retention capability is systematically studied. For this, actinide doped
C-(A-)S-H phases are synthesized applying various calcium-to-silicon (C/S 0.6-2.0) and
aluminum-to-silicon (A/S 0-0.18) ratios and using different methods for actinide uptake
(direct incorporation or sorption of actinides). The stability of the actinide doped C-(A-)S-H
phases is studied by batch leaching experiments, where a potential release of actinides is
followed over longer time spans. As leaching solutions 2.5 M NaCl, 2.5 M NaCl/0.02 M
Na2SO4, 2.5 M NaCl/0.02 M NaHCO3 or 0.02 M NaHCO3, relevant to North German
claystone formation water, are applied. Directly after synthesis as well as after leaching
experiments, the actinide doped C-(A-)S-H phases are comprehensively characterized with
TRLFS, Raman and IR spectroscopy, powder XRD, 27Al and 29Si MAS NMR spectroscopy,
DSC, and TGA.
This research project (no. 02E11415B), funded by the German Federal Ministry for Economic
Affairs and Energy (BMWi) within the framework of the Joint Research Project
performed in collaboration with the R&D projects of the Johannes Gutenberg-Universität
Mainz (Institut für Kernchemie), Karlsruher Institut für Technologie (Institut für Nukleare
Entsorgung), Universität des Saarlandes (Anorganische Chemie), Technische Universität
München (Fachgebiet Theoretische Chemie), Universität Potsdam (Institut für
Chemie / Physikalische Chemie), Technische Universität Dresden (Sachgebiet
Strahlenschutz) und Universität Heidelberg (Physikalisch-Chemisches Institut).

6
2 Complexation of U(VI) by citric acid 7
2. Complexation of U(VI) by citric acid
2.1. Experimental
2.1.1. Materials
Since the complexation concerns oxidized U(VI), samples were prepared under ambient
conditions. In order to prevent light-induced degradation reactions, all samples were protected
from light by aluminum foil covered vials. Appropriate aliquots of 0.5 M citric acid (ROTH,
p.a.) and 0.5 M uranyl nitrate stock solutions in Milli-Q H2O (18.2 cm-1, Millipore) were
mixed and diluted accordingly to yield the desired final concentrations, with pH adjusted by
HCl and NaOH, respectively. Analogously, for NMR spectroscopy deuterated reagents, all by
Deutero, were used: D2O (99.98% D) as well as NaOD (40% in D2O with 99% D) and DCl
(37% in D2O with 99% D) for pD adjustment according to pD = pH + 0.4 (Kresge, 1964).
UV-Vis and FT-IR samples were prepared and measured under inert gas atmosphere.
2.1.2. Methods
2.1.2.1. NMR spectroscopy
Measurements were carried out at 25 °C on either a 9.4 T Varian Unity Inova 400 or a 14.1 T
Agilent DD2-600 NMR system, corresponding to 1H and 13C resonance frequencies of 400.1
and 100.6 MHz and 599.8 and 150.8 MHz, respectively. Especially two-dimensional as well
as 17O (81.4 MHz) and 23Na (158.6 MHz) NMR spectra were measured with the 14.1 T
device. A 5 tubes was used except for 17O
NMR, where a 10 mm low-gamma broadband direct detection probe together with 10 mm
s, with the exception of the spin-5/2
and spin-3/2 nuclei 17O and 23 17O
NMR signals cover a frequency range up to 100 kHz, sufficient excitation was assured by
sweep-range partitioning. 1H NMR spectra were acquired with solvent suppression by a pre-
saturation sequence.
2.1.2.2. UV-Vis spectroscopy
By means of a continuous-flow set-up using a flow-through cuvette (d = 1 cm, quartz
Suprasil®, Fisher Scientific) connected to a Varian Cary 5G spectrophotometer, UV-Vis
spectra were acquired in the spectral range between 350 and 700 nm. A 100 mM NaClO4
blank solution was used for baseline correction.
8
2.1.2.3. ATR FT-IR spectroscopy
ATR FT-IR difference spectra, averaged from 128 scans per sample, were measured in the
3900 400 cm 1 range on a Bruker Vertex 80/v spectrometer, utilizing a liquid-nitrogen cooled
mercury cadmium telluride detector. A horizontal diamond crystal with 9 internal reflections
was used as ATR accessory (DURA SamplIR II, Smiths Inc.).
2.1.2.4. Stability constant determination
UV-Vis and IR single-component spectra and stability constants together with their
concentration distribution were calculated employing the multivariate factor analysis program
SPECFIT/32 (Binstead et al., 2005; Gampp et al., 1985).
2.1.2.5. Quantum chemical calculation
Quantum chemical calculations were performed on DFT level (B3LYP (Becke, 1993; Lee et
al., 1988)) in aqueous phase using Gaussian 09 (Frisch, 2009) utilizing the conductor-like
polarizable continuum model (CPCM) (Barone and Cossi, 1998; Cossi et al., 2003). For
uranium, the basis set suggested by Dolg et al. (Küchle et al., 1994) in combination with the
energy-consistent small-core effective core potential (ECP) were used. As in previous studies,
the most diffuse basis functions on uranium (with exponent 0.005) were omitted (Tsushima,
2011). Double-zeta plus polarization basis was used for H, C, and O valence (Krishnan et al.,
1980). The Gibbs energy correction to the electronic energy was calculated at the same level
from the vibrational energy levels in aqueous phase and the molecular partition functions.
Obtained structures were checked to be energy minima upon justification of absence of
imaginary vibrational frequencies. Basis set superposition error (BSSE) corrections and spin
orbit effect were neglected.
2.2. Results and discussion
2.2.1. Complex structures and dynamics
Remarkably, neither publication dealing with the U(VI) citric acid system considers that,
since citric acid itself is prochiral, upon complexation a chiral center in Cq is induced, with the
resulting complexes possessing asymmetric carbons of different configuration and eventually
forming spectroscopically distinct isomers. Moreover, although being aware of site exchange
for the terminal carboxyl groups, changing configuration upon that process is not regarded.
As exemplarily depicted in Figure 2-1, the given
unbound CH2COO(H) is anti, i.e., on opposite sides of the molecular plane, with the chiral
centers of (R) and (S) configuration, respectively. Upon intramolecular site exchange between
free (green) and UVI-bound (black) terminal carboxyl, the configuration of one central carbon
(Cq) changes. Finally, the CH2COO(H) are syn, i.e., on the same side of the molecular plane,
2 Complexation of U(VI) by citric acid 9
with the molecule being of (R,R) configuration. The corresponding enantiomers, (S,R) and
(S,S) respectively, are depicted below, resulting in two diastereomeric pairs of enantiomers.
Detailed 1H and 13C NMR spectroscopic investigations were conducted (Kretzschmar et al.,
2021), however, did not allow for an unequivocal assignment of the two isomers to the
respectively observed two sets of signals.
.
antisyn
O
U
UO
O
O
O
O
OO
O
O
O
O
OOC
OO
O
O(S) (S) O
UO
UO
O
O
O
O
OO
O
O
OO
O
COOOOC
(S)(R)
O
UO
UO
O
O
O
O
OO
O
O
OO
O
OOC COO(R)(R) O
UO
UO
O
OO
O O
O
O
O
O
O
O
OOC
COO(S)(R)
Figure 2-1: Generic structures of U(VI)–Cit 2:2 complexes, configurations of the chiral carbon atoms and an exemplary configuration change upon intramolecular site exchange (green carboxyl). Note that the resulting two diastereomeric pairs of enantiomers are denoted syn and anti, and that the water in uranyls’ fifth coordination site is left out for clarity.
Finally, by means of the combination of 17O NMR (note: at natural abundance) and DFT
calculations an unambiguous decision on complex geometry and overall configurations was
successful. It could be shown that the syn isomer is favored in aqueous solution in contrast to
the preferably crystallizing anti isomer (Basile et al., 2015; Kretzschmar et al., 2021). Both
isomers coexist and interconvert among one another, with exchange rates of 30 s 1 at 6 °C
and 249 s 1 at 60 °C in acidic solution corresponding to an activation barrier of about 24 kJ
mol 1.
As evidenced by both UV-Vis (Figure 2-2) and ATR FT-IR spectroscopy, upon increasing
pH, successive abstraction of a proton in either of the two uranium-bound water ligands yields
ternary dinuclear U(VI) citric acid mono- and bis-hydroxo (2:2:1 and 2:2:2 U(VI):Cit:OH)
complexes (Berto et al., 2012; Kretzschmar et al., 2021), see Figure 2-3.
10
400 450 5000.00
0.01
0.02
0.03
0.04
0.05
0.06
abso
rptio
n / a
.u.
wavelength / nm
1:0:0
2:2:0
2:2:1
2:2:2
3:3:5
1:1:0
Figure 2-2: UV-Vis absorption spectra of 5·10 4 M U(VI) solutions in presence of 0.01 M citric acid as a function of pH (I = 0.1 M, 25 °C), with the corresponding single-component spectra highlighted. Assignments denote complexes of composition U(VI):Cit:OH.
Another consequence of the increased pH value is an increasing intramolecular exchange of
the CH2COO moieties due to the reduced competition between U(VI) and H+/D+ for the
carboxyl groups.
Figure 2-3: U(VI)–citrate–hydroxo 2:2:n ternary complexes formed upon hydrolysis of the U(VI)-coordinating water.
Depending on the sample composition, but in general above pH 5.5 also trinuclear U(VI)
citric acid complexes start to form (Figure 2-4) (Basile et al., 2015; Berto et al., 2012).
Thereby, upon fine-tuning the sample conditions, especially for U:Cit ratios equal to or
greater than unity, the 3:3 complex is favored. However, upon increasing pH, citric acid is
displaced by hydroxo ligand, and the 3:2 complex predominates.
2 Complexation of U(VI) by citric acid 11
Figure 2-4: Generic structures of the trinuclear U(VI)–citrate complexes.
The molecular structures of the trinuclear complexes was evidenced in the single-crystal by
Basile et al. (2015) who showed that these species can form superstructures, i.e., a 6:6
sandwich complex and a 9:6 macrocycle. In continuation of their work, focusing on aqueous
solution, we found spectroscopic evidence for both the trinuclear complexes themselves and
their corresponding superstructures. Particularly the formation and the solution structure of
the 6:6 complex, formed by two 3:3 units sandwiching a Na+ cation, were investigated in
more detail (Kretzschmar et al., 2020).
Figure 2-5: 1H NMR (left) and 23Na NMR (right) spectra of diluted pD 7 solutions of equimolar U(VI):Cit ratio; from top to bottom: 5, 4, and 2.5 mM, respectively. The lines indicate 23Na NMR signals associated with the 6:6 sandwich complex.
Above a critical concentration determined as about 3 mM (at pD 7.0) the 6:6 U(VI) citrate
Na+ sandwich persists in aqueous solution (Figure 2-5). This was proven both by 23Na NMR
spectroscopy being able to observe the sandwiched Na+ ( Na 25 ppm) and the absence of any
molecular dynamics implied by very sharp 1H and 13C NMR signals (Figure 2-6 A and B) in
contrast to the very broad signals of the 3:2 complex (see arrows in Figure 2-6). The latter is
subject to intramolecular site exchange between U(VI)-bound and free CH2COO moieties,
shows complete ligand exchange between U(VI)-bound and free citrate (EXSY, Figure 2-6
C), and likely features a dynamic equilibrium between 9:6 macrocycle formation from and
disintegration into the 3:2 sub-units, with the former favored upon increasing [U(VI)].
12
Figure 2-6: NMR spectra of solutions 250 mM each in U(VI) and citrate with pD values indicated. (A) 1H, (B) 13C, (C) EXSY, (D) 23Na, and 17O NMR. Free citrate is indicated by an asterisk. The inset in (D) is a magnified spectrum for better visualization of the broad signals.
The applied high sample concentrations allowed for acquisition of 17O NMR signals (note: at
natural 17O abundance of 0.038%) for the uranyl-oxygen atoms. While the pD 7.0 sample
contains almost exclusively the 6:6 sandwich complex, increasing pD yields species with
1.5:1 U(VI):Cit stoichiometry with concomitant liberation of citrate (NMR signals indicated
by an asterisk), the latter of which being replaced by hydroxo as ligand.
Figure 2-7 (a) through (c) show NMR spectra of solutions with both increasing excess in
citrate (1.67, 6.67, and 20, respectively) and increasing pD (7.5, 9.6, and 12.3, respectively).
Firstly the 6:6 complex is displaced (sharp signals in (a)) so that in (b) only the 9:6 complex
(dashed line) is present, existing up (strongly) alkaline media, where it is then displaced by a
further complex (signal indicated by arrow, (c)).
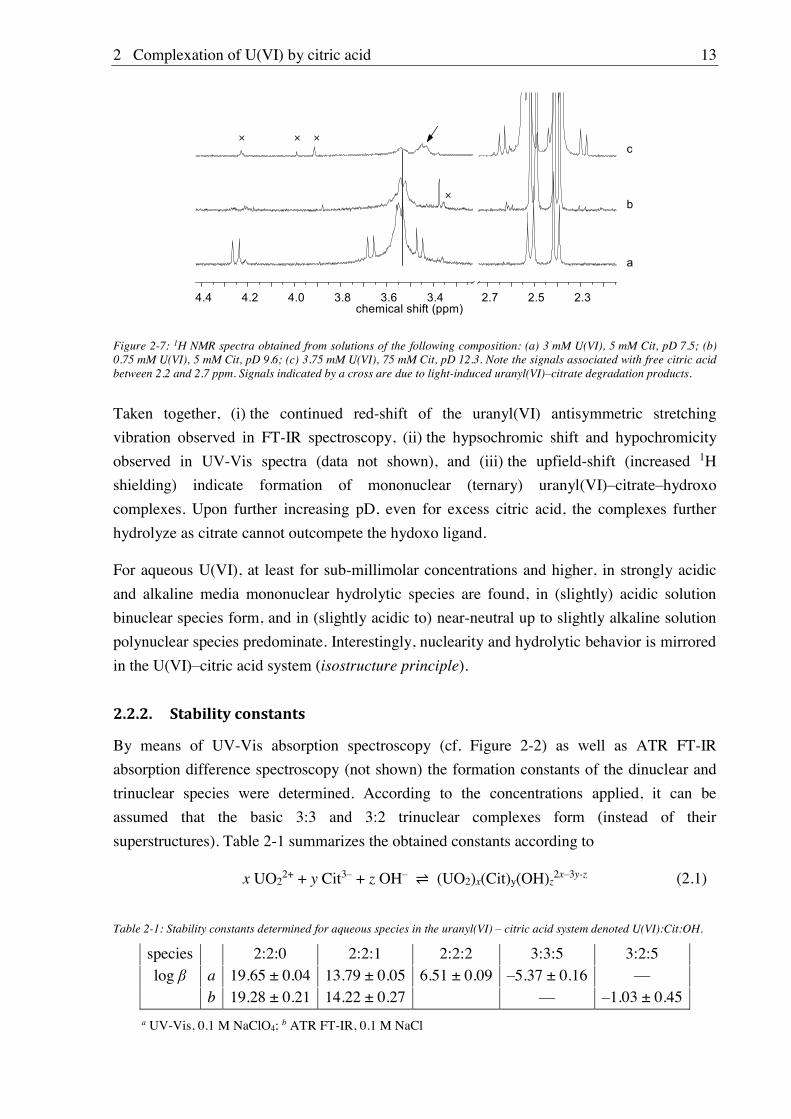
2 Complexation of U(VI) by citric acid 13
Figure 2-7: 1H NMR spectra obtained from solutions of the following composition: (a) 3 mM U(VI), 5 mM Cit, pD 7.5; (b) 0.75 mM U(VI), 5 mM Cit, pD 9.6; (c) 3.75 mM U(VI), 75 mM Cit, pD 12.3. Note the signals associated with free citric acid between 2.2 and 2.7 ppm. Signals indicated by a cross are due to light-induced uranyl(VI)–citrate degradation products.
Taken together, (i) the continued red-shift of the uranyl(VI) antisymmetric stretching
vibration observed in FT-IR spectroscopy, (ii) the hypsochromic shift and hypochromicity
observed in UV-Vis spectra (data not shown), and (iii) the upfield-shift (increased 1H
shielding) indicate formation of mononuclear (ternary) uranyl(VI) citrate hydroxo
complexes. Upon further increasing pD, even for excess citric acid, the complexes further
hydrolyze as citrate cannot outcompete the hydoxo ligand.
For aqueous U(VI), at least for sub-millimolar concentrations and higher, in strongly acidic
and alkaline media mononuclear hydrolytic species are found, in (slightly) acidic solution
binuclear species form, and in (slightly acidic to) near-neutral up to slightly alkaline solution
polynuclear species predominate. Interestingly, nuclearity and hydrolytic behavior is mirrored
in the U(VI) citric acid system (isostructure principle).
2.2.2. Stability constants
By means of UV-Vis absorption spectroscopy (cf. Figure 2-2) as well as ATR FT-IR
absorption difference spectroscopy (not shown) the formation constants of the dinuclear and
trinuclear species were determined. According to the concentrations applied, it can be
assumed that the basic 3:3 and 3:2 trinuclear complexes form (instead of their
superstructures). Table 2-1 summarizes the obtained constants according to
x UO22+ + y Cit3 + z OH (UO2)x(Cit)y(OH)z
2x 3y-z (2.1)
Table 2-1: Stability constants determined for aqueous species in the uranyl(VI) – citric acid system denoted U(VI):Cit:OH.
species 2:2:0 2:2:1 2:2:2 3:3:5 3:2:5 log a 19.65 ± 0.04 13.79 ± 0.05 6.51 ± 0.09 5.37 ± 0.16
b 19.28 ± 0.21 14.22 ± 0.27 1.03 ± 0.45
a UV-Vis, 0.1 M NaClO4; b ATR FT-IR, 0.1 M NaCl
14
The stability constant for the 3:3:5 complex was so far not known to literature (Kretzschmar
et al., 2021). Values of the other species are in good agreement with literature, only the
stability constant for the 2:2:2 complex (0.1 M NaClO4) is somewhat smaller compared to
Berto et al. (2012): 8.22 ± 0.02 and 8.87 ± 0.01 for 0.1 M NaCl and 0.1 M KNO3 solution,
respectively. However, since these stability constants show significant dependence on the
background electrolyte, particularly for highly charged species, the determined values can be
considered reliable.
It can therefore concluded that citric acid / citrate forms water soluble complexes over the
entire pH range. Already in strongly acid solution uranyl(VI) is chelated by multidentate
coordination. The impact of citric acid on uranium(VI) mobility is remarkable up to alkaline
solution owing to formation of highly negatively charged complexes. Only in strongly
3 U(VI) retention by Ca-bentonite at (hyper)alkaline conditions 15
3. U(VI) retention by Ca-bentonite at (hyper)alkaline conditions
3.1. Experimental (relates to chapters 3, 4 and 5)
In the following an overall view is given for all experimental conditions related to
experiments studying (i) the U(VI) retention by Ca-bentonite at (hyper)alkaline conditions
(chapter 3), (ii) the influence of Ca(II) on U(VI) and Np(VI) sorption on clay minerals at
(hyper)alkaline conditions (chapter 4) and (iii) the influence of ISA on U(VI) sorption on Ca-
bentonite at (hyper)alkaline conditions (chapter 5).
3.1.1. Materials
The Ca-bentonite was of the type Calcigel® (Clariant, Munich, Germany). This naturally
occurring clay rock is mined in Bavaria (Germany) and was received as a powder with
particle sizes between 0.5 and 150 m, the dominant fraction (90%) of the particles being
smaller than 90 m (laser granulometer HELOS Series KF + Quixel (SYMPATEC,
Clausthal-Zellerfeld, Germany), range "R3": 0.5-75 m) (Figure 3-1). The mineral
composition is given by the supplier according to Table 3-1, with montmorillonite being the
major constituent (60-70%) and with a relatively large fraction of quartz (6-9%). The specific
surface area of Ca-bentonite was determined to be 76.5 ± 0.3 m2/g, applying the Brunauer-
Emmet-Teller (BET) method, using a SA 3100 surface area analyzer (Beckman Coulter,
Fullerton, USA). Before measurements, samples were degassed at the vacuum station of the
instrument at 80 °C and at 100 °C for at least 8 h each. Nitrogen was used as adsorber gas.
Figure 3-1: Particle size distribution of Ca-bentonite (Calcigel®) plotted as cumulative fraction against the grain size.
16
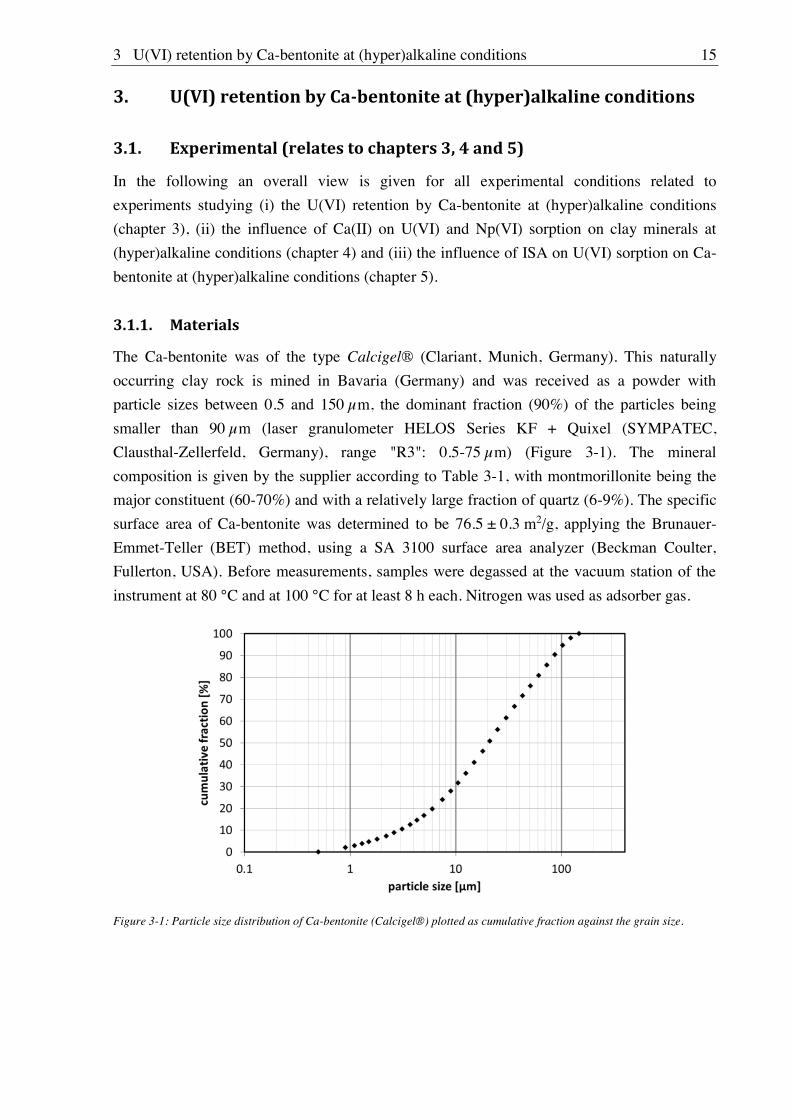
Table 3-1: Mineral composition of Ca-bentonite (Calcigel®) according to product information of Clariant (Munich, Germany).
Mineral phase Fraction [%]
Montmorillonite 60 70 Quartz 6 9 Feldspar 1 4 Kaolinite 1 2 Mica 1 6 Others 5 10
Montmorillonite (SWy-2, Crook County, Wyoming, USA) was purified in the course of the
PhD project of Katharina Fritsch (Fritsch, 2018) according to Bradbury and Baeyens (2009)
to obtain the Na-form. A sieved fraction with particles < 63 m and a BET surface area of
41.1 ± 0.8 m2/g was used in the sorption experiments. Synthetic kaolinite was obtained by
hydrothermal treatment of a aluminosilica gel at 220 °C by Huittinen et al. (2010) according
to the procedure by Fialips et al. (2000). The BET surface area was determined to be
22.2 m2/g. As observed by SEM, the size of the particles was < 1.1 m and EDX mapping
revealed that the synthetic kaolinite did not contain any impurities (only elements detected
were O, Al and Si) (Huittinen et al., 2010). Muscovite was purchased in the form of single
crystals (12.7 × 12.7 × 0.2 mm3) from the Asheville-Schoonmaker Mica Company (USA).
These single crystals were used for CTR/RAXR measurements. For the batch sorption
experiments, the single crystals were milled with a ball mill, yielding a mineral powder, of
which a < 63 m grain size fraction was obtained by sieving. The BET surface area of the
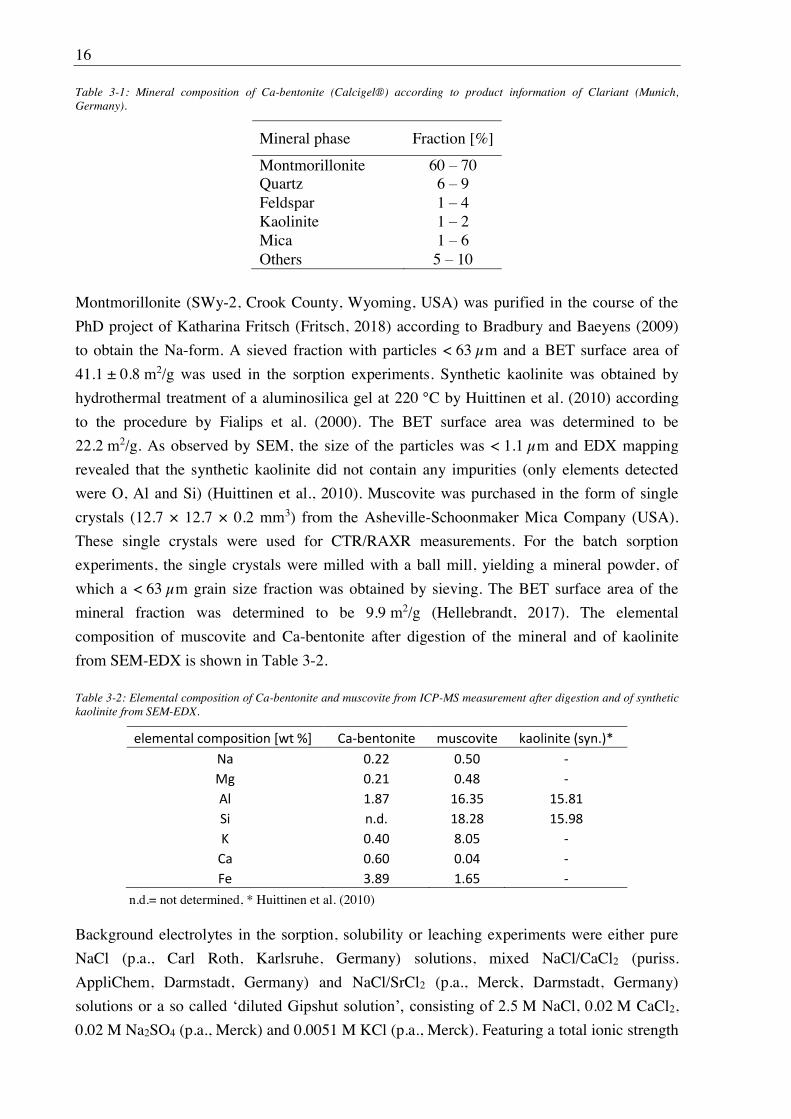
mineral fraction was determined to be 9.9 m2/g (Hellebrandt, 2017). The elemental
composition of muscovite and Ca-bentonite after digestion of the mineral and of kaolinite
from SEM-EDX is shown in Table 3-2.
Table 3-2: Elemental composition of Ca-bentonite and muscovite from ICP-MS measurement after digestion and of synthetic kaolinite from SEM-EDX.
n.d.= not determined, * Huittinen et al. (2010)
Background electrolytes in the sorption, solubility or leaching experiments were either pure
NaCl (p.a., Carl Roth, Karlsruhe, Germany) solutions, mixed NaCl/CaCl2 (puriss.
AppliChem, Darmstadt, Germany) and NaCl/SrCl2 (p.a., Merck, Darmstadt, Germany)
solutions or a so called M NaCl, 0.02 M CaCl2,
0.02 M Na2SO4 (p.a., Merck) and 0.0051 M KCl (p.a., Merck). Featuring a total ionic strength
3 U(VI) retention by Ca-bentonite at (hyper)alkaline conditions 17
of 2.63 M, it simulates in situ pore waters of North German clay and salt formations at
hypothetical repository depth (Wolfgramm et al., 2011). Desorption experiments were also
performed with 1 M HNO3 (p.a., ISO, Carl Roth). Carbonate was introduced to the samples
by adding aliquots of 1 M NaHCO3 (p.a., Carl Roth) or 2 M Na2CO3 (p.a., Merck) stock
solutions. The 0.636 M ISA stock solution was synthesized in a two-step procedure as
described in detail in Brinkmann et al. (2019) and Dullies (2019). All solutions were prepared
with deionized water (18 M cm-1; mod. Milli-RO/Milli-Q-System, Millipore, Schwalbach,
Germany). For all experiments under N2 atmosphere, water was additionally degassed prior to
solution preparation.
238U(VI) addition was realized with a 1×10 3 M stock solution (Unat in 0.005 M HClO4). For
the experiments applying 233U, a 1.85×10 4 M UO2Cl2 stock solution was used. Np(VI)
sorption experiments were performed with the highly active isotope 239Np. The 239Np stock
solution was produced by irradiation of 238U (UO2(NO3)2 in Milli-Q water) at the TRIGA
research reactor in Mainz. 239Np was separated from its fission products by anion exchange
chromatography with the resin Dowex AG 1-X8 (200 400 mesh, chloride form, Bio-Rad
Laboratories GmbH, München, Germany) packed in a glass column. In a first step, the fission
products were washed from the resin with 8 M HCl, while the neptunium remained adsorbed.
Subsequently, 239Np was eluted by washing with a mixture of 4 M HCl and 0.05 M HF. The
obtained solution was fumed several times with 1 M HClO4, to finally obtain a Np(VI) stock
solution (Amayri et al., 2011). The concentration of the 239Np stock solution was 1×10 11 M.
The 45Ca stock solution was purchased from PerkinElmer (Waltham, USA) as 45CaCl2 in
aqueous solution and had a concentration of 2×10 11 M.
3.1.2. Bentonite surface charge and stability at (hyper)alkaline conditions
3.1.2.1. Zeta potential
The surface charge of Ca-bentonite particles was determined by zeta potential measurements.
Ca-bentonite suspensions (0.1 g/L) in the pH range 7-13 were prepared in 0.1 M NaCl, 0.1 M
NaCl + 0.02 M CaCl2 and 0.1 M NaCl + 0.02 M SrCl2 in order to evaluate the effect of pH,
calcium and strontium concentration. Samples were equilibrated with frequent pH
adjustments until a constant pH was reached (after approx. 2 weeks). Measurements, based on
laser Doppler velocimetry, were performed with a Zetasizer Nano ZS (Malvern Instruments,
Malvern, United Kingdom). Potentials were averaged over ten measurements, each consisting
of 10-50 scans.
3.1.2.2. Leaching at (hyper)alkaline conditions
Leaching experiments were performed as a function of pH and contact time in order to
evaluate the stability of Ca-bentonite towards treatment with alkaline solutions. Duplicate
samples of 10 g/L Ca-bentonite were contacted (a) with 0.1 M NaCl solution for three weeks
18
at pH 8-13 (increments of 0.5) and (b) with diluted Gipshut solution at pH 8 for different
contact times (few seconds to three weeks). The suspensions were placed on an end-over-end
shaker and frequent pH adjustments (every two or three days) were done with diluted NaOH
or HCl solutions. After centrifugation (6800×g, 30 min) in an Avanti J-20 XP centrifuge
(Beckman Coulter, Fullerton, USA), the supernatant was analyzed for Na, Mg, Al, Si, K and
Ca with ICP-MS (NexION 350X, PerkinElmer, Waltham, USA), and for CO32- with total
inorganic carbon measurements (multiN/C 2100, Analytik Jena, Germany).
3.1.2.3. X-ray diffraction (XRD)
Powder XRD measurements were performed in order to evaluate the effect of saline and
alkaline solutions on the stability of the main constituents of Ca-bentonite and to detect
possible formation of secondary mineral phases. For that, the bentonite (10 g/L) was
conditioned in the absence of CO2 (N2 glove box) with diluted Gipshut solution at pH 8-13 for
3 weeks with frequent pH adjustments in order to apply the same experimental conditions as
in the sorption experiments. After centrifugation (6800×g, 30 min) the wet bentonite paste
was loaded into an inert gas sample holder. The measurement was conducted with the powder
X-ray diffractometer Rigaku MiniFlex 600 (Tokyo, Japan), using Cu K radiation and a
Bragg- - and a speed of 0.92
steps per second. For mineral phase identification, the ICDD PDF database was used.
3.1.3. Batch sorption experiments
In this section the general procedure of the batch sorption experiments is described. Details on
radionuclide, carbonate, calcium and electrolyte concentrations, pH, S/L ratio and sorption
time can be found in the sub-section to the respective type of experiment and in Table 3-3.
All sorption samples were prepared in duplicate. The mineral powder was weighed in 15 mL
polypropylene centrifuge tubes (Greiner Bio-One, Frickenhausen, Germany), and was
suspended with the respective background electrolyte. In the sorption experiments with ISA,
calculated aliquots of the ISA stock solution were added. Experiments were carried out both
at carbonate-free conditions (N2 glove box) and in the presence of carbonate. Low dissolved
carbonate (LC = 1 mM) and high dissolved carbonate (HC = 100 mM) concentrations were
achieved by adding calculated amounts of NaHCO3 or Na2CO3 to the solutions. These
concentrations are representative of the lower and upper boundary of natural carbonate
concentrations expected in pore waters in the North German Basin at repository depth
(Wolfgramm et al., 2011). CO2 from the ambient air did not lead to additional increase of
carbonate concentration within the time frame of the experiments as analytical determination
of the carbonate content confirmed stable concentrations of dissolved carbonate. Measured
carbonate concentrations as a function of pH are shown exemplarily in Figure 3-2.
3 U(VI) retention by Ca-bentonite at (hyper)alkaline conditions 19
Figure 3-2: Measured carbonate concentrations in the supernatant of batch sorption samples after completion of the experiments with low (1 mM) and high (100 mM) amount of carbonate added (here exemplarily shown for U(VI) sorption on Na-montmorillonite).
Suspensions were pre-conditioned with pH-adjustments with diluted NaOH or HCl every
other day until a constant pH value (±0.05) was reached (approx. two weeks). The pH was
measured with an InoLab pH 7110 pH meter (WTW, Weilheim, Germany) and a SenTix MIC
glass electrode (WTW). Three point calibration was executed with WTW buffer solutions (pH
6.865, 9.180 and 12.454). During this time, samples were placed in an end-over-end shaker.
In solutions with high ionic strengths, the measured potential at the pH electrode, and
accordingly pHexp, deviates from the true potential due to the great discrepancy between the
activity coefficients of the sample and the electrolyte of the electrode (Altmaier et al., 2003).
By introducing a correction parameter A, the true pH can be derived according to:
-log[H+] = pHexp + A (3.1)
At constant ionic strength, A is independent of pH. Empirical formulas exist to calculate A
from given concentrations of pure electrolytes such as NaCl. Due to the complexity of the
diluted Gipshut solution, the correction parameter A was determined for this system
experimentally by measuring the pH of solutions with I = 2.63 M and known H+ or OH-
concentrations. For several solutions with different pH, A was determined to be 0.4.
After pre-equilibration, U(VI), Np(VI) or Ca(II) were added to the suspensions by pipetting
calculated volumes of the stock solutions. In the experiments with Np(VI), 0.01 M NaClO
was added in order to stabilize the hexavalent oxidation state. The sorption time was always
seven days for U(VI) based on kinetic sorption experiments (see chapter 3.2.2.1). For Np(VI),
the sorption time was only three days due to the short half-life of 239Np. Sorption time for
Ca(II) was one day. During this time the samples were rotated in an end-over-end shaker.
20
For phase separation, U(VI) and Ca(II) samples were centrifuged for 30 min at 6800×g in an
Avanti J-20 XP centrifuge (Beckman Coulter). Photon correlation spectroscopy (PCS)
measurements (Zetasizer Nano ZS, Malvern Instruments) showed that this procedure led to a
sufficient phase separation, leaving no measurable particle fraction in solution. Np(VI)
samples were separated for 60 min at 3770×g in a SIGMA 3K30 centrifuge (Sigma
Laborzentrifugen GmbH, Osterode, Germany).
Unat concentrations in the supernatants were determined by ICP-MS (see above). 233U
concentrations applied for the sorption isotherms were derived from liquid scintillation
counting (LSC) with a Hidex 300 SL instrument (Turku, Finland), using an Ultima Gold
scintillation cocktail (PerkinElmer). Using the same scintillation cocktail, 45Ca concentrations
in the supernatant were measured with a Winspectral 1414 liquid scintillation
counter (PerkinElmer). Equilibrium concentrations of 239Np after sorption were determined
-ray spectroscopy, using a HPGe (GMX-13180- -ray
detector, Canberra InSpector 2000 (model IN2K, Canberra Industries, Inc., USA). The
counting time was adjusted for every measurement so that both peaks at the characteristic
gamma lines at 103.4 and 106.1 keV featured at minimum 10,000 counts each.
From the radionuclide equilibrium concentration (ceq) and the initial radionuclide
concentration (c0) [M] the percentage of radionuclide (RN) sorption is calculated according to
equation (3.2).
(3.2)
Furthermore, Kd values are determined using equation (3.3)
(3.3)
where V [L] is the volume of the solution and m [kg] the mass of the solid.
Kd values strongly depend on the experimental conditions (pH, ionic strength, metal
concentration, temperature, present ligands, competing ions) and are therefore not applicable
for extrapolation. The dependence of sorption on the metal concentration can be expressed
with sorption isotherms. If the amount of substance sorbed on the solid in equilibrium aeq is
linearly dependent on the equilibrium concentration of substance in the solution ceq, sorption
can be described by the linear Henry isotherm (Henry, 1803) (equation (3.4)).
(3.4)
In natural systems, however, sorption mechanisms are quite complex, which calls for more
sophisticated sorption isotherms, considering more parameters. The most commonly used
isotherms are the Freundlich and the Langmuir isotherm. The Freundlich isotherm (equation
3 U(VI) retention by Ca-bentonite at (hyper)alkaline conditions 21
(3.5)) considers interactions between the sorptive and ions that have already been adsorbed.
The more ions/molecules are already adsorbed, the lower is the chance that additional
sorption can take place.
(3.5)
KF is the Freundlich coefficient [m3/kg] and nF is the Freundlich exponent [-] with n < 1
(Stumm, 1992). The Langmuir isotherm (equation (3.6)) takes into account that there is
saturation at the surface due to limited sorption sites by adding the parameter am, representing
the maximum amount of substance that can be sorbed onto the solid. b is the Langmuir
sorption coefficient (Langmuir, 1918).
(3.6)
In order to evaluate the extent of U(VI) sorption onto the vial walls, samples without mineral
phase (only background electrolyte and radionuclide) were prepared and treated equivalently
to the sorption samples. In the absence of CO2, the loss of U(VI) from the solution to the vial
walls was significant. However, this effect only occurred when the mineral phase was absent.
This was proven by treating the used and washed vials with 1 M HNO3. While for the sample
vials without mineral phase, the removed U(VI) could be fully retrieved, no U(VI) was
detected after treating the sorption sample vials. Consequently, U(VI) sorption on the vial
walls can be considered as insignificant as long as the sorbing mineral is present.
22
Table 3-3: Overview of all performed batch sorption experiments including experiments described in chapter 4 and chapter 5. ‘N2’ refers to experiments in the absence of CO2 (minimal carbonate concentration from bentonite leaching), ‘LC’ to low carbonate concentration (1 mM) and ‘HC’ to high carbonate concentration (100 mM). ‘Sorp.’ = Sorptive, ‘dil. GHS’ = dil. Gipshut solution, ‘ISA’ = Isosaccharinic acid.
+
3 U(VI) retention by Ca-bentonite at (hyper)alkaline conditions 23
3.1.3.1. S/L ratio dependence
In order to determine a reasonable solid to liquid ratio (S/L ratio) for all following
experiments, the sorption of U(VI) by Ca-bentonite was tested with S/L ratios of 3, 5, 9, 13
and 20 g/L, both in the absence of CO2 as well as at low carbonate concentration, at
equilibrium pH of the Ca-bentonite in the diluted Gipshut solution (pH 8). Additional
experiments were performed at pH 10.5 at S/L ratios of 0.1, 0.5, 1 and 5 g/L. The U(VI)
concentration was 1×10⁻⁶ M in the presence and 5×10⁻⁷ M in the absence of CO2.
The effect of the solid to liquid ratio on Ca(II) sorption on Ca-bentonite was investigated at
pH 10 in a 2×10⁻⁴ M CaCl2 solution with a spike of 1×10-12 M 45Ca. S/L ratios of 0.2, 1, 2, 10
and 20 g/L were achieved by weighing in different amounts of Ca-bentonite powder.
3.1.3.2. Kinetic sorption experiments
The kinetics of the U(VI) sorption process on Ca-bentonite in the diluted Gipshut solution
was studied by taking and analyzing aliquots from bentonite suspensions (10 g/L) at different
times (1 h, 6 h, 1, 2, 3, 4, 7 days) after the addition of uranium. Such kinetic series were
performed in the absence of CO2 ([U] = 5×10⁻⁷ M) at pH 8, 10.5 and 12.5, at low carbonate
concentration ([U] = 1×10⁻⁶ M) at pH 8 and at high carbonate concentration ([U] = 1×10⁻⁶ M)
at pH 12.5.
3.1.3.3. Sorption isotherms
At the high ionic strength of the diluted Gipshut solution, ICP-MS is not suitable for
determination of U(VI) concentrations < 1×10⁻⁷ M, since operation of the instrument in this
case requires strong dilution. Therefore, 233U was used as a tracer for U(VI) sorption
isotherms and 233U(VI) concentrations were determined with liquid scintillation counting.
U(VI) sorption isotherms on Ca-bentonite were recorded at pH 8 both in the absence of CO2
and at low carbonate concentration with [233U]U(VI) concentrations of 1×10⁻⁹ M to
3.2×10⁻⁶ M and 1×10⁻⁹ M to 3.2×10⁻⁴ M, respectively. Additional sorption isotherms at pH
10.5 and 12.5 were recorded in the absence of CO2.
3.1.3.4. pH dependency of sorption
U(VI) sorption on Ca-bentonite as a function of pH was investigated in diluted Gipshut
solution and 0.1 M NaCl at a S/L ratio of 10 g/L in the absence of CO2 ([U] = 5×10⁻⁷ M), at
low carbonate concentration ([U] = 1×10⁻⁶ M) and at high carbonate concentration
([U] = 1×10⁻⁶ M), each in the pH range 8-13, with increments of 0.5.
The influence of isosaccharinic acid on U(VI) retention in this system was studied in three
additional pH-edges with ISA concentrations of 5×10⁻⁴, 5×10⁻³ and 5×10⁻² M (corresponding
to U:ISA ratios of 1:1,000, 1:10,000 and 1:100,000), achieved by addition of calculated
24
aliquots of the ISA stock solution after two weeks of pre-equilibration of Ca-bentonite
suspensions. After another week of reaction time U(VI) was finally added to the suspensions.
The influence of calcium on U(VI) sorption was investigated in a number of pH-dependent
sorption experiments with different minerals and different background electrolytes. These
experiments include sorption on Ca-bentonite in 0.1 M NaCl (pH 8-13), on Na-
montmorillonite in 0.1 and 2.6 M NaCl (pH 8-13), on kaolinite in 0.1 M NaCl and 0.1 M
NaCl + 0.02 M CaCl2 (pH 10-13) and on muscovite in 0.1 M NaCl, 0.1 M NaCl + 0.02 M
CaCl2 and 0.1 M NaCl + 0.02 M SrCl2 (pH 8-13).
Np(VI) sorption on muscovite as a function of pH (pH 8-13, increments of 0.5) was
investigated in 0.1 M NaCl and in 0.1 M NaCl + 0.02 M CaCl2, both in the absence of CO2
(Ar glove box) and at an initial Np(VI) concentration of 1×10-11 M.
Ca(II) sorption experiments on Ca-bentonite (10 g/L) as a function of pH (pH 8-13) were
performed in the absence of CO2 (N2 glove box) in 2×10⁻⁴ M CaCl2 spiked with 1×10-12 M 45Ca.
3.1.3.5. Desorption
The stability and reversibility of U(VI) sorption on Ca-bentonite at pH 11 in the absence of
CO2 was tested in batch desorption experiments. After performing sorption experiments in
diluted Gipshut solution (as described in chapter 3.1.3.4), the samples were centrifuged for 10
min at 3000×g (Avanti J-20 XP) and the supernatant was removed. After that, 10 mL of four
different U(VI)-free solutions (dil. Gipshut solution at pH 11 and 13, 5 M NaCl and 1 M
HNO3) were added and the U-loaded Ca-bentonite was resuspended. After one week of
reaction time the supernatant was analyzed for remobilized U(VI) with ICP-MS.
3.1.4. Solubility tests
Samples without mineral powder were prepared in order to investigate the solubility of U(VI)
in the bentonite leachate under the given experimental conditions. As polypropylene
centrifuge tubes showed significant uptake of U(VI) in the absence of the mineral, for these
experiments fluorinated ethylene propylene (FEP) vials (Thermo Scientific Nalgene,
Waltham, USA) were used, featuring an inert surface that minimizes uranium adsorption.
Leachates of Ca-bentonite were produced at different pH values by contacting it with diluted
Gipshut solution (10 g/L) for 2 weeks with continuous pH adjustments (pH 8 12.5,
increments of 0.5). After phase separation, U(VI) was added to 10 mL of the leachate to reach
a U(VI) concentration of 5×10⁻⁷ M. Seven days after U(VI) addition, the samples were
ultracentrifuged (60 min, 187,000×g, Optima XL 100K, Beckman Coulter) and the
supernatants were analyzed for uranium with ICP-MS. The solubility experiments were
conducted in the absence of CO2 (N2 glove box).
3 U(VI) retention by Ca-bentonite at (hyper)alkaline conditions 25
3.1.5. TRLFS
The aqueous speciation of U(VI) in the diluted Gipshut solution was investigated with non-
ex = 266 nm. Measurements were performed in the absence of CO2, at
low and at high carbonate concentrations, equivalent to the pH-dependent sorption studies.
Batch samples with uranium concentrations of 5×10⁻⁷ M in diluted Gipshut solution were
prepared in FEP vials at pH 8-13. After 7 days, with frequent pH adjustments, 1 mL of each
sample was filled in a polystyrene one time cuvette (Carl Roth, Karlsruhe, Germany) and
quick-freezed with liquid nitrogen. TRLFS measurements were performed at 153 K by using
a cryogenic cooling system. The laser system used was a Nd:YAG laser (Minilite high-energy
solid-state laser; Continuum, San Jose, USA) as described in Steudtner et al. (2011) operating
at an average pulsed energy of 0.3 mJ. The emission of the samples was recorded using an
iHR550 spectrograph (HORIBA Jobin Yvon, Bensheim, Germany) and an ICCD camera
(HORIBA Jobin Yvon). A gate width of 2000 s and a slit width to the spectrograph of
2000 m were chosen. Spectra were recorded at different delay times (ti), defined by the
equation ti = + i4/2000, with i being the step number. At each time step, 100
measurements were averaged. Peak positions were identified from second derivatives of FFT-
filter smoothed spectra by determining their negative maxima. Luminescence lifetimes were
obtained by plotting cumulative intensities at each time step against delay time. Data points
were then fitted exponentially.
Site-selective TRLFS was applied to investigate the U(VI) species sorbed on the surface of
Ca-bentonite, muscovite and kaolinite. Samples were prepared in the absence of CO2 as
described in chapter 3.1.3, but with lower S/L ratio (0.3 g/L) in order to increase the U(VI)
surface coverage. Two samples were prepared with Ca-bentonite in diluted Gipshut solution
at pH 11, where sorption is at maximum: One with the same U(VI) concentration as in the
pH-dependent sorption experiments (5×10⁻⁷ M) and one with a U(VI) concentration two
orders of magnitude higher than that (5×10⁻⁵ M) to provoke U(VI) precipitation for
comparison. U(VI) sorption on muscovite was investigated in 0.1 M NaCl at pH 11 and in
0.1 M NaCl + 0.02 M CaCl2 at pH 11 and 12. Kaolinite samples were prepared in 0.1 M NaCl
at pH 10 and in 0.1 M NaCl + 0.02 M CaCl2 at pH 12. After ultracentrifugation (187,000×g)
each wet paste pellet was transferred into a copper sample holder with a sealable quartz glass
lid. Measurements were performed with a pulsed Nd:YAG (Continuum Surelite II, San Jose,
USA) pumped dye laser setup (Radiant Dyes Narrow Scan K, Wermelskirchen, Germany).
The emitted luminescence light was directed into a spectrograph (Shamrock 303iAndor
Oxford Instruments, Abingdon, United Kingdom) equipped with a polychromator with 300,
600, and 1200 lines/mm gratings, and the emission was monitored with an intensified CCD
camera (Andor iStar, Oxford Instruments) 10
window of 10 ms. The laser pulse energy and the exact excitation wavelength were monitored
in every measurement with an optical power meter (Newport 1918-R, Irvine, USA) and a
wavelength meter (High Finesse WS-5, Tübingen, Germany), respectively. Spectra were
26
recorded at excitation wavelengths between 460 and 520 nm with a step size of 0.2 nm.
Additionally, time-resolved luminescence spectra were recorded at selected excitation
wavelengths with a temporal step size of 10 s. To achieve the desired spectral resolution the
solid samples were cooled to 10 K in a helium-refrigerated cryostat.
3.1.6. In situ ATR FT-IR spectroscopy
Infrared spectra were measured from 1800 to 800 cm 1 on a Bruker Vertex 80/v vacuum
spectrometer equipped with a Mercury Cadmium Telluride (MCT) detector. A KRS-5
diamond crystal was used and 256 scans were averaged for each spectrum. 2.5 L of a 2.5 g/L
Ca-bentonite suspension in 0.1 M NaCl was evaporated to leave a mineral film on the surface
of the ATR diamond crystal. First, the mineral film was conditioned by rinsing with the blank
er, sorption was induced by rinsing
the mineral film for 120 min with 0.1 M NaCl, containing 2×10⁻⁵ M U(VI). Finally, the
mineral film was flushed again with 0.1 M NaCl for 60 min. Three samples at different pH
(6.8, 8 and 10.5) were prepared in the absence of CO2 in FEP vials (Thermo Scientific
Nalgene) and the pH was adjusted several times until a constant value was obtained. The
U(VI) containing solution was ultracentrifuged (60 min, 187,000×g, Optima XL 100K,
Beckman Coulter) directly before the experiment in order to remove colloids from solution
which might have been formed due to reduced U(VI) solubility at elevated pH.
3.1.7. EXAFS spectroscopy
Batch sorption samples (U(VI) on Ca-bentonite) for the EXAFS measurements were prepared
as described in chapter 3.1.3. A total of 10 samples (Table 3-4) with variable pH and
carbonate concentration was prepared with a S/L ratio of 0.3 g/L, leading to sufficiently high
surface coverage, despite the low initial U(VI) concentrations. In order to achieve such a low
S/L ratio with sufficient solid material (150 mg), the volume of suspensions was increased to
500 mL (polypropylene centrifuge tubes, Corning, Oneonta, USA). Phase separation was
done with ultracentrifugation (see above), after which the Ca-bentonite wet paste was
transferred into polyethylene (PE) sample holders. Samples were covered with capton tape,
enclosed with a PE cap and finally sealed by soldering.
The U LIII-edge (17,166 eV) EXAFS spectra were recorded at the Rossendorf Beamline
(ROBL, BM20) at the European Synchrotron Radiation Facility (ESRF) (Matz et al., 1999),
operated at 6 GeV and an electron current of 200 mA. For rejection of higher harmonics two
Rh-coated mirrors were used and the incident white X-rays were monochromatized with a
liquid nitrogen cooled Si(111) double crystal monochromator. Samples were measured under
cryogenic conditions (15 K) by using a closed cycle He-cryostat. In order to increase the
signal-to-noise ratio for each sample, a maximum of 11 fluorescence spectra were recorded by
counting the signal of the U L 1,2 fluorescence lines with a 13-element Ge-detector. For
energy calibration the absorption of a Y metal foil at the K-edge (17,038 eV) was measured
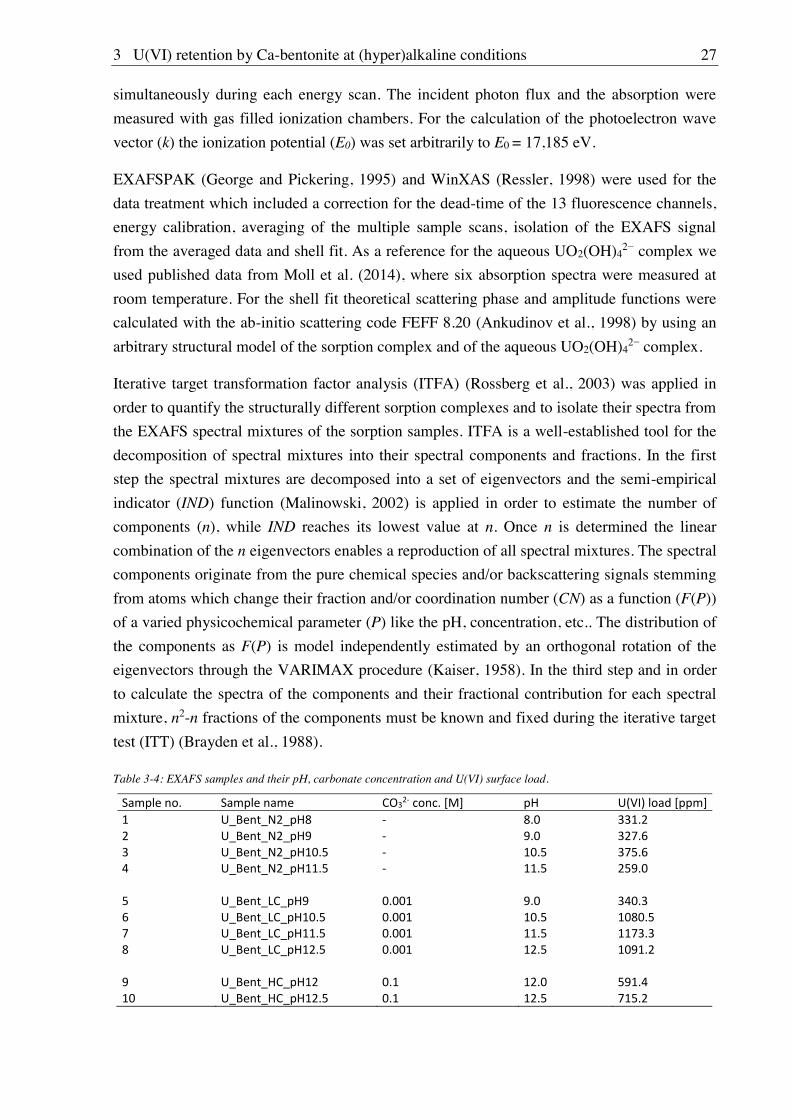
3 U(VI) retention by Ca-bentonite at (hyper)alkaline conditions 27
simultaneously during each energy scan. The incident photon flux and the absorption were
measured with gas filled ionization chambers. For the calculation of the photoelectron wave
vector (k) the ionization potential (E0) was set arbitrarily to E0 = 17,185 eV.
EXAFSPAK (George and Pickering, 1995) and WinXAS (Ressler, 1998) were used for the
data treatment which included a correction for the dead-time of the 13 fluorescence channels,
energy calibration, averaging of the multiple sample scans, isolation of the EXAFS signal
from the averaged data and shell fit. As a reference for the aqueous UO2(OH)42 complex we
used published data from Moll et al. (2014), where six absorption spectra were measured at
room temperature. For the shell fit theoretical scattering phase and amplitude functions were
calculated with the ab-initio scattering code FEFF 8.20 (Ankudinov et al., 1998) by using an
arbitrary structural model of the sorption complex and of the aqueous UO2(OH)42 complex.
Iterative target transformation factor analysis (ITFA) (Rossberg et al., 2003) was applied in
order to quantify the structurally different sorption complexes and to isolate their spectra from
the EXAFS spectral mixtures of the sorption samples. ITFA is a well-established tool for the
decomposition of spectral mixtures into their spectral components and fractions. In the first
step the spectral mixtures are decomposed into a set of eigenvectors and the semi-empirical
indicator (IND) function (Malinowski, 2002) is applied in order to estimate the number of
components (n), while IND reaches its lowest value at n. Once n is determined the linear
combination of the n eigenvectors enables a reproduction of all spectral mixtures. The spectral
components originate from the pure chemical species and/or backscattering signals stemming
from atoms which change their fraction and/or coordination number (CN) as a function (F(P))
of a varied physicochemical parameter (P) like the pH, concentration, etc.. The distribution of
the components as F(P) is model independently estimated by an orthogonal rotation of the
eigenvectors through the VARIMAX procedure (Kaiser, 1958). In the third step and in order
to calculate the spectra of the components and their fractional contribution for each spectral
mixture, n2-n fractions of the components must be known and fixed during the iterative target
test (ITT) (Brayden et al., 1988).
Table 3-4: EXAFS samples and their pH, carbonate concentration and U(VI) surface load.
28
3.1.8. CTR/RAXR
X-ray reflectivity measurements were conducted at the GeoSoilEnviroCARS (GSECARS)
beamline 13-ID-C at the Advanced Photon Source (APS, Lemont, USA). The used
diffractometer was a Newport 6-circle kappa and the desired wavelength of the X-rays was
controlled by a liquid nitrogen cooled Si (111) double crystal monochromator. The beam is
collimated both vertically and horizontally using a pair of 1-m long Rh-coated silicon
changed repeatedly. Sample stability during the experiments was monitored by multiple
measurements of both CTR and RAXR data sets. The reflectivity data were collected with a
Dectris PILATUS 100 K 2D pixel array detector. CTR scans were recorded by varying the
momentum transfer between 0.09 and 5.48 Å-1 at a fixed incident photon energy of 14 keV.
RAXR spectra were measured by varying the incident X-ray energy around the LIII absorption
edge of U(VI) (16.87 to 17.47 keV) at different fixed momentum transfer between 0.13 and
3.62 Å-1.
U(VI) batch sorption samples on muscovite single crystals were prepared prior to the
measurements. At first, two different electrolyte solutions, 0.1 M NaCl and 0.1 M NaCl +
0.02 M CaCl2, were adjusted to pH 11. Then muscovite single crystals were freshly cleaved
and immersed in the solutions. Finally, calculated amounts of a UO2(NO3)2 stock solution
were added in order to reach a U(VI) concentration of 5×10⁻⁵ M. One blank sample was
prepared without addition of U(VI). Sorption time was 24 h, before the samples were
transferred into a sample cell. After 20 L of the reaction solution were pipetted on top of the
sample, it was covered with a Kapton film and sealed with two additional Kapton domes (for
details about the sample holder, the reader is referred to Schmidt et al. (2012)). The three
samples which were prepared for measurement were (1) U(VI) sorption on muscovite at pH
11 in 0.1 M NaCl + 0.02 M CaCl2, (2) U(VI) sorption on muscovite at pH 11 in 0.1 M NaCl,
and (3) muscovite at pH 11 in 0.1 M NaCl + 0.02 M CaCl2.
3 U(VI) retention by Ca-bentonite at (hyper)alkaline conditions 29
3.2. Results and discussion
3.2.1. Bentonite surface charge and stability at (hyper)alkaline conditions
3.2.1.1. Zeta potential
Zeta potential measurements of Ca-bentonite in 0.1 M NaCl show a negative surface charge
over the entire pH range, as it can be expected from the permanent negative charge of 2:1 clay
minerals due to isomorphous substitution of cations within the octahedral and tetrahedral
layers (Figure 3-3). With increasing pH, surface charge becomes increasingly negative,
reaching approximately -40 mV at pH ~12.5. A less negative surface charge was observed at
pH ~13 due to extremely high ionic strength of the solution, caused by the addition of large
amounts of NaOH. At high ionic strength the potential is generally dragged towards neutral
charge due to the high density of cations close to the surface. The influence of the additional
presence of bivalent cations (Ca2+ and Sr2+) on the zeta potential is presented in chapter 4.2.1.
7 8 9 10 11 12 13-50
-40
-30
-20
-10
0
zeta
pot
entia
l [m
V]
pH
Figure 3-3: Surface potential of Ca-bentonite (0.1 g/L) as a function of pH in 0.1 M NaCl.
3.2.1.2. Powder X-ray diffraction (PXRD)
Powder XRD diffractograms of Ca-bentonite leached in diluted Gipshut solution between pH
8.5 and 13 have a very similar appearance, featuring the same main peaks (Figure 3-4). Major
identified phases are quartz (peaks at 2 = 20.8, 26.6 and 50.2°) and the clay minerals
montmorillonite (peaks at 2 = 5.7, 19.8, 35.1 and 61.9°), illite and muscovite. Illite and
muscovite have a similar diffraction behavior so that some peaks cannot be unambiguously
attributed. No alteration of mineral composition (dissolution, precipitation, recrystallization)
with increasing pH was detected up to pH 12.5. Additional peaks appear at 2 = 11.2° and
27.4° at pH 12.5 and 13. These are attributed to the mineral hydrotalcite, which has been
reported to precipitate from alkaline fluids in contact with bentonite (Fernández et al., 2009).
30
0 5 10 15 20 25 30 35 40 45 50 55 60 65 70
H H
pH 13
pH 12
pH 12.5
pH 11.5
pH 11
pH 10.5
pH 10
pH 9
pH 9.5
II QQ QM MMno
rmal
ized
inte
nsity
2 Theta [degree]
M
pH 8.5
Figure 3-4: X-ray diffractograms of Ca-bentonite treated with diluted Gipshut solution for 3 weeks at pH 8.5-13. Mineral phases assigned to the peaks: M = montmorillonite, Q = quartz, I = illite or muscovite, H = hydrotalcite.
At pH 13 additionally portlandite Ca(OH)2 precipitates, being responsible for the appearance
of peaks at 56.6° and 60.0°. The results suggest a general stability of bentonite up to pH 12.5.
This is in accordance with several studies where treatment with alkaline fluids of pH 12.5
only led to minimal alteration of smectites or left the bentonite virtually unchanged
(Fernández et al., 2009; Milodowski et al., 2016; Vuorinen et al., 2006). Additionally, Schatz
et al. (2013) found that Ca-montmorillonite is more stable towards chemical erosion than Na-
montmorillonite. Severe alterations only occur at even higher pH values (>13), higher
temperatures and over longer timespans. However, it has to be mentioned, that these studies
investigated systems with much higher S/L ratios, making direct comparison difficult.
Furthermore, PXRD is not sensitive for amorphous phases, such as calcium silicate hydrate
(C-S-H). Consequently, partial mineral dissolution and precipitation of amorphous minerals is
possible. This is discussed with the results of the leaching experiment in chapter 3.2.1.3.
3.2.1.3. Leaching
Ions leached out of the Ca-bentonite in 0.1 M NaCl and diluted Gipshut solution to noticeable
amounts are Ca, Mg, Si and Al (Figure 3-5). The kinetic leaching experiment at pH 8 showed
that the concentrations of dissolved elements reach equilibrium after short time.
Concentrations can be regarded as stable after 1 week within the margin of error (Figure
3-5a). Concentrations of leached carbonate, resulting from the dissolution of small fractions
of calcite contained in the bentonite were determined to be at maximum 2.9×10⁻⁴ M. The most
strongly leached element is calcium, which is predominantly mobilized from the interlayers of
Ca-montmorillonite. However, calcium is removed from the solution in the presence of
3 U(VI) retention by Ca-bentonite at (hyper)alkaline conditions 31
carbonate by precipitation of calcite above pH 8.5 (not shown). In the absence of carbonate in
diluted Gipshut solution (where calcium concentrations exceed 0.02 M) Ca precipitates as
portlandite (Ca(OH)2) above pH 12 (not shown). This can be observed with the naked eye in
samples at pH 12.5 and 13. In 0.1 M NaCl, leached calcium concentrations do not exceed the
solubility limit with respect to portlandite (1.3 mM). Nevertheless, the amount of dissolved
calcium decreases with increasing pH (Figure 3-5b). A possible explanation for this trend is
the formation of calcium (aluminate) silicate hydrate (C-(A-)S-H) phases at hyperalkaline
conditions. This would require the availability of silicon. Al and Si concentrations in the
leachates are very low up to pH 12. Only at pH 12.5 and 13 a significant increase in
concentration of both elements can be observed (Figure 3-5b). This would technically suggest
a stability of the montmorillonite up to pH 12. However, in the light of calcium
concentrations decreasing strongly in the solution at pH>10, Al and Si might be released from
the montmorillonite already at lower pH but are immediately bound in the form of C-A-S-H.
Both Al and Si appear then in solution at pH 12.5 and 13, when the availability of calcium
becomes the limiting factor for C-(A-)S-H formation. In line with this hypothesis, significant
release of Al and Si from kaolinite was observed already at pH>10 by Huittinen et al. (2012).
C-(A-)S-H phases cannot be detected with PXRD as they have an amorphous structure.
The leaching experiments show an apparent stability of the Ca-bentonite up to pH 12.5.
However, indirect proof for the release of Al and Si and formation of C-A-S-H phases at
pH>10 arises from the decreasing calcium concentrations. Consequently, C-A-S-H has to be
considered as an additional sorbing mineral in the sorption experiments. Nevertheless, in
relation to the remaining clay mineral fraction this can be considered as a minor contribution.
Also the results of the site-selective TRLFS measurements underpin the assumption that
U(VI) sorption on clay minerals is still the dominating process (chapter 3.2.2.4).
8 9 10 11 12 130.000
0.001
0.002
0.003
0.004
0.005
0 5 10 15 20 25
0.000
0.001
0.002
0.003(a)
pH
Mg,
Al,
K, C
a co
ncen
tratio
n [m
ol/L
] Mg Al K Ca
(b)
0.000
0.002
0.004
0.006
0.008
0.010
0.012
Si
Si c
once
ntra
tion
[mol
/L]
Mg Al K Ca Si
time [d]
con
cent
ratio
n [m
ol/L
]
Figure 3-5: Concentration of ions leached out of Ca-bentonite (10 g/L) (difference to initial concentrations) in the absence of CO2 in diluted Gipshut solution at pH 8 as a function of contact time (a) and in 0.1 M NaCl as a function of pH after three weeks of contact time (b).
32
3.2.2. Sorption of U(VI) on Ca-bentonite at (hyper)alkaline conditions
3.2.2.1. Batch sorption experiments
S/L ratio dependence
In the absence of CO2, U(VI) sorption is independent of the S/L ratio in the probed range,
both at pH 8 (3-20 g/L) and at pH 10.5 (0.1-5 g/L), with a sorption percentage of approx. 80%
and close to 100%, respectively (Figure 3-6).
at low carbonate concentration at pH 8, U(VI) sorption increases with increasing
S/L ratio from 38% at 3 g/L to 64% at 20 g/L. S
Based
on these results a S/L ratio of 10 g/L was chosen for all following batch sorption experiments
with Ca-bentonite.
0 5 10 15 20
0
20
40
60
80
100
absence of CO2, pH 8 absence of CO2, pH 10.5 low carbonate concentration, pH 8
U(V
I) re
mov
ed [%
]
S/L ratio [g/L]
Figure 3-6: Percentage of U(VI) sorbed on Ca-bentonite in diluted Gipshut solution as a function of S/L ratio in the absence of CO2 ([U(VI)] = 5×10⁻⁷ M) at pH 8 and 10.5 and at low carbonate concentration (1 mM) ([U(VI)] = 1×10⁻⁶ M) at pH 8.
Kinetic sorption experiments
All kinetic sorption experiments show that the U(VI) sorption process is fairly fast. At low
carbonate concentration at pH 8 half of the maximum sorption of 62% is already reached after
one hour and sorption is almost completed after two days. In the absence of CO2 (pH 8, 10.5
3 U(VI) retention by Ca-bentonite at (hyper)alkaline conditions 33
and 12.5) and at high carbonate concentration at pH 12.5 the U(VI) sorption process is even
faster. After one hour, sorption is already almost completed and it finally reaches a plateau
after one day (Figure 3-7). The similarity between the kinetic behavior in the system without
carbonate and the system with carbonate at pH 12.5 indicates that the underlying retention
mechanisms under these conditions are similar. This will also be discussed in paragraph
and in chapter 3.2.2.2. To guarantee that the reaction has reached
equilibrium, sorption time in all other experiments was chosen to be 7 days.
0 1 2 3 4 5 6 7
0
20
40
60
80
100
absence of CO2, pH 8 absence of CO2, pH 10.5 absence of CO2, pH 12.5 low carbonate concentration, pH 8 high carbonate concentration, pH 12.5
U(V
I) re
mov
ed [%
]
sorption time [d]
Figure 3-7: Percentage of U(VI) sorbed on Ca-bentonite in diluted Gipshut solution at different pH in the absence of CO2 ([U(VI)] = 5×10⁻⁷ M) and at low and high carbonate concentrations ([U(VI)] = 1×10⁻⁶ M) as a function of sorption time.
Sorption isotherms
When plotting the logarithm of the equilibrium amount of uranium sorbed on the bentonite aeq
against the logarithm of the equilibrium uranium concentration in the solution ceq (Figure
3-8), the slope of a linear fit represents the Freundlich exponent n (eq. (3.7)). If the slope of
the fit is 1, the sorption behavior can be described as linear, as the Freundlich isotherm
(eq. (3.5)) then equals the linear Henry isotherm (eq. (3.4)). In that special case, the y-
intercept represents the log(Kd) value.
log(aeq) = n × log(ceq) + log(kF) (3.7)
In the absence of CO2, n was determined to be 0.99 at pH 8 and 1.03 at pH 12.5, indicating a
linear sorption behavior (Figure 3-8a,b). On the contrary, at low carbonate concentration at
pH 8 sorption cannot be described as linear since a Freundlich exponent of 0.89 was obtained.
The Kd values were derived by forcing the fit through the data points to have a slope of 1.
Resulting log(Kd) values were 2.19 log(L/kg) at low carbonate concentration at pH 8 and 3.03
and 3.06 log(L/kg) in the absence of CO2 at pH 8 and 12.5, respectively. Consequently, U(VI)
34
sorption on Ca-bentonite at pH 8 is much weaker in the presence of carbonate, which is in
accordance with literature studies.
Another sorption isotherm was recorded in the absence of CO2 at pH 10.5. In the entire U(VI)
concentration range of 1×10⁻⁹ M to 3.2×10⁻⁶ M the uranium was removed to 100%. As no
uranium was left in solution after the experiment (ceq = 0), irrespective of the initial
concentration, no isotherm could be plotted. Nevertheless, this observation contains valuable
information. The complete retention over the entire concentration range suggests that the
1×10⁻⁸ M) is probably not due to
precipitation, because the same removal is observed when oversaturation can be ruled out (at
[U(VI)] ×10-8 M). Therefore, a uniform retention mechanism can be assumed for the entire
U(VI) concentration range studied - most probably adsorption (discussed in the following
chapters).
Figure 3-8: Sorption isotherms at pH 8 and pH 12.5. Red lines show a linear fit through the data points. Dashed blue lines represent a fit with a forced slope of 1. (a) Sorption isotherm in the absence of CO2 at pH 8, (b) Sorption isotherm in the absence of CO2 at pH 12.5. (c) Sorption isotherm at low carbonate concentration at pH 8.
3 U(VI) retention by Ca-bentonite at (hyper)alkaline conditions 35
-
pH dependency of sorption
Batch sorption experiments as a function of pH exhibit a complex U(VI) retention behavior
depending on the amount of carbonate present in solution (Figure 3-9). In the absence of CO2,
U(VI) retention is approx. 90% at pH 8-9 (squares in Figure 3-9). At higher pH, sorption even
increases, forming a plateau of complete retention from pH 9.5 to about pH 12. At pH 12,
U(VI) sorption decreases again to only 50% at pH 13. At low carbonate concentration
(1 mM), U(VI) retention is low (approx. 20%) at pH 8-9. Going to higher pH values, the
retention increases drastically, following a similar pH-dependent trend as in the absence of
CO2. Also here a plateau of complete sorption is observed at pH 10-12, followed by a
pronounced drop at pH 12 (triangles in Figure 3-9). When carbonate concentration is high
(0.1 M), U(VI) retention remains on a very low level (< 10%) up to pH 11. Thereafter it
increases, reaching 80% at pH 12 (diamonds in Figure 3-9), before dropping again, similar to
the previously described series. The complete U(VI) retention in the absence of CO2 and at
low carbonate concentration corresponds to maximum log(Kd) values of approx. 5-
6 log(L/kg), restricted by the detection limit of the ICP-MS measurements (0.1 g/L). At high
carbonate concentration, the maximum retention at pH 12 corresponds to a log(Kd) value of
2.6 log(L/kg) (Figure 3-10). K-
and
Fritsch (2018) reported -
- K
-
36
8 9 10 11 12 13
0
20
40
60
80
100
absence of CO2
low carbonate concentration2
high carbonate concentration
U(V
I) re
mov
ed [%
]
pH
Figure 3-9: Percentage of U(VI) sorbed on Ca-bentonite (10 g/L) in dil. Gipshut solution (I = 2.63 M) as function of pH and carbonate concentration. Initial U(VI) concentrations were 5×10⁻⁷ M in the absence of CO2 and 1×10⁻⁶ M at low (1 mM) and high (0.1 M) carbonate concentrations.
8 9 10 11 12 130
2
4
6
absence of CO2
low carbonate concentration high carbonate concentration
log(K
d) [log
(L/kg
)]
pH
Figure 3-10: Logarithmized U(VI) distribution coefficients log(Kd) for U(VI) sorbed on Ca-bentonite (10 g/L) plotted as a function of pH and carbonate concentration. Initial U(VI) concentrations were 5×10⁻⁷ M in the absence of CO2 and 1×10⁻⁶ M at low (1 mM) and high (0.1 M) carbonate concentrations.
3 U(VI) retention by Ca-bentonite at (hyper)alkaline conditions 37
K -
The lower U(VI) retention in the presence of carbonate at pH 8 to 9.5 is in
accordance with literature and is attributed to the predominant formation of weakly sorbing
(calcium) uranyl carbonate complexes (Bachmaf et al., 2008; Joseph et al., 2013; Maher et al.,
2013; Marques Fernandes et al., 2012; Richter et al., 2016; Schmeide et al., 2014; Tournassat
et al., 2018). An increase in retention with further increasing pH has not been systematically
reported for such carbonate-containing systems as none of the mentioned studies expands to
the hyperalkaline regime.
Even without discussing the underlying retention mechanism on a molecular level, the
presented batch results alone provide already substantial knowledge gain as they present for
the first time a systematic study of the U(VI) retention by clay rock from weakly alkaline to
hyperalkaline pH. The results show that sorption can be very effective up to pH 12, also in the
presence of carbonate. The decreased U(VI) retention in the presence of carbonate, reported
previously in the literature, does only apply up to a certain pH and is highly dependent on the
amount of carbonate in the solution.
Reasons for the observed differences in sorption behavior as a function of pH and carbonate
concentration are discussed in the following chapters based on U(VI) solubility experiments
and spectroscopic investigations on the aqueous and surface speciation of U(VI).
Desorption
The stability and reversibility of the U(VI) retention at pH 11 in the absence of CO2 was
tested in batch desorption experiments. After performing sorption experiments exactly as
described above, the background electrolyte was exchanged with different U(VI)-free
solutions as described in chapter 3.1.3.5. After one week of reaction time the supernatant was
analyzed for remobilized U(VI).
Exchanging the diluted Gipshut solution with exactly the same electrolyte did not lead to any
remobilization of U(VI) (Figure 3-11). After having reached a steady distribution between the
phases, no force exists that would drive the U(VI) towards the liquid phase again. Also
contact with 5 M NaCl results in 0% desorption (Figure 3-11). Conventionally, an increase in
ionic strength (as here from 2.63 to 5 M) causes a decrease of sorption in the case of outer-
sphere complexation where the high density of solution ions near the surface prevents
electrostatic attachment of U(VI). Consequently, conventional outer-sphere complexation can
be excluded under the given conditions. This retention mechanism was considered unlikely,
because the ionic strength was already very high in the initial sorption experiments (2.63 M).
A change of pH from 11 to 13 of the diluted Gipshut solution resulted in a U(VI)
remobilization of 50.5% (Figure 3-11). This corresponds to the observed amount of sorption
38
at pH 13 in the pH-dependent batch sorption experiment (
) where approx. 50% U(VI) removal from solution was observed. Changing the pH
of a solution is a strong alteration of the chemical system, which can cause even inner-sphere
complexes to desorb. Desorption experiments with 1 M HNO3 prove that all U(VI) was
adsorbed to the Ca-bentonite in the first place and that theoretically 100% are recoverable.
Applying conventional criteria for inner- and outer-sphere surface complexation, the
desorption experiments suggest that at pH 11 all U(VI) is retained in the form of inner-sphere
sorption complexes, as it cannot be remobilized by a change of ionic strength, but only by a
change of pH. However, in the special case of U(VI) sorption at hyperalkaline conditions, this
classical concept has to be reassessed. Conventionally, outer-sphere complexation applies to
cationic metal ions that adsorb to a negatively charged surface. By contrast, at pH 11 the
prevailing U(VI) species are anionic (see also chapter 3.2.2.2). In that case the solution
cations are no longer direct competitors for sorption sites and also do not electrostatically
repel the metal ion. They rather attract the anionic U(VI), possibly even facilitating an
adsorption. Hence, anionic metal ions could possibly form outer-sphere complexes on
negatively charged clay mineral surfaces via bridging cations (such as Ca2+). Such kind of
outer-sphere complexes would then not be influenced negatively by increasing the ionic
strength. Consequently, to unequivocally distinguish the underlying retention mechanisms,
spectroscopic investigations are indispensable.
Figure 3-11: Percentage of U(VI) ([U] = 5×10⁻⁷ M) remobilized after one week of reaction time from Ca-bentonite (10 g/L) after exchanging the background electrolyte (diluted Gipshut solution at pH 11) with different solutions (as indicated in the diagram).
3 U(VI) retention by Ca-bentonite at (hyper)alkaline conditions 39
3.2.2.2. Aqueous speciation of U(VI) investigated with TRLFS
In the absence of CO2, the luminescence spectra of U(VI) in diluted Gipshut solution
measured at 153 K feature a low intensity with a poor spectral resolution (Figure 3-12a). Both
phenomena are characteristic for uranyl hydroxide complexes at alkaline conditions. This has
been reported by Moulin et al. (1998), Martínez-Torrents et al. (2013) and Drobot et al.
(2016), where monomeric hydrolysis species
In spite of the low signal to noise ratio
(particularly up to pH 10), the positions of the first two main peaks could be identified, being
at approx. 500 nm and 521 nm for the samples up to pH 12 (Table 3-5). Drobot et al. (2016)
observed maxima at 499 and 520 nm for UO2(OH)2 (aq) and at 503 and 525 nm for
UO2(OH)3 . Moulin et al. (1998) and Martínez-Torrents et al. (2013) described peaks for
UO2(OH)3 at 499 nm and 519 nm and at 503 and 521 nm, respectively. Luminescence
lifetimes depend on the presence of quenchers and, to a large degree, on the temperature of
the sample. Therefore, comparing lifetimes obtained in different studies is difficult. From the
aforementioned studies only Martínez-Torrents et al. (2013) performed measurements at
cryogenic conditions (10 K). The reported luminescence lifetime of 198 s for
Table 3-5
Martínez-Torrents et al. (2013) UO2(OH)3
In the presence of carbonate, the recorded luminescence emission spectra vary strongly within
the investigated pH range 8-13. Up to pH 10 at low carbonate concentration and up to pH 11
at high carbonate concentration, the shape of the spectra is very similar, exhibiting a well-
resolved spectral splitting (Figure 3-12b,c). Compared to the uranyl aquo ion, these spectra
are shifted towards lower wavelengths, which is characteristic for uranyl carbonate complexes
(Bernhard et al., 2001; Lee and Yun, 2013; Steudtner et al., 2011; Wang et al., 2004). The
obtained peak positions (first two main peaks at approx. 480 and 500 nm) match very well
with literature data for
Table 3-5
- -
40
Another plausible
complex is
Figure 3-12
Figure 3-13
460 480 500 520 540 560 580 600 460 480 500 520 540 560 580 600 460 480 500 520 540 560 580 600
(a) absence of CO2 (c) high carbonate concentration(b) low carbonate concentration
pH 13
norm
aliz
ed in
tens
ity
wavelength [nm]
pH 12
pH 11
pH 10
pH 9
pH 8.5
uranyl aquo ion
pH 13
uranyl aquo ion
pH 8.5
pH 9
pH 10
pH 10.5
pH 12
wavelength [nm]
pH 11
U(V
I)-hy
drox
ides
pH 12.7
pH 12
pH 11.5
pH 11
pH 10.5
pH 10
pH 9
wavelength [nm]
pH 8U(V
I)-ca
rbon
ates
U(V
I)-hy
drox
ides
U(V
I)-hy
drox
ides
U(V
I)-ca
rbon
ates
Figure 3-12: Luminescence spectra of uranyl ([U(VI)] = 5×10⁻⁷ M) in the diluted Gipshut solution as a function of pH in the absence of CO2 (a), at low carbonate concentration (b) and at high carbonate concentration (c).
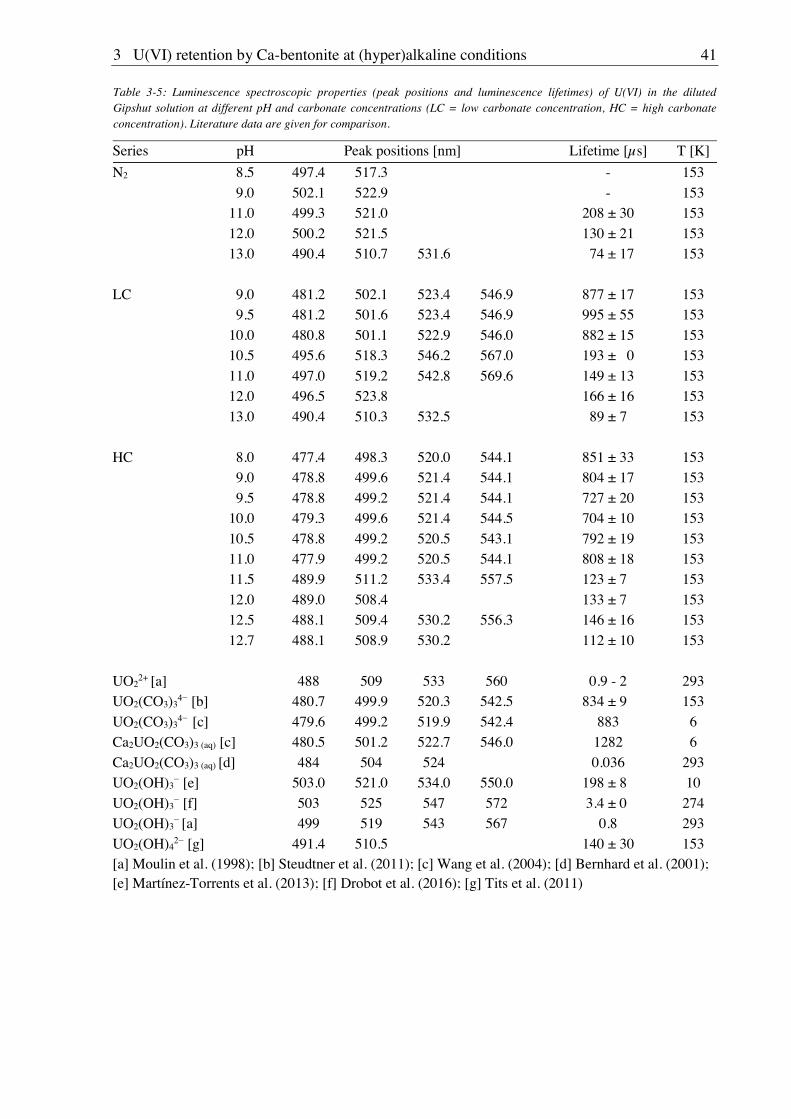
3 U(VI) retention by Ca-bentonite at (hyper)alkaline conditions 41
Table 3-5: Luminescence spectroscopic properties (peak positions and luminescence lifetimes) of U(VI) in the diluted Gipshut solution at different pH and carbonate concentrations (LC = low carbonate concentration, HC = high carbonate concentration). Literature data are given for comparison.
Series pH Peak positions [nm] Lifetime [ s] T [K]
N2 8.5 497.4 517.3 - 153 9.0 502.1 522.9 - 153 11.0 499.3 521.0 208 ± 30 153 12.0 500.2 521.5 130 ± 21 153 13.0 490.4 510.7 531.6 74 ± 17 153 LC 9.0 481.2 502.1 523.4 546.9 877 ± 17 153 9.5 481.2 501.6 523.4 546.9 995 ± 55 153 10.0 480.8 501.1 522.9 546.0 882 ± 15 153 10.5 495.6 518.3 546.2 567.0 193 ± 0 153 11.0 497.0 519.2 542.8 569.6 149 ± 13 153 12.0 496.5 523.8 166 ± 16 153 13.0 490.4 510.3 532.5 89 ± 7 153 HC 8.0 477.4 498.3 520.0 544.1 851 ± 33 153 9.0 478.8 499.6 521.4 544.1 804 ± 17 153 9.5 478.8 499.2 521.4 544.1 727 ± 20 153 10.0 479.3 499.6 521.4 544.5 704 ± 10 153 10.5 478.8 499.2 520.5 543.1 792 ± 19 153 11.0 477.9 499.2 520.5 544.1 808 ± 18 153 11.5 489.9 511.2 533.4 557.5 123 ± 70 153 12.0 489.0 508.4 133 ± 70 153 12.5 488.1 509.4 530.2 556.3 146 ± 16 153 12.7 488.1 508.9 530.2 112 ± 10 153 UO2
2+ [a] 488 509 533 560 0.9 - 2 293 UO2(CO3)3 [b] 480.7 499.9 520.3 542.5 834 ± 90 153 UO2(CO3)3 [c] 479.6 499.2 519.9 542.4 883 6 Ca2UO2(CO3)3 (aq) [c] 480.5 501.2 522.7 546.0 1282 6 Ca2UO2(CO3)3 (aq) [d] 484 504 524 0.036 293 UO2(OH)3 [e] 503.0 521.0 534.0 550.0 198 ± 80 10 UO2(OH)3 [f] 503 525 547 572 3.4 ± 00 274 UO2(OH)3 [a] 499 519 543 567 0.8 293 UO2(OH)4 [g] 491.4 510.5 140 ± 30 153 [a] Moulin et al. (1998); [b] Steudtner et al. (2011); [c] Wang et al. (2004); [d] Bernhard et al. (2001); [e] Martínez-Torrents et al. (2013); [f] Drobot et al. (2016); [g] Tits et al. (2011)
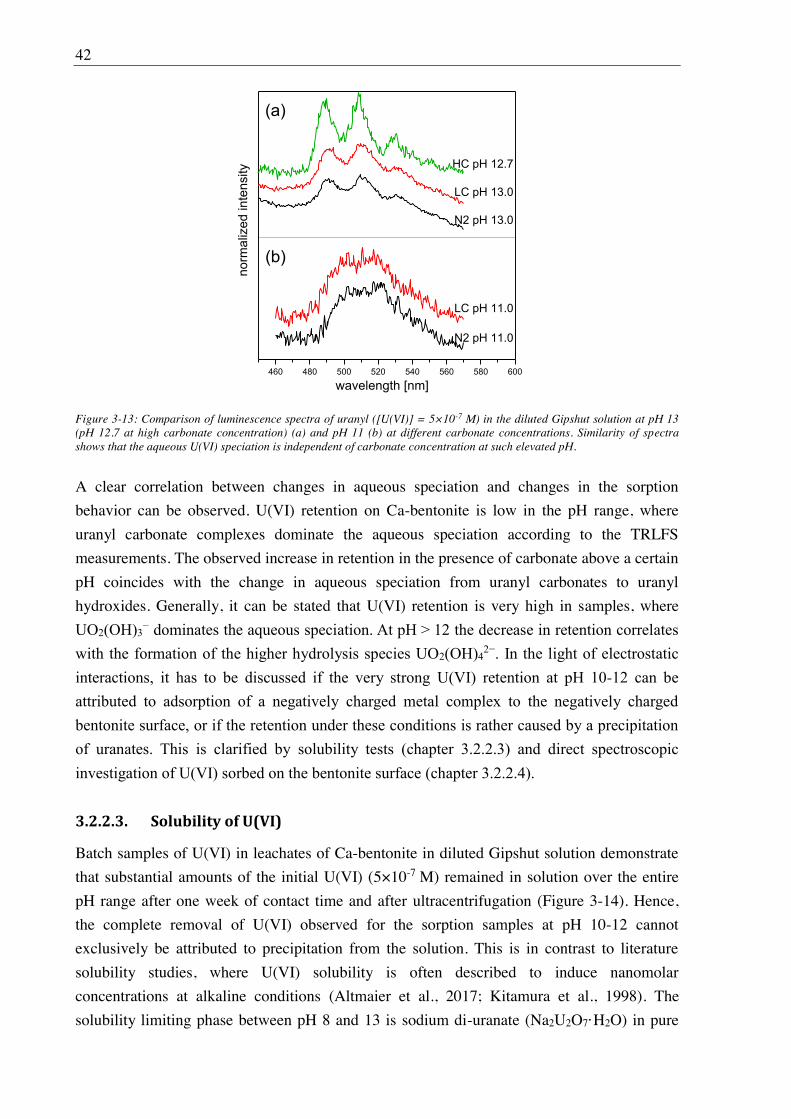
42
460 480 500 520 540 560 580 600
(b)
(a)
LC pH 11.0
N2 pH 11.0
HC pH 12.7
N2 pH 13.0
LC pH 13.0
norm
aliz
ed in
tens
ity
wavelength [nm]
Figure 3-13: Comparison of luminescence spectra of uranyl ([U(VI)] = 5×10⁻⁷ M) in the diluted Gipshut solution at pH 13 (pH 12.7 at high carbonate concentration) (a) and pH 11 (b) at different carbonate concentrations. Similarity of spectra shows that the aqueous U(VI) speciation is independent of carbonate concentration at such elevated pH.
A clear correlation between changes in aqueous speciation and changes in the sorption
behavior can be observed. U(VI) retention on Ca-bentonite is low in the pH range, where
uranyl carbonate complexes dominate the aqueous speciation according to the TRLFS
measurements. The observed increase in retention in the presence of carbonate above a certain
pH coincides with the change in aqueous speciation from uranyl carbonates to uranyl
hydroxides. Generally, it can be stated that U(VI) retention is very high in samples, where
-
3.2.2.3. Solubility of U(VI)
Batch samples of U(VI) in leachates of Ca-bentonite in diluted Gipshut solution demonstrate
that substantial amounts of the initial U(VI) (5×10⁻⁷ M) remained in solution over the entire
pH range after one week of contact time and after ultracentrifugation (Figure 3-14). Hence,
the complete removal of U(VI) observed for the sorption samples at pH 10-12 cannot
exclusively be attributed to precipitation from the solution. This is in contrast to literature
solubility studies, where U(VI) solubility is often described to induce nanomolar
concentrations at alkaline conditions (Altmaier et al., 2017; Kitamura et al., 1998). The
solubility limiting phase between pH 8 and 13 is sodium di-uranate (Na2U2O7·H2O) in pure
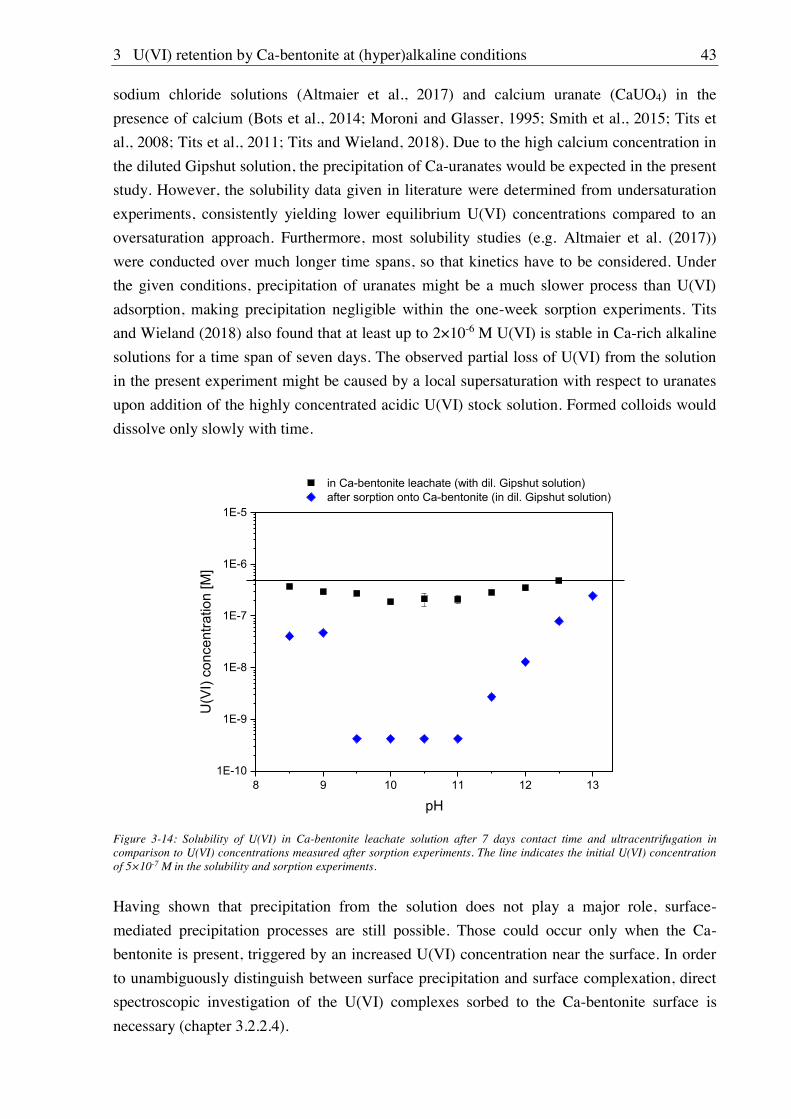
3 U(VI) retention by Ca-bentonite at (hyper)alkaline conditions 43
sodium chloride solutions (Altmaier et al., 2017) and calcium uranate (CaUO4) in the
presence of calcium (Bots et al., 2014; Moroni and Glasser, 1995; Smith et al., 2015; Tits et
al., 2008; Tits et al., 2011; Tits and Wieland, 2018). Due to the high calcium concentration in
the diluted Gipshut solution, the precipitation of Ca-uranates would be expected in the present
study. However, the solubility data given in literature were determined from undersaturation
experiments, consistently yielding lower equilibrium U(VI) concentrations compared to an
oversaturation approach. Furthermore, most solubility studies (e.g. Altmaier et al. (2017))
were conducted over much longer time spans, so that kinetics have to be considered. Under
the given conditions, precipitation of uranates might be a much slower process than U(VI)
adsorption, making precipitation negligible within the one-week sorption experiments. Tits
and Wieland (2018) also found that at least up to 2×10⁻⁶ M U(VI) is stable in Ca-rich alkaline
solutions for a time span of seven days. The observed partial loss of U(VI) from the solution
in the present experiment might be caused by a local supersaturation with respect to uranates
upon addition of the highly concentrated acidic U(VI) stock solution. Formed colloids would
dissolve only slowly with time.
8 9 10 11 12 131E-10
1E-9
1E-8
1E-7
1E-6
1E-5
in Ca-bentonite leachate (with dil. Gipshut solution) after sorption onto Ca-bentonite (in dil. Gipshut solution)
U(V
I) co
ncen
tratio
n [M
]
pH
Figure 3-14: Solubility of U(VI) in Ca-bentonite leachate solution after 7 days contact time and ultracentrifugation in comparison to U(VI) concentrations measured after sorption experiments. The line indicates the initial U(VI) concentration of 5×10⁻⁷ M in the solubility and sorption experiments.
Having shown that precipitation from the solution does not play a major role, surface-
mediated precipitation processes are still possible. Those could occur only when the Ca-
bentonite is present, triggered by an increased U(VI) concentration near the surface. In order
to unambiguously distinguish between surface precipitation and surface complexation, direct
spectroscopic investigation of the U(VI) complexes sorbed to the Ca-bentonite surface is
necessary (chapter 3.2.2.4).
44
3.2.2.4. U(VI) surface speciation
In situ ATR FT-IR spectroscopy
The application of in situ ATR FT-IR allows the monitoring of U(VI) accumulation on the
Ca-bentonite surface with time. As the obtained spectra are difference spectra (relative to a
conditioning stage without sorptive) the appearance of signals can unequivocally be attributed
to the sorption of U(VI). The wavenumber of the peaks corresponds to the asymmetric stretch
vibration of the uranyl unit and is characteristic for the U(VI) speciation. Experiments were
conducted at pH 6.8 in order to be able to compare the results with previous experiments with
montmorillonite (Fritsch, 2018), furthermore at pH 8, as this is the lower boundary of the
range of interest of this work, at which U(VI) retention is already well understood, and at pH
10.5, representative for the so far unstudied regime, where complete retention was observed in
the present work in the absence of CO2 as well as at low carbonate concentration. For the
interpretation of the spectra it has to be taken into account that the initial U(VI) concentration
was much higher compared to the batch sorption experiments described above (2×10⁻⁵ M
instead of 5×10⁻⁷ M, due to the detection limit of the method), so that a direct comparison and
deduction of analogous mechanisms is difficult.
At pH 6.8 and 8, a prominent absorption band appears at approx. 941 cm-1 (between 939 and
942 cm-1 at pH 8), evolving immediately from the onset of the sorption stage (Figure 3-15).
Additionally, shoulders can be observed at lower wavenumbers, namely at 925 cm-1 at pH 6.8
and at 915 and 900 cm-1 at pH 8. This indicates the simultaneous presence of different U(VI)
species on the Ca-bentonite surface. At pH 10.5 the main peak evolves with time between 927
and 929 cm-1. Consequently, the structure of the retained U(VI) compound is fundamentally
different from those at pH 6.8 and 8. Also here, small shoulders show the presence of multiple
sorption species. In all three samples small negative absorption bands appear at the
wavenumbers of the adsorption maxima during the flushing stage. However, these truncations
only represent weak remobilization of U(VI) and therefore eliminate classical outer-sphere
sorption as relevant retention mechanism at the given conditions.
As described in previous ATR FT-IR studies (Comarmond et al., 2016; Duff et al., 2002;
Gückel et al., 2012; Lefevre et al., 2008; Lefevre et al., 2006; Müller et al., 2008; Müller et
al., 2013; Müller et al., 2012; Tsushima, 2011; Wazne et al., 2003), the adsorption of U(VI) to
the mineral film is accompanied by a red shift of absorption bands compared to the respective
aqueous species. In the absence of CO2 at pH between 6.8 and 10.5 and a U(VI) concentration
of 20 M, the predominant aqueous species are the uranyl hydrolysis species (UO2)3(OH)5+,
UO2(OH)2 and UO2(OH)3 (Müller, 2010).
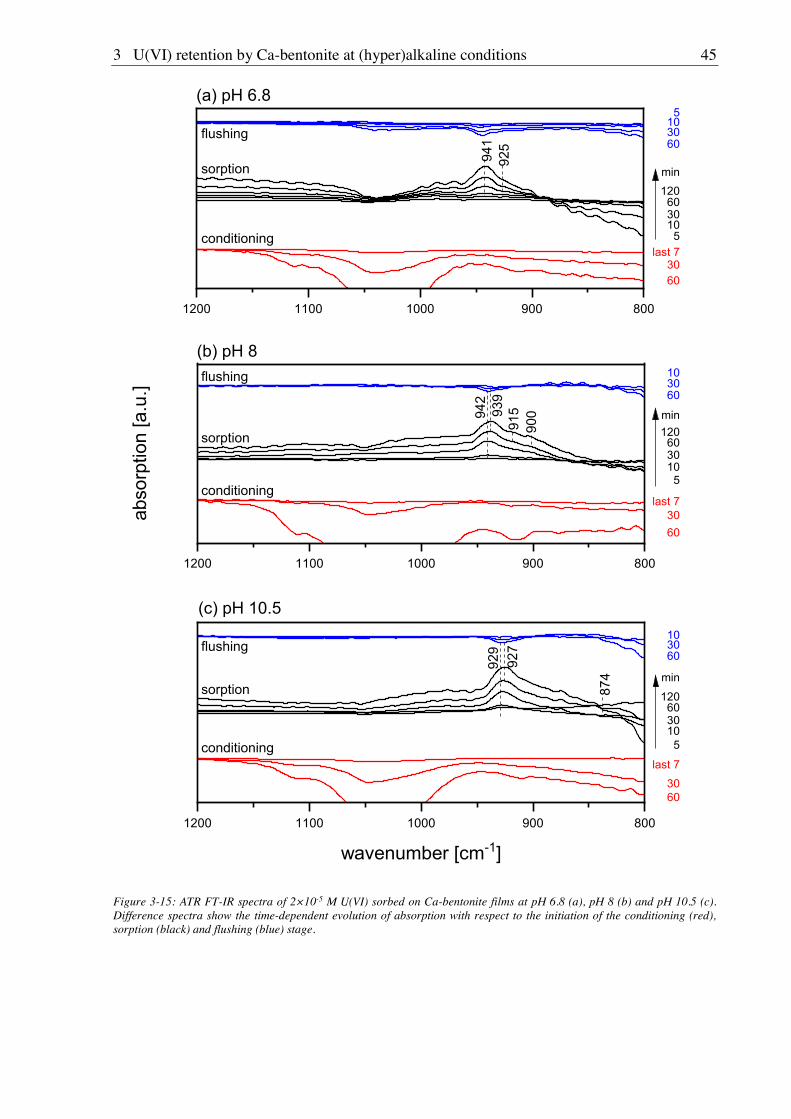
3 U(VI) retention by Ca-bentonite at (hyper)alkaline conditions 45
1200 1100 1000 900 800
(c) pH 10.5
(b) pH 8
925
5
60
941
510
120
6030
flushing
sorption
conditioning
min
103060
30last 7
(a) pH 6.8
1200 1100 1000 900 800
900
915
5
10
1206030
flushing
sorption
abso
rptio
n [a
.u.]
conditioning
min
6030
last 7
103060
942
939
1200 1100 1000 900 800
874
929
927
5
10
120
6030
flushing
sorption
wavenumber [cm-1]
conditioning
min
103060
6030
last 7
Figure 3-15: ATR FT-IR spectra of 2×10⁻⁵ M U(VI) sorbed on Ca-bentonite films at pH 6.8 (a), pH 8 (b) and pH 10.5 (c). Difference spectra show the time-dependent evolution of absorption with respect to the initiation of the conditioning (red), sorption (black) and flushing (blue) stage.
46
The asymmetric vibrational frequencies of these species decrease with increasing number of
hydroxide ligands per U atom and were determined in previous studies to be 925, 922 and
895 cm-1, respectively (Müller, 2010; Müller et al., 2008; Müller et al., 2013). The latter one
was not determined experimentally but was derived from the underlying linear correlation.
However, the obtained values of the main peaks in the present spectra are not red shifted
compared to the respective aqueous species, but appear at higher wavenumbers. Hence, the
formation of bidentate inner-sphere sorption complexes, as it has been described by Lefevre et
al. (2006), Müller (2010), Foerstendorf et al. (2012), Müller et al. (2013) and Comarmond et
al. (2016), is not the dominant retention mechanism in all three samples. Nevertheless, such
inner-sphere complexes might form at least to some extent, inferred from the observed
shoulders.
The observed absorption maximum at around 941 cm-1 at pH 6.8 and 8 fits very well to the
asymmetric vibrational frequency reported for the oxyhydroxide mineral schoepite
((UO2)8O2(OH)12 12(H2O)). Müller et al. (2013) determined the absorption band of synthetic
schoepite to be at 939 cm-1 and found a schoepite-like surface precipitate on Al2O3 at
946 cm-1. Furthermore, a colloidal U(VI) solution in 0.1 M NaCl at pH 7, measured by Müller
et al. (2008) showed an asymmetric vibrational frequency of 940 cm-1. While this comparison
with literature data suggests a schoepite-like precipitate at pH 6.8 and 8, the retained U(VI) at
pH 10.5 seems to be distinct from that. The precipitation of a different mineral phase than
schoepite at pH higher than 8 has been shown in previous studies. Altmaier et al. (2017)
identified the solubility limiting phase in NaCl solutions to be metaschoepite (UO3 2H2O) up
to pH 6.5-8.5 (depending on NaCl concentration) and sodium diuranate (Na2U2O7 H2O) at
higher pH values. Consequently, the retained U(VI) compound at pH 10.5 could be sodium
diuranate. Chernorukov et al. (2016) and Baran and Tympl (1966) measured infrared spectra
of sodium diuranate compounds which were synthesized with variable number of H2O
molecules (water of crystallization) and Na/U ratio. The observed asymmetrical stretch
vibration strongly depended on these two parameters and varied between 936 and 861 cm-1
and between 949 and 869 cm-1, respectively. Therefore, in the present study, a clear
assignment to this compound cannot be made. The observed band position of 927-929 cm-1 at
pH 10.5 is somewhere in between the regions usually attributed to precipitation and to
adsorbed species. The only U(VI) compound with a comparable asymmetric stretch vibration
(927 cm-1) described in literature is a oligomeric surface complex on Al2O3 (Müller et al.,
2013). Presumably such oligomeric complexes also form here and display precursors for
surface precipitates.
3 U(VI) retention by Ca-bentonite at (hyper)alkaline conditions 47
In general, it can be stated that in all three samples (pH 6.8, 8 and 10.5) precipitation (or at
least formation of oligomeric surface complexes at pH 10.5) appears to be the predominant
retention mechanism. Only minor contributions of inner-sphere adsorption could be observed.
This finding is reasonable because with a U(VI) concentration of 2×10⁻⁵ M, alkaline NaCl
solutions are supersaturated by several orders of magnitude according to Altmaier et al.
(2017). However, this does not have to hold true for the much lower initial U(VI)
concentrations of the batch sorption experiments (5×10⁻⁷ M). Consequently, due to the
detection limit, ATR FT-IR spectroscopy is capable of identifying U(VI) speciation in super-
micromolar systems but does not allow determination of different retention mechanisms at
sub-micromolar concentrations. Thus, in order to resolve underlying processes at 5×10⁻⁷ M
U(VI), where precipitation is less favored, more sensitive techniques such as site-selective
TRLFS and EXAFS were applied.
Site-selective TRLFS
Figure 3-16a shows the excitation spectrum (black data points) of U(VI) sorbed on Ca-
bentonite at pH 11 in the absence of CO2 and a series of selected emission spectra (in color),
obtained at different excitation wavelengths. The excitation spectrum does not contain much
spectral information. The absence of distinct maxima is attributed to great variety of sorption
sites within the sample, leading to an inhomogeneous broadening. This heterogeneity of
sorption sites is not surprising as Ca-bentonite is a very complex, multi-mineral material,
where already montmorillonite provides different complexation sites (e.g. edge sharing,
corner sharing) and aluminol/silanol functionalities. The variety of sorption species can also
be inferred from different emission spectra, which shift strongly, depending on the excitation
energy. At low excitation wavelength (e.g. 472.8 nm) the emission spectra appear broadened
and weakly resolved as the incident energy is high enough to excite all uranyl moieties within
the sample. At higher excitation wavelengths (in Figure 3-16a exemplarily shown for
ex = 494.3, 499.7 and 505.2 nm), however, a clear luminescence line-narrowing can be
observed due to resonant/direct excitation of single species. The occurrence of luminescence
line-narrowing alone already indicates the presence of adsorbed U(VI) surface complexes and
eliminates U(VI) precipitation as the predominant retention mechanism. In U(VI) precipitates,
such as Na,Ca-uranates, the phenomenon of luminescence line-narrowing is suppressed by
homo-resonance energy transfer between the U-atoms arranged in close distance to each
other, leading to a mutual excitation and consequently to a broadening of the signal
(Lakowicz, 2006; Tits et al., 2015). Such signal broadening is observed in the present batch
sample prepared with an initial U(VI) concentration of 5×10⁻⁵ M to provoke U(VI)
precipitation for comparison (Figure 3-16b). In fact, the obtained spectra show no
luminescence line-narrowing, irrespective of the excitation energy. U(VI) precipitation at
these conditions is in accordance with the in situ ATR FT-IR spectroscopy measurements at
2×10⁻⁵ M. Broad and unresolved maxima around 545 nm appear at all excitation wavelengths,
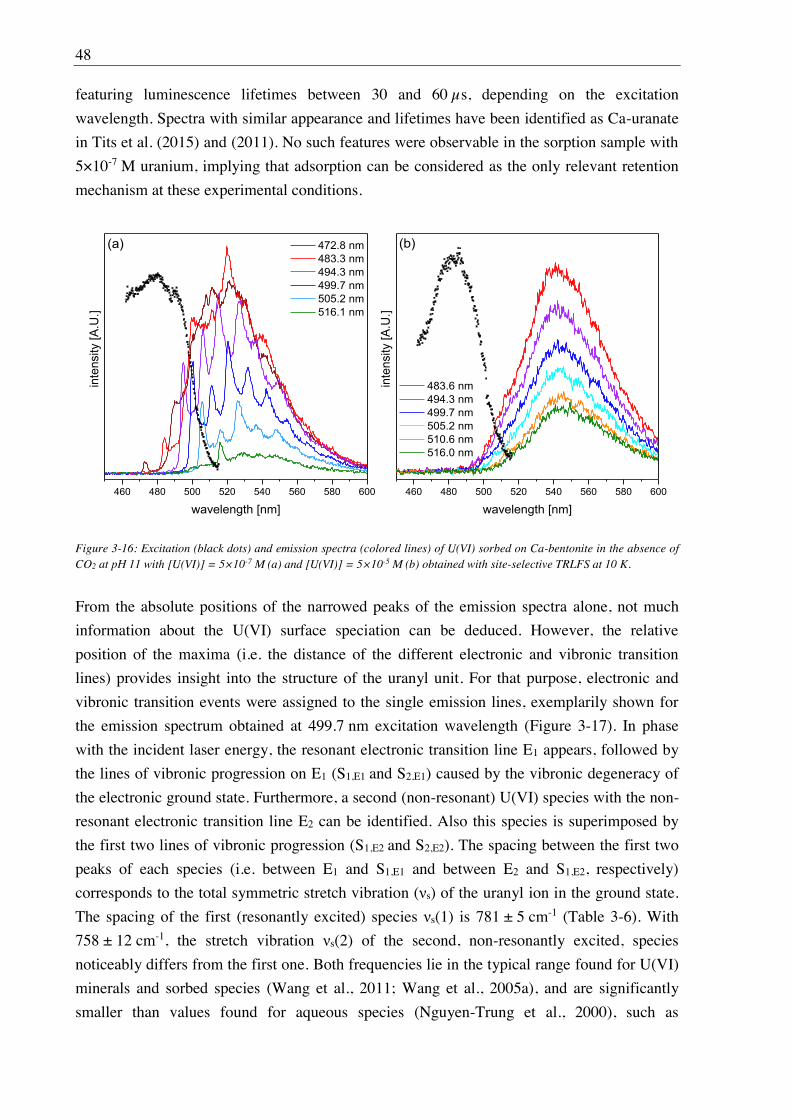
48
featuring luminescence lifetimes between 30 and 60 s, depending on the excitation
wavelength. Spectra with similar appearance and lifetimes have been identified as Ca-uranate
in Tits et al. (2015) and (2011). No such features were observable in the sorption sample with
5×10⁻⁷ M uranium, implying that adsorption can be considered as the only relevant retention
mechanism at these experimental conditions.
460 480 500 520 540 560 580 600 460 480 500 520 540 560 580 600
472.8 nm 483.3 nm 494.3 nm 499.7 nm 505.2 nm 516.1 nm
inte
nsity
[A.U
.]
wavelength [nm]
483.6 nm 494.3 nm 499.7 nm 505.2 nm 510.6 nm 516.0 nm
inte
nsity
[A.U
.]
wavelength [nm]
(a) (b)
Figure 3-16: Excitation (black dots) and emission spectra (colored lines) of U(VI) sorbed on Ca-bentonite in the absence of CO2 at pH 11 with [U(VI)] = 5×10⁻⁷ M (a) and [U(VI)] = 5×10⁻⁵ M (b) obtained with site-selective TRLFS at 10 K.
From the absolute positions of the narrowed peaks of the emission spectra alone, not much
information about the U(VI) surface speciation can be deduced. However, the relative
position of the maxima (i.e. the distance of the different electronic and vibronic transition
lines) provides insight into the structure of the uranyl unit. For that purpose, electronic and
vibronic transition events were assigned to the single emission lines, exemplarily shown for
the emission spectrum obtained at 499.7 nm excitation wavelength (Figure 3-17). In phase
with the incident laser energy, the resonant electronic transition line E1 appears, followed by
the lines of vibronic progression on E1 (S1,E1 and S2,E1) caused by the vibronic degeneracy of
the electronic ground state. Furthermore, a second (non-resonant) U(VI) species with the non-
resonant electronic transition line E2 can be identified. Also this species is superimposed by
the first two lines of vibronic progression (S1,E2 and S2,E2). The spacing between the first two
peaks of each species (i.e. between E1 and S1,E1 and between E2 and S1,E2, respectively)
corresponds to the total symmetric stretch vibration ( s) of the uranyl ion in the ground state.
The spacing of the first (resonantly excited) species s(1) is 781 ± 5 cm-1 (Table 3-6). With
758 ± 12 cm-1, the stretch vibration s(2) of the second, non-resonantly excited, species
noticeably differs from the first one. Both frequencies lie in the typical range found for U(VI)
minerals and sorbed species (Wang et al., 2011; Wang et al., 2005a), and are significantly
smaller than values found for aqueous species (Nguyen-Trung et al., 2000), such as
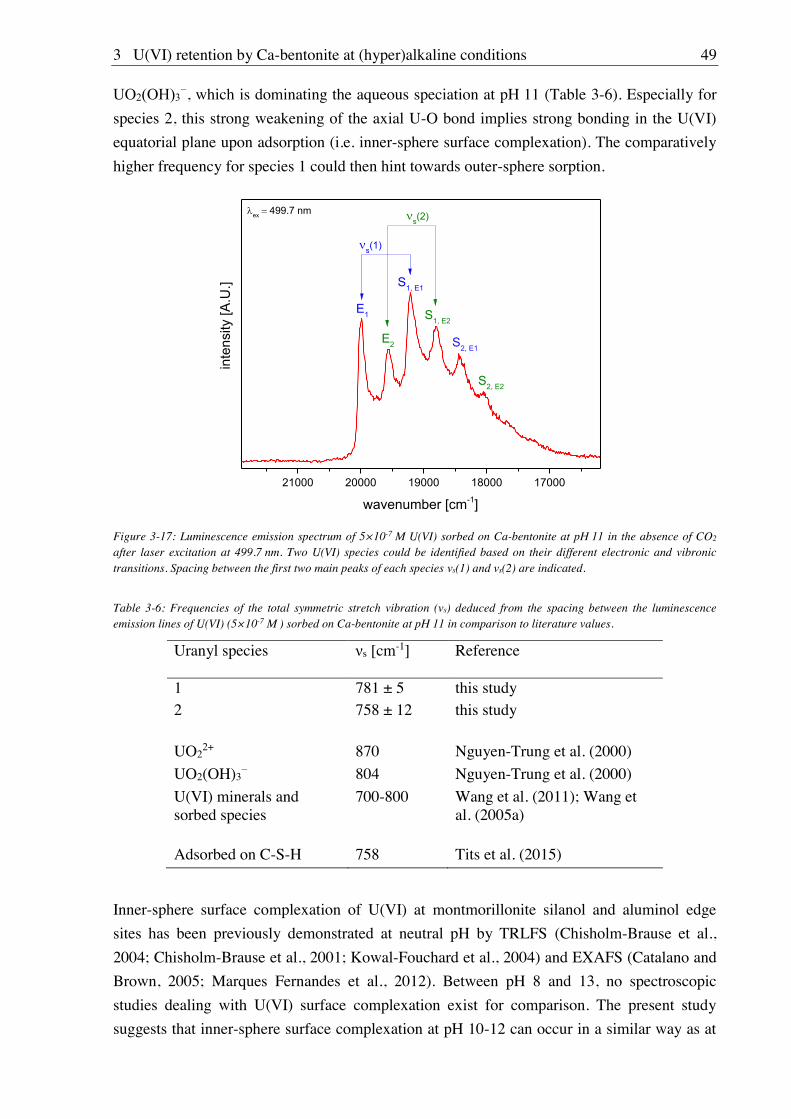
3 U(VI) retention by Ca-bentonite at (hyper)alkaline conditions 49
, which is dominating the aqueous speciation at pH 11 (Table 3-6). Especially for
species 2, this strong weakening of the axial U-O bond implies strong bonding in the U(VI)
equatorial plane upon adsorption (i.e. inner-sphere surface complexation). The comparatively
higher frequency for species 1 could then hint towards outer-sphere sorption.
21000 20000 19000 18000 17000
ex 499.7 nms(2)
s(1)
S2, E2
S1, E2
S2, E1
S1, E1
E2
inte
nsity
[A.U
.]
wavenumber [cm-1]
E1
Figure 3-17: Luminescence emission spectrum of 5×10⁻⁷ M U(VI) sorbed on Ca-bentonite at pH 11 in the absence of CO2 after laser excitation at 499.7 nm. Two U(VI) species could be identified based on their different electronic and vibronic transitions. Spacing between the first two main peaks of each species s(1) and s(2) are indicated.
Table 3-6: Frequencies of the total symmetric stretch vibration ( s) deduced from the spacing between the luminescence emission lines of U(VI) (5×10⁻⁷ M ) sorbed on Ca-bentonite at pH 11 in comparison to literature values.
Uranyl species s [cm-1] Reference
1 781 ± 5 this study 2 758 ± 12 this study
UO2
2+ 870 Nguyen-Trung et al. (2000)
UO2(OH)3 804 Nguyen-Trung et al. (2000)
U(VI) minerals and sorbed species
700-800 Wang et al. (2011); Wang et al. (2005a)
Adsorbed on C-S-H 758 Tits et al. (2015)
Inner-sphere surface complexation of U(VI) at montmorillonite silanol and aluminol edge
sites has been previously demonstrated at neutral pH by TRLFS (Chisholm-Brause et al.,
2004; Chisholm-Brause et al., 2001; Kowal-Fouchard et al., 2004) and EXAFS (Catalano and
Brown, 2005; Marques Fernandes et al., 2012). Between pH 8 and 13, no spectroscopic
studies dealing with U(VI) surface complexation exist for comparison. The present study
suggests that inner-sphere surface complexation at pH 10-12 can occur in a similar way as at
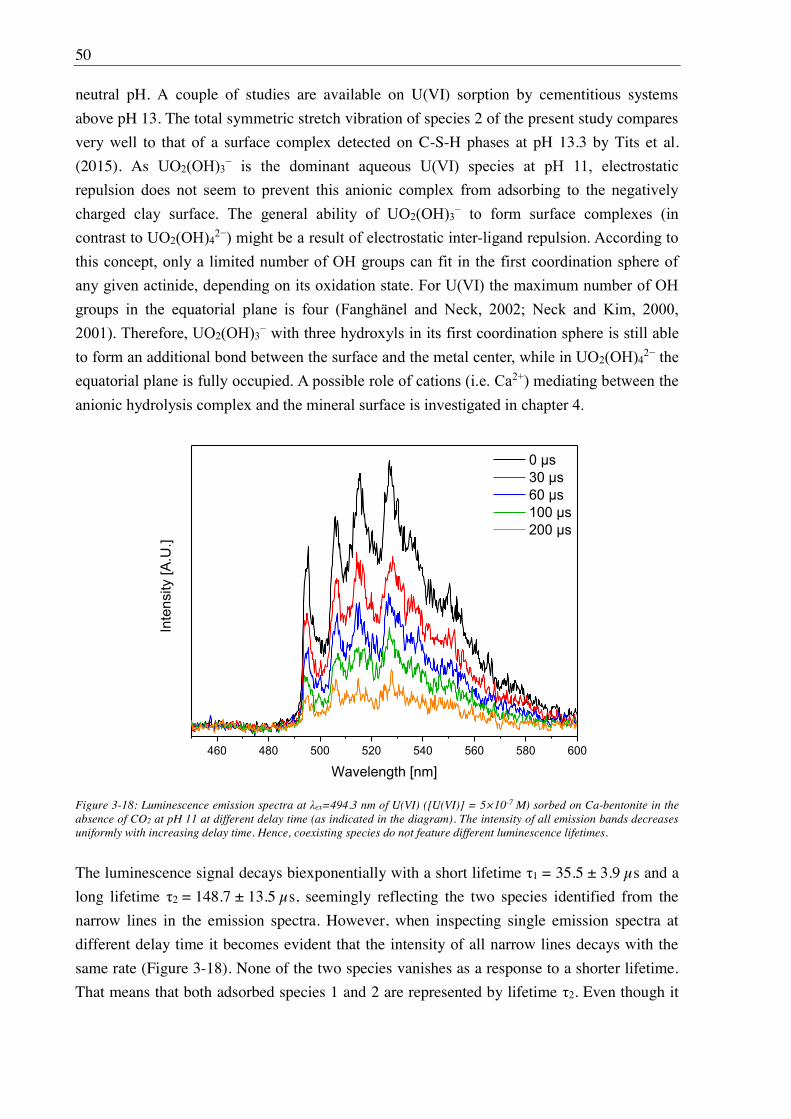
50
neutral pH. A couple of studies are available on U(VI) sorption by cementitious systems
above pH 13. The total symmetric stretch vibration of species 2 of the present study compares
very well to that of a surface complex detected on C-S-H phases at pH 13.3 by Tits et al.
(2015). As
-
460 480 500 520 540 560 580 600
Inte
nsity
[A.U
.]
Wavelength [nm]
0 s 30 s 60 s 100 s 200 s
Figure 3-18: Luminescence emission spectra at ex=494.3 nm of U(VI) ([U(VI)] = 5×10⁻⁷ M) sorbed on Ca-bentonite in the absence of CO2 at pH 11 at different delay time (as indicated in the diagram). The intensity of all emission bands decreases uniformly with increasing delay time. Hence, coexisting species do not feature different luminescence lifetimes.
The luminescence signal decays biexponentially with a short lifetime 1 = 35.5 ± 3.9 s and a
long lifetime 2 = 148.7 ± 13.5 s, seemingly reflecting the two species identified from the
narrow lines in the emission spectra. However, when inspecting single emission spectra at
different delay time it becomes evident that the intensity of all narrow lines decays with the
same rate (Figure 3-18). None of the two species vanishes as a response to a shorter lifetime.
That means that both adsorbed species 1 and 2 are represented by lifetime 2. Even though it
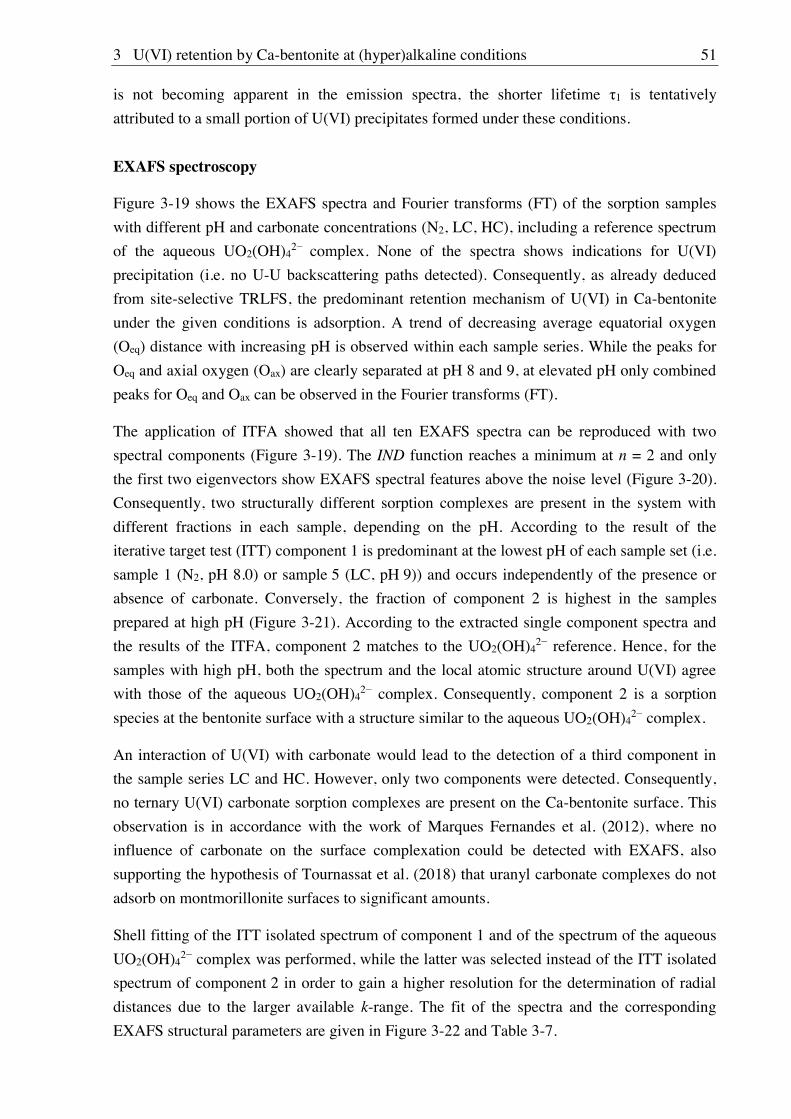
3 U(VI) retention by Ca-bentonite at (hyper)alkaline conditions 51
is not becoming apparent in the emission spectra, the shorter lifetime 1 is tentatively
attributed to a small portion of U(VI) precipitates formed under these conditions.
EXAFS spectroscopy
Figure 3-19 shows the EXAFS spectra and Fourier transforms (FT) of the sorption samples
with different pH and carbonate concentrations (N2, LC, HC), including a reference spectrum
of the aqueous UO2(OH)42 complex. None of the spectra shows indications for U(VI)
precipitation (i.e. no U-U backscattering paths detected). Consequently, as already deduced
from site-selective TRLFS, the predominant retention mechanism of U(VI) in Ca-bentonite
under the given conditions is adsorption. A trend of decreasing average equatorial oxygen
(Oeq) distance with increasing pH is observed within each sample series. While the peaks for
Oeq and axial oxygen (Oax) are clearly separated at pH 8 and 9, at elevated pH only combined
peaks for Oeq and Oax can be observed in the Fourier transforms (FT).
The application of ITFA showed that all ten EXAFS spectra can be reproduced with two
spectral components (Figure 3-19). The IND function reaches a minimum at n = 2 and only
the first two eigenvectors show EXAFS spectral features above the noise level (Figure 3-20).
Consequently, two structurally different sorption complexes are present in the system with
different fractions in each sample, depending on the pH. According to the result of the
iterative target test (ITT) component 1 is predominant at the lowest pH of each sample set (i.e.
sample 1 (N2, pH 8.0) or sample 5 (LC, pH 9)) and occurs independently of the presence or
absence of carbonate. Conversely, the fraction of component 2 is highest in the samples
prepared at high pH (Figure 3-21). According to the extracted single component spectra and
the results of the ITFA, component 2 matches to the UO2(OH)42 reference. Hence, for the
samples with high pH, both the spectrum and the local atomic structure around U(VI) agree
with those of the aqueous UO2(OH)42 complex. Consequently, component 2 is a sorption
species at the bentonite surface with a structure similar to the aqueous UO2(OH)42 complex.
An interaction of U(VI) with carbonate would lead to the detection of a third component in
the sample series LC and HC. However, only two components were detected. Consequently,
no ternary U(VI) carbonate sorption complexes are present on the Ca-bentonite surface. This
observation is in accordance with the work of Marques Fernandes et al. (2012), where no
influence of carbonate on the surface complexation could be detected with EXAFS, also
supporting the hypothesis of Tournassat et al. (2018) that uranyl carbonate complexes do not
adsorb on montmorillonite surfaces to significant amounts.
Shell fitting of the ITT isolated spectrum of component 1 and of the spectrum of the aqueous
UO2(OH)42 complex was performed, while the latter was selected instead of the ITT isolated
spectrum of component 2 in order to gain a higher resolution for the determination of radial
distances due to the larger available k-range. The fit of the spectra and the corresponding
EXAFS structural parameters are given in Figure 3-22 and Table 3-7.
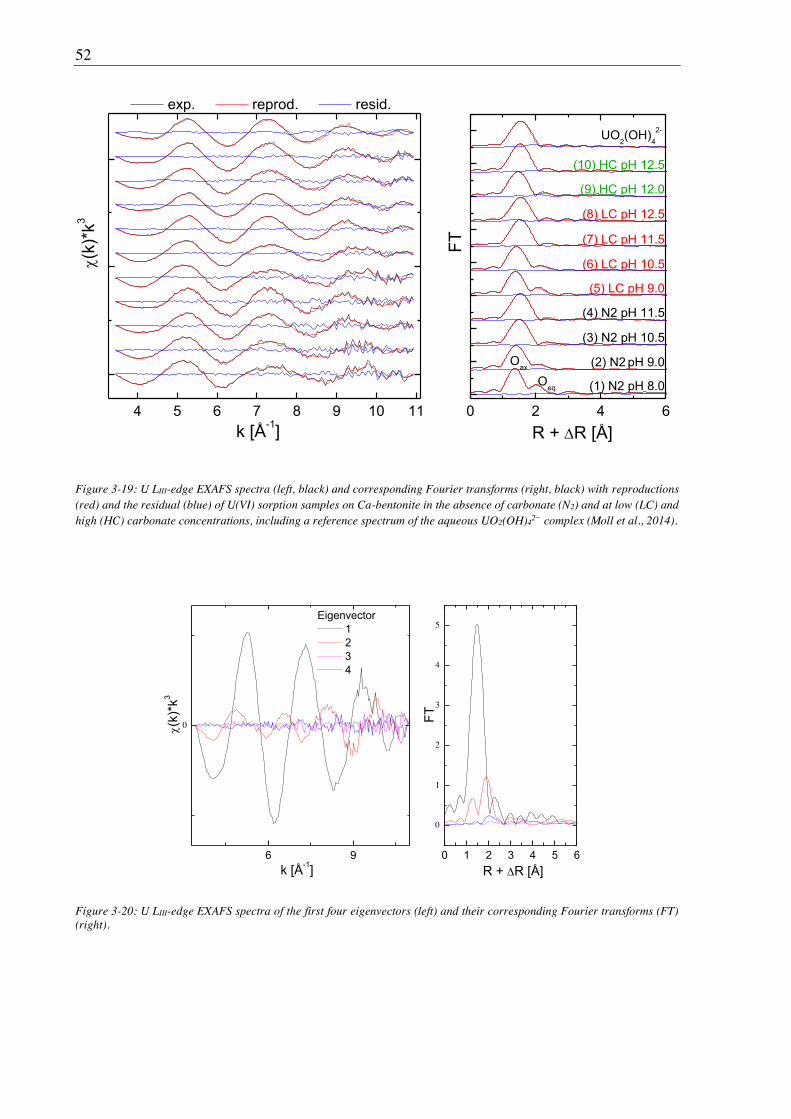
52
4 5 6 7 8 9 10 11 0 2 4 6
(k)*
k3
k [Å-1]
Oax
Oeq
UO2(OH)
42-
exp. reprod. resid.
FTR + R [Å]
(10) HC pH 12.5
(9) HC pH 12.0
(8) LC pH 12.5
(7) LC pH 11.5
(6) LC pH 10.5
(5) LC pH 9.0
(1) N2 pH 8.0
(4) N2 pH 11.5
(3) N2 pH 10.5
(2) N2 pH 9.0
Figure 3-19: U LIII-edge EXAFS spectra (left, black) and corresponding Fourier transforms (right, black) with reproductions (red) and the residual (blue) of U(VI) sorption samples on Ca-bentonite in the absence of carbonate (N2) and at low (LC) and high (HC) carbonate concentrations, including a reference spectrum of the aqueous UO2(OH)4
2 complex (Moll et al., 2014).
6 9
0
0 1 2 3 4 5 6
0
1
2
3
4
5Eigenvector
1 2 3 4
(k)*
k3
k [Å-1]
FT
R + R [Å]
Figure 3-20: U LIII-edge EXAFS spectra of the first four eigenvectors (left) and their corresponding Fourier transforms (FT) (right).
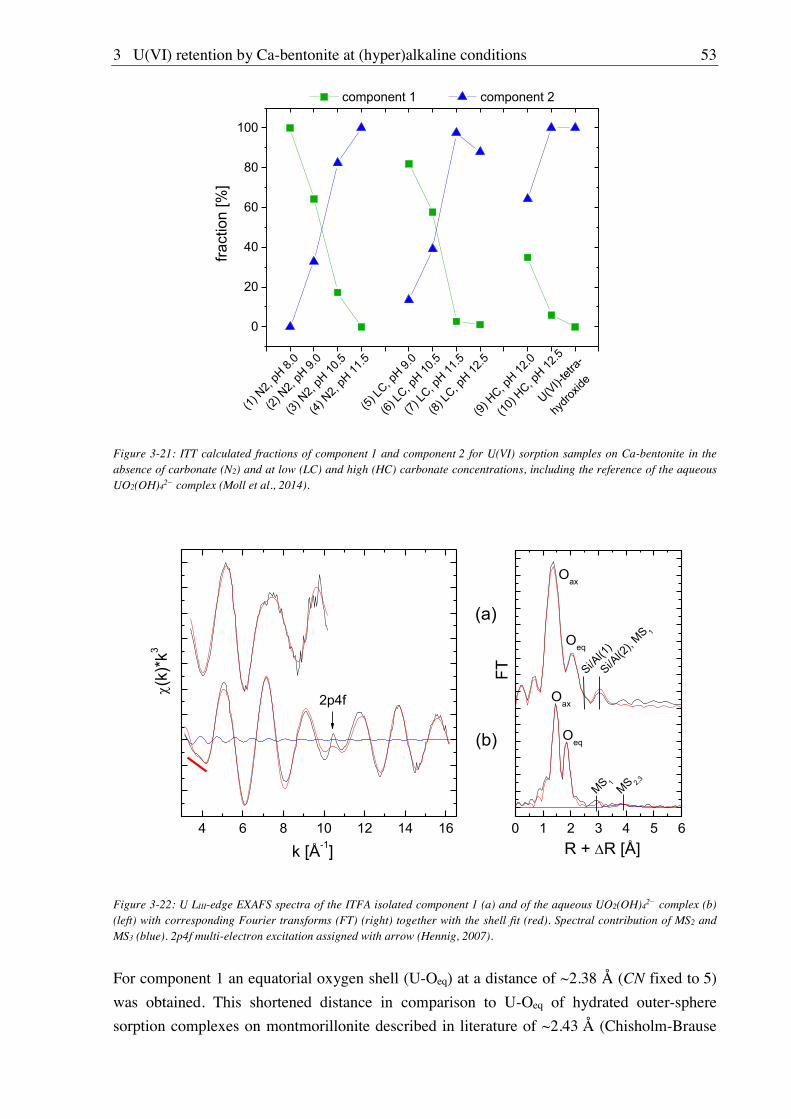
3 U(VI) retention by Ca-bentonite at (hyper)alkaline conditions 53
0
20
40
60
80
100
(9) H
C, pH 12
.0
(10) H
C, pH 12
.5
U(VI)-
tetra-
hydro
xide
fract
ion
[%]
component 1 component 2
(1) N
2, pH
8.0
(2) N
2, pH
9.0
(3) N
2, pH
10.5
(4) N
2, pH
11.5
(5) LC
, pH 9.
0
(6) LC
, pH 10
.5
(7) LC
, pH 11
.5
(8) LC
, pH 12
.5
Figure 3-21: ITT calculated fractions of component 1 and component 2 for U(VI) sorption samples on Ca-bentonite in the absence of carbonate (N2) and at low (LC) and high (HC) carbonate concentrations, including the reference of the aqueous UO2(OH)4
2 complex (Moll et al., 2014).
4 6 8 10 12 14 16 0 1 2 3 4 5 6
(a)
2p4f
(k)*
k3
k [Å-1]
MS 2,3
MS 1
Oeq
Oax
Si/Al(2
), MS 1
Si/Al(1
)Oeq
Oax
(b)
FT
R + R [Å]
Figure 3-22: U LIII-edge EXAFS spectra of the ITFA isolated component 1 (a) and of the aqueous UO2(OH)42 complex (b)
(left) with corresponding Fourier transforms (FT) (right) together with the shell fit (red). Spectral contribution of MS2 and MS3 (blue). 2p4f multi-electron excitation assigned with arrow (Hennig, 2007).
For component 1 an equatorial oxygen shell (U-Oeq) at a distance of ~2.38 Å (CN fixed to 5)
was obtained. This shortened distance in comparison to U-Oeq of hydrated outer-sphere
sorption complexes on montmorillonite described in literature of ~2.43 Å (Chisholm-Brause
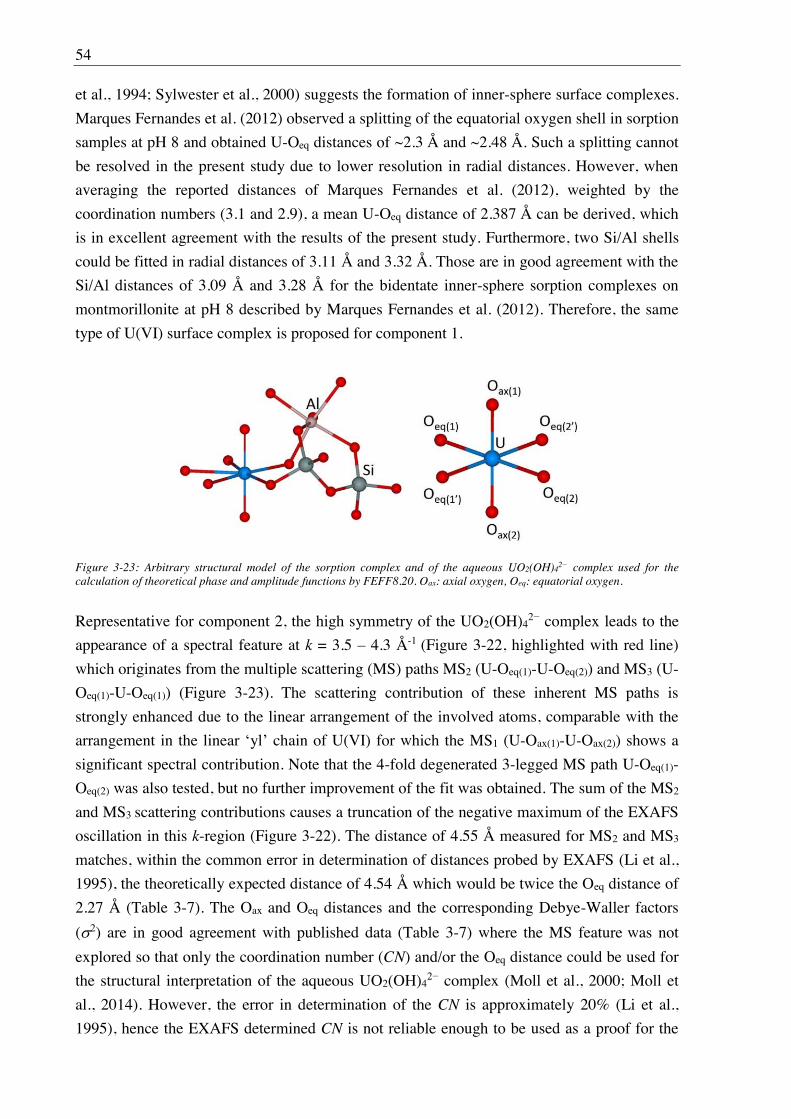
54
et al., 1994; Sylwester et al., 2000) suggests the formation of inner-sphere surface complexes.
Marques Fernandes et al. (2012) observed a splitting of the equatorial oxygen shell in sorption
samples at pH 8 and obtained U-Oeq distances of ~2.3 Å and ~2.48 Å. Such a splitting cannot
be resolved in the present study due to lower resolution in radial distances. However, when
averaging the reported distances of Marques Fernandes et al. (2012), weighted by the
coordination numbers (3.1 and 2.9), a mean U-Oeq distance of 2.387 Å can be derived, which
is in excellent agreement with the results of the present study. Furthermore, two Si/Al shells
could be fitted in radial distances of 3.11 Å and 3.32 Å. Those are in good agreement with the
Si/Al distances of 3.09 Å and 3.28 Å for the bidentate inner-sphere sorption complexes on
montmorillonite at pH 8 described by Marques Fernandes et al. (2012). Therefore, the same
type of U(VI) surface complex is proposed for component 1.
Figure 3-23: Arbitrary structural model of the sorption complex and of the aqueous UO2(OH)42 complex used for the
calculation of theoretical phase and amplitude functions by FEFF8.20. Oax: axial oxygen, Oeq: equatorial oxygen.
Representative for component 2, the high symmetry of the UO2(OH)42 complex leads to the
appearance of a spectral feature at k = 3.5 4.3 Å-1 (Figure 3-22, highlighted with red line)
which originates from the multiple scattering (MS) paths MS2 (U-Oeq(1)-U-Oeq(2)) and MS3 (U-
Oeq(1)-U-Oeq(1)) (Figure 3-23). The scattering contribution of these inherent MS paths is
strongly enhanced due to the linear arrangement of the involved atoms, comparable with the
arrangement in the linear yl chain of U(VI) for which the MS1 (U-Oax(1)-U-Oax(2)) shows a
significant spectral contribution. Note that the 4-fold degenerated 3-legged MS path U-Oeq(1)-
Oeq(2) was also tested, but no further improvement of the fit was obtained. The sum of the MS2
and MS3 scattering contributions causes a truncation of the negative maximum of the EXAFS
oscillation in this k-region (Figure 3-22). The distance of 4.55 Å measured for MS2 and MS3
matches, within the common error in determination of distances probed by EXAFS (Li et al.,
1995), the theoretically expected distance of 4.54 Å which would be twice the Oeq distance of
2.27 Å (Table 3-7). The Oax and Oeq distances and the corresponding Debye-Waller factors
( 2) are in good agreement with published data (Table 3-7) where the MS feature was not
explored so that only the coordination number (CN) and/or the Oeq distance could be used for
the structural interpretation of the aqueous UO2(OH)42 complex (Moll et al., 2000; Moll et
al., 2014). However, the error in determination of the CN is approximately 20% (Li et al.,
1995), hence the EXAFS determined CN is not reliable enough to be used as a proof for the
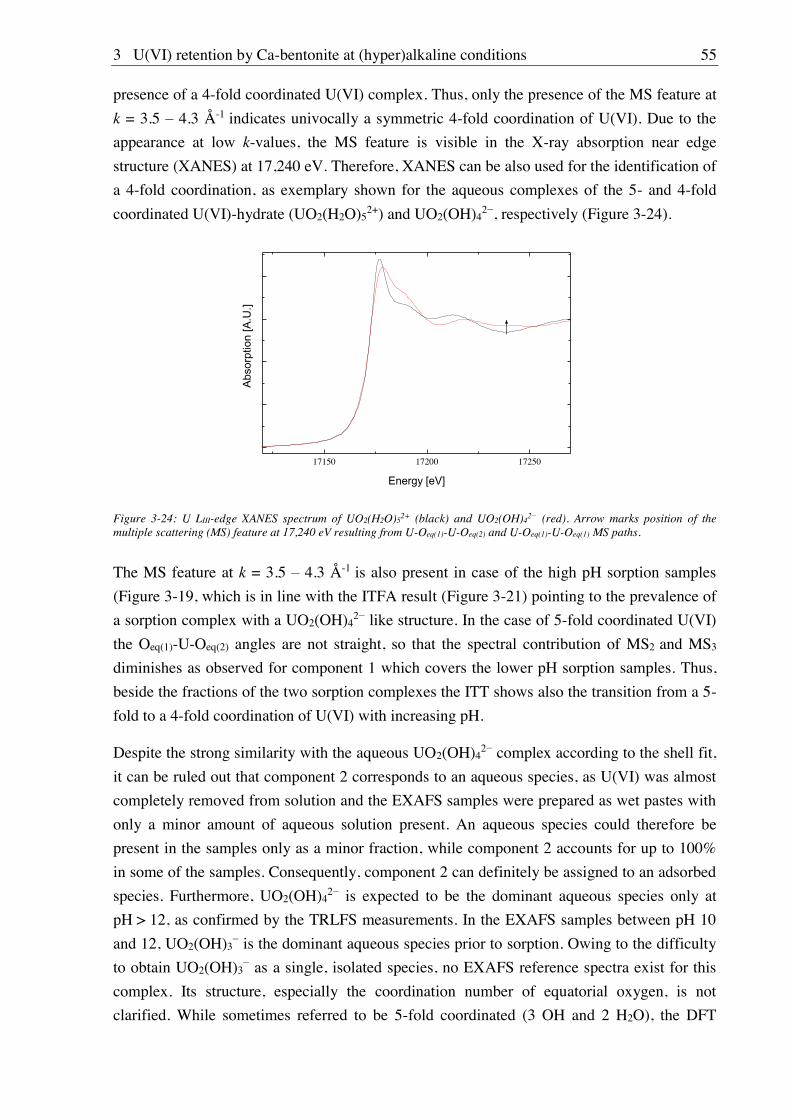
3 U(VI) retention by Ca-bentonite at (hyper)alkaline conditions 55
presence of a 4-fold coordinated U(VI) complex. Thus, only the presence of the MS feature at
k = 3.5 4.3 Å-1 indicates univocally a symmetric 4-fold coordination of U(VI). Due to the
appearance at low k-values, the MS feature is visible in the X-ray absorption near edge
structure (XANES) at 17,240 eV. Therefore, XANES can be also used for the identification of
a 4-fold coordination, as exemplary shown for the aqueous complexes of the 5- and 4-fold
coordinated U(VI)-hydrate (UO2(H2O)52+) and UO2(OH)4
2 , respectively (Figure 3-24).
17150 17200 17250
s
Abs
orpt
ion
[A.U
.]
Energy [eV]
Figure 3-24: U LIII-edge XANES spectrum of UO2(H2O)52+ (black) and UO2(OH)4
2 (red). Arrow marks position of the multiple scattering (MS) feature at 17,240 eV resulting from U-Oeq(1)-U-Oeq(2) and U-Oeq(1)-U-Oeq(1) MS paths.
The MS feature at k = 3.5 4.3 Å-1 is also present in case of the high pH sorption samples
(Figure 3-19, which is in line with the ITFA result (Figure 3-21) pointing to the prevalence of
a sorption complex with a UO2(OH)42 like structure. In the case of 5-fold coordinated U(VI)
the Oeq(1)-U-Oeq(2) angles are not straight, so that the spectral contribution of MS2 and MS3
diminishes as observed for component 1 which covers the lower pH sorption samples. Thus,
beside the fractions of the two sorption complexes the ITT shows also the transition from a 5-
fold to a 4-fold coordination of U(VI) with increasing pH.
Despite the strong similarity with the aqueous UO2(OH)42 complex according to the shell fit,
it can be ruled out that component 2 corresponds to an aqueous species, as U(VI) was almost
completely removed from solution and the EXAFS samples were prepared as wet pastes with
only a minor amount of aqueous solution present. An aqueous species could therefore be
present in the samples only as a minor fraction, while component 2 accounts for up to 100%
in some of the samples. Consequently, component 2 can definitely be assigned to an adsorbed
species. Furthermore, UO2(OH)42 is expected to be the dominant aqueous species only at
pH > 12, as confirmed by the TRLFS measurements. In the EXAFS samples between pH 10
and 12, UO2(OH)3 is the dominant aqueous species prior to sorption. Owing to the difficulty
to obtain UO2(OH)3 as a single, isolated species, no EXAFS reference spectra exist for this
complex. Its structure, especially the coordination number of equatorial oxygen, is not
clarified. While sometimes referred to be 5-fold coordinated (3 OH and 2 H2O), the DFT
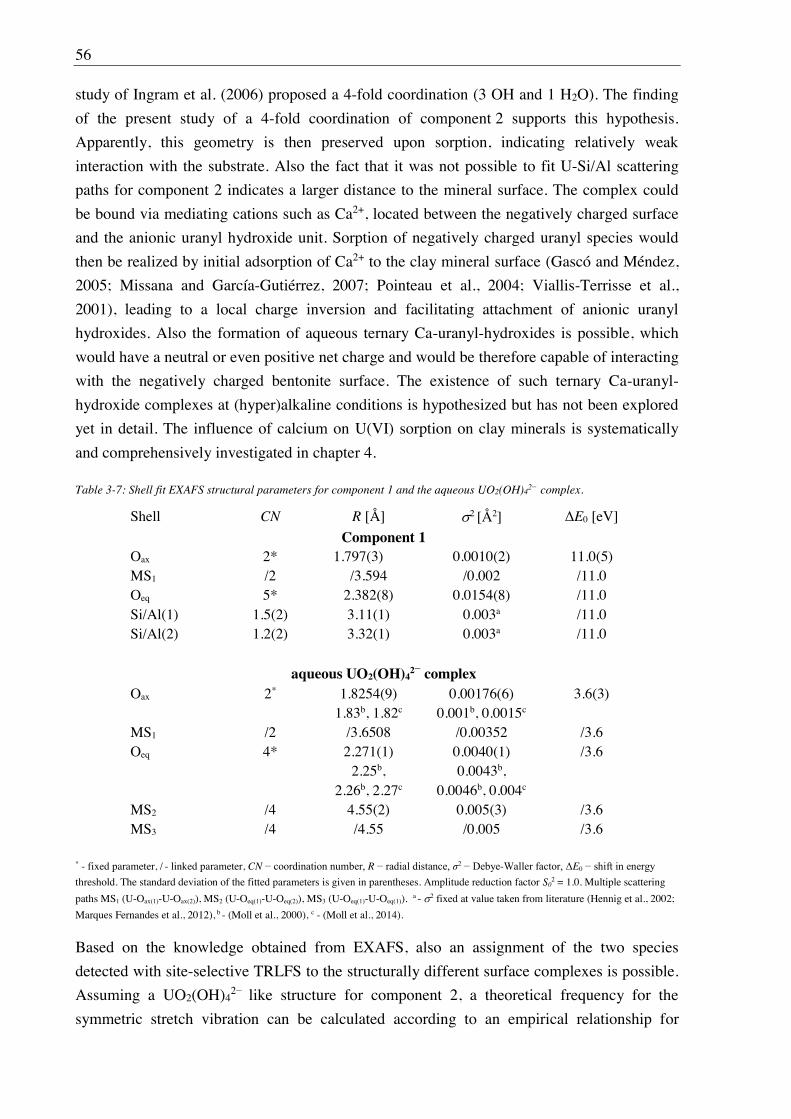
56
study of Ingram et al. (2006) proposed a 4-fold coordination (3 OH and 1 H2O). The finding
of the present study of a 4-fold coordination of component 2 supports this hypothesis.
Apparently, this geometry is then preserved upon sorption, indicating relatively weak
interaction with the substrate. Also the fact that it was not possible to fit U-Si/Al scattering
paths for component 2 indicates a larger distance to the mineral surface. The complex could
be bound via mediating cations such as Ca2+, located between the negatively charged surface
and the anionic uranyl hydroxide unit. Sorption of negatively charged uranyl species would
then be realized by initial adsorption of Ca2+ to the clay mineral surface (Gascó and Méndez,
2005; Missana and García-Gutiérrez, 2007; Pointeau et al., 2004; Viallis-Terrisse et al.,
2001), leading to a local charge inversion and facilitating attachment of anionic uranyl
hydroxides. Also the formation of aqueous ternary Ca-uranyl-hydroxides is possible, which
would have a neutral or even positive net charge and would be therefore capable of interacting
with the negatively charged bentonite surface. The existence of such ternary Ca-uranyl-
hydroxide complexes at (hyper)alkaline conditions is hypothesized but has not been explored
yet in detail. The influence of calcium on U(VI) sorption on clay minerals is systematically
and comprehensively investigated in chapter 4.
Table 3-7: Shell fit EXAFS structural parameters for component 1 and the aqueous UO2(OH)42 complex.
Shell CN R [Å] 2 [Å2] E0 [eV]
Component 1 Oax 2* 1.797(3) 0.0010(2) 11.0(5) MS1 /2 /3.594 /0.002 /11.0 Oeq 5* 2.382(8) 0.0154(8) /11.0 Si/Al(1) 1.5(2) 3.11(1) 0.003a /11.0 Si/Al(2) 1.2(2) 3.32(1) 0.003a /11.0
aqueous UO2(OH)42 complex
Oax 2* 1.8254(9) 0.00176(6) 3.6(3) 1.83b, 1.82c 0.001b, 0.0015c MS1 /2 /3.6508 /0.00352 /3.6 Oeq 4* 2.271(1) 0.0040(1) /3.6 2.25b, 0.0043b, 2.26b, 2.27c 0.0046b, 0.004c MS2 /4 4.55(2) 0.005(3) /3.6 MS3 /4 /4.55 /0.005 /3.6
* - fixed parameter, / - linked parameter, CN R 2 - E0
threshold. The standard deviation of the fitted parameters is given in parentheses. Amplitude reduction factor S02 = 1.0. Multiple scattering
paths MS1 (U-Oax(1)-U-Oax(2)), MS2 (U-Oeq(1)-U-Oeq(2)), MS3 (U-Oeq(1)-U-Oeq(1)). a - 2 fixed at value taken from literature (Hennig et al., 2002;
Marques Fernandes et al., 2012), b - (Moll et al., 2000), c - (Moll et al., 2014).
Based on the knowledge obtained from EXAFS, also an assignment of the two species
detected with site-selective TRLFS to the structurally different surface complexes is possible.
Assuming a UO2(OH)42 like structure for component 2, a theoretical frequency for the
symmetric stretch vibration can be calculated according to an empirical relationship for
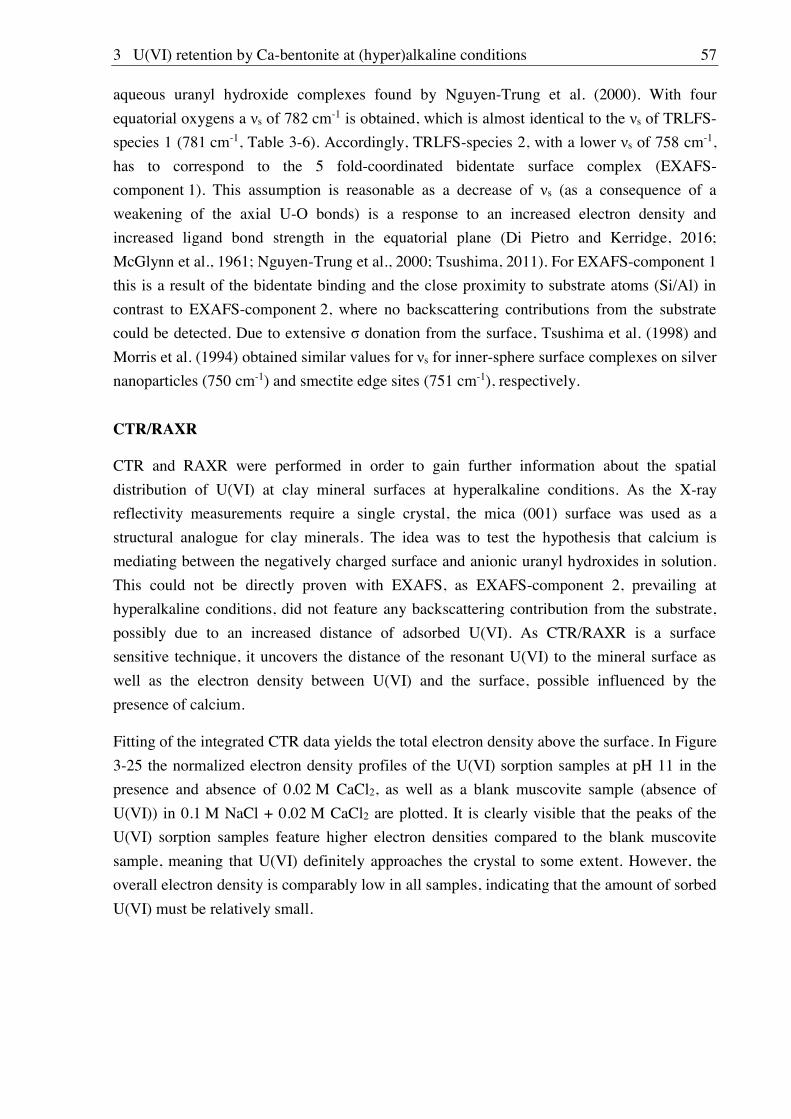
3 U(VI) retention by Ca-bentonite at (hyper)alkaline conditions 57
aqueous uranyl hydroxide complexes found by Nguyen-Trung et al. (2000). With four
equatorial oxygens a s of 782 cm-1 is obtained, which is almost identical to the s of TRLFS-
species 1 (781 cm-1, Table 3-6). Accordingly, TRLFS-species 2, with a lower s of 758 cm-1,
has to correspond to the 5 fold-coordinated bidentate surface complex (EXAFS-
component 1). This assumption is reasonable as a decrease of s (as a consequence of a
weakening of the axial U-O bonds) is a response to an increased electron density and
increased ligand bond strength in the equatorial plane (Di Pietro and Kerridge, 2016;
McGlynn et al., 1961; Nguyen-Trung et al., 2000; Tsushima, 2011). For EXAFS-component 1
this is a result of the bidentate binding and the close proximity to substrate atoms (Si/Al) in
contrast to EXAFS-component 2, where no backscattering contributions from the substrate
could be detected. Due to extensive donation from the surface, Tsushima et al. (1998) and
Morris et al. (1994) obtained similar values for s for inner-sphere surface complexes on silver
nanoparticles (750 cm-1) and smectite edge sites (751 cm-1), respectively.
CTR/RAXR
CTR and RAXR were performed in order to gain further information about the spatial
distribution of U(VI) at clay mineral surfaces at hyperalkaline conditions. As the X-ray
reflectivity measurements require a single crystal, the mica (001) surface was used as a
structural analogue for clay minerals. The idea was to test the hypothesis that calcium is
mediating between the negatively charged surface and anionic uranyl hydroxides in solution.
This could not be directly proven with EXAFS, as EXAFS-component 2, prevailing at
hyperalkaline conditions, did not feature any backscattering contribution from the substrate,
possibly due to an increased distance of adsorbed U(VI). As CTR/RAXR is a surface
sensitive technique, it uncovers the distance of the resonant U(VI) to the mineral surface as
well as the electron density between U(VI) and the surface, possible influenced by the
presence of calcium.
Fitting of the integrated CTR data yields the total electron density above the surface. In Figure
3-25 the normalized electron density profiles of the U(VI) sorption samples at pH 11 in the
presence and absence of 0.02 M CaCl2, as well as a blank muscovite sample (absence of
U(VI)) in 0.1 M NaCl + 0.02 M CaCl2 are plotted. It is clearly visible that the peaks of the
U(VI) sorption samples feature higher electron densities compared to the blank muscovite
sample, meaning that U(VI) definitely approaches the crystal to some extent. However, the
overall electron density is comparably low in all samples, indicating that the amount of sorbed
U(VI) must be relatively small.
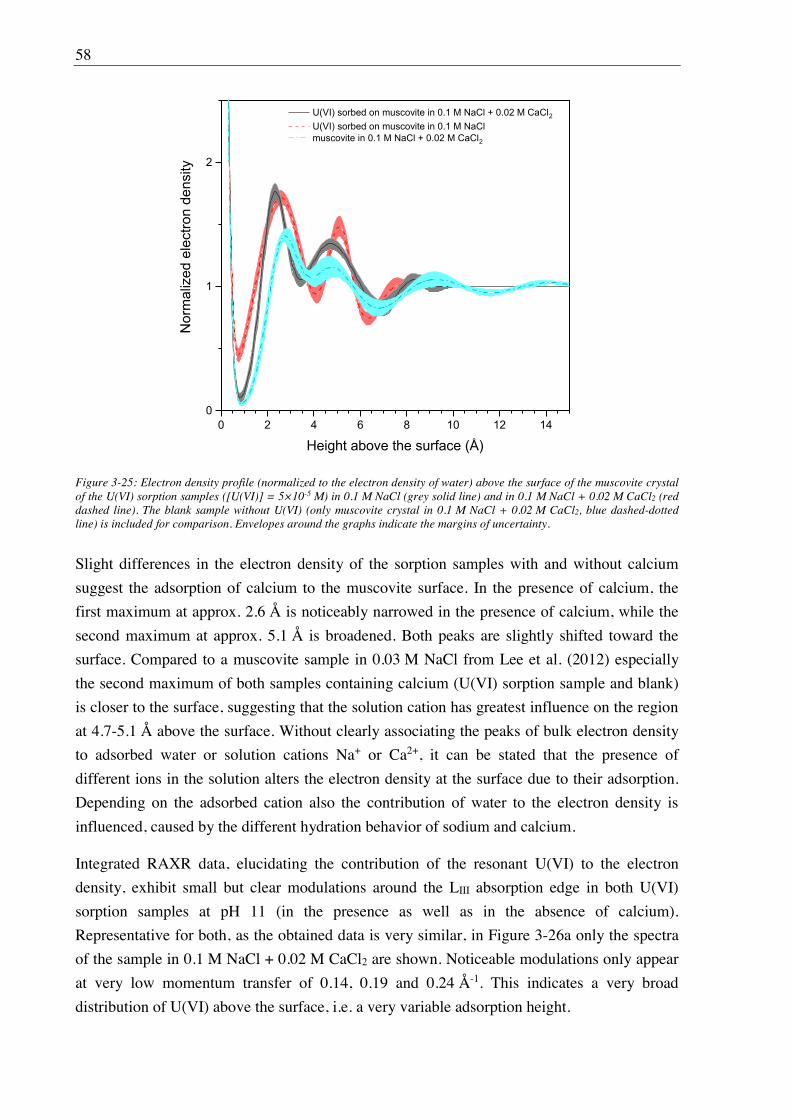
58
0 2 4 6 8 10 12 140
1
2
U(VI) sorbed on muscovite in 0.1 M NaCl + 0.02 M CaCl2 U(VI) sorbed on muscovite in 0.1 M NaCl muscovite in 0.1 M NaCl + 0.02 M CaCl2
Nor
mal
ized
ele
ctro
n de
nsity
Height above the surface (Å)
Figure 3-25: Electron density profile (normalized to the electron density of water) above the surface of the muscovite crystal of the U(VI) sorption samples ([U(VI)] = 5×10⁻⁵ M) in 0.1 M NaCl (grey solid line) and in 0.1 M NaCl + 0.02 M CaCl2 (red dashed line). The blank sample without U(VI) (only muscovite crystal in 0.1 M NaCl + 0.02 M CaCl2, blue dashed-dotted line) is included for comparison. Envelopes around the graphs indicate the margins of uncertainty.
Slight differences in the electron density of the sorption samples with and without calcium
suggest the adsorption of calcium to the muscovite surface. In the presence of calcium, the
first maximum at approx. 2.6 Å is noticeably narrowed in the presence of calcium, while the
second maximum at approx. 5.1 Å is broadened. Both peaks are slightly shifted toward the
surface. Compared to a muscovite sample in 0.03 M NaCl from Lee et al. (2012) especially
the second maximum of both samples containing calcium (U(VI) sorption sample and blank)
is closer to the surface, suggesting that the solution cation has greatest influence on the region
at 4.7-5.1 Å above the surface. Without clearly associating the peaks of bulk electron density
to adsorbed water or solution cations Na+ or Ca2+, it can be stated that the presence of
different ions in the solution alters the electron density at the surface due to their adsorption.
Depending on the adsorbed cation also the contribution of water to the electron density is
influenced, caused by the different hydration behavior of sodium and calcium.
Integrated RAXR data, elucidating the contribution of the resonant U(VI) to the electron
density, exhibit small but clear modulations around the LIII absorption edge in both U(VI)
sorption samples at pH 11 (in the presence as well as in the absence of calcium).
Representative for both, as the obtained data is very similar, in Figure 3-26a only the spectra
of the sample in 0.1 M NaCl + 0.02 M CaCl2 are shown. Noticeable modulations only appear
at very low momentum transfer of 0.14, 0.19 and 0.24 Å-1. This indicates a very broad
distribution of U(VI) above the surface, i.e. a very variable adsorption height.
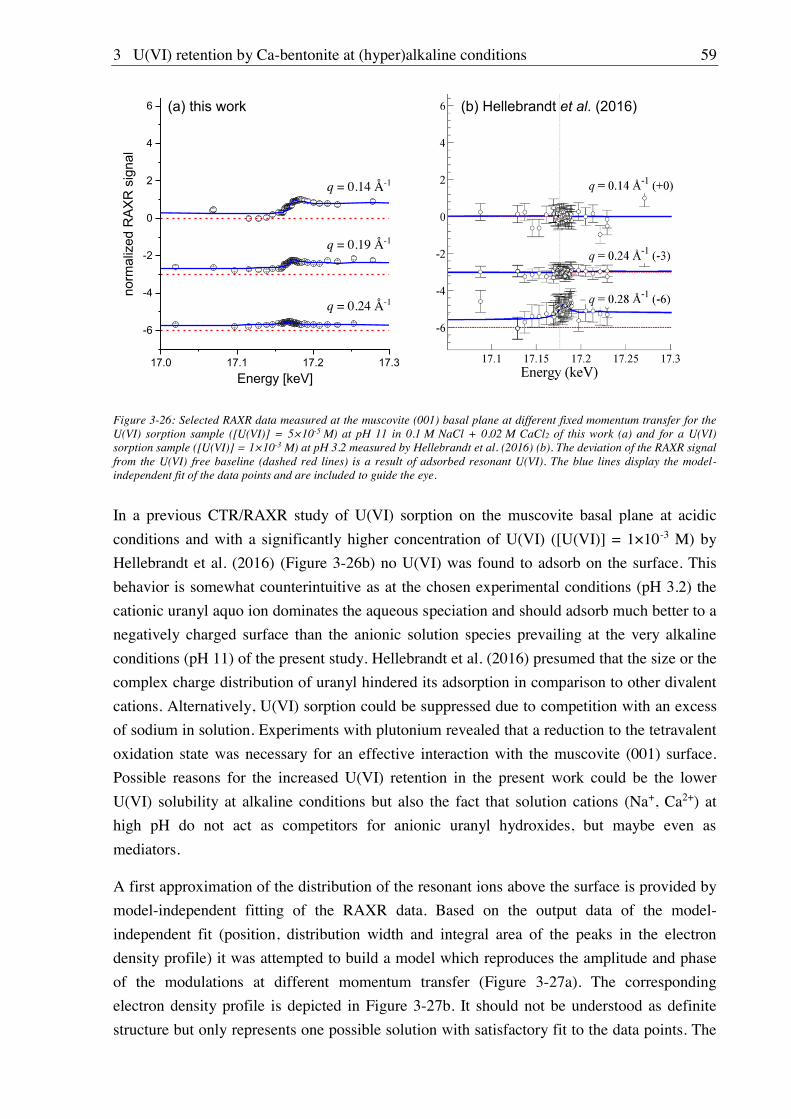
3 U(VI) retention by Ca-bentonite at (hyper)alkaline conditions 59
17.0 17.1 17.2 17.3
-6
-4
-2
0
2
4
6
norm
aliz
ed R
AX
R s
igna
l
Energy [keV]
(a) this work (b) Hellebrandt et al. (2016)
q = 0.14 Å-1
q = 0.19 Å-1
q = 0.24 Å-1
Figure 3-26: Selected RAXR data measured at the muscovite (001) basal plane at different fixed momentum transfer for the U(VI) sorption sample ([U(VI)] = 5×10⁻⁵ M) at pH 11 in 0.1 M NaCl + 0.02 M CaCl2 of this work (a) and for a U(VI) sorption sample ([U(VI)] = 1×10⁻³ M) at pH 3.2 measured by Hellebrandt et al. (2016) (b). The deviation of the RAXR signal from the U(VI) free baseline (dashed red lines) is a result of adsorbed resonant U(VI). The blue lines display the model-independent fit of the data points and are included to guide the eye.
In a previous CTR/RAXR study of U(VI) sorption on the muscovite basal plane at acidic
conditions and with a significantly higher concentration of U(VI) ([U(VI)] = 1×10⁻³ M) by
Hellebrandt et al. (2016) (Figure 3-26b) no U(VI) was found to adsorb on the surface. This
behavior is somewhat counterintuitive as at the chosen experimental conditions (pH 3.2) the
cationic uranyl aquo ion dominates the aqueous speciation and should adsorb much better to a
negatively charged surface than the anionic solution species prevailing at the very alkaline
conditions (pH 11) of the present study. Hellebrandt et al. (2016) presumed that the size or the
complex charge distribution of uranyl hindered its adsorption in comparison to other divalent
cations. Alternatively, U(VI) sorption could be suppressed due to competition with an excess
of sodium in solution. Experiments with plutonium revealed that a reduction to the tetravalent
oxidation state was necessary for an effective interaction with the muscovite (001) surface.
Possible reasons for the increased U(VI) retention in the present work could be the lower
U(VI) solubility at alkaline conditions but also the fact that solution cations (Na+, Ca2+) at
high pH do not act as competitors for anionic uranyl hydroxides, but maybe even as
mediators.
A first approximation of the distribution of the resonant ions above the surface is provided by
model-independent fitting of the RAXR data. Based on the output data of the model-
independent fit (position, distribution width and integral area of the peaks in the electron
density profile) it was attempted to build a model which reproduces the amplitude and phase
of the modulations at different momentum transfer (Figure 3-27a). The corresponding
electron density profile is depicted in Figure 3-27b. It should not be understood as definite
structure but only represents one possible solution with satisfactory fit to the data points. The
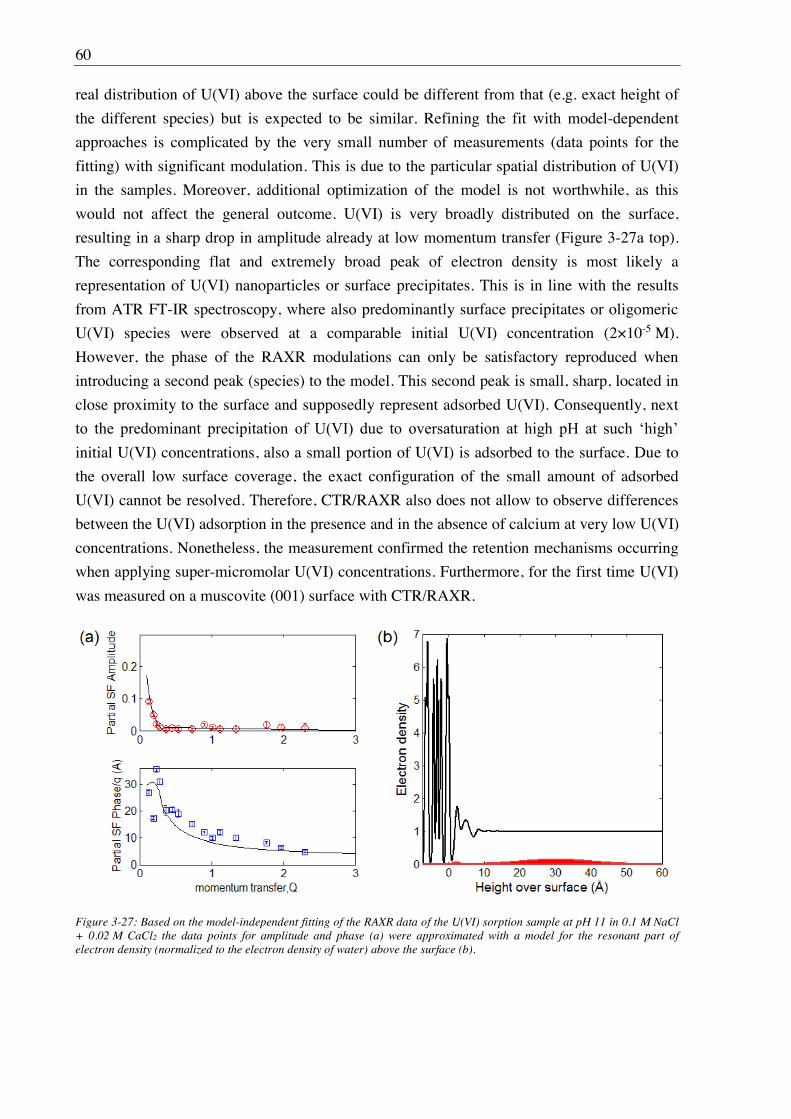
60
real distribution of U(VI) above the surface could be different from that (e.g. exact height of
the different species) but is expected to be similar. Refining the fit with model-dependent
approaches is complicated by the very small number of measurements (data points for the
fitting) with significant modulation. This is due to the particular spatial distribution of U(VI)
in the samples. Moreover, additional optimization of the model is not worthwhile, as this
would not affect the general outcome. U(VI) is very broadly distributed on the surface,
resulting in a sharp drop in amplitude already at low momentum transfer (Figure 3-27a top).
The corresponding flat and extremely broad peak of electron density is most likely a
representation of U(VI) nanoparticles or surface precipitates. This is in line with the results
from ATR FT-IR spectroscopy, where also predominantly surface precipitates or oligomeric
U(VI) species were observed at a comparable initial U(VI) concentration (2×10⁻⁵ M).
However, the phase of the RAXR modulations can only be satisfactory reproduced when
introducing a second peak (species) to the model. This second peak is small, sharp, located in
close proximity to the surface and supposedly represent adsorbed U(VI). Consequently, next
initial U(VI) concentrations, also a small portion of U(VI) is adsorbed to the surface. Due to
the overall low surface coverage, the exact configuration of the small amount of adsorbed
U(VI) cannot be resolved. Therefore, CTR/RAXR also does not allow to observe differences
between the U(VI) adsorption in the presence and in the absence of calcium at very low U(VI)
concentrations. Nonetheless, the measurement confirmed the retention mechanisms occurring
when applying super-micromolar U(VI) concentrations. Furthermore, for the first time U(VI)
was measured on a muscovite (001) surface with CTR/RAXR.
Figure 3-27: Based on the model-independent fitting of the RAXR data of the U(VI) sorption sample at pH 11 in 0.1 M NaCl + 0.02 M CaCl2 the data points for amplitude and phase (a) were approximated with a model for the resonant part of electron density (normalized to the electron density of water) above the surface (b).
4 Influence of Ca(II) on U(VI) and Np(VI) sorption on clay minerals at (hyper)alkaline conditions 61
4. Influence of Ca(II) on U(VI) and Np(VI) sorption on clay minerals at (hyper)alkaline conditions
The groundbreaking outcome of the experiments on U(VI) sorption on Ca-bentonite at
(hyper)alkaline conditions (chapter 3.2.2) was that the predominant retention mechanism
between pH 10 and 12 under the given conditions was adsorption despite the anionic
character of prevailing aqueous species. It was hypothesized that the attachment to the
negatively charged mineral surface could be mediated by calcium, of which large amounts
were present in the background electrolyte. Possible mechanisms involve the formation of
aqueous ternary Ca-U-OH complexes, which do not feature a negative net charge, allowing
for interaction with the mineral surface. The existence of such complexes was so far only
hypothesized but has never been investigated. Another plausible mechanism is the adsorption
of calcium to the mineral surface in the first place, creating local positively charged sites,
where the actinyl hydroxides can attach. In order to prove this hypothesis, this chapter is
dedicated to the careful evaluation of the effect of calcium on An(VI) sorption on clay
minerals. It encompasses the study of calcium sorption on Ca-bentonite (and its effect on the
surface charge of Ca-bentonite), the influence of calcium on batch sorption of U(VI) and
Np(VI) on different clay minerals, and the spectroscopic identification of such calcium-
induced U(VI) sorption complexes with site-selective TRLFS.
4.1. Experimental
The experimental conditions related to these specific experiments are compiled in chapter 3.1.
4.2. Results and discussion
4.2.1. Ca(II) sorption on Ca-bentonite at (hyper)alkaline conditions
The sorption of calcium on Ca-bentonite was investigated in batch sorption experiments as a
function of S/L ratio and pH. The initial calcium concentration of 2×10⁻⁴ M, spiked with
1×10-12 M 45Ca was chosen based on estimations for a monolayer saturation of the bentonite
surface with calcium cations according to literature values for montmorillonite surface site
density of 2×10⁻⁵ mol/g (Wieland et al., 1994). The amount of calcium removed from the
solution was determined by LSC of 45Ca.
The batch experiments as a function of S/L ratio prove that calcium strongly adsorbs to the
Ca-bentonite surface, when sufficient sorption sites (i.e. high enough mineral mass) are
provided (Figure 4-1a). Calcium sorption increases rapidly from 34% at 0.2 g/L to more than
90% at 2 g/L, reaching a plateau of approx. 95% sorption. A maximum surface capacity for
calcium of 3.41×10⁻⁴ mol/g can be derived from the sorption at 0.2 g/L. Assuming that
adsorbed Ca2+ occupies two surface sites, this corresponds to a surface site density of
6.82×10⁻⁴ mol/g, being considerably higher than the value given by Wieland et al. (1994), but
62
very close to the cation exchange site density of MX-80 bentonite of 6.96×10⁻⁴ mol/g,
assumed by Grambow et al. (2006). Based on these results, a S/L ratio of 10 g/L (also used
for the U(VI) sorption experiments with Ca-bentonite) was chosen for the pH-dependent
sorption experiments, in order to provide enough sites for unrestricted calcium adsorption.
Under these conditions sorption of calcium was very high in the whole investigated pH range
8-13 (Figure 4-1b). A weak dependency on pH can be observed, as sorption is increasing with
increasing pH from 88% at pH 8 to a maximum of 97% at pH 11. This corresponds to a
maximum log(Kd) value of 3.47 log(L/kg). The slight decrease to 86% sorption at pH 13
could be due to beginning dissolution of minerals, as described in chapter 3.2.1.3.
Strong sorption of Ca2+ or Sr2+ (which can be regarded as chemical analogue) has been
observed previously already on bentonite (Cherian et al., 2018; He et al., 2016; Missana and
García-Gutiérrez, 2007; Missana et al., 2008), muscovite (Fenter et al., 2007; Schlegel et al.,
2006) and kaolinite (Chen et al., 2014). Predominant retention mechanism is cation exchange,
which is largely independent of pH, but highly sensitive to ionic strength, according to the
reaction
(4.1)
where B is a cation (i.e. Ca2+) with charge zB, which exists in the aqueous phase, and A is a
cation (e.g. H+ or Na+), with charge zA, at the clay surface ( X) (Missana and García-
Gutiérrez, 2007). A contribution of surface complexation to the retention of calcium was only
significant at pH>8. Missana and García-Gutiérrez (2007) were only able to model an
increase in calcium (Mz+) sorption from pH 8 to 10 by the introduction of a surface complex
on the amphoteric edge sites (SOH) of the clay mineral according to the following reaction
(4.2)
0 5 10 15 20
0
20
40
60
80
100
8 9 10 11 12 13
0
20
40
60
80
100
(b)
Ca
sorb
ed [%
]
S/L ratio [g/L]
(a)
Ca
sorb
ed [%
]
pH
Figure 4-1: Sorption of calcium (2×10⁻⁴ M spiked with 1×10-12 M 45Ca) on Ca-bentonite in the absence of CO2 as a function of S/L ratio (pH 10) (a) and as a function of pH (S/L ratio = 10 g/L) (b).
4 Influence of Ca(II) on U(VI) and Np(VI) sorption on clay minerals at (hyper)alkaline conditions 63
At high pH, surface complexation is promoted due to the successive deprotonation of the clay
mineral surface (SOH SO + H+). Accordingly, Schlegel et al. (2006) and Fenter et al.
(2007) also observed a contribution of surface complexation to calcium and strontium
adsorption on the mica 001 surface, expressed in the fact that the hydration shell was partly
removed. Based on these findings, surface complexation is also assumed to contribute
significantly to the strong calcium retention at pH 8-13 observed in the present study.
Further evidence for the adsorption of calcium on the Ca-bentonite surface arises from the
measurement of zeta potential with added CaCl2. Compared to the measurement in 0.1 M
NaCl (chapter 3.2.1.1), the addition of 0.02 M calcium results in a much less negative surface
charge over the entire investigated pH range 7-13 (Figure 4-2). Even though the presence of
calcium does not result in a complete reversal of surface charge, negative surface charge is
partly compensated, leading to potentials of approx. -15 mV at pH 7-11 and between -15 and
+2 mV at pH 11-13. As the measurement of zeta potential is a bulk technique, measuring the
average charge of all existing surface sites, partial compensation of negative surface charge
implies the existence of locally positively charged sites where calcium is adsorbed. Beside the
effect of calcium, also the influence of strontium on the surface charge was tested. Assuming
that the charge of the cation is the main driving factor, the adsorption of Sr2+ should be similar
to the one of Ca2+. In fact, in 0.1 M NaCl + 0.02 M SrCl2, the surface charge at pH 7-13 is
almost identical to that in 0.1 M NaCl + 0.02 M CaCl2 (Figure 4-2). That means, both divalent
cations Ca2+ and Sr2+ obviously have the same charge compensating effect.
7 8 9 10 11 12 13-50
-40
-30
-20
-10
0
0.1 M NaCl10.1 M NaCl + 0.02 M CaCl20.1 M NaCl + 0.02 M SrCl2
zeta
pot
entia
l [m
V]
pH
Figure 4-2: Surface potential of Ca-bentonite (0.1 g/L) as a function of pH and background electrolyte.
64
Similar impact on surface charge due to adsorption of calcium at alkaline conditions has been
previously reported for different types of bentonite (Cherian et al., 2018; Ho and Handy,
1963), kaolinite (Atesok et al., 1988; Farooq et al., 2011) and cementitious material (Pointeau
et al., 2006; Viallis-Terrisse et al., 2001), where even an reversal of charge was observed.
Both zeta potential measurements and Ca batch sorption experiments have shown that
calcium adsorbs strongly to the Ca-bentonite surface and consequently, potentially generates
alternative sorption sites for anionic actinyl hydroxides. The resulting calcium-induced
changes in U(VI) and Np(VI) sorption behavior are investigated in the following chapters.
4.2.2. Effect of Ca(II) on U(VI) sorption on montmorillonite, kaolinite and muscovite
As all previous U(VI) sorption experiments (on Ca-bentonite in diluted Gipshut solution)
were conducted in the presence of calcium, the aim was to perform similar experiments, but
with the exclusion of calcium. For that purpose, suspensions were prepared in NaCl
background solutions and the minerals Na-montmorillonite, synthetic kaolinite and muscovite
were chosen, which supposedly do not contain any calcium that could be leached during the
experiment. Assuming that calcium is responsible for enabling sorption of anionic uranyl
hydroxide complexes, U(VI) retention is expected to be radically decreased in these
experiments between pH 10 and 12 compared to the results presented in chapter 3.2.2.1.
4.2.2.1. Batch sorption experiments
U(VI) sorption on Na-montmorillonite
Figure 4-3 shows the batch sorption of U(VI) on Na-montmorillonite between pH 8 and 13 in
the absence of CO2 (a) and at low carbonate concentration (1 mM) (b), both in 0.1 and 2.6 M
NaCl. The pH-dependent sorption on Ca-bentonite in diluted Gipshut solution is included in
the diagrams for comparison. In the absence of CO2 the U(VI) sorption on Na-
montmorillonite is extremely high up to pH 12, followed by a sharp decrease (Figure 4-3a).
This behavior is very similar to the U(VI) sorption on Ca-bentonite. The slightly lower
retention at pH 8-9 in the experiments with Ca-bentonite could be a result of small fractions
of (calcium) uranyl carbonate complexes which might be forming due to release of minimal
amounts of carbonate from the Ca-bentonite. Most significant difference between the sorption
curves is the earlier decrease in retention with increasing pH in the series with 0.1 M NaCl.
While sorption at pH 12 in 2.6 M NaCl is still at 95%, it has dropped to 52% in 0.1 M NaCl.
This behavior can be explained with the ionic strength dependency of U(VI) hydrolysis. With
increasing ionic strength, the formation of highly charged species is hampered, meaning that
at I = 2.6 M the 1:4 hydrolysis species UO2(OH)42 , to which the decrease in U(VI) retention
is attributed, gains predominance over the 1:3 complex only at higher pH, compared to the
low ionic strength case. The U(VI) retention at pH 10-12 remains virtually unchanged
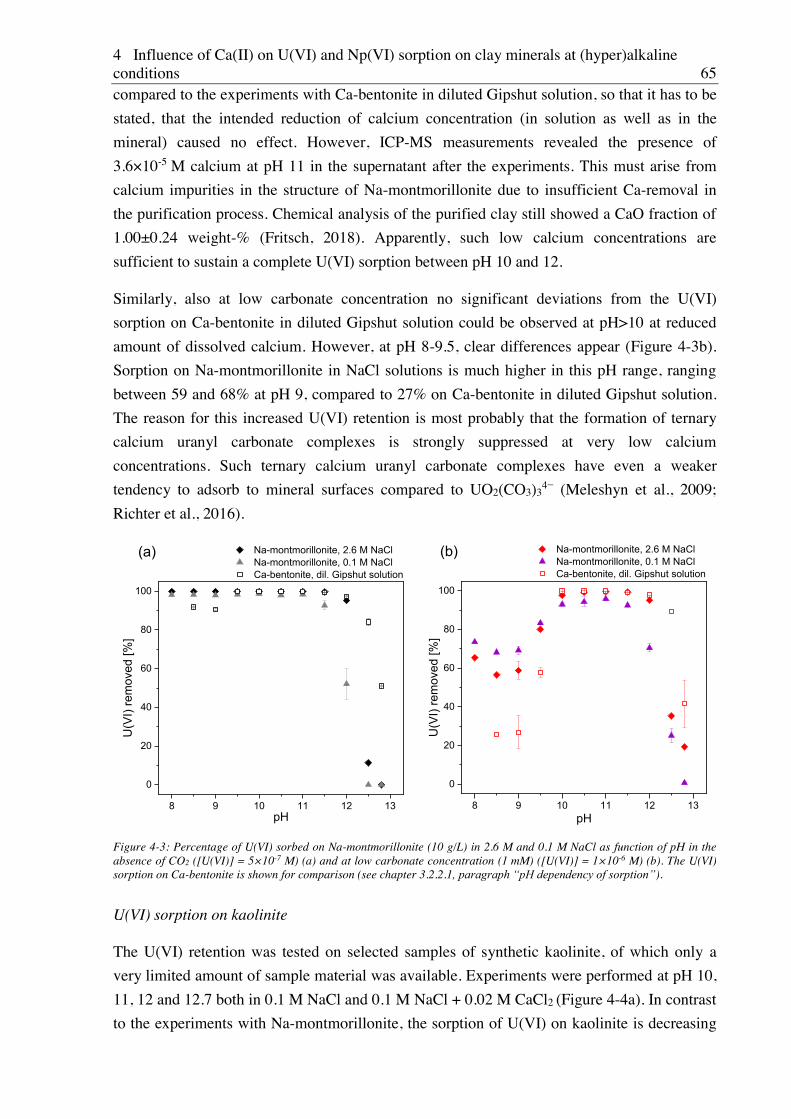
4 Influence of Ca(II) on U(VI) and Np(VI) sorption on clay minerals at (hyper)alkaline conditions 65
compared to the experiments with Ca-bentonite in diluted Gipshut solution, so that it has to be
stated, that the intended reduction of calcium concentration (in solution as well as in the
mineral) caused no effect. However, ICP-MS measurements revealed the presence of
3.6×10⁻⁵ M calcium at pH 11 in the supernatant after the experiments. This must arise from
calcium impurities in the structure of Na-montmorillonite due to insufficient Ca-removal in
the purification process. Chemical analysis of the purified clay still showed a CaO fraction of
1.00±0.24 weight-% (Fritsch, 2018). Apparently, such low calcium concentrations are
sufficient to sustain a complete U(VI) sorption between pH 10 and 12.
Similarly, also at low carbonate concentration no significant deviations from the U(VI)
sorption on Ca-bentonite in diluted Gipshut solution could be observed at pH>10 at reduced
amount of dissolved calcium. However, at pH 8-9.5, clear differences appear (Figure 4-3b).
Sorption on Na-montmorillonite in NaCl solutions is much higher in this pH range, ranging
between 59 and 68% at pH 9, compared to 27% on Ca-bentonite in diluted Gipshut solution.
The reason for this increased U(VI) retention is most probably that the formation of ternary
calcium uranyl carbonate complexes is strongly suppressed at very low calcium
concentrations. Such ternary calcium uranyl carbonate complexes have even a weaker
tendency to adsorb to mineral surfaces compared to UO2(CO3)34 (Meleshyn et al., 2009;
Richter et al., 2016).
8 9 10 11 12 13
0
20
40
60
80
100
8 9 10 11 12 13
0
20
40
60
80
100
Na-montmorillonite, 2.6 M NaCl Na-montmorillonite, 0.1 M NaCl Ca-bentonite, dil. Gipshut solution
U(V
I) re
mov
ed [%
]
pH
(b)(a) Na-montmorillonite, 2.6 M NaCl Na-montmorillonite, 0.1 M NaCl Ca-bentonite, dil. Gipshut solution
U(V
I) re
mov
ed [%
]
pH
Figure 4-3: Percentage of U(VI) sorbed on Na-montmorillonite (10 g/L) in 2.6 M and 0.1 M NaCl as function of pH in the absence of CO2 ([U(VI)] = 5×10⁻⁷ M) (a) and at low carbonate concentration (1 mM) ([U(VI)] = 1×10⁻⁶ M) (b). The U(VI) sorption on Ca-bentonite is shown for comparison (see chapter 3.2.2.1, paragraph “pH dependency of sorption”).
U(VI) sorption on kaolinite
The U(VI) retention was tested on selected samples of synthetic kaolinite, of which only a
very limited amount of sample material was available. Experiments were performed at pH 10,
11, 12 and 12.7 both in 0.1 M NaCl and 0.1 M NaCl + 0.02 M CaCl2 (Figure 4-4a). In contrast
to the experiments with Na-montmorillonite, the sorption of U(VI) on kaolinite is decreasing
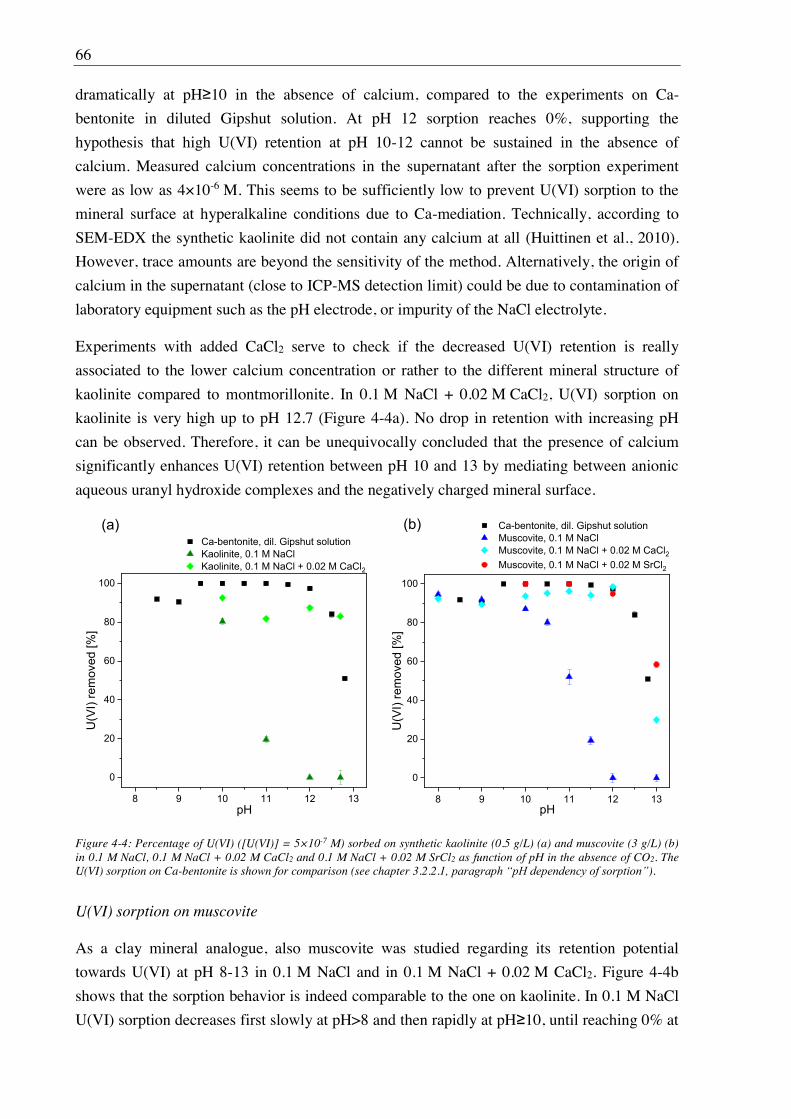
66
dramatically at pH 10 in the absence of calcium, compared to the experiments on Ca-
bentonite in diluted Gipshut solution. At pH 12 sorption reaches 0%, supporting the
hypothesis that high U(VI) retention at pH 10-12 cannot be sustained in the absence of
calcium. Measured calcium concentrations in the supernatant after the sorption experiment
were as low as 4×10⁻⁶ M. This seems to be sufficiently low to prevent U(VI) sorption to the
mineral surface at hyperalkaline conditions due to Ca-mediation. Technically, according to
SEM-EDX the synthetic kaolinite did not contain any calcium at all (Huittinen et al., 2010).
However, trace amounts are beyond the sensitivity of the method. Alternatively, the origin of
calcium in the supernatant (close to ICP-MS detection limit) could be due to contamination of
laboratory equipment such as the pH electrode, or impurity of the NaCl electrolyte.
Experiments with added CaCl2 serve to check if the decreased U(VI) retention is really
associated to the lower calcium concentration or rather to the different mineral structure of
kaolinite compared to montmorillonite. In 0.1 M NaCl + 0.02 M CaCl2, U(VI) sorption on
kaolinite is very high up to pH 12.7 (Figure 4-4a). No drop in retention with increasing pH
can be observed. Therefore, it can be unequivocally concluded that the presence of calcium
significantly enhances U(VI) retention between pH 10 and 13 by mediating between anionic
aqueous uranyl hydroxide complexes and the negatively charged mineral surface.
8 9 10 11 12 13
0
20
40
60
80
100
8 9 10 11 12 13
0
20
40
60
80
100
Ca-bentonite, dil. Gipshut solutionKaolinite, 0.1 M NaClKaolinite, 0.1 M NaCl + 0.02 M CaCl2
U(V
I) re
mov
ed [%
]
pH
Ca-bentonite, dil. Gipshut solution Muscovite, 0.1 M NaCl Muscovite, 0.1 M NaCl + 0.02 M CaCl2 Muscovite, 0.1 M NaCl + 0.02 M SrCl2
(b)(a)
U(V
I) re
mov
ed [%
]
pH
Figure 4-4: Percentage of U(VI) ([U(VI)] = 5×10⁻⁷ M) sorbed on synthetic kaolinite (0.5 g/L) (a) and muscovite (3 g/L) (b) in 0.1 M NaCl, 0.1 M NaCl + 0.02 M CaCl2 and 0.1 M NaCl + 0.02 M SrCl2 as function of pH in the absence of CO2. The U(VI) sorption on Ca-bentonite is shown for comparison (see chapter 3.2.2.1, paragraph “pH dependency of sorption”).
U(VI) sorption on muscovite
As a clay mineral analogue, also muscovite was studied regarding its retention potential
towards U(VI) at pH 8-13 in 0.1 M NaCl and in 0.1 M NaCl + 0.02 M CaCl2. Figure 4-4b
shows that the sorption behavior is indeed comparable to the one on kaolinite. In 0.1 M NaCl
U(VI) sorption decreases first slowly at pH>8 and then rapidly at pH 10, until reaching 0% at
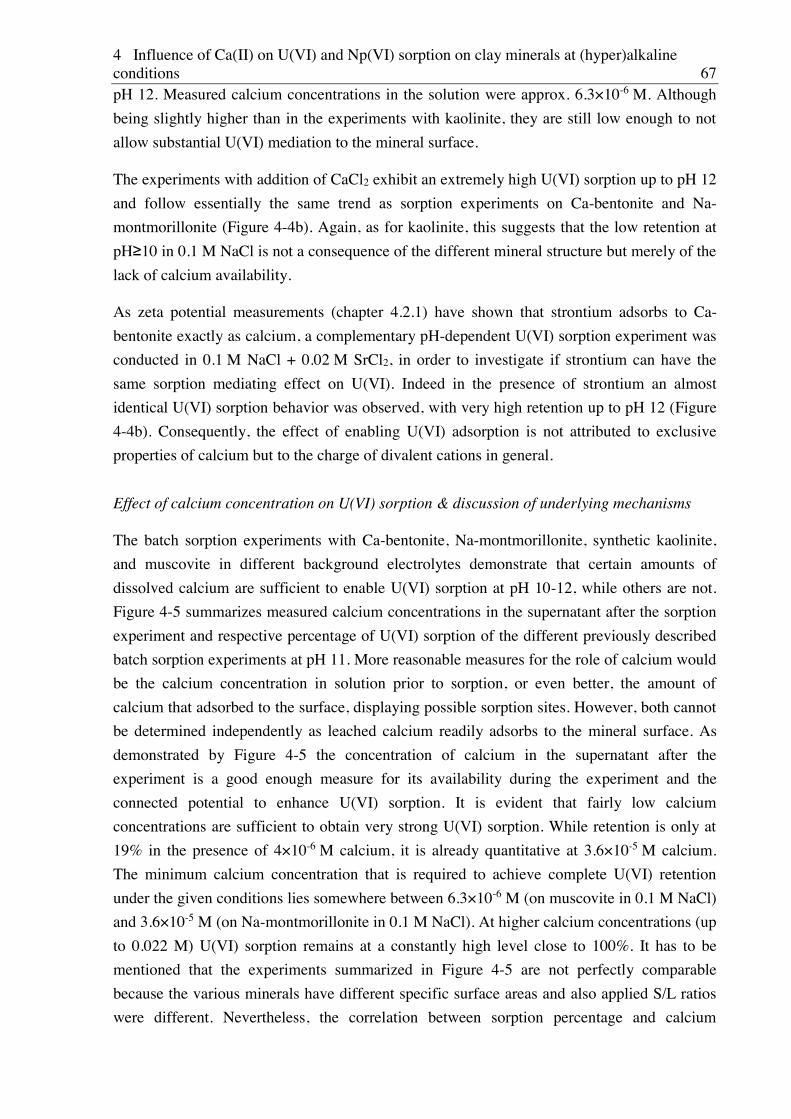
4 Influence of Ca(II) on U(VI) and Np(VI) sorption on clay minerals at (hyper)alkaline conditions 67
pH 12. Measured calcium concentrations in the solution were approx. 6.3×10⁻⁶ M. Although
being slightly higher than in the experiments with kaolinite, they are still low enough to not
allow substantial U(VI) mediation to the mineral surface.
The experiments with addition of CaCl2 exhibit an extremely high U(VI) sorption up to pH 12
and follow essentially the same trend as sorption experiments on Ca-bentonite and Na-
montmorillonite (Figure 4-4b). Again, as for kaolinite, this suggests that the low retention at
pH 10 in 0.1 M NaCl is not a consequence of the different mineral structure but merely of the
lack of calcium availability.
As zeta potential measurements (chapter 4.2.1) have shown that strontium adsorbs to Ca-
bentonite exactly as calcium, a complementary pH-dependent U(VI) sorption experiment was
conducted in 0.1 M NaCl + 0.02 M SrCl2, in order to investigate if strontium can have the
same sorption mediating effect on U(VI). Indeed in the presence of strontium an almost
identical U(VI) sorption behavior was observed, with very high retention up to pH 12 (Figure
4-4b). Consequently, the effect of enabling U(VI) adsorption is not attributed to exclusive
properties of calcium but to the charge of divalent cations in general.
Effect of calcium concentration on U(VI) sorption & discussion of underlying mechanisms
The batch sorption experiments with Ca-bentonite, Na-montmorillonite, synthetic kaolinite,
and muscovite in different background electrolytes demonstrate that certain amounts of
dissolved calcium are sufficient to enable U(VI) sorption at pH 10-12, while others are not.
Figure 4-5 summarizes measured calcium concentrations in the supernatant after the sorption
experiment and respective percentage of U(VI) sorption of the different previously described
batch sorption experiments at pH 11. More reasonable measures for the role of calcium would
be the calcium concentration in solution prior to sorption, or even better, the amount of
calcium that adsorbed to the surface, displaying possible sorption sites. However, both cannot
be determined independently as leached calcium readily adsorbs to the mineral surface. As
demonstrated by Figure 4-5 the concentration of calcium in the supernatant after the
experiment is a good enough measure for its availability during the experiment and the
connected potential to enhance U(VI) sorption. It is evident that fairly low calcium
concentrations are sufficient to obtain very strong U(VI) sorption. While retention is only at
19% in the presence of 4×10⁻⁶ M calcium, it is already quantitative at 3.6×10⁻⁵ M calcium.
The minimum calcium concentration that is required to achieve complete U(VI) retention
under the given conditions lies somewhere between 6.3×10⁻⁶ M (on muscovite in 0.1 M NaCl)
and 3.6×10⁻⁵ M (on Na-montmorillonite in 0.1 M NaCl). At higher calcium concentrations (up
to 0.022 M) U(VI) sorption remains at a constantly high level close to 100%. It has to be
mentioned that the experiments summarized in Figure 4-5 are not perfectly comparable
because the various minerals have different specific surface areas and also applied S/L ratios
were different. Nevertheless, the correlation between sorption percentage and calcium
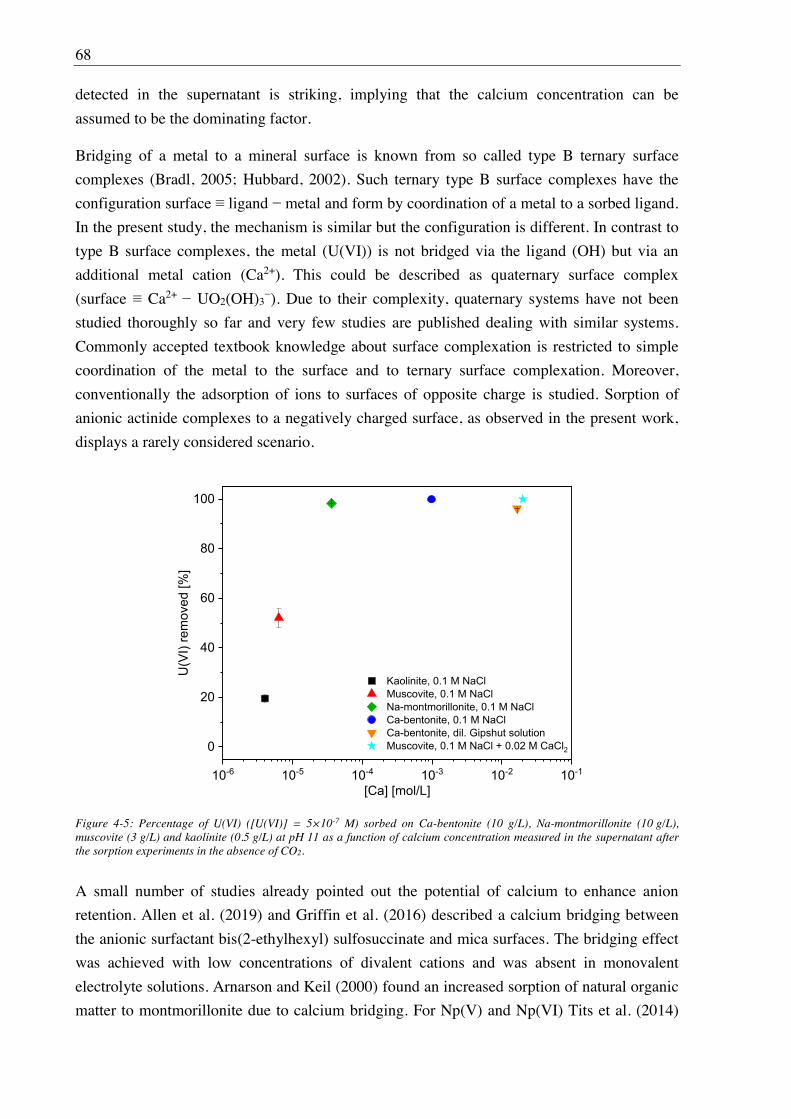
68
detected in the supernatant is striking, implying that the calcium concentration can be
assumed to be the dominating factor.
Bridging of a metal to a mineral surface is known from so called type B ternary surface
complexes (Bradl, 2005; Hubbard, 2002). Such ternary type B surface complexes have the
configuration surface ligand metal and form by coordination of a metal to a sorbed ligand.
In the present study, the mechanism is similar but the configuration is different. In contrast to
type B surface complexes, the metal (U(VI)) is not bridged via the ligand (OH) but via an
additional metal cation (Ca2+). This could be described as quaternary surface complex
(surface Ca2+ UO2(OH)3 ). Due to their complexity, quaternary systems have not been
studied thoroughly so far and very few studies are published dealing with similar systems.
Commonly accepted textbook knowledge about surface complexation is restricted to simple
coordination of the metal to the surface and to ternary surface complexation. Moreover,
conventionally the adsorption of ions to surfaces of opposite charge is studied. Sorption of
anionic actinide complexes to a negatively charged surface, as observed in the present work,
displays a rarely considered scenario.
10-6 10-5 10-4 10-3 10-2 10-1
0
20
40
60
80
100
Kaolinite, 0.1 M NaCl Muscovite, 0.1 M NaCl Na-montmorillonite, 0.1 M NaCl Ca-bentonite, 0.1 M NaCl Ca-bentonite, dil. Gipshut solution Muscovite, 0.1 M NaCl + 0.02 M CaCl2
U(V
I) re
mov
ed [%
]
[Ca] [mol/L]
Figure 4-5: Percentage of U(VI) ([U(VI)] = 5×10⁻⁷ M) sorbed on Ca-bentonite (10 g/L), Na-montmorillonite (10 g/L), muscovite (3 g/L) and kaolinite (0.5 g/L) at pH 11 as a function of calcium concentration measured in the supernatant after the sorption experiments in the absence of CO2.
A small number of studies already pointed out the potential of calcium to enhance anion
retention. Allen et al. (2019) and Griffin et al. (2016) described a calcium bridging between
the anionic surfactant bis(2-ethylhexyl) sulfosuccinate and mica surfaces. The bridging effect
was achieved with low concentrations of divalent cations and was absent in monovalent
electrolyte solutions. Arnarson and Keil (2000) found an increased sorption of natural organic
matter to montmorillonite due to calcium bridging. For Np(V) and Np(VI) Tits et al. (2014)
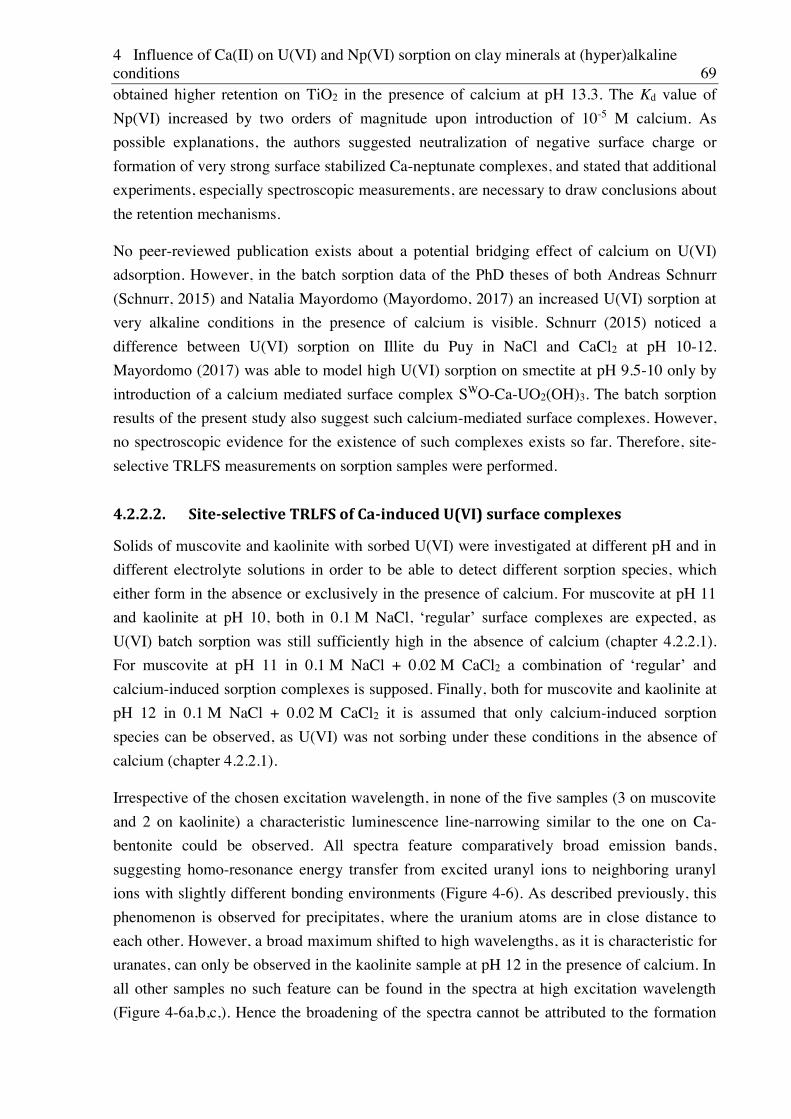
4 Influence of Ca(II) on U(VI) and Np(VI) sorption on clay minerals at (hyper)alkaline conditions 69
obtained higher retention on TiO2 in the presence of calcium at pH 13.3. The Kd value of
Np(VI) increased by two orders of magnitude upon introduction of 10-5 M calcium. As
possible explanations, the authors suggested neutralization of negative surface charge or
formation of very strong surface stabilized Ca-neptunate complexes, and stated that additional
experiments, especially spectroscopic measurements, are necessary to draw conclusions about
the retention mechanisms.
No peer-reviewed publication exists about a potential bridging effect of calcium on U(VI)
adsorption. However, in the batch sorption data of the PhD theses of both Andreas Schnurr
(Schnurr, 2015) and Natalia Mayordomo (Mayordomo, 2017) an increased U(VI) sorption at
very alkaline conditions in the presence of calcium is visible. Schnurr (2015) noticed a
difference between U(VI) sorption on Illite du Puy in NaCl and CaCl2 at pH 10-12.
Mayordomo (2017) was able to model high U(VI) sorption on smectite at pH 9.5-10 only by
introduction of a calcium mediated surface complex SWO-Ca-UO2(OH)3. The batch sorption
results of the present study also suggest such calcium-mediated surface complexes. However,
no spectroscopic evidence for the existence of such complexes exists so far. Therefore, site-
selective TRLFS measurements on sorption samples were performed.
4.2.2.2. Site-selective TRLFS of Ca-induced U(VI) surface complexes
Solids of muscovite and kaolinite with sorbed U(VI) were investigated at different pH and in
different electrolyte solutions in order to be able to detect different sorption species, which
either form in the absence or exclusively in the presence of calcium. For muscovite at pH 11
and kaolinite at pH 10, both in 0.1 M NaCl, regular surface complexes are expected, as
U(VI) batch sorption was still sufficiently high in the absence of calcium (chapter 4.2.2.1).
For muscovite at pH 11 in 0.1 M NaCl + 0.02 M CaCl2
calcium-induced sorption complexes is supposed. Finally, both for muscovite and kaolinite at
pH 12 in 0.1 M NaCl + 0.02 M CaCl2 it is assumed that only calcium-induced sorption
species can be observed, as U(VI) was not sorbing under these conditions in the absence of
calcium (chapter 4.2.2.1).
Irrespective of the chosen excitation wavelength, in none of the five samples (3 on muscovite
and 2 on kaolinite) a characteristic luminescence line-narrowing similar to the one on Ca-
bentonite could be observed. All spectra feature comparatively broad emission bands,
suggesting homo-resonance energy transfer from excited uranyl ions to neighboring uranyl
ions with slightly different bonding environments (Figure 4-6). As described previously, this
phenomenon is observed for precipitates, where the uranium atoms are in close distance to
each other. However, a broad maximum shifted to high wavelengths, as it is characteristic for
uranates, can only be observed in the kaolinite sample at pH 12 in the presence of calcium. In
all other samples no such feature can be found in the spectra at high excitation wavelength
(Figure 4-6a,b,c,). Hence the broadening of the spectra cannot be attributed to the formation
70
of U(VI) precipitates, except for the kaolinite sample at pH 12 in the presence of calcium. The
same observation (inhomogeneous line broadening in the absence of precipitate-like spectral
features) has been made by Tits et al. (2015) for U(VI) sorbed on TiO2 under comparable
conditions. The authors stated that they could not find a reason for the absence of
luminescence line-narrowing. Combining the findings of the present study and of the one by
Tits et al. (2015) (the only two existing studies applying site-selective TRLFS to U(VI)), line-
narrowing was observed for Ca-bentonite (this study) and C-S-H but was absent on
muscovite, kaolinite (both this study) and TiO2. Hence, it has to be questioned whether the
absence of line-narrowing is really a peculiar exception or rather the rule. Apparently, for the
observation of line-narrowing certain preconditions have to be met, which are provided by
Ca-bentonite (or rather montmorillonite) and C-S-H phases. These preconditions possibly
derive from their mineral structure (and associated uranium immobilization processes) which
is distinct from the one in muscovite, kaolinite and TiO2.
Both montmorillonite and C-S-H have a sheet like structure, with two tetrahedral silicon-
oxygen layers, sandwiching aluminum octahedra or calcium polyhedra, respectively.
However, this is also the case for muscovite for which no line-narrowing could be observed.
A major difference between these minerals is how the above described units are stacked and
held together. Montmorillonite and C-S-H are swellable, being able to accommodate variable
amounts of water next to counterions in the interlayers between the negatively charged sheets.
In contrast to that, in muscovite the layers are bonded via potassium, resulting in a much
smaller interlayer distance and absence of swelling properties. As a consequence, in
montmorillonite and C-S-H radionuclides could possibly enter the interlayers and interact
with the basal planes of the mineral, while the interlayer space is inaccessible in muscovite. A
large part of its specific surface area is virtually blocked by the potassium. Also kaolinite does
not possess expandable interlayer space. The weakly charged layers are connected via
hydrogen bonds, inhibiting interactions of radionuclides with most of the basal planes.
Consequently, the possibility to observe luminescence line-narrowing could be related to the
ability of U(VI) to adsorb to the basal planes of the minerals and not only to the edge sites.
Especially calcium-mediated species which are bound electrostatically could be associated to
these sites. In case that the basal planes are not accessible for U(VI), the actual reactive
surface area is much lower than the measured BET surface area. All uranium ions then
accumulate at the edge sites, which could cause the distance between the uranium atoms to
approach the critical Förster distance, at which homo-resonance energy transfer occurs.
Knowing the specific surface area of the minerals and the U(VI) loading of 1.67×10⁻³ mol/kg,
it can be calculated that approx. 1.3, 10.1 and 4.5 uranium atoms are adsorbed on a 10 nm2
surface area of Ca-bentonite, muscovite and kaolinite, respectively. Assuming homogeneous
distribution and a model where a square area is attributed to each atom, the distance between
the single adsorbed U(VI) atoms would be approx. 2.76 nm on Ca-bentonite, 0.99 nm on
muscovite and 1.49 nm on kaolinite. Compared to Ca-bentonite, where a line-narrowing could
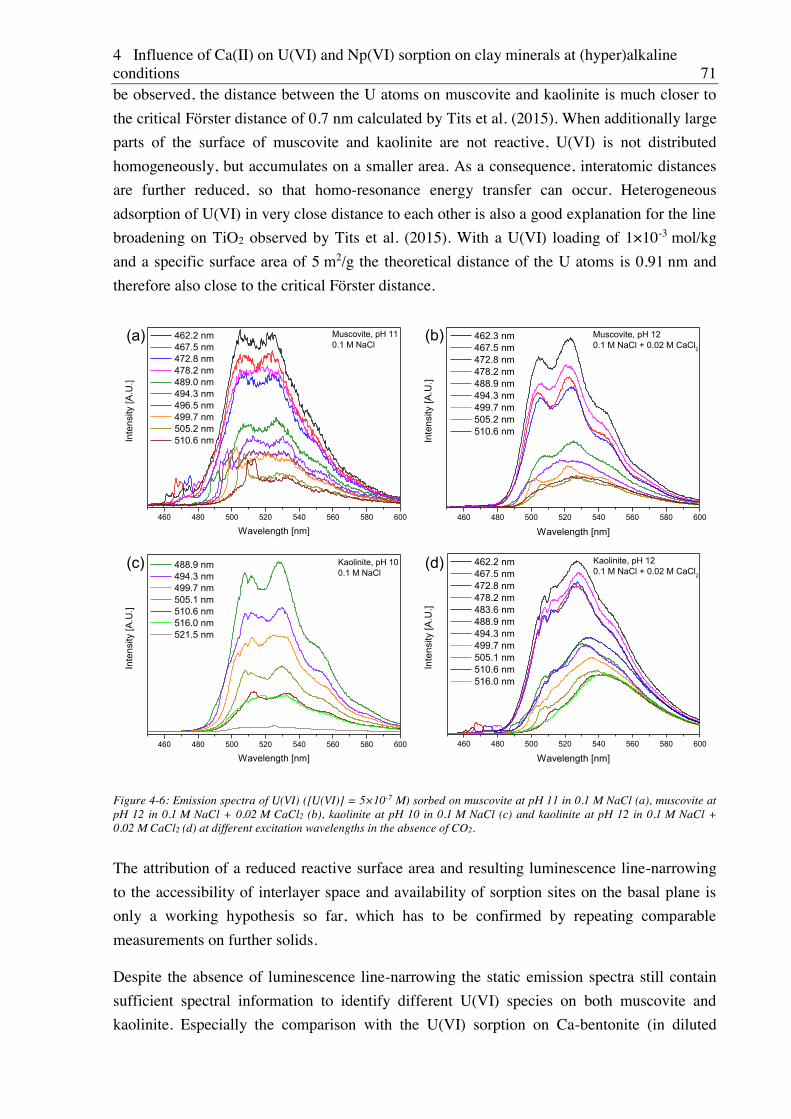
4 Influence of Ca(II) on U(VI) and Np(VI) sorption on clay minerals at (hyper)alkaline conditions 71
be observed, the distance between the U atoms on muscovite and kaolinite is much closer to
the critical Förster distance of 0.7 nm calculated by Tits et al. (2015). When additionally large
parts of the surface of muscovite and kaolinite are not reactive, U(VI) is not distributed
homogeneously, but accumulates on a smaller area. As a consequence, interatomic distances
are further reduced, so that homo-resonance energy transfer can occur. Heterogeneous
adsorption of U(VI) in very close distance to each other is also a good explanation for the line
broadening on TiO2 observed by Tits et al. (2015). With a U(VI) loading of 1×10⁻³ mol/kg
and a specific surface area of 5 m2/g the theoretical distance of the U atoms is 0.91 nm and
therefore also close to the critical Förster distance.
460 480 500 520 540 560 580 600 460 480 500 520 540 560 580 600
460 480 500 520 540 560 580 600 460 480 500 520 540 560 580 600
Muscovite, pH 110.1 M NaCl
(a)
(c) (d)
Inte
nsity
[A.U
.]
Wavelength [nm]
462.2 nm 467.5 nm 472.8 nm 478.2 nm 489.0 nm 494.3 nm 496.5 nm 499.7 nm 505.2 nm 510.6 nm
(b) Muscovite, pH 120.1 M NaCl + 0.02 M CaCl2
Inte
nsity
[A.U
.]
Wavelength [nm]
462.3 nm 467.5 nm 472.8 nm 478.2 nm 488.9 nm 494.3 nm 499.7 nm 505.2 nm 510.6 nm
Kaolinite, pH 100.1 M NaCl
488.9 nm 494.3 nm 499.7 nm 505.1 nm 510.6 nm 516.0 nm 521.5 nm
Inte
nsity
[A.U
.]
Wavelength [nm]
Kaolinite, pH 120.1 M NaCl + 0.02 M CaCl2
Inte
nsity
[A.U
.]
Wavelength [nm]
462.2 nm 467.5 nm 472.8 nm 478.2 nm 483.6 nm 488.9 nm 494.3 nm 499.7 nm 505.1 nm 510.6 nm 516.0 nm
Figure 4-6: Emission spectra of U(VI) ([U(VI)] = 5×10⁻⁷ M) sorbed on muscovite at pH 11 in 0.1 M NaCl (a), muscovite at pH 12 in 0.1 M NaCl + 0.02 M CaCl2 (b), kaolinite at pH 10 in 0.1 M NaCl (c) and kaolinite at pH 12 in 0.1 M NaCl + 0.02 M CaCl2 (d) at different excitation wavelengths in the absence of CO2.
The attribution of a reduced reactive surface area and resulting luminescence line-narrowing
to the accessibility of interlayer space and availability of sorption sites on the basal plane is
only a working hypothesis so far, which has to be confirmed by repeating comparable
measurements on further solids.
Despite the absence of luminescence line-narrowing the static emission spectra still contain
sufficient spectral information to identify different U(VI) species on both muscovite and
kaolinite. Especially the comparison with the U(VI) sorption on Ca-bentonite (in diluted
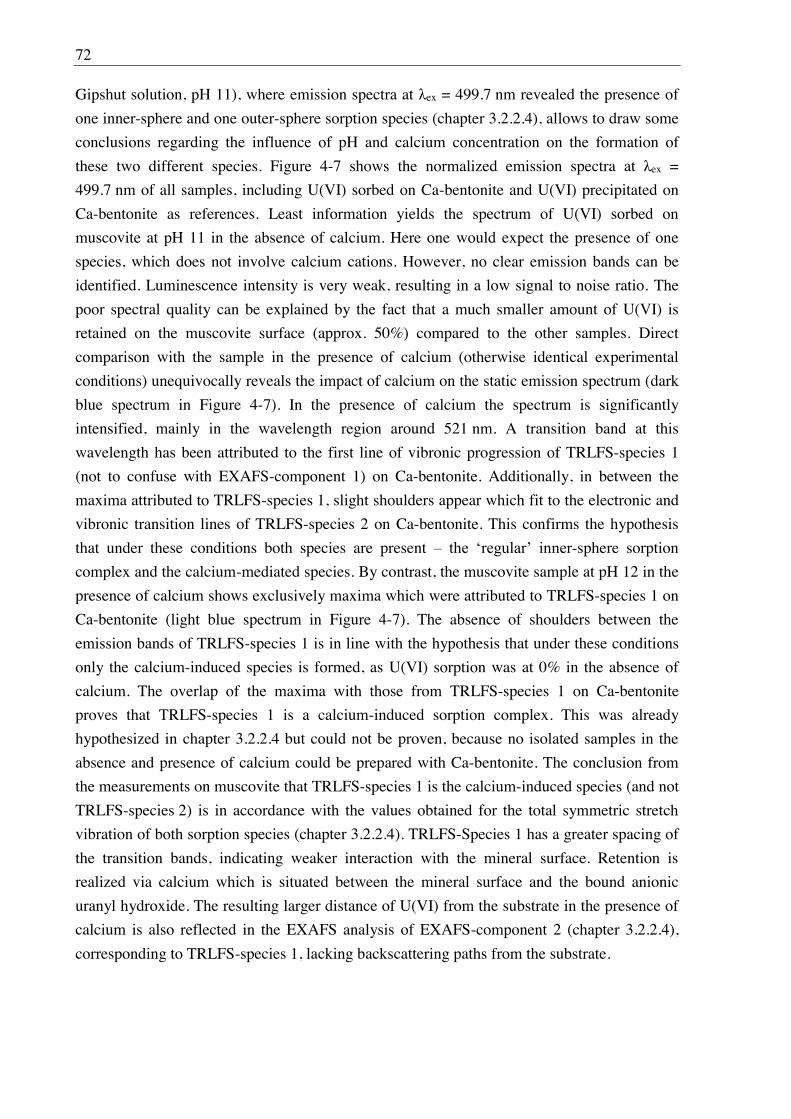
72
Gipshut solution, pH 11), where emission spectra at ex = 499.7 nm revealed the presence of
one inner-sphere and one outer-sphere sorption species (chapter 3.2.2.4), allows to draw some
conclusions regarding the influence of pH and calcium concentration on the formation of
these two different species. Figure 4-7 shows the normalized emission spectra at ex =
499.7 nm of all samples, including U(VI) sorbed on Ca-bentonite and U(VI) precipitated on
Ca-bentonite as references. Least information yields the spectrum of U(VI) sorbed on
muscovite at pH 11 in the absence of calcium. Here one would expect the presence of one
species, which does not involve calcium cations. However, no clear emission bands can be
identified. Luminescence intensity is very weak, resulting in a low signal to noise ratio. The
poor spectral quality can be explained by the fact that a much smaller amount of U(VI) is
retained on the muscovite surface (approx. 50%) compared to the other samples. Direct
comparison with the sample in the presence of calcium (otherwise identical experimental
conditions) unequivocally reveals the impact of calcium on the static emission spectrum (dark
blue spectrum in Figure 4-7). In the presence of calcium the spectrum is significantly
intensified, mainly in the wavelength region around 521 nm. A transition band at this
wavelength has been attributed to the first line of vibronic progression of TRLFS-species 1
(not to confuse with EXAFS-component 1) on Ca-bentonite. Additionally, in between the
maxima attributed to TRLFS-species 1, slight shoulders appear which fit to the electronic and
vibronic transition lines of TRLFS-species 2 on Ca-bentonite. This confirms the hypothesis
that under these conditions both species are present -sphere sorption
complex and the calcium-mediated species. By contrast, the muscovite sample at pH 12 in the
presence of calcium shows exclusively maxima which were attributed to TRLFS-species 1 on
Ca-bentonite (light blue spectrum in Figure 4-7). The absence of shoulders between the
emission bands of TRLFS-species 1 is in line with the hypothesis that under these conditions
only the calcium-induced species is formed, as U(VI) sorption was at 0% in the absence of
calcium. The overlap of the maxima with those from TRLFS-species 1 on Ca-bentonite
proves that TRLFS-species 1 is a calcium-induced sorption complex. This was already
hypothesized in chapter 3.2.2.4 but could not be proven, because no isolated samples in the
absence and presence of calcium could be prepared with Ca-bentonite. The conclusion from
the measurements on muscovite that TRLFS-species 1 is the calcium-induced species (and not
TRLFS-species 2) is in accordance with the values obtained for the total symmetric stretch
vibration of both sorption species (chapter 3.2.2.4). TRLFS-Species 1 has a greater spacing of
the transition bands, indicating weaker interaction with the mineral surface. Retention is
realized via calcium which is situated between the mineral surface and the bound anionic
uranyl hydroxide. The resulting larger distance of U(VI) from the substrate in the presence of
calcium is also reflected in the EXAFS analysis of EXAFS-component 2 (chapter 3.2.2.4),
corresponding to TRLFS-species 1, lacking backscattering paths from the substrate.
4 Influence of Ca(II) on U(VI) and Np(VI) sorption on clay minerals at (hyper)alkaline conditions 73
460 480 500 520 540 560 580 600
ex 499.7 nm
Precipitate on Ca-bentonite, pH 11
Kaolinite pH 12 + 0.02 M Ca
Kaolinite, pH 10
Muscovite, pH 12 + 0.02 M Ca
Muscovite pH 11+ 0.02 M Ca
Muscovite, pH 11
Nor
mal
ized
Inte
nsity
Wavelength [nm]
Ca-bentonite, pH 11
species 2
species 1
E1 E2
S1, E1S1, E2
Figure 4-7: Comparison of single emission spectra at ex = 499.7 nm of U(VI) ([U(VI)] = 5×10⁻⁷ M) sorbed on muscovite and kaolinite in the absence of CO2 at different pH in 0.1 M NaCl or 0.1 M NaCl + 0.02 M CaCl2. Spectra of U(VI) sorbed on Ca-bentonite and of a uranate-like precipitate on Ca-bentonite (both at pH 11) are included for comparison. Vertical lines in the graph attribute different emission lines to two independent species (presented in chapter 3.2.2.4).
The spectrum of U(VI) sorbed on kaolinite at pH 10 in the absence of calcium shows several
small maxima of which the most prominent ones coincide with the electronic transition line
and first line of vibronic progression of TRLFS-species 2 (dark green spectrum in Figure 4-7).
In the light of the findings from the measurements on muscovite this makes sense, because
TRLFS-species 2 is the one which is not calcium-induced. Conversely, at pH 12 in the
presence of calcium, one would expect to observe the calcium-induced TRLFS-species 1
exclusively, as on muscovite. However, at these conditions the spectrum lacks spectral
resolution. No single emission bands can be observed (light green spectrum in Figure 4-7).
Additionally, the broad emission spectrum is shifted to higher wavelengths. Both
characteristics, inhomogeneous broadening of the spectrum and the shift to higher
wavelengths, indicate U(VI) precipitation as Ca-uranate (see chapter 3.2.2.4). The spectrum
resembles the one of U(VI) precipitated on Ca-bentonite. However, the shift to higher
wavelengths is not as pronounced as in the reference sample. This can be explained by the
fact, that the U(VI) precipitate is not the only U(VI) component in the sample, but that the
obtained spectrum is a result of superimposition of single component spectra of both adsorbed
and precipitated U(VI). The simultaneous presence of adsorbed U(VI) becomes evident when
74
looking at emission spectra at different delay. As the Ca-uranate precipitate has a shorter
luminescence lifetime than the adsorbed U(VI) species (Tits et al., 2011; Tits et al., 2015),
with increasing delay time the portion of the spectrum at lower wavelength gains relative
importance compared to the region characteristic for U(VI) precipitation (Figure 4-8). Even
though adsorbed U(VI) is present in the sample, the dominance of U(VI) precipitation makes
a spectral evaluation of the adsorbed U(VI) (and therefore also a comparison with the
calcium-induced U(VI) species on muscovite) impossible.
460 480 500 520 540 560 580 600
ex 499.7 nm
Precipitate on Ca-bentonite, pH 11
Nor
mal
ized
Inte
nsity
Wavelength [nm]
Ca-bentonite, pH 11
Kaolinite, pH 12 + 0.02 M Ca
0 s delay 200 s delay
Figure 4-8: Luminescence emission spectra at ex=499.7 nm of U(VI) ([U(VI)] = 5×10⁻⁷ M) sorbed on kaolinite in the absence of CO2 at pH 12 in 0.1 M NaCl + 0.02 M CaCl2 at 0 and 200 s delay time. Spectra of U(VI) sorbed on Ca-bentonite and of a uranate-like precipitate on Ca-bentonite (both at pH 11) are included for comparison. Vertical lines in the graph attribute different emission lines to two independent species (presented in chapter 3.2.2.4).
The TRLFS results obtained in the presence of 0.02 M calcium at pH 12 show that under
equal experimental conditions U(VI) predominantly precipitates on kaolinite, while it does
not on muscovite. It can be assumed that U(VI) would also precipitate as Ca-uranate on
muscovite and Ca-bentonite with time, if it was not removed from the solution by faster
adsorption in the first place. Therefore, the precipitation of U(VI) on kaolinite can be related
to its inability to adsorb U(VI) to the mineral surface, which can have different reasons. First
of all a general lack of sorption sites could arise from disaggregation and dissolution of
kaolinite with increasing pH. As described above, the accessible surface area for U(VI) on the
intact kaolinite is already very small, leading to high adsorption density of U(VI). If the
surface area is further reduced by mineral dissolution, not all of the U(VI) can be adsorbed
anymore. Based on the elemental composition of the synthetic kaolinite given in Huittinen et
al. (2010) as well as Al and Si concentrations measured in the supernatant after sorption, 2.9%
of Al and 11.9% of Si were released from the mineral under these conditions. For muscovite
mineral dissolution was weaker, with 2.8% of Al and 3.1% Si leached at pH 12, derived from
leaching tests and digestion of the mineral. Hence, it is well possible, that the remaining
kaolinite is not capable to accommodate all U(VI) from solution at its surface, forcing the
4 Influence of Ca(II) on U(VI) and Np(VI) sorption on clay minerals at (hyper)alkaline conditions 75
excess U(VI) to precipitate. Alternatively, it is possible that the reduced ability for U(VI) to
adsorb is not a result of a general degradation of the mineral but due to the absence of a very
specific type of sorption sites in kaolinite, which is necessary for the formation of calcium-
mediated sorption complexes. One hypothesis is that this kind of sorption complex requires
strongly negatively charged basal planes as they are present in montmorillonite and
muscovite, but not in kaolinite. Under chemical conditions where calcium-bridging is the only
possible mechanism for U(VI) adsorption, U(VI) would precipitate in the samples with
kaolinite in case that this mechanism is hindered due to the different kaolinite structure. The
hypothesis that the U(VI) retention mechanism in kaolinite differs from the ones in Ca-
bentonite and muscovite is supported by differences in luminescence lifetime.
For all samples U(VI) luminescence shows a biexponential decay (Figure 4-9 and Table 4-1).
This indicates the presence of two independent U(VI) species on muscovite and kaolinite
irrespective of pH and the presence or absence of calcium. As described in chapter 3.2.2.4 for
U(VI) sorption on Ca-bentonite, the two adsorbed TRLFS-species 1 and 2 identified from the
emission bands, cannot be distinguished based on their lifetimes. Both are represented by the
longer lifetime 2. The short lifetime 1 is attributed to a Ca-uranate precipitate. All samples
comprise both adsorbed and precipitated U(VI) but distinguish themselves dramatically by the
proportion which these mechanisms add to the luminescence signal. The shape of the
luminescence decay curve provides qualitative information about these relative contributions.
Figure 4-9a shows that the three samples with U(VI) sorbed on muscovite exhibit very similar
luminescence decay, suggesting that all contain similarly small amounts of precipitated
U(VI). In contrast to that, for U(VI) sorbed on kaolinite the luminescence decay at pH 10 in
the absence of calcium is fundamentally different to that at pH 12 in the presence of calcium
(Figure 4-9b). At pH 10 in the absence of calcium, the adsorbed U(VI) has a much longer
lifetime of 2 = 394 ± 15 s, compared to 109-167 s in the case of muscovite (Table 4-1).
Therefore, a different process for U(VI) sorption has to be assumed. These strong differences
in luminescence lifetime could be explained by sorption on different sites, i.e. on aluminol
(Al-OH) or silanol (Si-OH) edge sites. Chisholm-Brause et al. (2004) and Kowal-Fouchard et
al. (2004) observed considerably longer luminescence lifetimes for U(VI) inner-sphere
complexes on silanol compared to aluminol functionalities at circumneutral pH. Chisholm-
Brause et al. (2004) obtained lifetimes of 120 and 302 s for inner-sphere sorption of uranyl
hydroxides on gibbsite and silica, respectively. Kowal-Fouchard et al. (2004) measured
lifetimes of 120 and even 400 s for sorption of such complexes on corundum and silica.
Direct comparison of the absolute values with the results of the present study is difficult, since
the mentioned lifetimes in literature were not obtained at cryogenic conditions. Nevertheless,
already the qualitative information about the strong difference in luminescence lifetime
between U(VI) sorption on aluminol and silanol sites justifies the assumption, that U(VI)
forms inner-sphere sorption complexes on silanol sites in the kaolinite sample at pH 10, while
U(VI) predominantly adsorbs on aluminol sites in the montmorillonite and muscovite
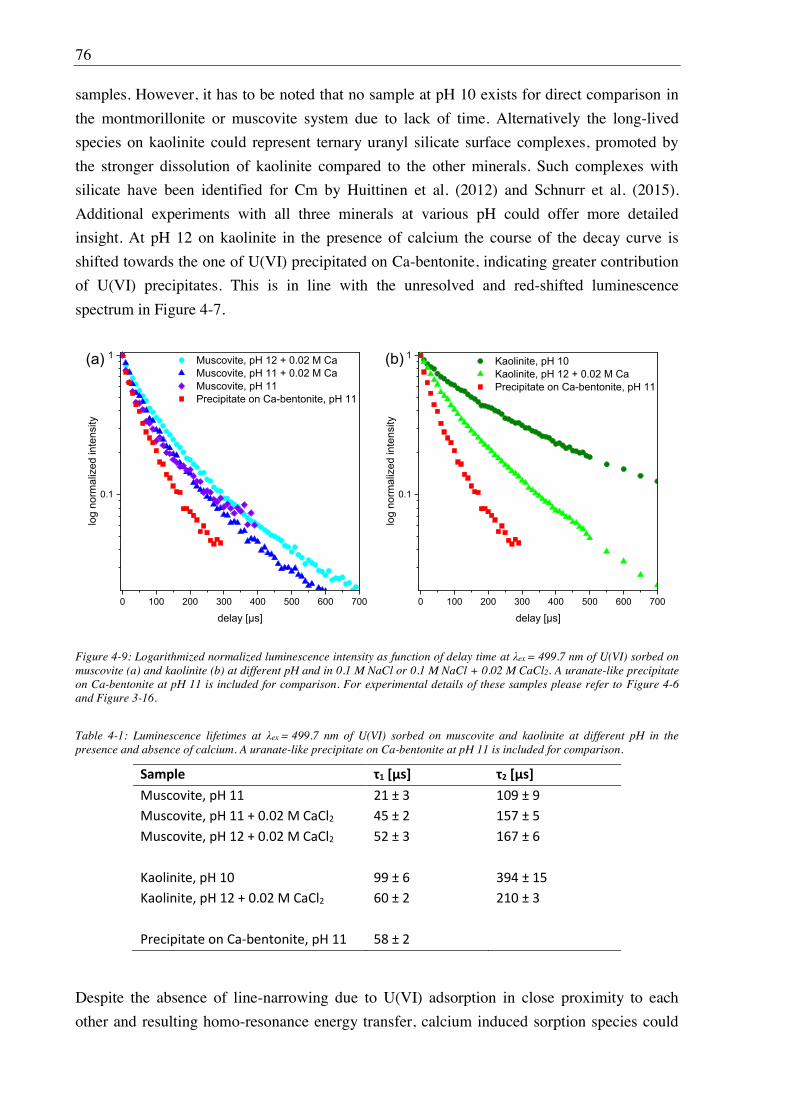
76
samples. However, it has to be noted that no sample at pH 10 exists for direct comparison in
the montmorillonite or muscovite system due to lack of time. Alternatively the long-lived
species on kaolinite could represent ternary uranyl silicate surface complexes, promoted by
the stronger dissolution of kaolinite compared to the other minerals. Such complexes with
silicate have been identified for Cm by Huittinen et al. (2012) and Schnurr et al. (2015).
Additional experiments with all three minerals at various pH could offer more detailed
insight. At pH 12 on kaolinite in the presence of calcium the course of the decay curve is
shifted towards the one of U(VI) precipitated on Ca-bentonite, indicating greater contribution
of U(VI) precipitates. This is in line with the unresolved and red-shifted luminescence
spectrum in Figure 4-7.
0 100 200 300 400 500 600 700
0.1
1
0 100 200 300 400 500 600 700
0.1
1 Muscovite, pH 12 + 0.02 M Ca Muscovite, pH 11 + 0.02 M Ca Muscovite, pH 11 Precipitate on Ca-bentonite, pH 11
log
norm
aliz
ed in
tens
ity
delay [ s]
(a) Kaolinite, pH 10 Kaolinite, pH 12 + 0.02 M Ca Precipitate on Ca-bentonite, pH 11
log
norm
aliz
ed in
tens
ity
delay [ s]
(b)
Figure 4-9: Logarithmized normalized luminescence intensity as function of delay time at ex = 499.7 nm of U(VI) sorbed on muscovite (a) and kaolinite (b) at different pH and in 0.1 M NaCl or 0.1 M NaCl + 0.02 M CaCl2. A uranate-like precipitate on Ca-bentonite at pH 11 is included for comparison. For experimental details of these samples please refer to Figure 4-6 and Figure 3-16.
Table 4-1: Luminescence lifetimes at ex = 499.7 nm of U(VI) sorbed on muscovite and kaolinite at different pH in the presence and absence of calcium. A uranate-like precipitate on Ca-bentonite at pH 11 is included for comparison.
Despite the absence of line-narrowing due to U(VI) adsorption in close proximity to each
other and resulting homo-resonance energy transfer, calcium induced sorption species could
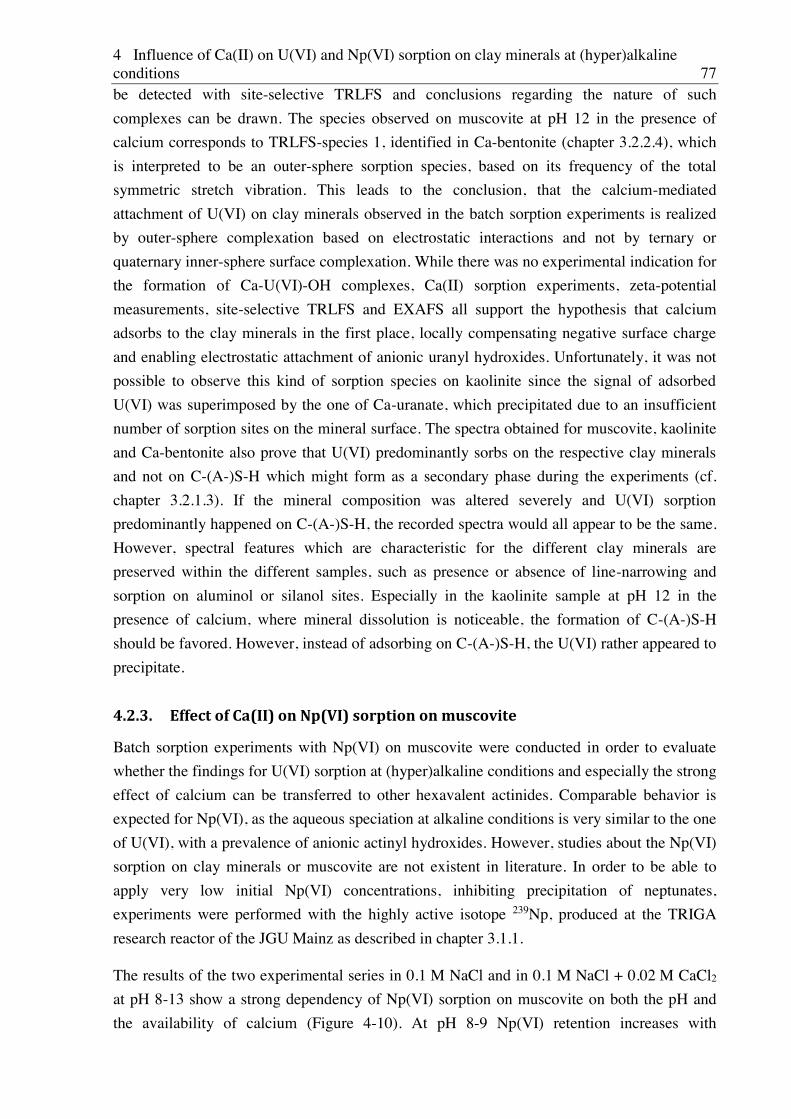
4 Influence of Ca(II) on U(VI) and Np(VI) sorption on clay minerals at (hyper)alkaline conditions 77
be detected with site-selective TRLFS and conclusions regarding the nature of such
complexes can be drawn. The species observed on muscovite at pH 12 in the presence of
calcium corresponds to TRLFS-species 1, identified in Ca-bentonite (chapter 3.2.2.4), which
is interpreted to be an outer-sphere sorption species, based on its frequency of the total
symmetric stretch vibration. This leads to the conclusion, that the calcium-mediated
attachment of U(VI) on clay minerals observed in the batch sorption experiments is realized
by outer-sphere complexation based on electrostatic interactions and not by ternary or
quaternary inner-sphere surface complexation. While there was no experimental indication for
the formation of Ca-U(VI)-OH complexes, Ca(II) sorption experiments, zeta-potential
measurements, site-selective TRLFS and EXAFS all support the hypothesis that calcium
adsorbs to the clay minerals in the first place, locally compensating negative surface charge
and enabling electrostatic attachment of anionic uranyl hydroxides. Unfortunately, it was not
possible to observe this kind of sorption species on kaolinite since the signal of adsorbed
U(VI) was superimposed by the one of Ca-uranate, which precipitated due to an insufficient
number of sorption sites on the mineral surface. The spectra obtained for muscovite, kaolinite
and Ca-bentonite also prove that U(VI) predominantly sorbs on the respective clay minerals
and not on C-(A-)S-H which might form as a secondary phase during the experiments (cf.
chapter 3.2.1.3). If the mineral composition was altered severely and U(VI) sorption
predominantly happened on C-(A-)S-H, the recorded spectra would all appear to be the same.
However, spectral features which are characteristic for the different clay minerals are
preserved within the different samples, such as presence or absence of line-narrowing and
sorption on aluminol or silanol sites. Especially in the kaolinite sample at pH 12 in the
presence of calcium, where mineral dissolution is noticeable, the formation of C-(A-)S-H
should be favored. However, instead of adsorbing on C-(A-)S-H, the U(VI) rather appeared to
precipitate.
4.2.3. Effect of Ca(II) on Np(VI) sorption on muscovite
Batch sorption experiments with Np(VI) on muscovite were conducted in order to evaluate
whether the findings for U(VI) sorption at (hyper)alkaline conditions and especially the strong
effect of calcium can be transferred to other hexavalent actinides. Comparable behavior is
expected for Np(VI), as the aqueous speciation at alkaline conditions is very similar to the one
of U(VI), with a prevalence of anionic actinyl hydroxides. However, studies about the Np(VI)
sorption on clay minerals or muscovite are not existent in literature. In order to be able to
apply very low initial Np(VI) concentrations, inhibiting precipitation of neptunates,
experiments were performed with the highly active isotope 239Np, produced at the TRIGA
research reactor of the JGU Mainz as described in chapter 3.1.1.
The results of the two experimental series in 0.1 M NaCl and in 0.1 M NaCl + 0.02 M CaCl2
at pH 8-13 show a strong dependency of Np(VI) sorption on muscovite on both the pH and
the availability of calcium (Figure 4-10). At pH 8-9 Np(VI) retention increases with
78
increasing pH from ~20% to ~50%, irrespective of the presence of calcium. At higher pH,
sorption reaches a maximum of 65% at pH 10.5 in the absence of calcium, before decreasing
to almost 0% at pH 13.2. By contrast, in the presence of 0.02 M calcium Np(VI) sorption
increases to 99%, forming a plateau of almost complete retention between pH 10.5 and 12,
followed by a rapid drop to 9% at pH 12.5 and a sudden re-increase to 59% at pH 13.2.
Consequently, the presence of calcium strongly enhances the Np(VI) sorption on muscovite at
pH>9.
Even though the effect of calcium on Np(VI) sorption on muscovite was the same as on U(VI)
sorption, the pH-dependent sorption diagrams differ significantly, namely in the pH region 8-
10. While sorption of U(VI) in this pH region was >90% both in the presence and absence of
calcium, it is very low for Np(VI). This strongly decreased retention is surprising as Np(VI)
was expected to behave exactly as U(VI), based on the similarities in aqueous speciation.
U(VI) sorption on many materials, particularly clay minerals, is generally known to be highest
at circumneutral pH so that the observed 15% of Np(VI) sorption at pH 7.9 are especially
unexpected. A mechanism that could explain this low retention is reduction of Np(VI) to
Np(V). Indeed, the measured Eh values for the sample series in 0.1 M NaCl + 0.02 M CaCl2 at
pH 9 lie within the stability field for Np(V) (red circles in Figure 4-11).
8 9 10 11 12 13
0
20
40
60
80
100
0.1 M NaCl 0.1 M NaCl + 0.02 M CaCl2
Np(
VI) r
emov
ed [%
]
pH
Figure 4-10: Percentage of Np(VI) ([Np(VI)] = 1×10-11 M) sorbed on muscovite (3 g/L) in 0.1 M NaCl and 0.1 M NaCl + 0.02 M CaCl2 as a function of pH in the absence of CO2.
The observed lowered, but increasing, Np-retention in this pH range fits to the sorption
behavior of Np(V) reported in literature. In various studies it was found that the adsorption
edge of Np(V) located between pH 6 and 10. However, the presence of Np(V) can only
explain the low Np-retention at pH 9 in the samples containing calcium. The measured Eh
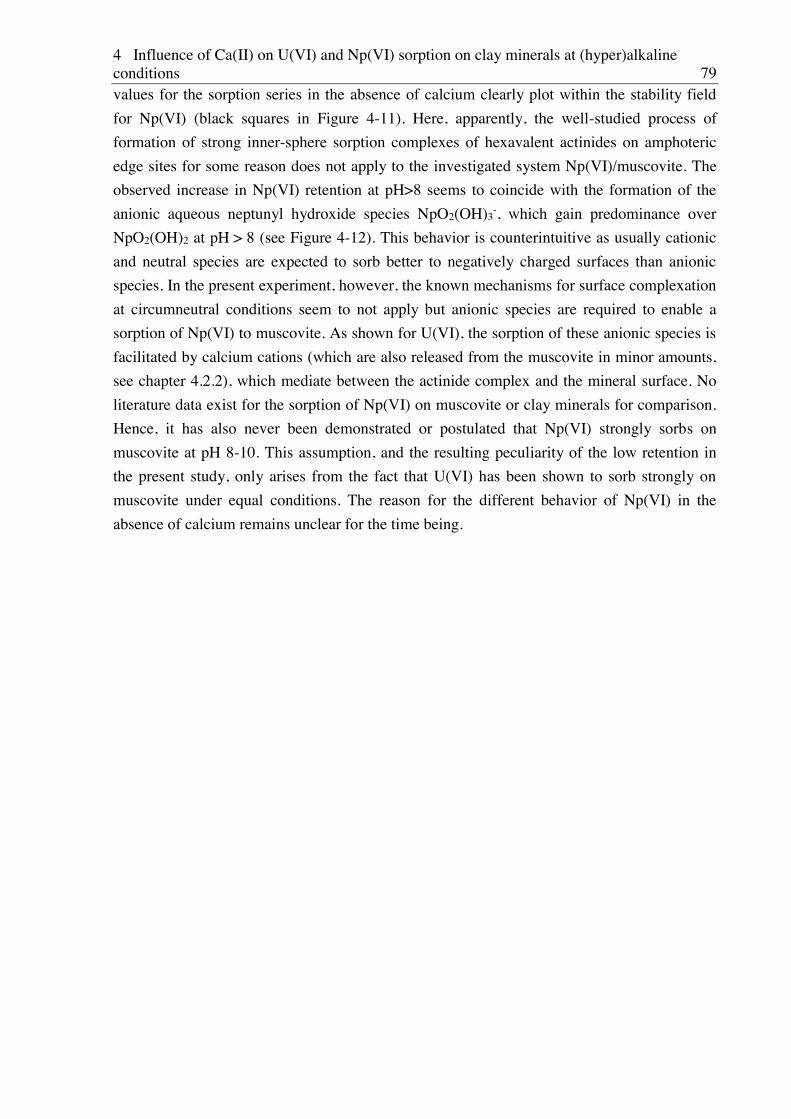
4 Influence of Ca(II) on U(VI) and Np(VI) sorption on clay minerals at (hyper)alkaline conditions 79
values for the sorption series in the absence of calcium clearly plot within the stability field
for Np(VI) (black squares in Figure 4-11). Here, apparently, the well-studied process of
formation of strong inner-sphere sorption complexes of hexavalent actinides on amphoteric
edge sites for some reason does not apply to the investigated system Np(VI)/muscovite. The
observed increase in Np(VI) retention at pH>8 seems to coincide with the formation of the
anionic aqueous neptunyl hydroxide species NpO2(OH)3-, which gain predominance over
NpO2(OH)2 at pH > 8 (see Figure 4-12). This behavior is counterintuitive as usually cationic
and neutral species are expected to sorb better to negatively charged surfaces than anionic
species. In the present experiment, however, the known mechanisms for surface complexation
at circumneutral conditions seem to not apply but anionic species are required to enable a
sorption of Np(VI) to muscovite. As shown for U(VI), the sorption of these anionic species is
facilitated by calcium cations (which are also released from the muscovite in minor amounts,
see chapter 4.2.2), which mediate between the actinide complex and the mineral surface. No
literature data exist for the sorption of Np(VI) on muscovite or clay minerals for comparison.
Hence, it has also never been demonstrated or postulated that Np(VI) strongly sorbs on
muscovite at pH 8-10. This assumption, and the resulting peculiarity of the low retention in
the present study, only arises from the fact that U(VI) has been shown to sorb strongly on
muscovite under equal conditions. The reason for the different behavior of Np(VI) in the
absence of calcium remains unclear for the time being.
80
0.1 M NaCl0.1 M NaCl + 0.02 M CaCl2
Figure 4-11: Predominance diagram of aqueous neptunium as a function of redox potential and pH modified after Gaona et al. (2013). Stability constants were recalculated to I=0. Measured Eh values of the sorption samples of the two experimental series (in 0.1 M NaCl and in 0.1 M NaCl + 0.02 M CaCl2) are included in the diagram (black squares and red circles).
At pH>10 the Np(VI) sorption on muscovite is as expected, as the pH-dependent sorption
diagram resembles the one obtained for U(VI) sorption (see Figure 4-4b). In the presence of
calcium Np(VI) retention is very high up to pH 12 due to adsorbed calcium, locally
compensating the negative surface charge of muscovite. In the experimental series without
calcium addition this mediation cannot be achieved and Np(VI) sorption decreases at
pH>10.5. Tits et al. (2014) studied the Np(VI) sorption on TiO2 at pH 10-14. In the absence
of calcium they found high retention at pH 10 and, in accordance to the present study, a
decrease of sorption with increasing pH. They were also able to observe a positive correlation
between calcium concentration and distribution ratio Rd at pH 12, 13.3 and 14. As possible
underlying mechanisms they identified the formation of ternary Ca-Np(VI)-hydroxide
complexes or charge compensation at the mineral surface due to calcium adsorption. As
already discussed in chapter 4.2.2, the latter theory is favored based on results from calcium
sorption on Ca-bentonite, as well as from zeta potential, site-selective TRLFS and EXAFS
measurements in the U(VI) system.
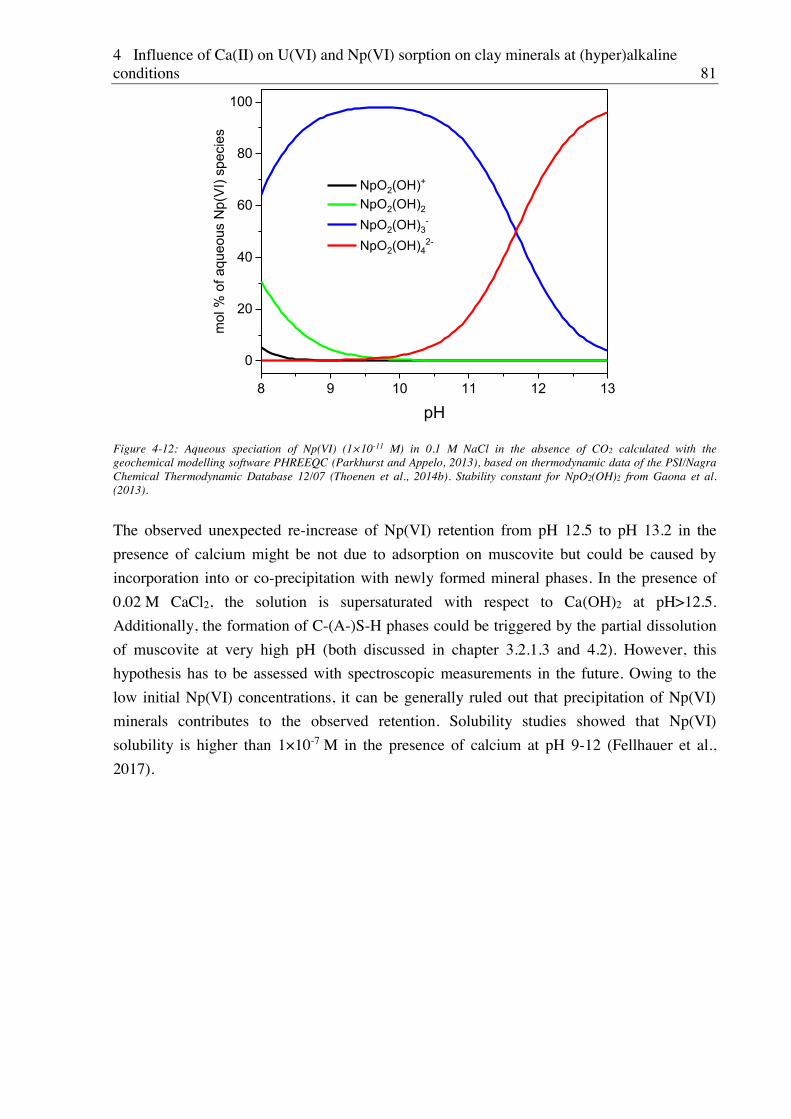
4 Influence of Ca(II) on U(VI) and Np(VI) sorption on clay minerals at (hyper)alkaline conditions 81
8 9 10 11 12 13
0
20
40
60
80
100
mol
% o
f aqu
eous
Np(
VI) s
peci
es
pH
NpO2(OH)+
NpO2(OH)2
NpO2(OH)3-
NpO2(OH)42-
Figure 4-12: Aqueous speciation of Np(VI) (1×10-11 M) in 0.1 M NaCl in the absence of CO2 calculated with the geochemical modelling software PHREEQC (Parkhurst and Appelo, 2013), based on thermodynamic data of the PSI/Nagra Chemical Thermodynamic Database 12/07 (Thoenen et al., 2014b). Stability constant for NpO2(OH)2 from Gaona et al. (2013).
The observed unexpected re-increase of Np(VI) retention from pH 12.5 to pH 13.2 in the
presence of calcium might be not due to adsorption on muscovite but could be caused by
incorporation into or co-precipitation with newly formed mineral phases. In the presence of
0.02 M CaCl2, the solution is supersaturated with respect to Ca(OH)2 at pH>12.5.
Additionally, the formation of C-(A-)S-H phases could be triggered by the partial dissolution
of muscovite at very high pH (both discussed in chapter 3.2.1.3 and 4.2). However, this
hypothesis has to be assessed with spectroscopic measurements in the future. Owing to the
low initial Np(VI) concentrations, it can be generally ruled out that precipitation of Np(VI)
minerals contributes to the observed retention. Solubility studies showed that Np(VI)
solubility is higher than 1×10⁻⁷ M in the presence of calcium at pH 9-12 (Fellhauer et al.,
2017).

82
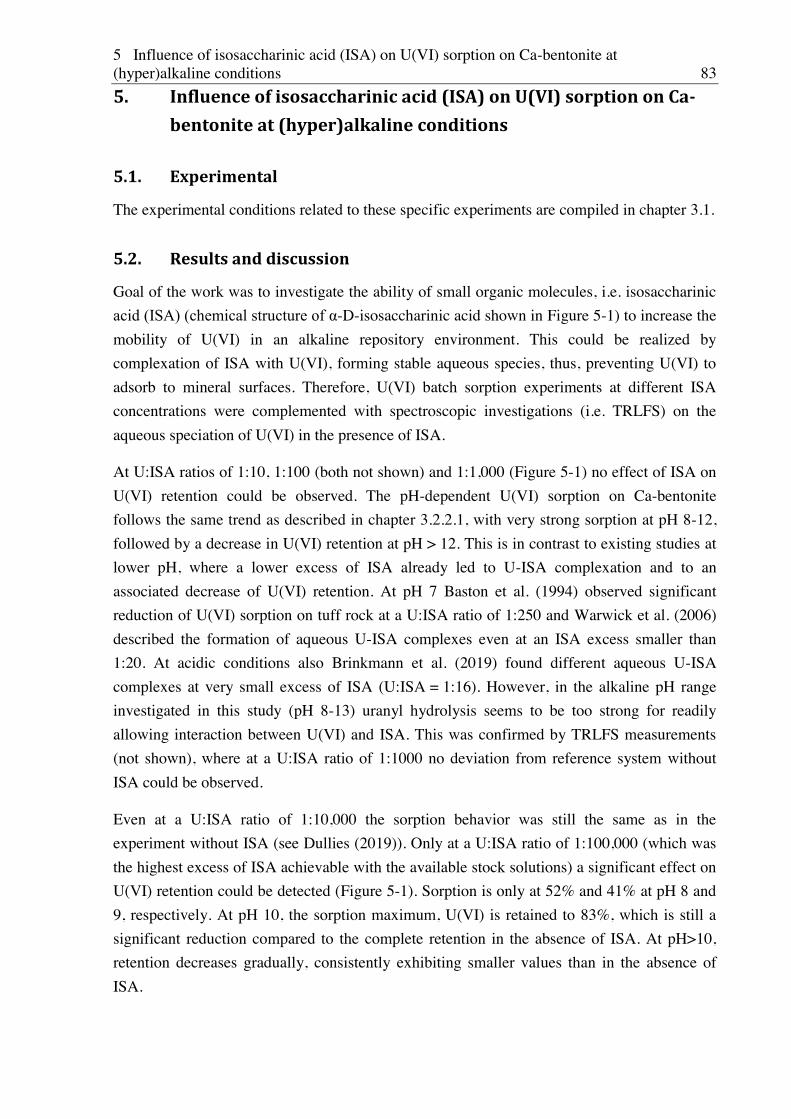
5 Influence of isosaccharinic acid (ISA) on U(VI) sorption on Ca-bentonite at (hyper)alkaline conditions 83
5. Influence of isosaccharinic acid (ISA) on U(VI) sorption on Ca-bentonite at (hyper)alkaline conditions
5.1. Experimental
The experimental conditions related to these specific experiments are compiled in chapter 3.1.
5.2. Results and discussion
Goal of the work was to investigate the ability of small organic molecules, i.e. isosaccharinic
-D-isosaccharinic acid shown in Figure 5-1) to increase the
mobility of U(VI) in an alkaline repository environment. This could be realized by
complexation of ISA with U(VI), forming stable aqueous species, thus, preventing U(VI) to
adsorb to mineral surfaces. Therefore, U(VI) batch sorption experiments at different ISA
concentrations were complemented with spectroscopic investigations (i.e. TRLFS) on the
aqueous speciation of U(VI) in the presence of ISA.
At U:ISA ratios of 1:10, 1:100 (both not shown) and 1:1,000 (Figure 5-1) no effect of ISA on
U(VI) retention could be observed. The pH-dependent U(VI) sorption on Ca-bentonite
follows the same trend as described in chapter 3.2.2.1, with very strong sorption at pH 8-12,
followed by a decrease in U(VI) retention at pH > 12. This is in contrast to existing studies at
lower pH, where a lower excess of ISA already led to U-ISA complexation and to an
associated decrease of U(VI) retention. At pH 7 Baston et al. (1994) observed significant
reduction of U(VI) sorption on tuff rock at a U:ISA ratio of 1:250 and Warwick et al. (2006)
described the formation of aqueous U-ISA complexes even at an ISA excess smaller than
1:20. At acidic conditions also Brinkmann et al. (2019) found different aqueous U-ISA
complexes at very small excess of ISA (U:ISA = 1:16). However, in the alkaline pH range
investigated in this study (pH 8-13) uranyl hydrolysis seems to be too strong for readily
allowing interaction between U(VI) and ISA. This was confirmed by TRLFS measurements
(not shown), where at a U:ISA ratio of 1:1000 no deviation from reference system without
ISA could be observed.
Even at a U:ISA ratio of 1:10,000 the sorption behavior was still the same as in the
experiment without ISA (see Dullies (2019)). Only at a U:ISA ratio of 1:100,000 (which was
the highest excess of ISA achievable with the available stock solutions) a significant effect on
U(VI) retention could be detected (Figure 5-1). Sorption is only at 52% and 41% at pH 8 and
9, respectively. At pH 10, the sorption maximum, U(VI) is retained to 83%, which is still a
significant reduction compared to the complete retention in the absence of ISA. At pH>10,
retention decreases gradually, consistently exhibiting smaller values than in the absence of
ISA.
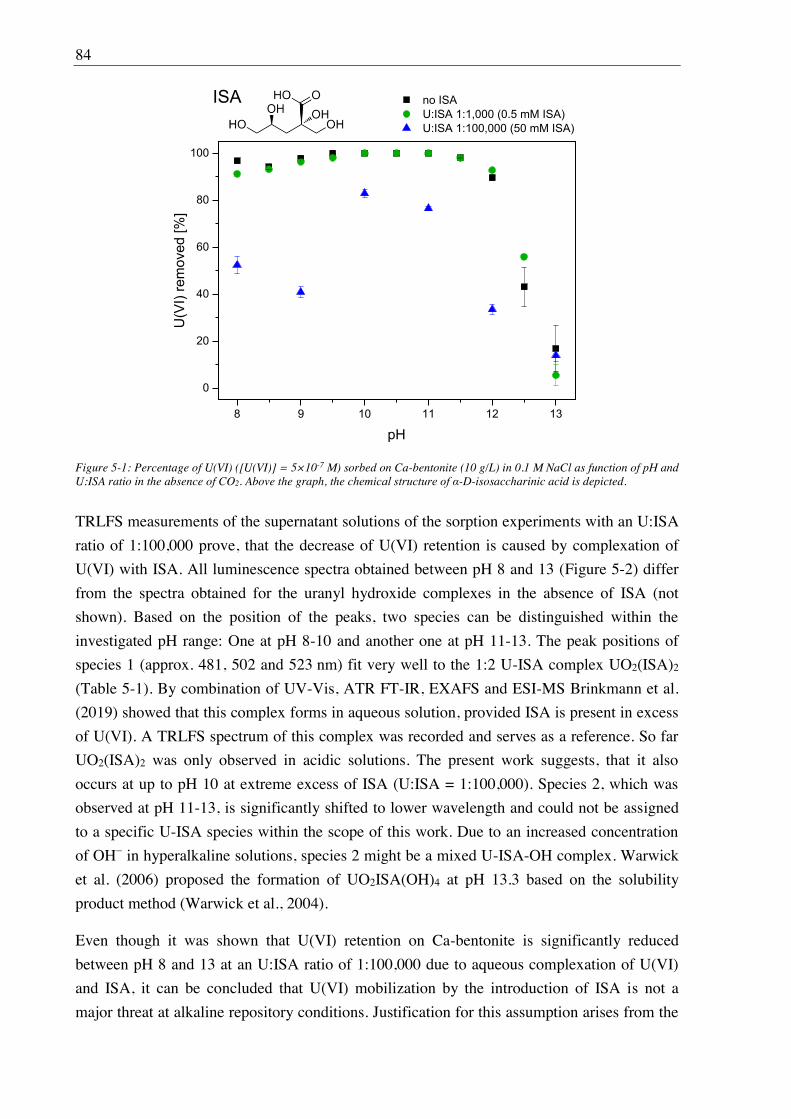
84
8 9 10 11 12 13
0
20
40
60
80
100
no ISA U:ISA 1:1,000 (0.5 mM ISA) U:ISA 1:100,000 (50 mM ISA)
U(V
I) re
mov
ed [%
]
pH
ISA
Figure 5-1: Percentage of U(VI) ([U(VI)] = 5×10⁻⁷ M) sorbed on Ca-bentonite (10 g/L) in 0.1 M NaCl as function of pH and U:ISA ratio in the absence of CO2. Above the graph, the chemical structure of -D-isosaccharinic acid is depicted.
TRLFS measurements of the supernatant solutions of the sorption experiments with an U:ISA
ratio of 1:100,000 prove, that the decrease of U(VI) retention is caused by complexation of
U(VI) with ISA. All luminescence spectra obtained between pH 8 and 13 (Figure 5-2) differ
from the spectra obtained for the uranyl hydroxide complexes in the absence of ISA (not
shown). Based on the position of the peaks, two species can be distinguished within the
investigated pH range: One at pH 8-10 and another one at pH 11-13. The peak positions of
species 1 (approx. 481, 502 and 523 nm) fit very well to the 1:2 U-ISA complex UO2(ISA)2
(Table 5-1). By combination of UV-Vis, ATR FT-IR, EXAFS and ESI-MS Brinkmann et al.
(2019) showed that this complex forms in aqueous solution, provided ISA is present in excess
of U(VI). A TRLFS spectrum of this complex was recorded and serves as a reference. So far
UO2(ISA)2 was only observed in acidic solutions. The present work suggests, that it also
occurs at up to pH 10 at extreme excess of ISA (U:ISA = 1:100,000). Species 2, which was
observed at pH 11-13, is significantly shifted to lower wavelength and could not be assigned
to a specific U-ISA species within the scope of this work. Due to an increased concentration
of OH in hyperalkaline solutions, species 2 might be a mixed U-ISA-OH complex. Warwick
et al. (2006) proposed the formation of UO2ISA(OH)4 at pH 13.3 based on the solubility
product method (Warwick et al., 2004).
Even though it was shown that U(VI) retention on Ca-bentonite is significantly reduced
between pH 8 and 13 at an U:ISA ratio of 1:100,000 due to aqueous complexation of U(VI)
and ISA, it can be concluded that U(VI) mobilization by the introduction of ISA is not a
major threat at alkaline repository conditions. Justification for this assumption arises from the
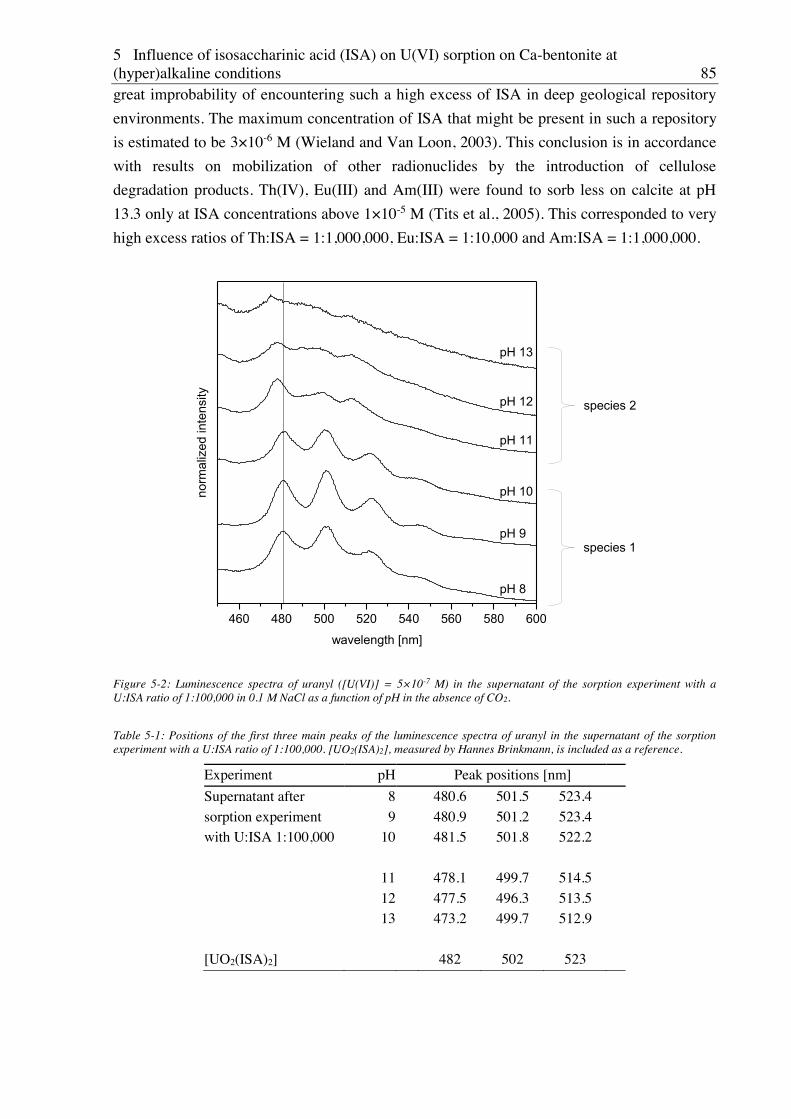
5 Influence of isosaccharinic acid (ISA) on U(VI) sorption on Ca-bentonite at (hyper)alkaline conditions 85
great improbability of encountering such a high excess of ISA in deep geological repository
environments. The maximum concentration of ISA that might be present in such a repository
is estimated to be 3×10⁻⁶ M (Wieland and Van Loon, 2003). This conclusion is in accordance
with results on mobilization of other radionuclides by the introduction of cellulose
degradation products. Th(IV), Eu(III) and Am(III) were found to sorb less on calcite at pH
13.3 only at ISA concentrations above 1×10⁻⁵ M (Tits et al., 2005). This corresponded to very
high excess ratios of Th:ISA = 1:1,000,000, Eu:ISA = 1:10,000 and Am:ISA = 1:1,000,000.
460 480 500 520 540 560 580 600
species 1
species 2
pH 8
pH 9
pH 10
pH 11
pH 12
norm
aliz
ed in
tens
ity
wavelength [nm]
pH 13
Figure 5-2: Luminescence spectra of uranyl ([U(VI)] = 5×10⁻⁷ M) in the supernatant of the sorption experiment with a U:ISA ratio of 1:100,000 in 0.1 M NaCl as a function of pH in the absence of CO2.
Table 5-1: Positions of the first three main peaks of the luminescence spectra of uranyl in the supernatant of the sorption experiment with a U:ISA ratio of 1:100,000. [UO2(ISA)2], measured by Hannes Brinkmann, is included as a reference.
Experiment pH Peak positions [nm]
Supernatant after 8 480.6 501.5 523.4 sorption experiment 9 480.9 501.2 523.4 with U:ISA 1:100,000 10 481.5 501.8 522.2 11 478.1 499.7 514.5 12 477.5 496.3 513.5 13 473.2 499.7 512.9 [UO2(ISA)2] 482 502 523

86
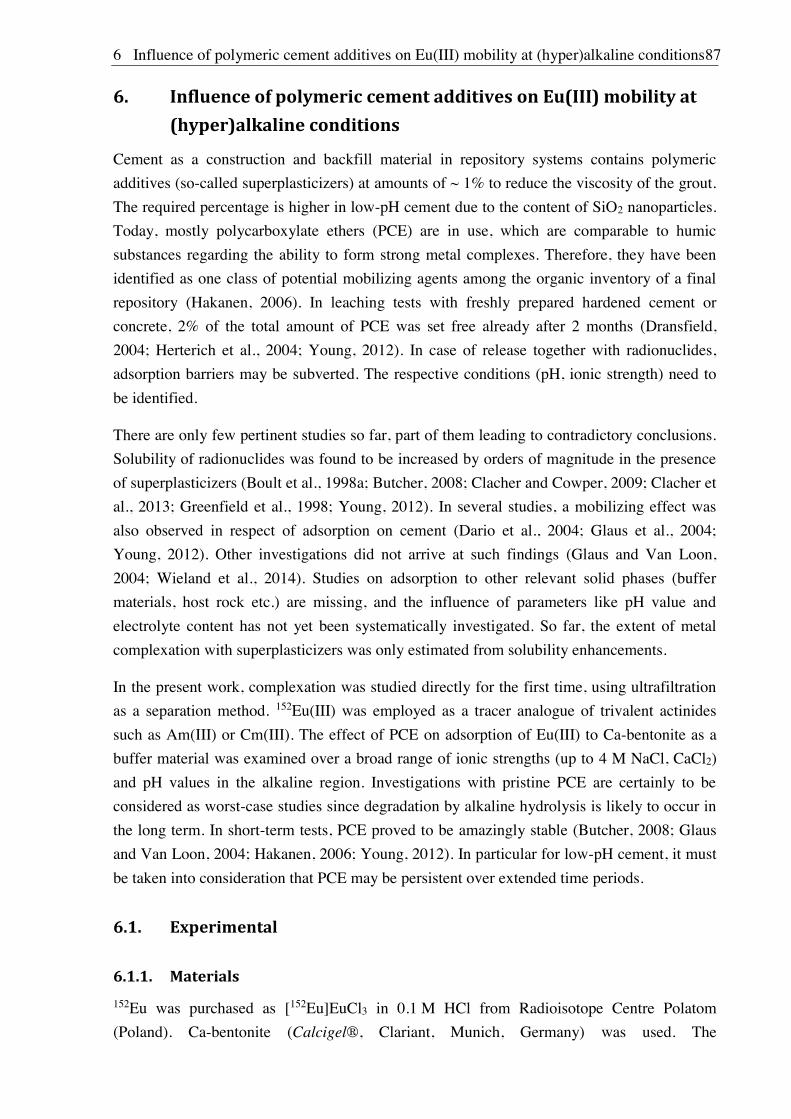
6 Influence of polymeric cement additives on Eu(III) mobility at (hyper)alkaline conditions87
6. Influence of polymeric cement additives on Eu(III) mobility at (hyper)alkaline conditions
Cement as a construction and backfill material in repository systems contains polymeric
additives (so-called superplasticizers) at amounts of ~ 1% to reduce the viscosity of the grout.
The required percentage is higher in low-pH cement due to the content of SiO2 nanoparticles.
Today, mostly polycarboxylate ethers (PCE) are in use, which are comparable to humic
substances regarding the ability to form strong metal complexes. Therefore, they have been
identified as one class of potential mobilizing agents among the organic inventory of a final
repository (Hakanen, 2006). In leaching tests with freshly prepared hardened cement or
concrete, 2% of the total amount of PCE was set free already after 2 months (Dransfield,
2004; Herterich et al., 2004; Young, 2012). In case of release together with radionuclides,
adsorption barriers may be subverted. The respective conditions (pH, ionic strength) need to
be identified.
There are only few pertinent studies so far, part of them leading to contradictory conclusions.
Solubility of radionuclides was found to be increased by orders of magnitude in the presence
of superplasticizers (Boult et al., 1998a; Butcher, 2008; Clacher and Cowper, 2009; Clacher et
al., 2013; Greenfield et al., 1998; Young, 2012). In several studies, a mobilizing effect was
also observed in respect of adsorption on cement (Dario et al., 2004; Glaus et al., 2004;
Young, 2012). Other investigations did not arrive at such findings (Glaus and Van Loon,
2004; Wieland et al., 2014). Studies on adsorption to other relevant solid phases (buffer
materials, host rock etc.) are missing, and the influence of parameters like pH value and
electrolyte content has not yet been systematically investigated. So far, the extent of metal
complexation with superplasticizers was only estimated from solubility enhancements.
In the present work, complexation was studied directly for the first time, using ultrafiltration
as a separation method. 152Eu(III) was employed as a tracer analogue of trivalent actinides
such as Am(III) or Cm(III). The effect of PCE on adsorption of Eu(III) to Ca-bentonite as a
buffer material was examined over a broad range of ionic strengths (up to 4 M NaCl, CaCl2)
and pH values in the alkaline region. Investigations with pristine PCE are certainly to be
considered as worst-case studies since degradation by alkaline hydrolysis is likely to occur in
the long term. In short-term tests, PCE proved to be amazingly stable (Butcher, 2008; Glaus
and Van Loon, 2004; Hakanen, 2006; Young, 2012). In particular for low-pH cement, it must
be taken into consideration that PCE may be persistent over extended time periods.
6.1. Experimental
6.1.1. Materials 152Eu was purchased as [152Eu]EuCl3 in 0.1 M HCl from Radioisotope Centre Polatom
(Poland). Ca-bentonite (Calcigel®, Clariant, Munich, Germany) was used. The
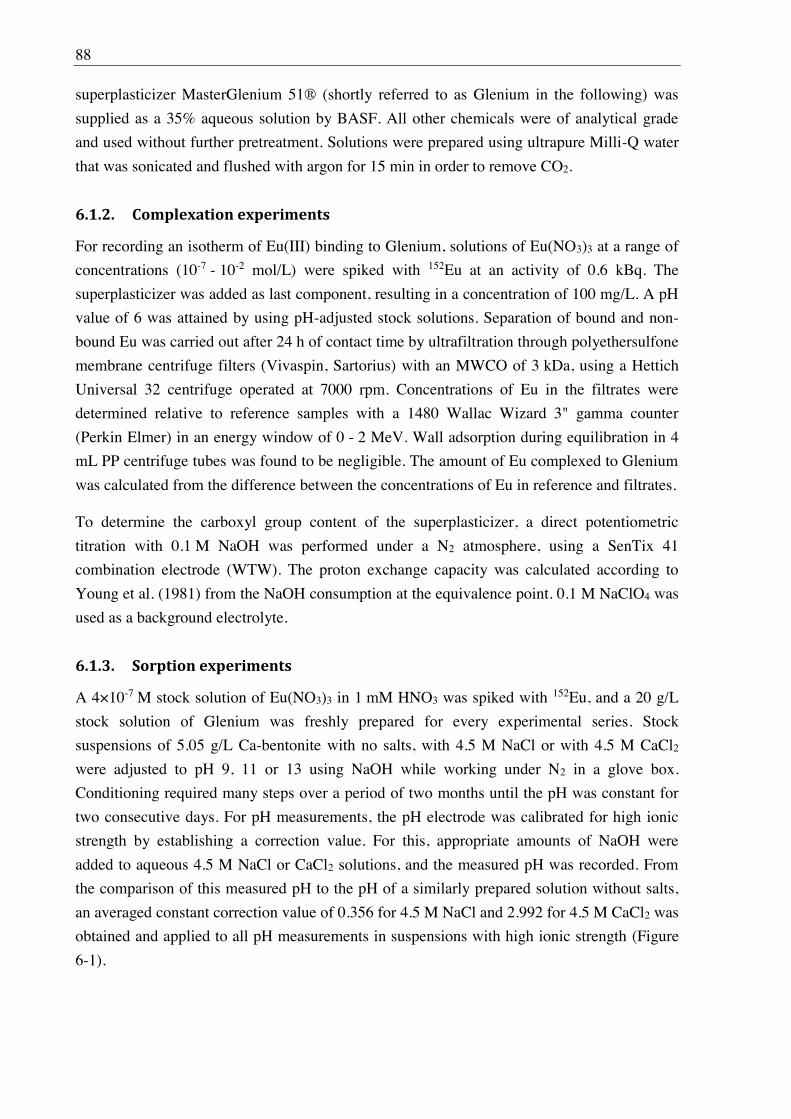
88
superplasticizer MasterGlenium 51® (shortly referred to as Glenium in the following) was
supplied as a 35% aqueous solution by BASF. All other chemicals were of analytical grade
and used without further pretreatment. Solutions were prepared using ultrapure Milli-Q water
that was sonicated and flushed with argon for 15 min in order to remove CO2.
6.1.2. Complexation experiments
For recording an isotherm of Eu(III) binding to Glenium, solutions of Eu(NO3)3 at a range of
concentrations (10-7 - 10-2 mol/L) were spiked with 152Eu at an activity of 0.6 kBq. The
superplasticizer was added as last component, resulting in a concentration of 100 mg/L. A pH
value of 6 was attained by using pH-adjusted stock solutions. Separation of bound and non-
bound Eu was carried out after 24 h of contact time by ultrafiltration through polyethersulfone
membrane centrifuge filters (Vivaspin, Sartorius) with an MWCO of 3 kDa, using a Hettich
Universal 32 centrifuge operated at 7000 rpm. Concentrations of Eu in the filtrates were
determined relative to reference samples with a 1480 Wallac Wizard 3" gamma counter
(Perkin Elmer) in an energy window of 0 - 2 MeV. Wall adsorption during equilibration in 4
mL PP centrifuge tubes was found to be negligible. The amount of Eu complexed to Glenium
was calculated from the difference between the concentrations of Eu in reference and filtrates.
To determine the carboxyl group content of the superplasticizer, a direct potentiometric
titration with 0.1 M NaOH was performed under a N2 atmosphere, using a SenTix 41
combination electrode (WTW). The proton exchange capacity was calculated according to
Young et al. (1981) from the NaOH consumption at the equivalence point. 0.1 M NaClO4 was
used as a background electrolyte.
6.1.3. Sorption experiments
A 4×10⁻⁷ M stock solution of Eu(NO3)3 in 1 mM HNO3 was spiked with 152Eu, and a 20 g/L
stock solution of Glenium was freshly prepared for every experimental series. Stock
suspensions of 5.05 g/L Ca-bentonite with no salts, with 4.5 M NaCl or with 4.5 M CaCl2
were adjusted to pH 9, 11 or 13 using NaOH while working under N2 in a glove box.
Conditioning required many steps over a period of two months until the pH was constant for
two consecutive days. For pH measurements, the pH electrode was calibrated for high ionic
strength by establishing a correction value. For this, appropriate amounts of NaOH were
added to aqueous 4.5 M NaCl or CaCl2 solutions, and the measured pH was recorded. From
the comparison of this measured pH to the pH of a similarly prepared solution without salts,
an averaged constant correction value of 0.356 for 4.5 M NaCl and 2.992 for 4.5 M CaCl2 was
obtained and applied to all pH measurements in suspensions with high ionic strength (Figure
6-1).
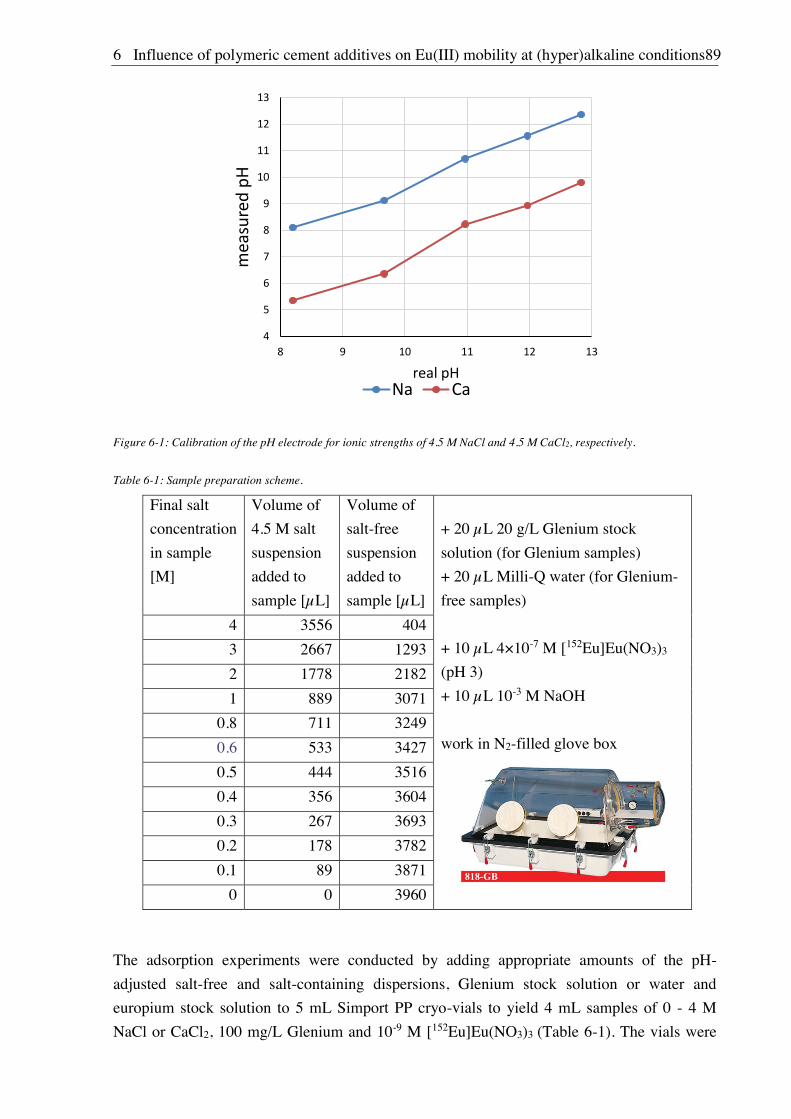
6 Influence of polymeric cement additives on Eu(III) mobility at (hyper)alkaline conditions89
Figure 6-1: Calibration of the pH electrode for ionic strengths of 4.5 M NaCl and 4.5 M CaCl2, respectively.
Table 6-1: Sample preparation scheme.
Final salt
concentration
in sample
[M]
Volume of
4.5 M salt
suspension
added to
sample [ L]
Volume of
salt-free
suspension
added to
sample [ L]
+ 20 L 20 g/L Glenium stock
solution (for Glenium samples)
+ 20 L Milli-Q water (for Glenium-
free samples)
+ 10 L 4×10⁻⁷ M [152Eu]Eu(NO3)3
(pH 3)
+ 10 L 10-3 M NaOH
work in N2-filled glove box
4 3556 404
3 2667 1293
2 1778 2182
1 889 3071
0.8 711 3249
0.6 533 3427
0.5 444 3516
0.4 356 3604
0.3 267 3693
0.2 178 3782
0.1 89 3871
0 0 3960
The adsorption experiments were conducted by adding appropriate amounts of the pH-
adjusted salt-free and salt-containing dispersions, Glenium stock solution or water and
europium stock solution to 5 mL Simport PP cryo-vials to yield 4 mL samples of 0 - 4 M
NaCl or CaCl2, 100 mg/L Glenium and 10-9 M [152Eu]Eu(NO3)3 (Table 6-1). The vials were
90
flushed with Ar before transfer into the N2-filled glove box. Each sample was replicated
twice. Additionally, a range of control experiments in the absence of bentonite were
conducted to gain knowledge about wall effects.
The samples prepared under N2 in a glove box were then closed and put into a Rotatherm
overhead shaker working at 20 rpm for 24 h. Afterwards, the samples were centrifuged for 15
min at 7000 rpm, and 2 mL of the supernatant were transferred into another cryo-vial. The
samples of the residue and of the supernatant were then measured for the 152Eu activity using
a 1480 Wallac Wizard 3" gamma counter (Perkin Elmer). The measured values were
corrected by subtraction of the background value plus ten times the standard deviation of the
background. This allowed for calculation of the fractions of Eu sorbed to the clay/vial and Eu
remaining in solution from the 152Eu activity AR measured in the residue and the activity AS
measured in the supernatant according to the following equations:
(6.1)
(6.2)
Additionally, to exclude vial sorption effects, the residue sample was redispersed, and the
dispersion was transferred to a new vial which was then analyzed for europium.
6.2. Results and discussion
6.2.1. Complexation of Eu(III) with PCE
The Charge Neutralization Model (Kim and Czerwinski, 1996), which has been widely used
to quantify metal complexation with humic substances, was chosen as a basis to parameterize
complexation with the PCE Glenium, allowing a direct comparison. In principle, the model
represents the Langmuir isotherm equation with an equilibrium constant normalized to the ion
charge (stability constant ) and a maximum adsorption normalized to the ion charge and to
the proton exchange capacity of the polyelectrolyte (loading capacity LC). For the present
system, the stability constant is given by the following equation:
(6.3)
The proton exchange capacity PEC of the plasticizer was determined by direct titration.
Figure 6-2 shows the derivative of the inverted titration curve, fitted by a Gaussian function to
define the equivalence point.
With the equivalence point, taken from the maximum at pH 9.3, the total content of COOH
groups was calculated to be 1.17 meq/g. The relatively sharp profile of the titration curve
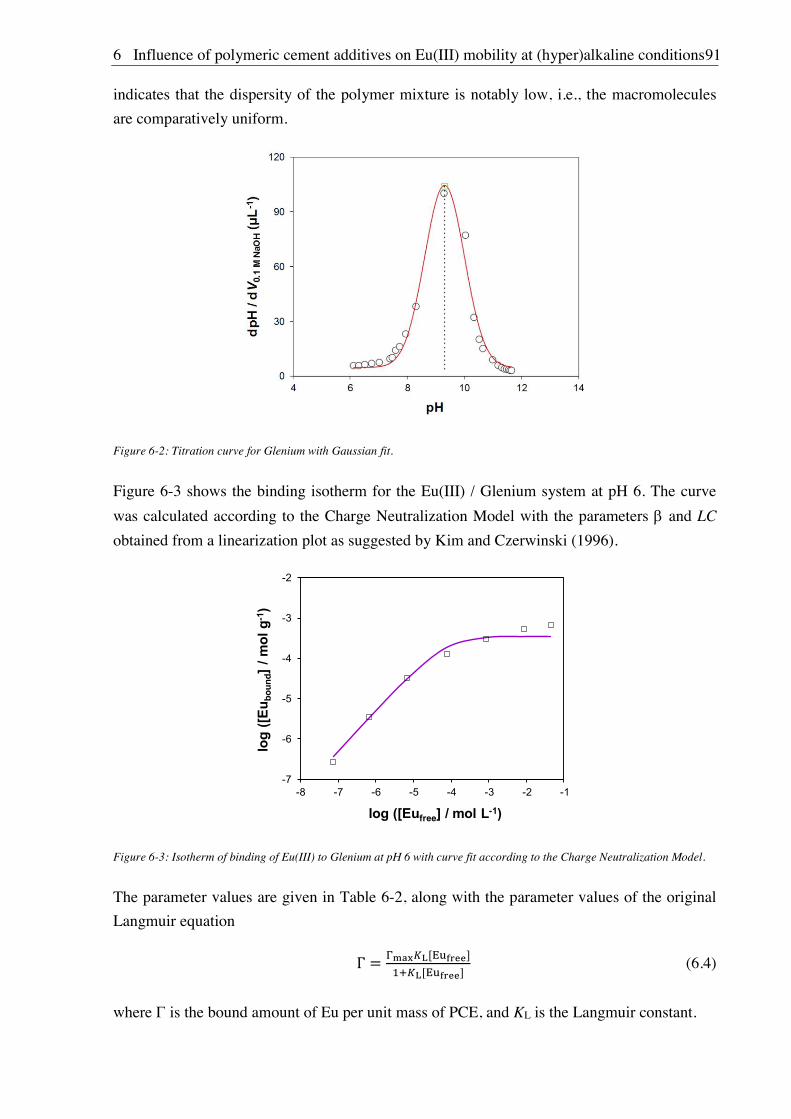
6 Influence of polymeric cement additives on Eu(III) mobility at (hyper)alkaline conditions91
indicates that the dispersity of the polymer mixture is notably low, i.e., the macromolecules
are comparatively uniform.
Figure 6-2: Titration curve for Glenium with Gaussian fit.
Figure 6-3 shows the binding isotherm for the Eu(III) / Glenium system at pH 6. The curve
was calculated according to the Charge Neutralization Model with the parameters and LC
obtained from a linearization plot as suggested by Kim and Czerwinski (1996).
Figure 6-3: Isotherm of binding of Eu(III) to Glenium at pH 6 with curve fit according to the Charge Neutralization Model.
The parameter values are given in Table 6-2, along with the parameter values of the original
Langmuir equation
(6.4)
where is the bound amount of Eu per unit mass of PCE, and KL is the Langmuir constant.
-7
-6
-5
-4
-3
-2
-8 -7 -6 -5 -4 -3 -2 -1
log
([Eu b
ound
] / m
ol g
-1)
log ([Eufree] / mol L-1)
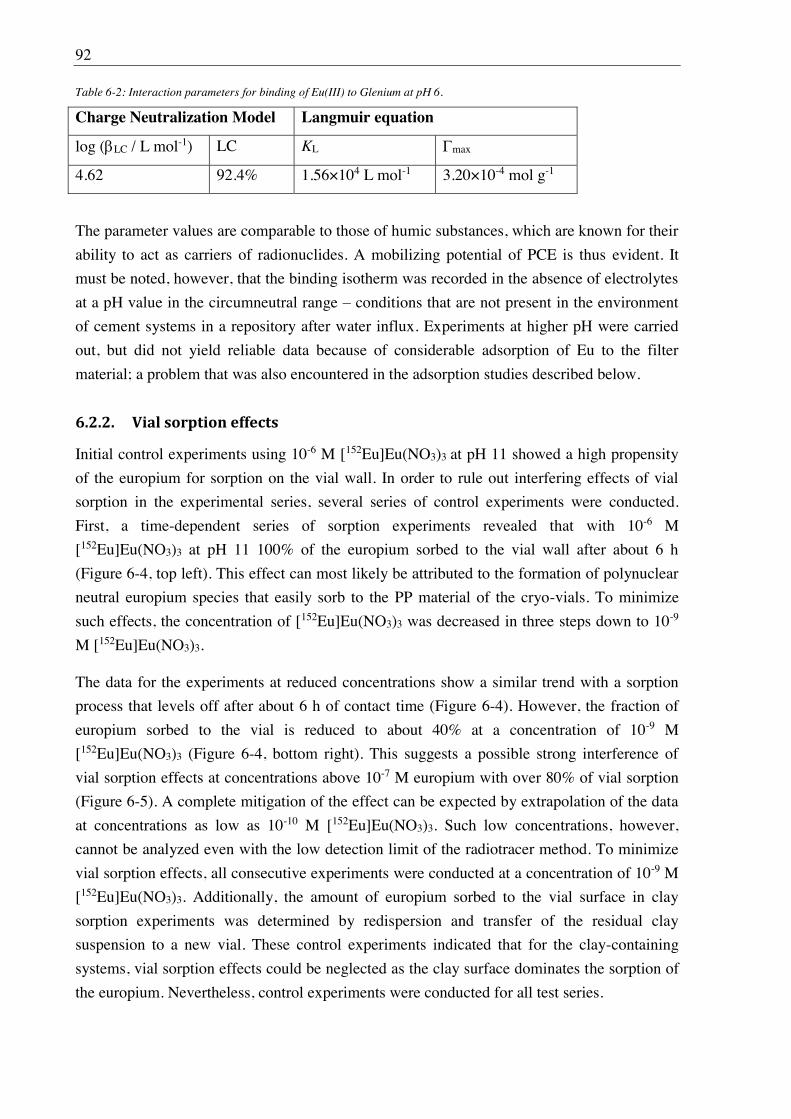
92
Table 6-2: Interaction parameters for binding of Eu(III) to Glenium at pH 6.
Charge Neutralization Model Langmuir equation
log ( LC / L mol-1) LC KL max
4.62 92.4% 1.56×10⁴ L mol-1 3.20×10⁻⁴ mol g-1
The parameter values are comparable to those of humic substances, which are known for their
ability to act as carriers of radionuclides. A mobilizing potential of PCE is thus evident. It
must be noted, however, that the binding isotherm was recorded in the absence of electrolytes
at a pH value in the circumneutral range conditions that are not present in the environment
of cement systems in a repository after water influx. Experiments at higher pH were carried
out, but did not yield reliable data because of considerable adsorption of Eu to the filter
material; a problem that was also encountered in the adsorption studies described below.
6.2.2. Vial sorption effects
Initial control experiments using 10-6 M [152Eu]Eu(NO3)3 at pH 11 showed a high propensity
of the europium for sorption on the vial wall. In order to rule out interfering effects of vial
sorption in the experimental series, several series of control experiments were conducted.
First, a time-dependent series of sorption experiments revealed that with 10-6 M
[152Eu]Eu(NO3)3 at pH 11 100% of the europium sorbed to the vial wall after about 6 h
(Figure 6-4, top left). This effect can most likely be attributed to the formation of polynuclear
neutral europium species that easily sorb to the PP material of the cryo-vials. To minimize
such effects, the concentration of [152Eu]Eu(NO3)3 was decreased in three steps down to 10-9
M [152Eu]Eu(NO3)3.
The data for the experiments at reduced concentrations show a similar trend with a sorption
process that levels off after about 6 h of contact time (Figure 6-4). However, the fraction of
europium sorbed to the vial is reduced to about 40% at a concentration of 10-9 M
[152Eu]Eu(NO3)3 (Figure 6-4, bottom right). This suggests a possible strong interference of
vial sorption effects at concentrations above 10-7 M europium with over 80% of vial sorption
(Figure 6-5). A complete mitigation of the effect can be expected by extrapolation of the data
at concentrations as low as 10-10 M [152Eu]Eu(NO3)3. Such low concentrations, however,
cannot be analyzed even with the low detection limit of the radiotracer method. To minimize
vial sorption effects, all consecutive experiments were conducted at a concentration of 10-9 M
[152Eu]Eu(NO3)3. Additionally, the amount of europium sorbed to the vial surface in clay
sorption experiments was determined by redispersion and transfer of the residual clay
suspension to a new vial. These control experiments indicated that for the clay-containing
systems, vial sorption effects could be neglected as the clay surface dominates the sorption of
the europium. Nevertheless, control experiments were conducted for all test series.
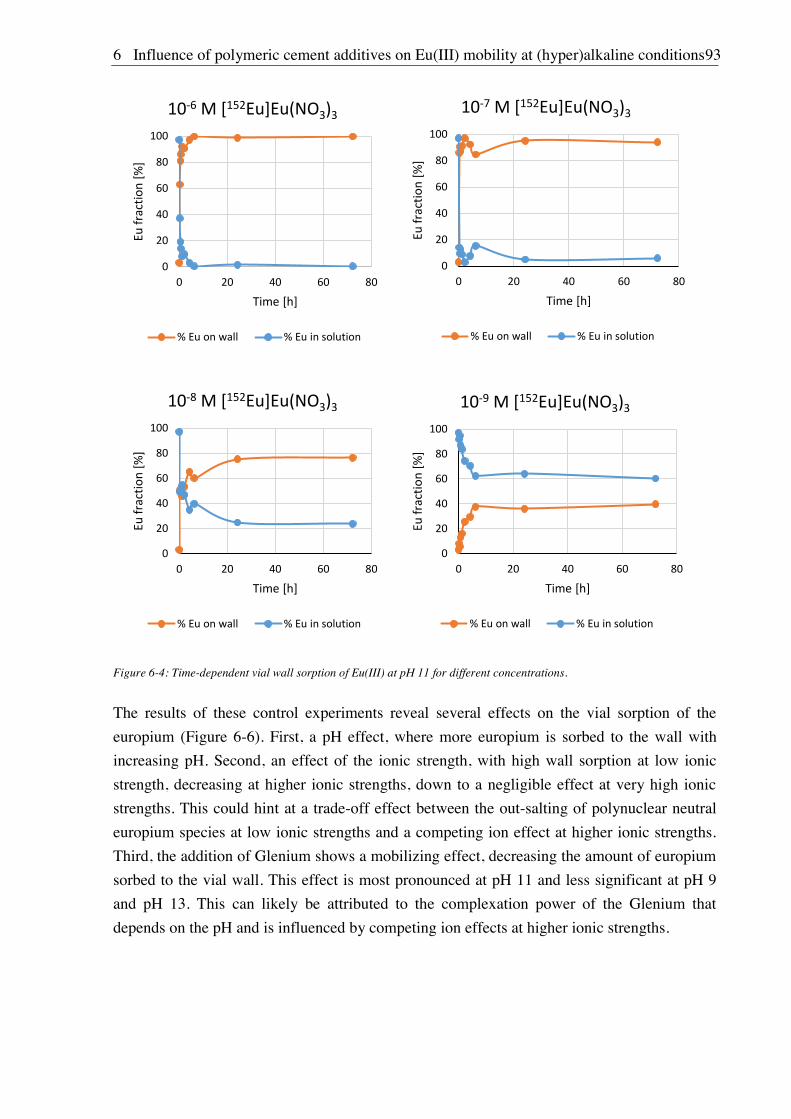
6 Influence of polymeric cement additives on Eu(III) mobility at (hyper)alkaline conditions93
Figure 6-4: Time-dependent vial wall sorption of Eu(III) at pH 11 for different concentrations.
The results of these control experiments reveal several effects on the vial sorption of the
europium (Figure 6-6). First, a pH effect, where more europium is sorbed to the wall with
increasing pH. Second, an effect of the ionic strength, with high wall sorption at low ionic
strength, decreasing at higher ionic strengths, down to a negligible effect at very high ionic
strengths. This could hint at a trade-off effect between the out-salting of polynuclear neutral
europium species at low ionic strengths and a competing ion effect at higher ionic strengths.
Third, the addition of Glenium shows a mobilizing effect, decreasing the amount of europium
sorbed to the vial wall. This effect is most pronounced at pH 11 and less significant at pH 9
and pH 13. This can likely be attributed to the complexation power of the Glenium that
depends on the pH and is influenced by competing ion effects at higher ionic strengths.
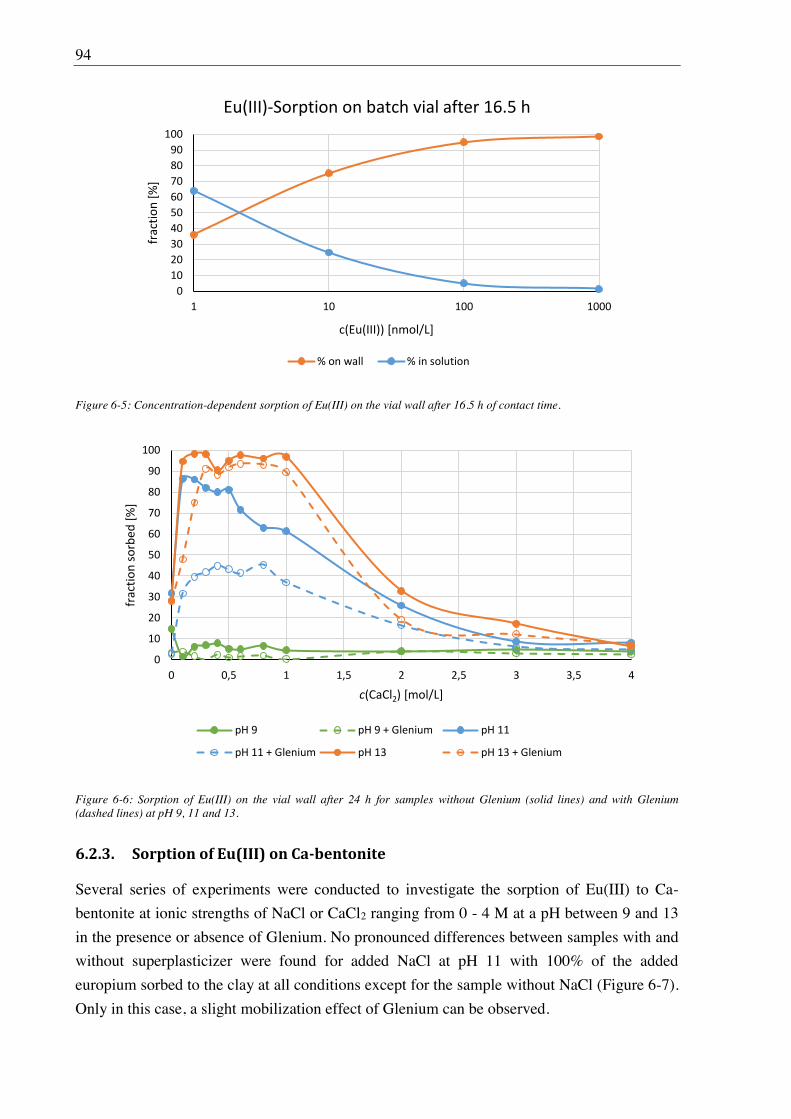
94
Figure 6-5: Concentration-dependent sorption of Eu(III) on the vial wall after 16.5 h of contact time.
Figure 6-6: Sorption of Eu(III) on the vial wall after 24 h for samples without Glenium (solid lines) and with Glenium (dashed lines) at pH 9, 11 and 13.
6.2.3. Sorption of Eu(III) on Ca-bentonite
Several series of experiments were conducted to investigate the sorption of Eu(III) to Ca-
bentonite at ionic strengths of NaCl or CaCl2 ranging from 0 - 4 M at a pH between 9 and 13
in the presence or absence of Glenium. No pronounced differences between samples with and
without superplasticizer were found for added NaCl at pH 11 with 100% of the added
europium sorbed to the clay at all conditions except for the sample without NaCl (Figure 6-7).
Only in this case, a slight mobilization effect of Glenium can be observed.
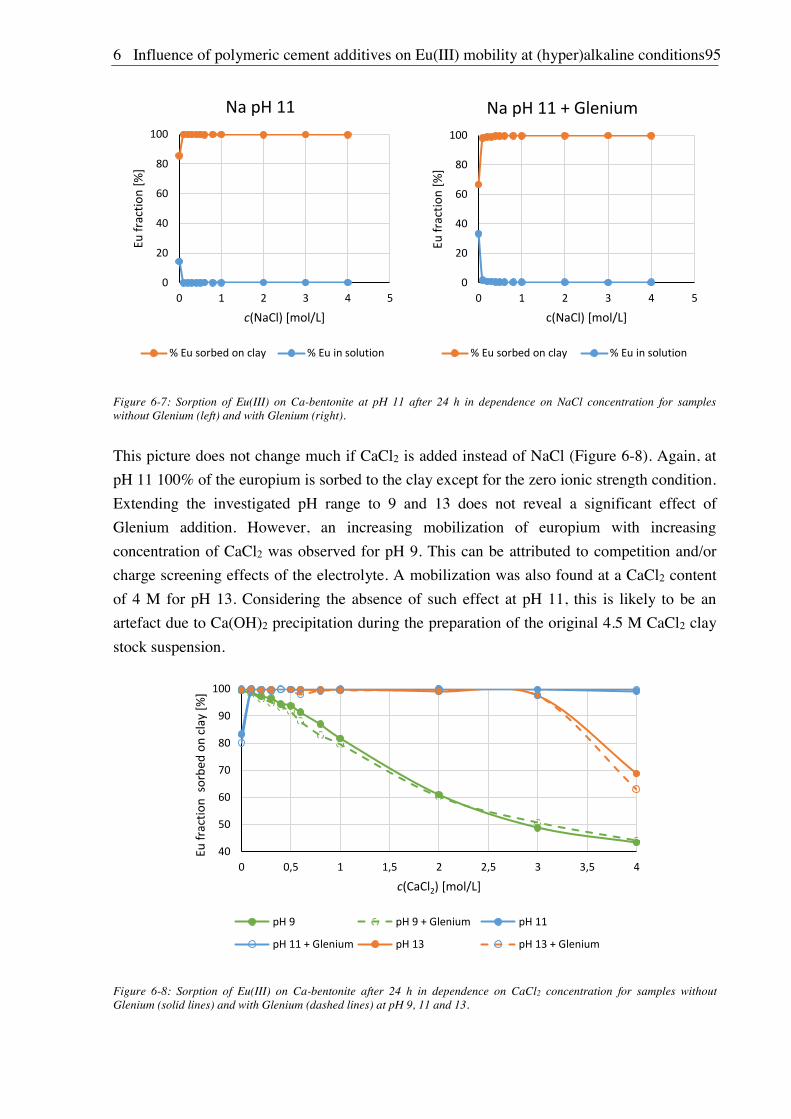
6 Influence of polymeric cement additives on Eu(III) mobility at (hyper)alkaline conditions95
Figure 6-7: Sorption of Eu(III) on Ca-bentonite at pH 11 after 24 h in dependence on NaCl concentration for samples without Glenium (left) and with Glenium (right).
This picture does not change much if CaCl2 is added instead of NaCl (Figure 6-8). Again, at
pH 11 100% of the europium is sorbed to the clay except for the zero ionic strength condition.
Extending the investigated pH range to 9 and 13 does not reveal a significant effect of
Glenium addition. However, an increasing mobilization of europium with increasing
concentration of CaCl2 was observed for pH 9. This can be attributed to competition and/or
charge screening effects of the electrolyte. A mobilization was also found at a CaCl2 content
of 4 M for pH 13. Considering the absence of such effect at pH 11, this is likely to be an
artefact due to Ca(OH)2 precipitation during the preparation of the original 4.5 M CaCl2 clay
stock suspension.
Figure 6-8: Sorption of Eu(III) on Ca-bentonite after 24 h in dependence on CaCl2 concentration for samples without Glenium (solid lines) and with Glenium (dashed lines) at pH 9, 11 and 13.
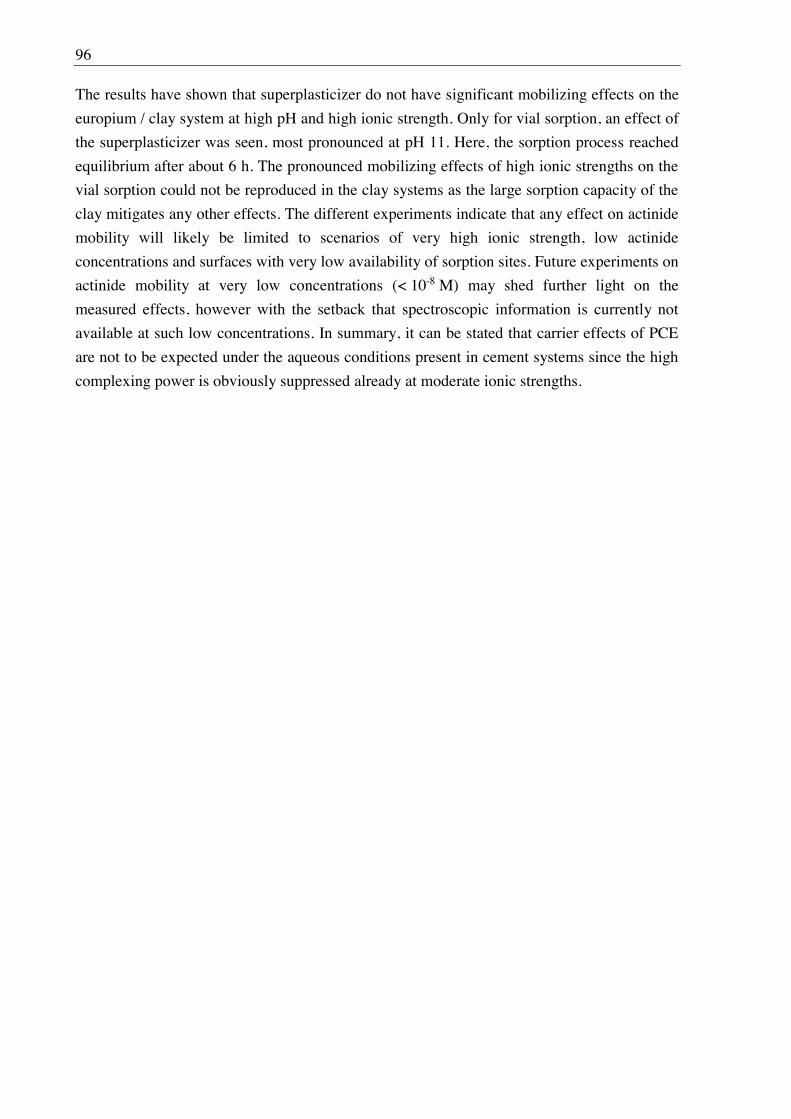
96
The results have shown that superplasticizer do not have significant mobilizing effects on the
europium / clay system at high pH and high ionic strength. Only for vial sorption, an effect of
the superplasticizer was seen, most pronounced at pH 11. Here, the sorption process reached
equilibrium after about 6 h. The pronounced mobilizing effects of high ionic strengths on the
vial sorption could not be reproduced in the clay systems as the large sorption capacity of the
clay mitigates any other effects. The different experiments indicate that any effect on actinide
mobility will likely be limited to scenarios of very high ionic strength, low actinide
concentrations and surfaces with very low availability of sorption sites. Future experiments on
actinide mobility at very low concentrations (< 10-8 M) may shed further light on the
measured effects, however with the setback that spectroscopic information is currently not
available at such low concentrations. In summary, it can be stated that carrier effects of PCE
are not to be expected under the aqueous conditions present in cement systems since the high
complexing power is obviously suppressed already at moderate ionic strengths.
7 Stability of U(VI) doped C-S-H phases at high ionic strength conditions 97
7. Stability of U(VI) doped C-S-H phases at high ionic strength conditions
7.1. Experimental
7.1.1. Material, device and technique descriptions (relates to chapters 7, 8 and 9)
All samples were synthesized in an inert gas box (N2 atmosphere, O2 < 2 ppm), using
degassed deionized water (18 cm-1; mod. Milli-RO/Milli-Q-System, Millipore,
Schwalbach, Germany), NaOH (p. a., Roth, Karlsruhe, Germany), KOH (ACS reagent, Roth,
Karlsruhe, Germany), carbonate-free CaO (anhydrous, 99.99%, heated for 24 h at 900 °C)
(Sigma-Aldrich, Missouri, USA), fumed silica (AEROSIL 300, Evonik, Essen, Germany),
Al2O3 (metals basis, Alfa Aesar, Massachusetts, USA) and Al(NO3)3 9H2O (p. a., Merck,
Darmstadt, Germany).
Before usage, NaOH and KOH surface carbonate was removed from the NaOH and KOH
pellets by washing the pellets several times with degassed deionized water in a Büchner
funnel under inert gas atmosphere. Total inorganic carbonate concentrations of the prepared
NaOH and KOH solutions were determined with a multi-N/C 2100 S (Analytik Jena, Jena,
Germany) and was below 100 M.
For sample shaking, an end-over-end rotator (SB2, Stuart, Staffordshire, UK) was used.
Centrifugations were carried out either with an Avanti J-20 XP (Beckman Coulter, Krefeld,
Germany) at 6,800×g or an EBA 280 (Hettich Lab Technology, Tuttlingen, Germany) at
3,059×g when not stated otherwise. The supernatant solutions after synthesis were analyzed
for Na, K, Ca, Si, U or Al with inductively coupled plasma mass spectrometry (ICP-MS)
(KED-mode, He gas, mod. NexION 350X/Elan 9000, PerkinElmer, Waltham, MA, USA) and
for Cm(III) with liquid scintillation counting (LSC) using a TriCarb 3100TR counter (Perkin
After sample decomposition in hydrofluoric acid, the elemental compositions of solid phases
were determined by analyzing the supernatants for Na, K, Ca, Si, U or Al concentrations with
ICP-MS. For drying, wet samples were frozen in liquid nitrogen and then, dried at 1 mbar and
-40 °C for 1 d in a freeze-drying system (mod. ALPHA 1-4 LSCplus, Christ, Osterode am
Harz, Germany).
The pH values of solutions were measured with a pH meter (inoLab pH 720, WTW,
Weilheim, Germany) with a SenTix®Mic pH microelectrode (WTW) calibrated against
standard pH buffers (pH: 6.865, 9.180 and 12.454) (WTW). The pH values of solutions with
high ionic strengths were corrected using a method reported by Altmaier et al. (2008) (pHm =
pHexp + 0.3 at 2.5 M NaCl).
98
For non-selective U(VI) TRLFS investigations, samples were suspended in deionized water
and transferred into polystyrene single use cuvettes (Roth, Karlsruhe, Germany) or Boro 5.1
(ASTM type 1 class B glass, 5 mm) tubes (Deutero, Kastellaun, Germany) and shock-frozen
in liquid N2. For measurements, the cuvettes were placed in a cryogenic cooling system (mod.
TG-KKK, KGW-Isotherm, Karlsruhe, Germany) and further cooled with N2 vapor to a
constant temperature of (153 ± 2) K. The laser set-up was optimized for high intensities and
good signal-to-noise ratios of the spectra: front entrance of 500 ms and a
delay time between 0.1 ms. To generate the excitation wavelength of 266 nm, a
Nd:YAG laser (mod. Minilite, Continuum, Santa Clara, CA, USA) with an average pulse
energy of 0.3 mJ was used. Emission wavelengths were detected between 369 nm and 669 nm
by accumulating 75 or 100 laser pulses with a spectrograph (mod. iHR 550, HORIBA Jobin
Yvon, Unterhaching, Germany) and an ICCD camera (mod. ICCD-3000, HORIBA Jobin
Yvon). Positions of luminescence bands were determined by calculating the minima of the
second derivative. For the time-resolved measurements a camera delay profile with 51 steps
was used calculated via equation (7.1) (y: camera delay time [ s], x: steps, y0: offset [ s]).
For the site-selective Cm(III) TRLFS, Cm(III) doped C-S-H gel samples were investigated by
varying the excitation wavelength in 0.1 or 0.2 nm steps between 600 and 630 nm. The
emission signal obtained at each chosen wavelength was integrated and plotted against the
applied wavelengths. High-resolution emission spectra were thereafter collected at the
excitation peak maxima, corresponding to individual Cm-species (or hot bands), associated
with the C-S-H structure or their alteration products. In this work, for TRLFS measurements
the dried solid samples were transferred into an Al sample holder and covered with a quartz
plate (Qiopitq, Göttingen, Germany). The site-selective TRLFS measurements were
performed with a pulsed Nd:YAG (Continuum Surelite II, USA) pumped dye laser set-up
(Radiant Dyes Narrow Scan K). A combination of laser dyes such as sulforhodamine B,
rhodamine B, and rhodamine 101 were used to enable tuning of the excitation wavelength
between 600 and 630 nm. To improve the resolution of the spectra, the samples were cooled
with a helium-refrigerated cryostat below a temperature of 12 K. The emission signal was
collected by a fiber coupled optical multi-channel system consisting of a polychromator with
600 and 1200 lines/mm gratings and an intensified CCD camera model iStar (Andor, Belfast,
Ireland). Emission measurements were accumulated over 5,000 spectra while excitation and
time-resolved measurements were accumulated over 100 spectra. Luminescence lifetimes
were monitored as a function of delay time between 10 and 1,570 s in 40 s steps. The
excitation spectra were energy corrected for each wavelength using the average energy
collected with an optical power meter (Newport 1918-R).
(7.1)
7 Stability of U(VI) doped C-S-H phases at high ionic strength conditions 99
XRD diffractograms were collected with a MiniFlex 600 diffractometer (Rigaku, Tokyo,
-ray source (40 keV/15 mA operation for X-ray generation)
and the D/teX Ultra 1D silicon strip detector in the Bragg-Brentano -2 geometry at a
scanning speed of 0.6° per min. The samples were mounted as wet pastes on a zero-
background Si sample holder and stored for several minutes in an inert gas atmosphere to
remove excess water from the samples and thus, to minimize carbonation of the samples
during measurements. The subsequent phase analysis of diffractograms was done with the
program PDXL 2 (Rigaku) and the ICDD PDF-4+ 2016 database (C-S-H phase (database
card number 00-033-0306), portlandite (database card number 01-083-4600), calcite (database
card number 01-083-4601), aragonite (database card number 01-075-9985), vaterite (database
card number 04-017-8634), halite (database card number 00-005-0628), aluminum
tobermorite (database card number 00-019-0052), tobermorite, aluminian, syn. (database card
number 01-074-2878), and laumontite (database card number 04-015-7175)).
Immediately after removing the C-S-H phases from N2 atmosphere, IR samples were prepared
under ambient conditions by mixing approximately 1 mg of the freeze-dried samples with
300 mg dried KBr and subsequently pressing for 2 min at 1×10⁹ Pa until clear pellets were
obtained. IR samples were measured with a Vertex 70/v spectrometer (Bruker, Billerica,
Massachusetts, USA) equipped with a D-LaTGS-detector (Lalanine doped triglycine sulfate),
over a range of 4,000 to 400 cm 1 in the transmittance mode, with a spectral resolution of
4 cm 1. Each spectrum was averaged over 64 scans.
Raman spectra were recorded using a LabRAM ARAMIS instrument (HORIBA, Jobin Yvon)
equipped with an optical Olympus BX 41 microscope, a Peltier cooled detector and coupled
with an external 633 nm He-Ne laser (50 mW power at the source). An objective of 50X
magnification was applied for spectrum acquisition. The outer surface of dried samples was
investigated under ambient conditions. The scattered light was collected in backscattering
configuration. The slit width of the spectrometer was set at 155 m. A holographic grating
having 300 grooves/mm was used resulting in a spectral resolution of about 22 cm 1.
For TGA and DSC investigations, C-S-H phases (sample E (freeze-dried), samples A-C (wet
pastes), sample C (dried under N2 atmosphere) were transferred in an Al2O3 crucible and
measured between 25 and 1000 °C at 20 K min 1 in an Ar atmosphere with a STA 449 F5
Jupiter thermal analysis instrument (Netzsch, Selb, Germany).
Solubility calculations were performed with the geochemical speciati
Workbench (GWB), Module React (vers. 11.0.6) (Bethke, 2008) using the Pitzer ion-ion
interaction model. The thermodynamic database was "THEREDA". U(VI) speciations in the
supernatant solution were also calculated with GWB using the "PSI/Nagra Chemical
Thermodynamic Database 12/07" (Thoenen et al., 2014a).
100
7.1.2. Synthesis of U(VI) doped C-S-H phases
7.1.2.1. Direct synthesis of U(VI) doped C-S-H phases
U(VI) doped C-S-H phases (A-D, Table 7-1) were prepared applying a direct U(VI)
incorporation method. For this, a U(VI)-containing artificial cement pore water (ACW) was
prepared according to Berner et al. (1992) by adding an excess of solid UO3 to a solution of
0.18 M KOH and 0.114 M NaOH (pH 13.3) and stirring for a week. Subsequently, the ACW
was separated from remaining solid UO3 by centrifugation and analyzed for U(VI) by ICP-
MS after adjusting the pH of an aliquot to 2 with concentrated HNO3. The resulting ACW
contained 19.5 M U(VI). This U(VI)-containing ACW was added to a mixture of fumed
silica and carbonate-free CaO in centrifuge tubes (polypropylene, Greiner bio-one,
Kremsmünster, Austria). While the S/L ratio was 24 g/L, the CaO to SiO2 ratio was varied
depending on the targeted C/S ratio (0.6, 1.0, 1.6, 2.0). Suspensions were shaken end-over-
end for 14 d and then centrifuged to analyze the supernatant for U with ICP-MS.
Subsequently, the samples were re-suspended and filtered through a Whatman ashless 541-
grade filter (22 m cut-off). The U(VI) doped C-S-H samples were washed with deionized
water and stored moist in sealed tubes for leaching experiments (see chapter 7.1.3) or dried
for spectroscopy.
7.1.2.2. Sorption of U(VI) onto C-S-H phases
An additional C-S-H phase (sample E, Table 7-1) was synthesized at a S/L ratio of 24 g/L in
U(VI)- -
containing C-S-H phases synthesized by Tits et al. (2011), a further U(VI)-containing C-S-H
sample (sample E/U, Table 7-1) with a C/S ratio of 1.3 was prepared. For this, sample E was
exposed to a UO2(NO3)2 solution which contained 19.5 M U(VI) for 14 d (S/L ratio: 24 g/L,
pH after 14 d: 11.7) resulting in sample E/U. Subsequently, the U(VI)-containing C-S-H
phase was centrifuged to analyze the supernatant for U with ICP-MS. Then the samples were
re-suspended and filtered off, washed with deionized water, and stored moist.
7.1.3. Batch leaching of U(VI) doped C-S-H phases
For batch leaching experiments, wet pastes of U(VI) doped C-S-H samples (A-C), prepared
by direct synthesis, were equilibrated in 2.5 M NaCl, 2.5 M NaCl/0.02 M Na2SO4, 2.5 M
NaCl/0.02 M NaHCO3 or 0.02 M NaHCO3 at S/L ratios of 1.2 (sample A), 1.5 (sample B) and
2.3 g/L (sample C) by shaking the samples end-over-end. After different time intervals, up to
768 h, samples were centrifuged and each supernatant solution was analyzed for Ca, Si and U
by ICP-MS as well as for the pH value. Solid and liquid phases after leaching were
characterized by spectroscopic and further analytical methods (TRLFS, XRD and IR). All
leaching experiments mentioned above were performed as triplicates.
7 Stability of U(VI) doped C-S-H phases at high ionic strength conditions 101
Additionally, sample B was leached in 2.5 M NaCl/0.075 M NaHCO3 for 768 h to visualize
changes in the TRLFS spectrum of U(VI) doped C-S-H phases after leaching in solutions with
high concentrations of carbonate. To determine the influence of increasing carbonate
concentrations on the pH evolution and U(VI) release from U(VI) doped C-S-H phases,
sample A was exposed to solutions containing 1, 2, 10, 20, 50, and 75 mM NaHCO3 for
768 h. Subsequently, the supernatants were separated by centrifugation and analyzed for the
pH value and released U. To get a detailed understanding about the Ca and Si release in
dependence on NaCl concentrations, sample E was exposed to solutions containing 0, 0.5,
1.0, 1.5, 2.0, and 2.5 M NaCl at an actual S/L ratio of 1.5 g/L for 7 d. Subsequently, the
supernatants were analyzed for Ca and Si with ICP-MS.
7.2. Results and discussion
7.2.1. Composition of U(VI) doped C-S-H phases
U(VI) doped C-S-H phases, synthesized by the direct incorporation method (samples A-D in
Table 7-1), possess molar C/S ratios between 0.6 and 2.0 and U/S ratios between
ppm. The retardation coefficients, log(Rd) [log(L/kg)], increase from 3.1 to 4.1 with
increasing C/S ratios.
Compared to the retardation coefficients reported by Tits et al. (2011)
sorbed on C-S- -S-H in alkali-free water) the
log(Rd) values in the present study are on the lower end. Tits et al. (2011) also found that
log(Rd) values increase with the C/S ratio and that the values are one order of magnitude
lower in ACW compared to water.
Table 7-1: Composition of U(VI) doped C-S-H phases synthesized by direct incorporation as described in chapter 7.1.2.1. Sample E/U was prepared from sample E (chapter 7.1.2.2). * Values are higher due to presence of bulk and gel water in sample E before sorption which decreased the amount of solid exposed to the dissolved U(VI). ** Determined after centrifugation at 40,000×g for 1 h.
Sample C/S
ratio
Ca
[mmol/g]
Si
[mmol/g]
Na
[mmol/g]
K
[mmol/g]
U
[nmol/g]
U/S
×106
log(Rd)
[log(L/kg)]
A 0.99 1.17 1.18 0.29 0.44 134.0 114 3.1/4.3**
B 1.55 1.87 1.21 0.17 0.24 156.7 129 3.7
C 2.02 2.94 1.46 0.10 0.14 229.0 157 4.1
D 0.59 1.38 2.25 0.47 0.67 167.6 74.5 n.d.
E 1.35 1.09 0.81 0.06 0.07
E/U 1.25 0.98 0.79 0.01 0.02 769* 975* 3.3
Tits et al. (2003) observed a high uncertainty in log(Rd) values due to an extremely strong
sorption of Eu(III) on the C-S-H phase and a possible incomplete phase separation during
centrifugation at low g values due to the presence of colloids in the supernatant. Since in the
present study samples were centrifuged at 6,800×g, it is possible that the low log(Rd) values
are also caused by an incomplete phase separation. To verify this assumption, sample A was
102
additionally centrifuged at 40,000×g for 1 h. Subsequently, the supernatant was analyzed for
U(VI) with ICP-MS, resulting in a higher log(Rd) value of 4.3 (Table 7-1). Thus, an
incomplete phase separation at 6,800×g can be assumed. The log(Rd) value determined at
40,000×g is in line with log(Rd) values from Tits et al. (2011) reported for U(VI) sorbed on C-
S-H in ACW.
A comparison of the log(Rd) values with the C/S ratios reveals an increased U(VI) retention at
high C/S ratios, similar as observed by Tits et al. (2011) and by Pointeau et al. (2004). Tits et
al. ascribed this trend to an ion exchange mechanism between Ca2+ from the interlayer and
. The log(Rd) value of sample E/U is similar to those of samples A-C.
To identify mineral phases formed in the samples A-D powder XRD was applied (Figure 7-1,
l.). The phase identification of the reflection patterns with the program PDXL 2 (Rigaku) and
the ICDD PDF-4+ 2016 database (C-S-H database card number 00-033-0306) verifies the
presence of C-S-
(Grangeon et al., 2013b). Most of the diffraction peaks are broad and asymmetrical,
characteristic for synthetic C-S-H.
For sample C, the additional reflections of portlandite at 18.1, 28.7, 34.2, 47.2, 50.9, 54.5,
-083-4600). TGA and
DSC investigations of sample C showed the co-existence of 18 mass-% portlandite (related to
dry weight) in sample C (Figure 7-2, l.). For samples A-C, (001) basal reflections around
crystallite size (amount of stacked layers in c direction) of samples A-C is larger compared to
sample D (Grangeon et al., 2013b). The reflection pattern of sample D (C/S 0.59) shows a
diffuse background peak that could be caused due to the co-formation of amorphous SiO2.
The IR spectra and the corresponding band positions of samples A-D dried in an N2
atmosphere are shown in (Figure 7-1, r.) and Table 7-2. Characteristic bands observed in the
C-S-H system are compiled in Table 7-3. Bands between 3,000 and 4,000 cm 1 are present in
all samples and are caused by O-H vibrations of remaining interlayer and bulk water, while
only sample C shows a band at 3,644 cm 1 which is characteristic for portlandite. In the
literature, a co-formation of portlandite and synthetic C-S-H was detected for C/S ratios above
1.7 (Yu et al., 1999). Consistent with this literature value of 1.7, portlandite is not detectable
in sample B (C/S 1.55) by IR measurements, therefore this sample should not contain
portlandite. Please note that in HCP systems portlandite can be detected at lower C/S ratios
compared to synthetic C-S-H phases (Auroy et al., 2018).
Since all samples were measured under ambient conditions, a surface carbonation could not
be prevented completely, only minimized by drying the U(VI) doped C-S-H samples before
exposure to air, as recommended in (Black et al., 2007). Therefore, carbonate doublets were
observed in the IR spectra at about 1,410 and 1,480 cm 1 in the spectra of samples A-C,
probably caused by vaterite on the surface that possesses a doublet around 1,420 and
1,490 cm 1 as mentioned by Sato and Matsuda (1969).
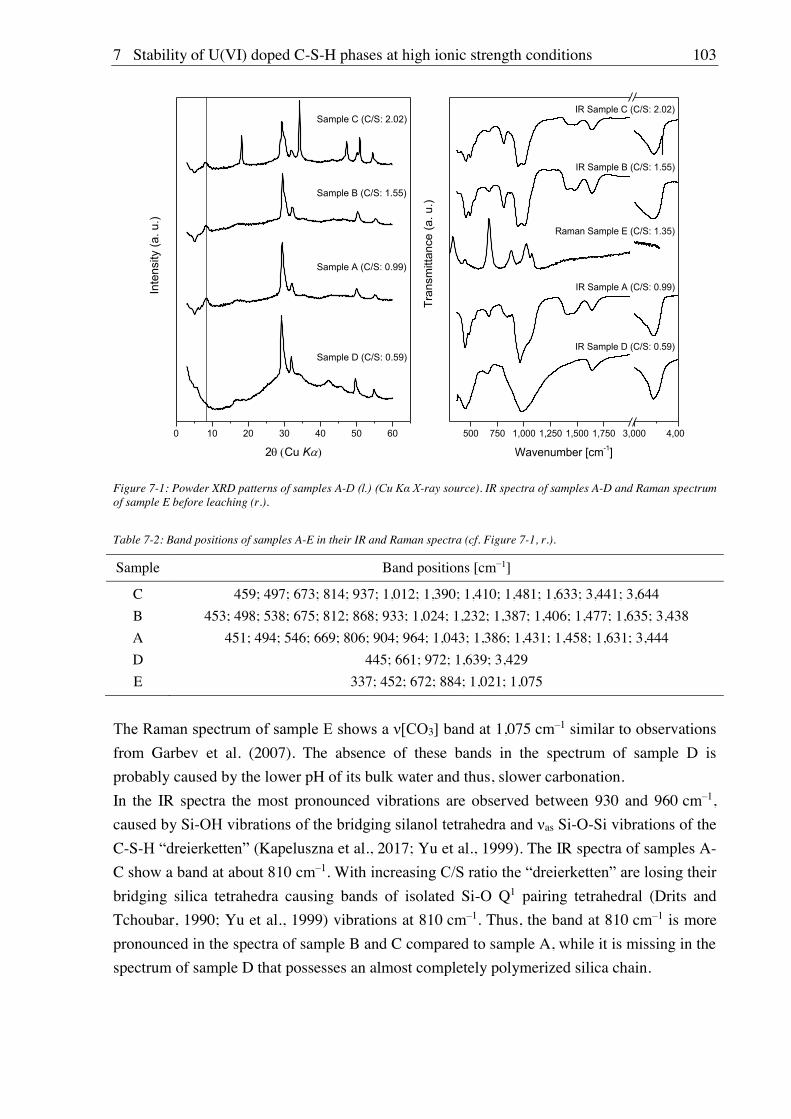
7 Stability of U(VI) doped C-S-H phases at high ionic strength conditions 103
0 10 20 30 40 50 60
Sample D (C/S: 0.59)
Sample A (C/S: 0.99)
Sample B (C/S: 1.55)
Inte
nsity
(a. u
.)
2 Cu K
Sample C (C/S: 2.02)
500 750 1,000 1,250 1,500 1,750 3,000 4,000
Raman Sample E (C/S: 1.35)
IR Sample D (C/S: 0.59)
IR Sample A (C/S: 0.99)
IR Sample B (C/S: 1.55)
Tran
smitt
ance
(a. u
.)
Wavenumber [cm-1]
IR Sample C (C/S: 2.02)
Figure 7-1: Powder XRD patterns of samples A-D (l.) (Cu K X-ray source). IR spectra of samples A-D and Raman spectrum of sample E before leaching (r.).
Table 7-2: Band positions of samples A-E in their IR and Raman spectra (cf. Figure 7-1, r.).
Sample Band positions [cm 1]
C 459; 497; 673; 814; 937; 1,012; 1,390; 1,410; 1,481; 1,633; 3,441; 3,644
B 453; 498; 538; 675; 812; 868; 933; 1,024; 1,232; 1,387; 1,406; 1,477; 1,635; 3,438
A 451; 494; 546; 669; 806; 904; 964; 1,043; 1,386; 1,431; 1,458; 1,631; 3,444
D 445; 661; 972; 1,639; 3,429
E 337; 452; 672; 884; 1,021; 1,075
3] band at 1,075 cm 1 similar to observations
from Garbev et al. (2007). The absence of these bands in the spectrum of sample D is
probably caused by the lower pH of its bulk water and thus, slower carbonation.
In the IR spectra the most pronounced vibrations are observed between 930 and 960 cm 1,
caused by Si- as Si-O-Si vibrations of the
C-S- (Kapeluszna et al., 2017; Yu et al., 1999). The IR spectra of samples A-
C show a band at about 810 cm 1. With
bridging silica tetrahedra causing bands of isolated Si-O Q1 pairing tetrahedral (Drits and
Tchoubar, 1990; Yu et al., 1999) vibrations at 810 cm 1. Thus, the band at 810 cm 1 is more
pronounced in the spectra of sample B and C compared to sample A, while it is missing in the
spectrum of sample D that possesses an almost completely polymerized silica chain.
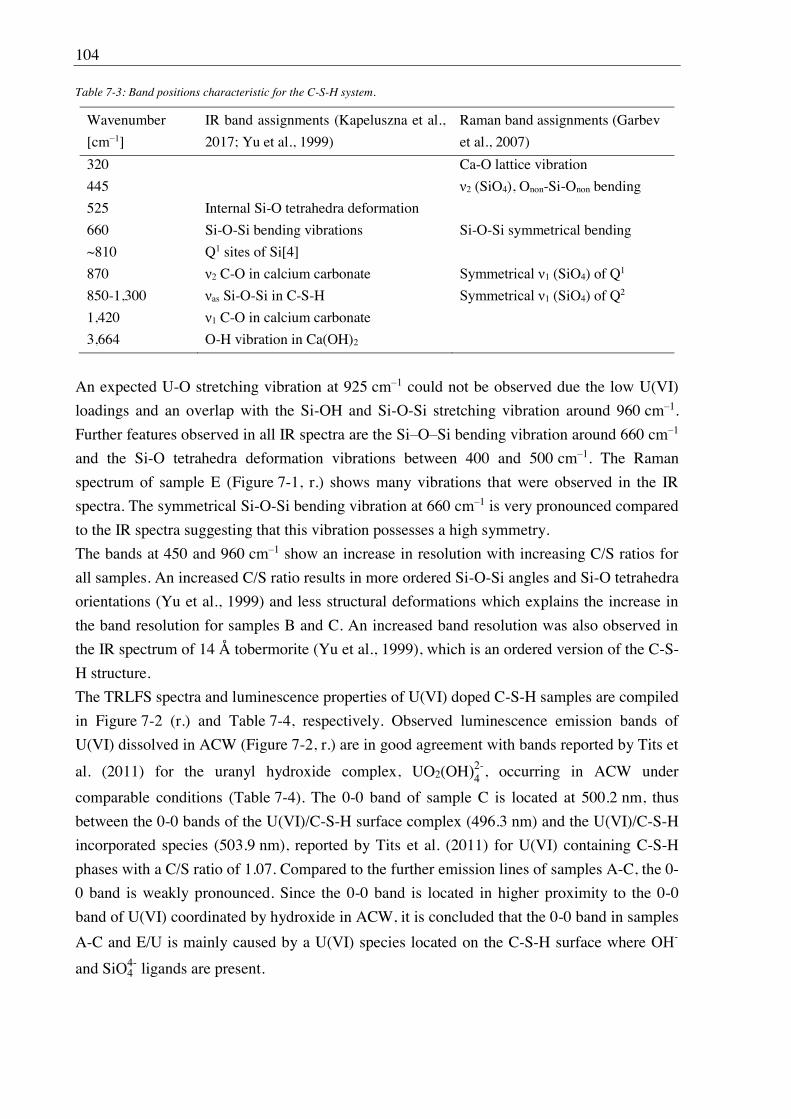
104
Table 7-3: Band positions characteristic for the C-S-H system.
Wavenumber
[cm 1]
IR band assignments (Kapeluszna et al.,
2017; Yu et al., 1999)
Raman band assignments (Garbev
et al., 2007)
320 Ca-O lattice vibration
445 2 (SiO4), Onon-Si-Onon bending
525 Internal Si-O tetrahedra deformation
660 Si-O-Si bending vibrations Si-O-Si symmetrical bending
~810 Q1 sites of Si[4]
870 2 C-O in calcium carbonate 1 (SiO4) of Q1
850-1,300 as Si-O-Si in C-S-H 1 (SiO4) of Q2
1,420 1 C-O in calcium carbonate
3,664 O-H vibration in Ca(OH)2
An expected U-O stretching vibration at 925 cm 1 could not be observed due the low U(VI)
loadings and an overlap with the Si-OH and Si-O-Si stretching vibration around 960 cm 1.
Further features observed in all IR spectra are the Si O Si bending vibration around 660 cm 1
and the Si-O tetrahedra deformation vibrations between 400 and 500 cm 1. The Raman
spectrum of sample E (Figure 7-1, r.) shows many vibrations that were observed in the IR
spectra. The symmetrical Si-O-Si bending vibration at 660 cm 1 is very pronounced compared
to the IR spectra suggesting that this vibration possesses a high symmetry.
The bands at 450 and 960 cm 1 show an increase in resolution with increasing C/S ratios for
all samples. An increased C/S ratio results in more ordered Si-O-Si angles and Si-O tetrahedra
orientations (Yu et al., 1999) and less structural deformations which explains the increase in
the band resolution for samples B and C. An increased band resolution was also observed in
the IR spectrum of 14 Å tobermorite (Yu et al., 1999), which is an ordered version of the C-S-
H structure.
The TRLFS spectra and luminescence properties of U(VI) doped C-S-H samples are compiled
in Figure 7-2 (r.) and Table 7-4, respectively. Observed luminescence emission bands of
U(VI) dissolved in ACW (Figure 7-2, r.) are in good agreement with bands reported by Tits et
al. (2011) for the uranyl hydroxide complex, UO2(OH -, occurring in ACW under
comparable conditions (Table 7-4). The 0-0 band of sample C is located at 500.2 nm, thus
between the 0-0 bands of the U(VI)/C-S-H surface complex (496.3 nm) and the U(VI)/C-S-H
incorporated species (503.9 nm), reported by Tits et al. (2011) for U(VI) containing C-S-H
phases with a C/S ratio of 1.07. Compared to the further emission lines of samples A-C, the 0-
0 band is weakly pronounced. Since the 0-0 band is located in higher proximity to the 0-0
band of U(VI) coordinated by hydroxide in ACW, it is concluded that the 0-0 band in samples
A-C and E/U is mainly caused by a U(VI) species located on the C-S-H surface where O -
and Si - ligands are present.
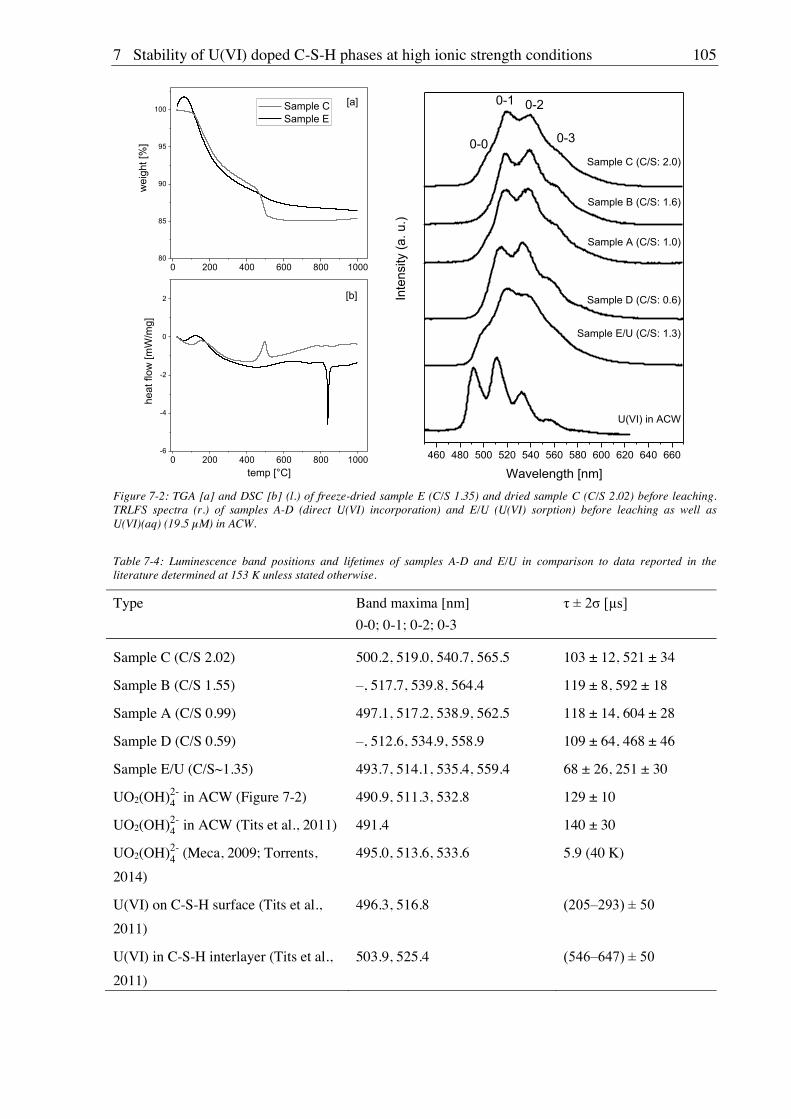
7 Stability of U(VI) doped C-S-H phases at high ionic strength conditions 105
0 200 400 600 800 100080
85
90
95
100
0 200 400 600 800 1000-6
-4
-2
0
2
wei
ght [
%]
[a] Sample C Sample E
heat
flow
[mW
/mg]
temp [°C]
[b]
460 480 500 520 540 560 580 600 620 640 660
Sample E/U (C/S: 1.3)
U(VI) in ACW
Sample D (C/S: 0.6)
Sample A (C/S: 1.0)
Sample B (C/S: 1.6)
Inte
nsity
(a. u
.)
Wavelength [nm]
Sample C (C/S: 2.0)0-0
0-1 0-2
0-3
Figure 7-2: TGA [a] and DSC [b] (l.) of freeze-dried sample E (C/S 1.35) and dried sample C (C/S 2.02) before leaching. TRLFS spectra (r.) of samples A-D (direct U(VI) incorporation) and E/U (U(VI) sorption) before leaching as well as U(VI)(aq) (19.5 M) in ACW.
Table 7-4: Luminescence band positions and lifetimes of samples A-D and E/U in comparison to data reported in the literature determined at 153 K unless stated otherwise.
Type Band maxima [nm]
0-0; 0-1; 0-2; 0-3
Sample C (C/S 2.02) 500.2, 519.0, 540.7, 565.5 103 ± 12, 521 ± 34
Sample B (C/S 1.55) , 517.7, 539.8, 564.4 119 ± 8, 592 ± 18
Sample A (C/S 0.99) 497.1, 517.2, 538.9, 562.5 118 ± 14, 604 ± 28
Sample D (C/S 0.59) , 512.6, 534.9, 558.9 109 ± 64, 468 ± 46
Sample E/U (C/S~1.35) 493.7, 514.1, 535.4, 559.4 68 ± 26, 251 ± 30
UO2(OH - in ACW (Figure 7-2) 490.9, 511.3, 532.8 129 ± 10
UO2(OH - in ACW (Tits et al., 2011) 491.4 140 ± 30
UO2(OH - (Meca, 2009; Torrents,
2014)
495.0, 513.6, 533.6 5.9 (40 K)
U(VI) on C-S-H surface (Tits et al.,
2011)
496.3, 516.8
U(VI) in C-S-H interlayer (Tits et al.,
2011)
503.9, 525.4
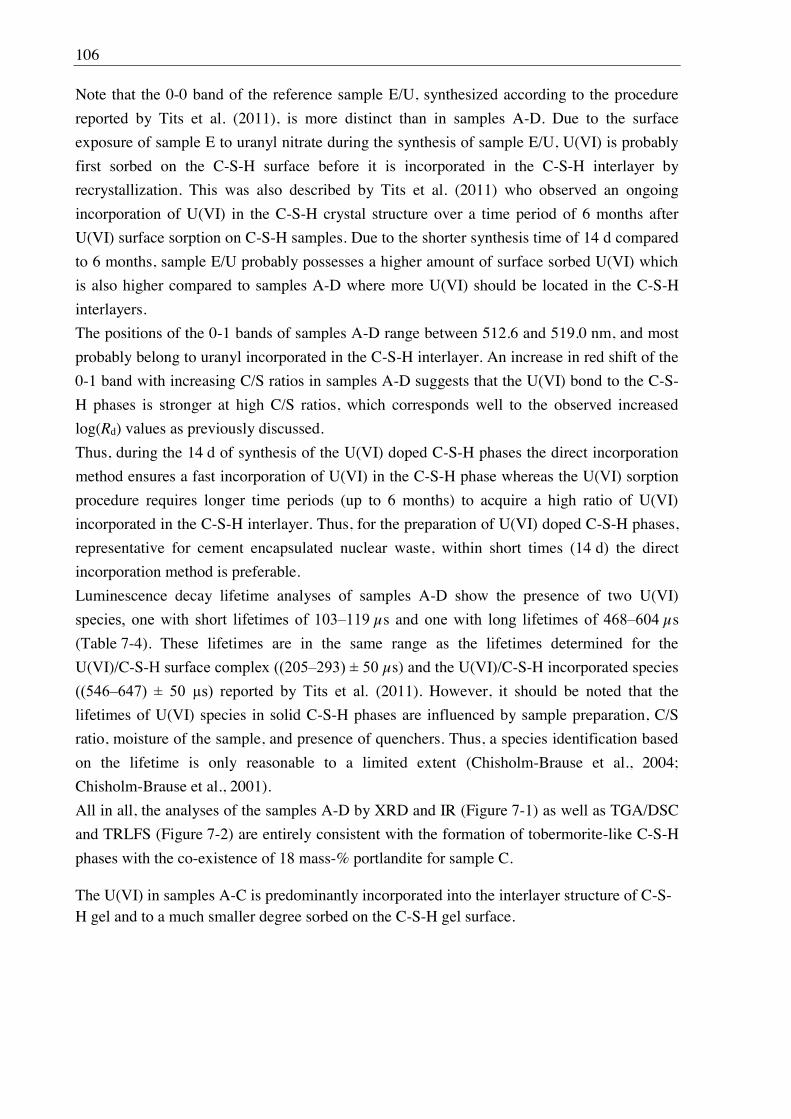
106
Note that the 0-0 band of the reference sample E/U, synthesized according to the procedure
reported by Tits et al. (2011), is more distinct than in samples A-D. Due to the surface
exposure of sample E to uranyl nitrate during the synthesis of sample E/U, U(VI) is probably
first sorbed on the C-S-H surface before it is incorporated in the C-S-H interlayer by
recrystallization. This was also described by Tits et al. (2011) who observed an ongoing
incorporation of U(VI) in the C-S-H crystal structure over a time period of 6 months after
U(VI) surface sorption on C-S-H samples. Due to the shorter synthesis time of 14 d compared
to 6 months, sample E/U probably possesses a higher amount of surface sorbed U(VI) which
is also higher compared to samples A-D where more U(VI) should be located in the C-S-H
interlayers.
The positions of the 0-1 bands of samples A-D range between 512.6 and 519.0 nm, and most
probably belong to uranyl incorporated in the C-S-H interlayer. An increase in red shift of the
0-1 band with increasing C/S ratios in samples A-D suggests that the U(VI) bond to the C-S-
H phases is stronger at high C/S ratios, which corresponds well to the observed increased
log(Rd) values as previously discussed.
Thus, during the 14 d of synthesis of the U(VI) doped C-S-H phases the direct incorporation
method ensures a fast incorporation of U(VI) in the C-S-H phase whereas the U(VI) sorption
procedure requires longer time periods (up to 6 months) to acquire a high ratio of U(VI)
incorporated in the C-S-H interlayer. Thus, for the preparation of U(VI) doped C-S-H phases,
representative for cement encapsulated nuclear waste, within short times (14 d) the direct
incorporation method is preferable.
Luminescence decay lifetime analyses of samples A-D show the presence of two U(VI)
s and s
(Table 7-4). These lifetimes are in the same range as the lifetimes determined for the
U(VI)/C-S- s) and the U(VI)/C-S-H incorporated species
(2011). However, it should be noted that the
lifetimes of U(VI) species in solid C-S-H phases are influenced by sample preparation, C/S
ratio, moisture of the sample, and presence of quenchers. Thus, a species identification based
on the lifetime is only reasonable to a limited extent (Chisholm-Brause et al., 2004;
Chisholm-Brause et al., 2001).
All in all, the analyses of the samples A-D by XRD and IR (Figure 7-1) as well as TGA/DSC
and TRLFS (Figure 7-2) are entirely consistent with the formation of tobermorite-like C-S-H
phases with the co-existence of 18 mass-% portlandite for sample C.
The U(VI) in samples A-C is predominantly incorporated into the interlayer structure of C-S-H gel and to a much smaller degree sorbed on the C-S-H gel surface.
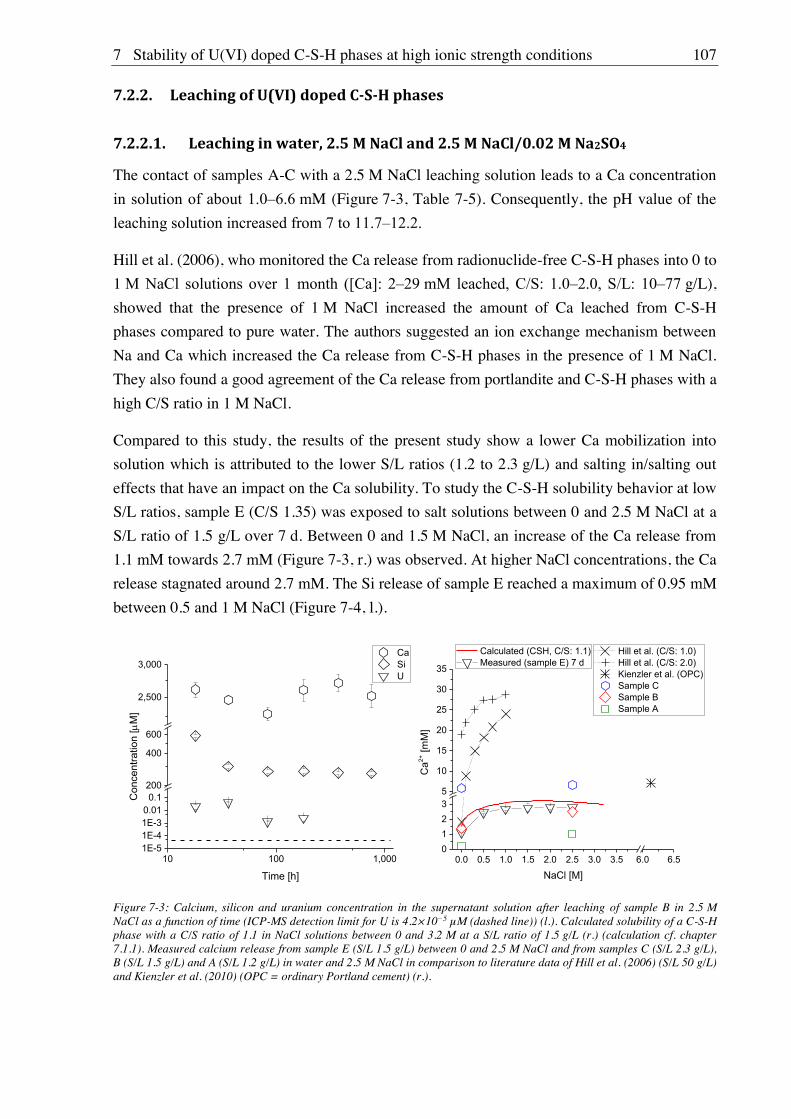
7 Stability of U(VI) doped C-S-H phases at high ionic strength conditions 107
7.2.2. Leaching of U(VI) doped C-S-H phases
7.2.2.1. Leaching in water, 2.5 M NaCl and 2.5 M NaCl/0.02 M Na2SO4
The contact of samples A-C with a 2.5 M NaCl leaching solution leads to a Ca concentration
mM (Figure 7-3, Table 7-5). Consequently, the pH value of the
Hill et al. (2006), who monitored the Ca release from radionuclide-free C-S-H phases into 0 to
1 g/L),
showed that the presence of 1 M NaCl increased the amount of Ca leached from C-S-H
phases compared to pure water. The authors suggested an ion exchange mechanism between
Na and Ca which increased the Ca release from C-S-H phases in the presence of 1 M NaCl.
They also found a good agreement of the Ca release from portlandite and C-S-H phases with a
high C/S ratio in 1 M NaCl.
Compared to this study, the results of the present study show a lower Ca mobilization into
solution which is attributed to the lower S/L ratios (1.2 to 2.3 g/L) and salting in/salting out
effects that have an impact on the Ca solubility. To study the C-S-H solubility behavior at low
S/L ratios, sample E (C/S 1.35) was exposed to salt solutions between 0 and 2.5 M NaCl at a
S/L ratio of 1.5 g/L over 7 d. Between 0 and 1.5 M NaCl, an increase of the Ca release from
1.1 mM towards 2.7 mM (Figure 7-3, r.) was observed. At higher NaCl concentrations, the Ca
release stagnated around 2.7 mM. The Si release of sample E reached a maximum of 0.95 mM
between 0.5 and 1 M NaCl (Figure 7-4, l.).
10 100 1,0001E-51E-41E-30.010.1200
400
600
2,500
3,000
Con
cent
ratio
n [
M]
Time [h]
Ca Si U
0.0 0.5 1.0 1.5 2.0 2.5 3.0 3.5 6.0 6.501235
10
15
20
25
30
35
Ca2+
[mM
]
NaCl [M]
Calculated (CSH, C/S: 1.1) Measured (sample E) 7 d
Hill et al. (C/S: 1.0) Hill et al. (C/S: 2.0) Kienzler et al. (OPC) Sample C Sample B Sample A
Figure 7-3: Calcium, silicon and uranium concentration in the supernatant solution after leaching of sample B in 2.5 M NaCl as a function of time (ICP-MS detection limit for U is 4.2×10 5 M (dashed line)) (l.). Calculated solubility of a C-S-H phase with a C/S ratio of 1.1 in NaCl solutions between 0 and 3.2 M at a S/L ratio of 1.5 g/L (r.) (calculation cf. chapter 7.1.1). Measured calcium release from sample E (S/L 1.5 g/L) between 0 and 2.5 M NaCl and from samples C (S/L 2.3 g/L), B (S/L 1.5 g/L) and A (S/L 1.2 g/L) in water and 2.5 M NaCl in comparison to literature data of Hill et al. (2006) (S/L 50 g/L) and Kienzler et al. (2010) (OPC = ordinary Portland cement) (r.).
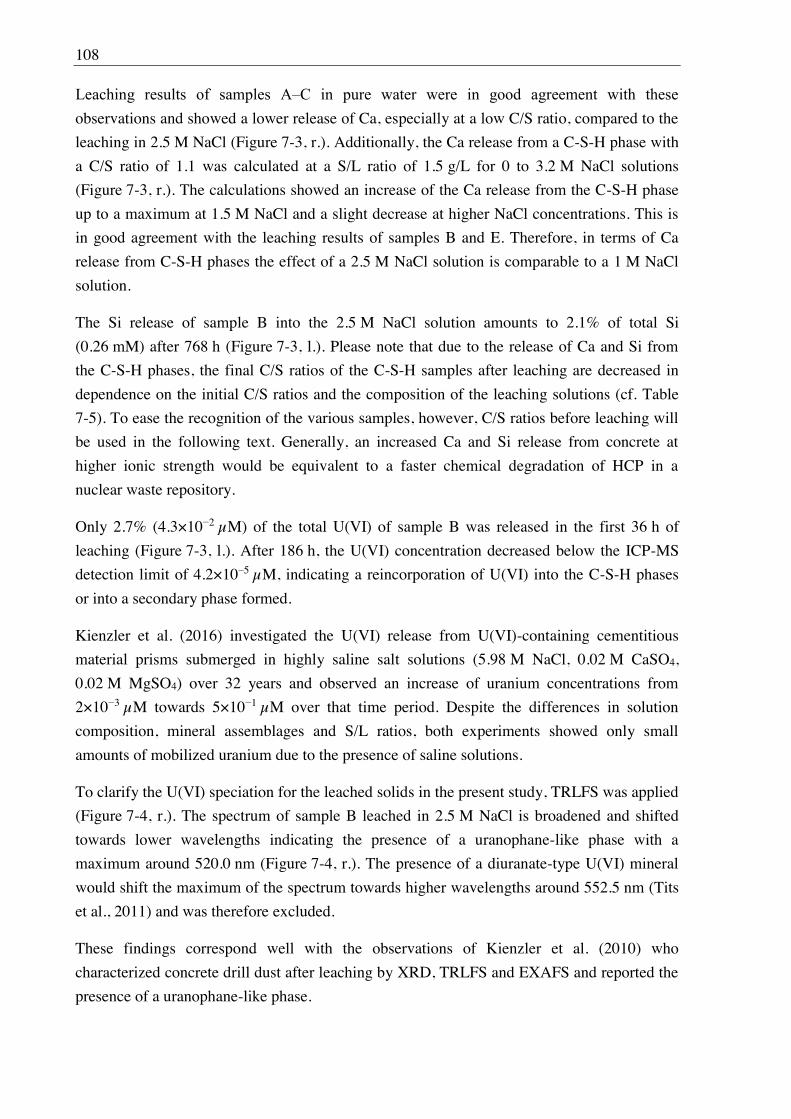
108
observations and showed a lower release of Ca, especially at a low C/S ratio, compared to the
leaching in 2.5 M NaCl (Figure 7-3, r.). Additionally, the Ca release from a C-S-H phase with
a C/S ratio of 1.1 was calculated at a S/L ratio of 1.5 g/L for 0 to 3.2 M NaCl solutions
(Figure 7-3, r.). The calculations showed an increase of the Ca release from the C-S-H phase
up to a maximum at 1.5 M NaCl and a slight decrease at higher NaCl concentrations. This is
in good agreement with the leaching results of samples B and E. Therefore, in terms of Ca
release from C-S-H phases the effect of a 2.5 M NaCl solution is comparable to a 1 M NaCl
solution.
The Si release of sample B into the 2.5 M NaCl solution amounts to 2.1% of total Si
(0.26 mM) after 768 h (Figure 7-3, l.). Please note that due to the release of Ca and Si from
the C-S-H phases, the final C/S ratios of the C-S-H samples after leaching are decreased in
dependence on the initial C/S ratios and the composition of the leaching solutions (cf. Table
7-5). To ease the recognition of the various samples, however, C/S ratios before leaching will
be used in the following text. Generally, an increased Ca and Si release from concrete at
higher ionic strength would be equivalent to a faster chemical degradation of HCP in a
nuclear waste repository.
Only 2.7% (4.3×10 2 M) of the total U(VI) of sample B was released in the first 36 h of
leaching (Figure 7-3, l.). After 186 h, the U(VI) concentration decreased below the ICP-MS
detection limit of 4.2×10 5 M, indicating a reincorporation of U(VI) into the C-S-H phases
or into a secondary phase formed.
Kienzler et al. (2016) investigated the U(VI) release from U(VI)-containing cementitious
material prisms submerged in highly saline salt solutions (5.98 M NaCl, 0.02 M CaSO4,
0.02 M MgSO4) over 32 years and observed an increase of uranium concentrations from
2×10 3 M towards 5×10 1 M over that time period. Despite the differences in solution
composition, mineral assemblages and S/L ratios, both experiments showed only small
amounts of mobilized uranium due to the presence of saline solutions.
To clarify the U(VI) speciation for the leached solids in the present study, TRLFS was applied
(Figure 7-4, r.). The spectrum of sample B leached in 2.5 M NaCl is broadened and shifted
towards lower wavelengths indicating the presence of a uranophane-like phase with a
maximum around 520.0 nm (Figure 7-4, r.). The presence of a diuranate-type U(VI) mineral
would shift the maximum of the spectrum towards higher wavelengths around 552.5 nm (Tits
et al., 2011) and was therefore excluded.
These findings correspond well with the observations of Kienzler et al. (2010) who
characterized concrete drill dust after leaching by XRD, TRLFS and EXAFS and reported the
presence of a uranophane-like phase.
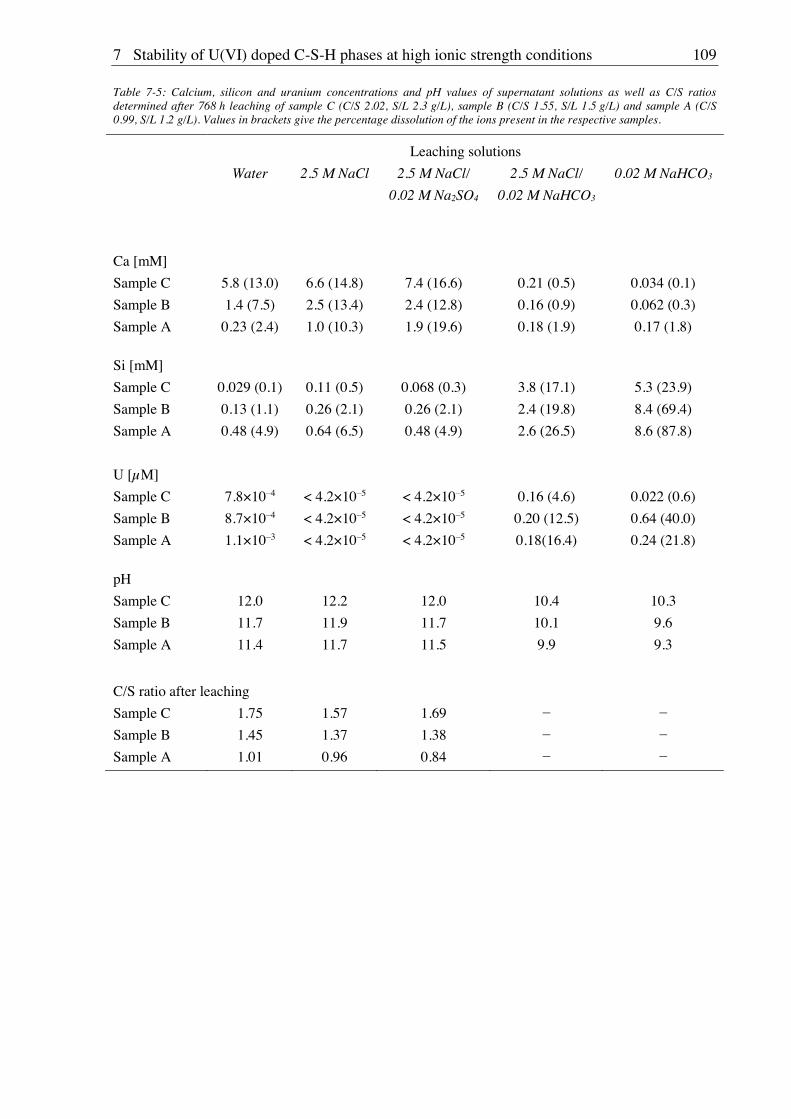
7 Stability of U(VI) doped C-S-H phases at high ionic strength conditions 109
Table 7-5: Calcium, silicon and uranium concentrations and pH values of supernatant solutions as well as C/S ratios determined after 768 h leaching of sample C (C/S 2.02, S/L 2.3 g/L), sample B (C/S 1.55, S/L 1.5 g/L) and sample A (C/S 0.99, S/L 1.2 g/L). Values in brackets give the percentage dissolution of the ions present in the respective samples.
Leaching solutions
Water 2.5 M NaCl 2.5 M NaCl/
0.02 M Na2SO4
2.5 M NaCl/
0.02 M NaHCO3
0.02 M NaHCO3
Ca [mM]
Sample C 5.8 (13.0) 6.6 (14.8) 7.4 (16.6) 0.21 (0.5) 0.034 (0.1)
Sample B 1.4 (7.5) 2.5 (13.4) 2.4 (12.8) 0.16 (0.9) 0.062 (0.3)
Sample A 0.23 (2.4) 1.0 (10.3) 1.9 (19.6) 0.18 (1.9) 0.17 (1.8)
Si [mM]
Sample C 0.029 (0.1) 0.11 (0.5) 0.068 (0.3) 3.8 (17.1) 5.3 (23.9)
Sample B 0.13 (1.1) 0.26 (2.1) 0.26 (2.1) 2.4 (19.8) 8.4 (69.4)
Sample A 0.48 (4.9) 0.64 (6.5) 0.48 (4.9) 2.6 (26.5) 8.6 (87.8)
U [ M]
Sample C 7.8×10 4 < 4.2×10 5 < 4.2×10 5 0.16 (4.6) 0.022 (0.6)
Sample B 8.7×10 4 < 4.2×10 5 < 4.2×10 5 0.20 (12.5) 0.64 (40.0)
Sample A 1.1×10 3 < 4.2×10 5 < 4.2×10 5 0.18(16.4) 0.24 (21.8)
pH
Sample C 12.0 12.2 12.0 10.4 10.3
Sample B 11.7 11.9 11.7 10.1 9.6
Sample A 11.4 11.7 11.5 9.9 9.3
C/S ratio after leaching
Sample C 1.75 1.57 1.69
Sample B 1.45 1.37 1.38
Sample A 1.01 0.96 0.84
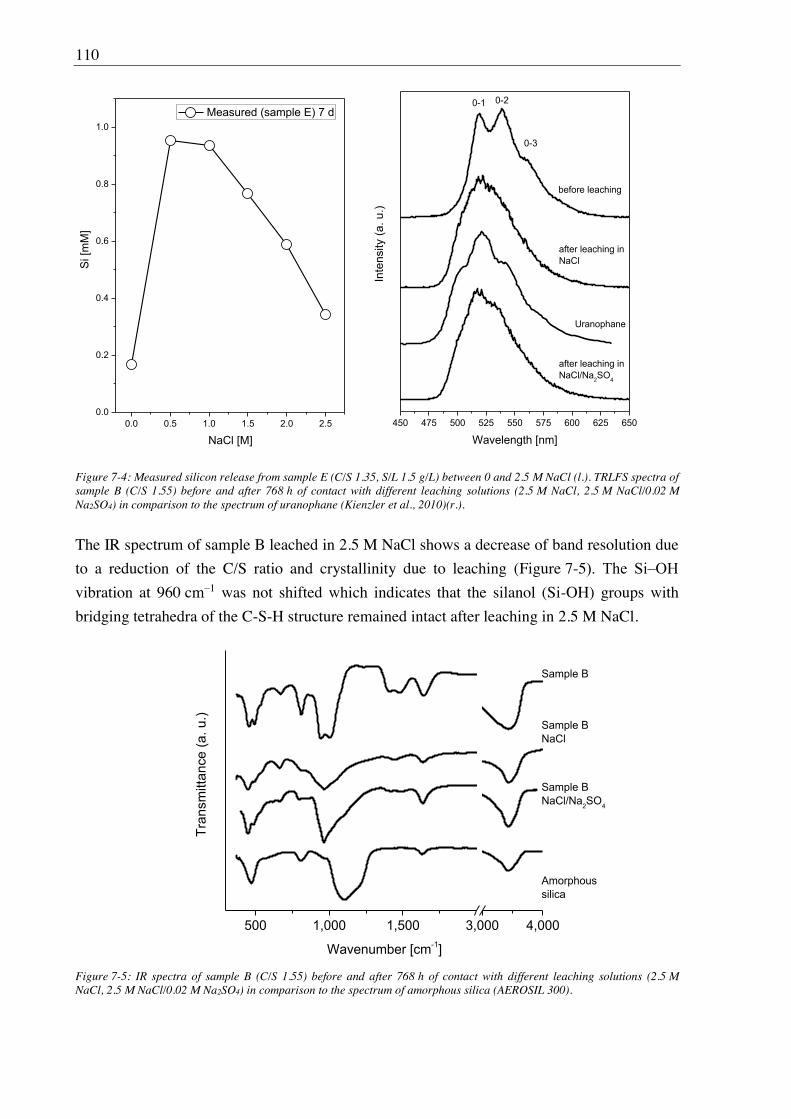
110
0.0 0.5 1.0 1.5 2.0 2.50.0
0.2
0.4
0.6
0.8
1.0
Si [m
M]
NaCl [M]
Measured (sample E) 7 d
450 475 500 525 550 575 600 625 650
after leaching inNaCl/Na2SO4
after leaching inNaCl
Inte
nsity
(a. u
.)
Wavelength [nm]
before leaching
0-1 0-2
0-3
Uranophane
Figure 7-4: Measured silicon release from sample E (C/S 1.35, S/L 1.5 g/L) between 0 and 2.5 M NaCl (l.). TRLFS spectra of sample B (C/S 1.55) before and after 768 h of contact with different leaching solutions (2.5 M NaCl, 2.5 M NaCl/0.02 M Na2SO4) in comparison to the spectrum of uranophane (Kienzler et al., 2010)(r.).
The IR spectrum of sample B leached in 2.5 M NaCl shows a decrease of band resolution due
to a reduction of the C/S ratio and crystallinity due to leaching (Figure 7-5
vibration at 960 cm 1 was not shifted which indicates that the silanol (Si-OH) groups with
bridging tetrahedra of the C-S-H structure remained intact after leaching in 2.5 M NaCl.
500 1,000 1,500 3,000 4,000
Tran
smitt
ance
(a. u
.)
Wavenumber [cm-1]
Sample B
Sample BNaCl
Sample BNaCl/Na2SO4
Amorphoussilica
Figure 7-5: IR spectra of sample B (C/S 1.55) before and after 768 h of contact with different leaching solutions (2.5 M NaCl, 2.5 M NaCl/0.02 M Na2SO4) in comparison to the spectrum of amorphous silica (AEROSIL 300).
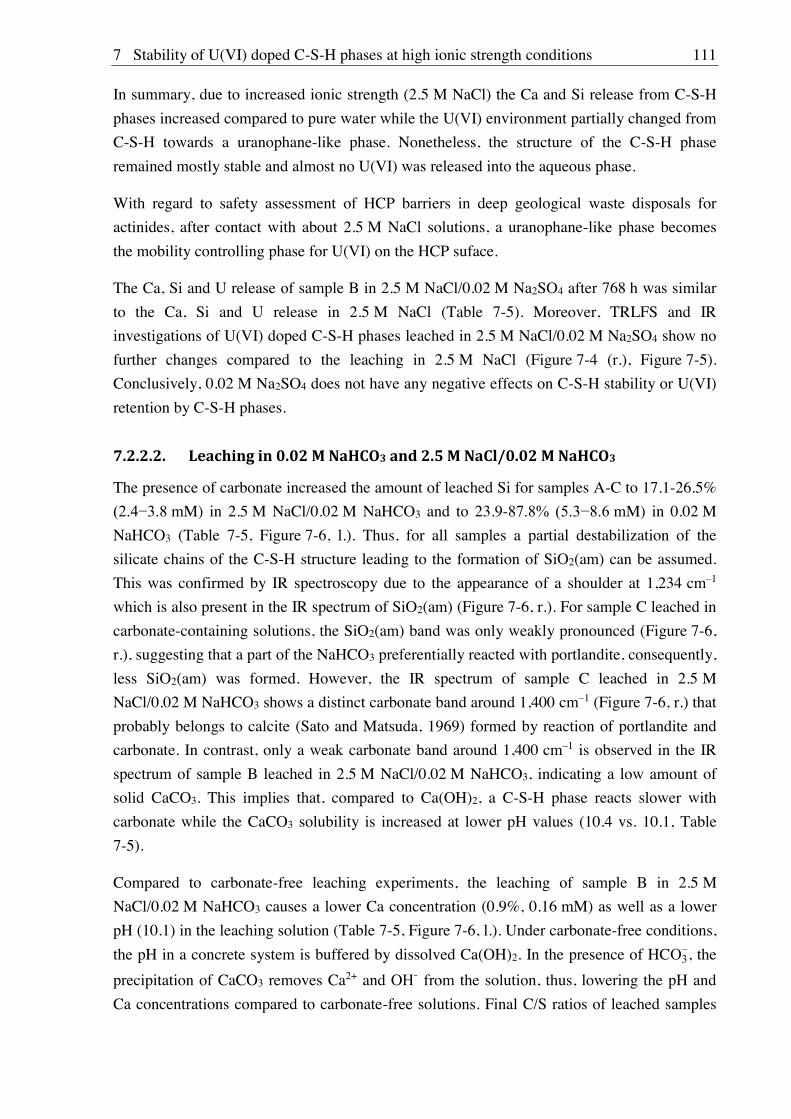
7 Stability of U(VI) doped C-S-H phases at high ionic strength conditions 111
In summary, due to increased ionic strength (2.5 M NaCl) the Ca and Si release from C-S-H
phases increased compared to pure water while the U(VI) environment partially changed from
C-S-H towards a uranophane-like phase. Nonetheless, the structure of the C-S-H phase
remained mostly stable and almost no U(VI) was released into the aqueous phase.
With regard to safety assessment of HCP barriers in deep geological waste disposals for
actinides, after contact with about 2.5 M NaCl solutions, a uranophane-like phase becomes
the mobility controlling phase for U(VI) on the HCP suface.
The Ca, Si and U release of sample B in 2.5 M NaCl/0.02 M Na2SO4 after 768 h was similar
to the Ca, Si and U release in 2.5 M NaCl (Table 7-5). Moreover, TRLFS and IR
investigations of U(VI) doped C-S-H phases leached in 2.5 M NaCl/0.02 M Na2SO4 show no
further changes compared to the leaching in 2.5 M NaCl (Figure 7-4 (r.), Figure 7-5).
Conclusively, 0.02 M Na2SO4 does not have any negative effects on C-S-H stability or U(VI)
retention by C-S-H phases.
7.2.2.2. Leaching in 0.02 M NaHCO3 and 2.5 M NaCl/0.02 M NaHCO3
The presence of carbonate increased the amount of leached Si for samples A-C to 17.1-26.5%
mM) in 2.5 M NaCl/0.02 M NaHCO3 and to 23.9- mM) in 0.02 M
NaHCO3 (Table 7-5, Figure 7-6, l.). Thus, for all samples a partial destabilization of the
silicate chains of the C-S-H structure leading to the formation of SiO2(am) can be assumed.
This was confirmed by IR spectroscopy due to the appearance of a shoulder at 1,234 cm 1
which is also present in the IR spectrum of SiO2(am) (Figure 7-6, r.). For sample C leached in
carbonate-containing solutions, the SiO2(am) band was only weakly pronounced (Figure 7-6,
r.), suggesting that a part of the NaHCO3 preferentially reacted with portlandite, consequently,
less SiO2(am) was formed. However, the IR spectrum of sample C leached in 2.5 M
NaCl/0.02 M NaHCO3 shows a distinct carbonate band around 1,400 cm 1 (Figure 7-6, r.) that
probably belongs to calcite (Sato and Matsuda, 1969) formed by reaction of portlandite and
carbonate. In contrast, only a weak carbonate band around 1,400 cm 1 is observed in the IR
spectrum of sample B leached in 2.5 M NaCl/0.02 M NaHCO3, indicating a low amount of
solid CaCO3. This implies that, compared to Ca(OH)2, a C-S-H phase reacts slower with
carbonate while the CaCO3 solubility is increased at lower pH values (10.4 vs. 10.1, Table
7-5).
Compared to carbonate-free leaching experiments, the leaching of sample B in 2.5 M
NaCl/0.02 M NaHCO3 causes a lower Ca concentration (0.9%, 0.16 mM) as well as a lower
pH (10.1) in the leaching solution (Table 7-5, Figure 7-6, l.). Under carbonate-free conditions,
the pH in a concrete system is buffered by dissolved Ca(OH)2. In the presence of HC , the
precipitation of CaCO3 removes Ca2+ and O - from the solution, thus, lowering the pH and
Ca concentrations compared to carbonate-free solutions. Final C/S ratios of leached samples
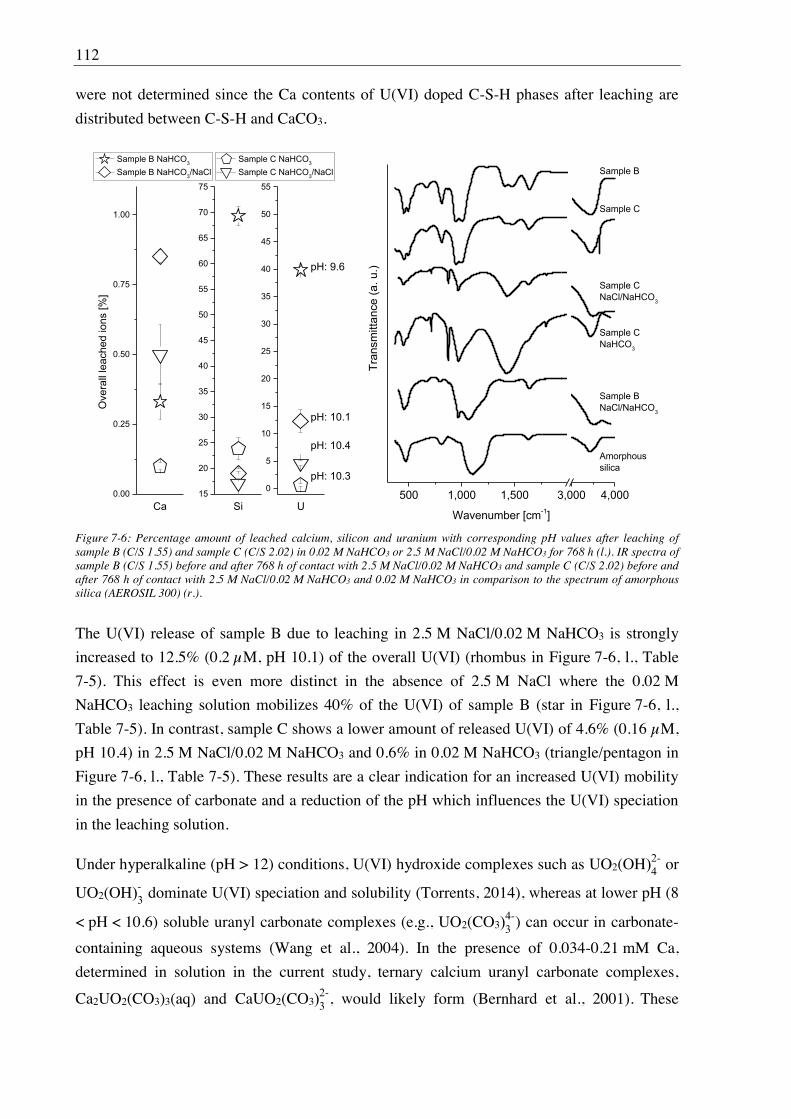
112
were not determined since the Ca contents of U(VI) doped C-S-H phases after leaching are
distributed between C-S-H and CaCO3.
0.00
0.25
0.50
0.75
1.00
15
20
25
30
35
40
45
50
55
60
65
70
75
0
5
10
15
20
25
30
35
40
45
50
55
Ove
rall
leac
hed
ions
[%]
Ca
Sample C NaHCO3
Sample C NaHCO3/NaCl
Si
Sample B NaHCO3
Sample B NaHCO3/NaCl
pH: 10.4
pH: 10.1
U
pH: 9.6
pH: 10.3
500 1,000 1,500 3,000 4,000
Sample CNaHCO3
Sample CNaCl/NaHCO3
Sample C
Tran
smitt
ance
(a. u
.)
Wavenumber [cm-1]
Sample B
Sample BNaCl/NaHCO3
Amorphoussilica
Figure 7-6: Percentage amount of leached calcium, silicon and uranium with corresponding pH values after leaching of sample B (C/S 1.55) and sample C (C/S 2.02) in 0.02 M NaHCO3 or 2.5 M NaCl/0.02 M NaHCO3 for 768 h (l.). IR spectra of sample B (C/S 1.55) before and after 768 h of contact with 2.5 M NaCl/0.02 M NaHCO3 and sample C (C/S 2.02) before and after 768 h of contact with 2.5 M NaCl/0.02 M NaHCO3 and 0.02 M NaHCO3 in comparison to the spectrum of amorphous silica (AEROSIL 300) (r.).
The U(VI) release of sample B due to leaching in 2.5 M NaCl/0.02 M NaHCO3 is strongly
increased to 12.5% (0.2 M, pH 10.1) of the overall U(VI) (rhombus in Figure 7-6, l., Table
7-5). This effect is even more distinct in the absence of 2.5 M NaCl where the 0.02 M
NaHCO3 leaching solution mobilizes 40% of the U(VI) of sample B (star in Figure 7-6, l.,
Table 7-5). In contrast, sample C shows a lower amount of released U(VI) of 4.6% (0.16 M,
pH 10.4) in 2.5 M NaCl/0.02 M NaHCO3 and 0.6% in 0.02 M NaHCO3 (triangle/pentagon in
Figure 7-6, l., Table 7-5). These results are a clear indication for an increased U(VI) mobility
in the presence of carbonate and a reduction of the pH which influences the U(VI) speciation
in the leaching solution.
Under hyperalkaline (pH > 12) conditions, U(VI) hydroxide complexes such as UO2(OH - or
UO2(OH - dominate U(VI) speciation and solubility (Torrents, 2014), whereas at lower pH (8
< pH < 10.6) soluble uranyl carbonate complexes (e.g., UO2(CO3-) can occur in carbonate-
containing aqueous systems (Wang et al., 2004). In the presence of 0.034-0.21 mM Ca,
determined in solution in the current study, ternary calcium uranyl carbonate complexes,
Ca2UO2(CO3)3(aq) and CaUO2(CO3-, would likely form (Bernhard et al., 2001). These
7 Stability of U(VI) doped C-S-H phases at high ionic strength conditions 113
ternary species impede the U(VI) sorption onto solids as shown, for instance, for ferrihydrite
and quartz (Fox et al., 2006), clay (Joseph et al., 2013) and granite (Schmeide et al., 2014).
0 10 20 30 40 50 60 70 809.0
9.5
10.0
10.5
11.0
11.5 pH
pH
Added NaHCO3 [mM]
0.0
0.2
0.4
0.6
0.8
1.0
[U]
Con
cent
ratio
n of
U(V
I) [
M]
460 480 500 520 540 560 580 600 620 640
Sample B NaCl/NaHCO3
Sample C NaCl/NaHCO3
0-1
Sample A sup. sol. NaCl/NaHCO3
Inte
nsity
(a. u
.)Wavelength [nm]
Sample C NaHCO3
Sample B NaCl/NaHCO3
Sample A sup. sol. NaHCO3
Sample Csup. sol. NaHCO3
Figure 7-7: Evolution of pH value and U concentration of the supernatant solution of sample A as function of added NaHCO3 (768 h leaching, S/L 1.2 g/L) (l.). TRLFS spectra of sample C leached in 0.02 M NaHCO3, sample C leached in 2.5 M NaCl/0.02 M NaHCO3, sample B leached in 2.5 M NaCl/0.02 M NaHCO3, sample B leached in 2.5 M NaCl/0.075 M NaHCO3, supernatant solution of sample C leached in 0.02 M NaHCO3, supernatant solution of sample A leached in 0.1 M NaHCO3, supernatant solution of sample A leached in 2.5 M NaCl/0.075 M NaHCO3 (768 h leaching) (r.).
To investigate U(VI) speciation changes in the leaching solution from UO2(OH - or
UO2(OH - towards aqueous calcium uranyl tricarbonate in dependence on pH and amount of
NaHCO3, a leaching series of sample A in solutions containing up to 75 mM NaHCO3 was
performed (Figure 7-7, l.). The leaching solutions of sample A show a non-linear decrease of
the pH value coupled with increasing amounts of released U in dependence on the NaHCO3
contents. TRLFS investigations confirmed the predominance of aqueous calcium uranyl
tricarbonate (Figure 7-7, r.) for NaHCO3 mM which corresponds to pH
9.3. This complex possessed well-defined emission bands at 480.7, 500.9, 522.0 and
545.0 nm and a lifetime of 750 s (at 153 K) similar to the data reported by Wang et al.
(2004) (cf. Table 7-6). This complex was also observed in the presence of 2.5 M NaCl when
the pH and carbonate content were similar (Figure 7-7, r.).
Speciation calculations performed for the composition determined in the supernatant solution
of sample B after leaching in 2.5 M NaCl/0.02 M NaHCO3 ([Ca]: 0.159 mM, [Si]: 2.4 mM,
[U]: 0.2 M, [carbonate]: 14 mM, pH: 10.1), supported the formation of aqueous calcium
uranyl tricarbonate complexes.
114
Table 7-6: Band positions and lifetimes of U(VI) species in relevant reference systems.
Type Band maxima [nm]
0-0; 0-1; 0-2; 0-3
Ca2UO2(CO3)3(aq), present work 480.7, 500.9, 522.0, 545.0 750 ± 24 (153 K)
Ca2UO2(CO3)3(aq) (Wang et al., 2004) 480.5, 501.2, 522.7, 546.0 1282 (6 K)
Ca2UO2(CO3)3(aq) (Bernhard et al.,
2001)
467.0, 484.0, 504.0, 524.0 0.036 (298 K)
U-rich natural calcite (Wang et al.,
2005b)
481.0, 500.0, 520.9, 543.7 339 (6 K)
At higher pH values, the high concentration of O - suppresses the formation of calcium
uranyl tricarbonate, and spectra with low intensities and without any band resolution are
detected (sample C sup. sol. NaHCO3, Figure 7-7, r.).
Nonetheless, further factors such as formation of secondary CaCO3 phases like calcite,
vaterite and aragonite and their solubility in dependence on ionic strength may also influence
the U(VI) mobility due to sorption of U(VI) on these CaCO3 polymorphs. To investigate the
influence of the secondary phase formation, TRLFS spectra of leached samples A-C were
recorded. The TRLFS spectra of sample B leached in 2.5 M NaCl/0.02 M NaHCO3 or 2.5 M
NaCl/0.075 M NaHCO3 (Figure 7-7, r.) show a shift of the 0-1 band towards lower
wavelengths from 517.1 nm to 505.5 nm and 494.2 nm, respectively. These shifts towards
lower wavelengths can be explained by an increased amount of U(VI) sorbed or incorporated
in calcite formed as secondary phase as reported in the literature (Elzinga et al., 2004; Geipel
et al., 1997; Smith et al., 2015).
TRLFS investigations of a natural U(VI)-containing calcite showed 0-0 and 0-1 bands at
481.0 and 500.0 nm, respectively (Wang et al., 2005b). Since the leached samples contain a
mixture of U(VI) sorbed on calcite and U(VI) remaining in the C-S-H phase, the recorded
spectra after leaching in carbonate-containing solutions are caused by an overlap of both
U(VI) coordination environments.
The phase identification with the PDXL-2 program of the XRD patterns of sample C and A
leached in 2.5 M NaCl/0.02 M NaHCO3 (Figure 7-8[a, b]) show, that U(VI) doped C-S-H
phases and portlandite are partly converted to CaCO3 whereby exclusively calcite was
detected.
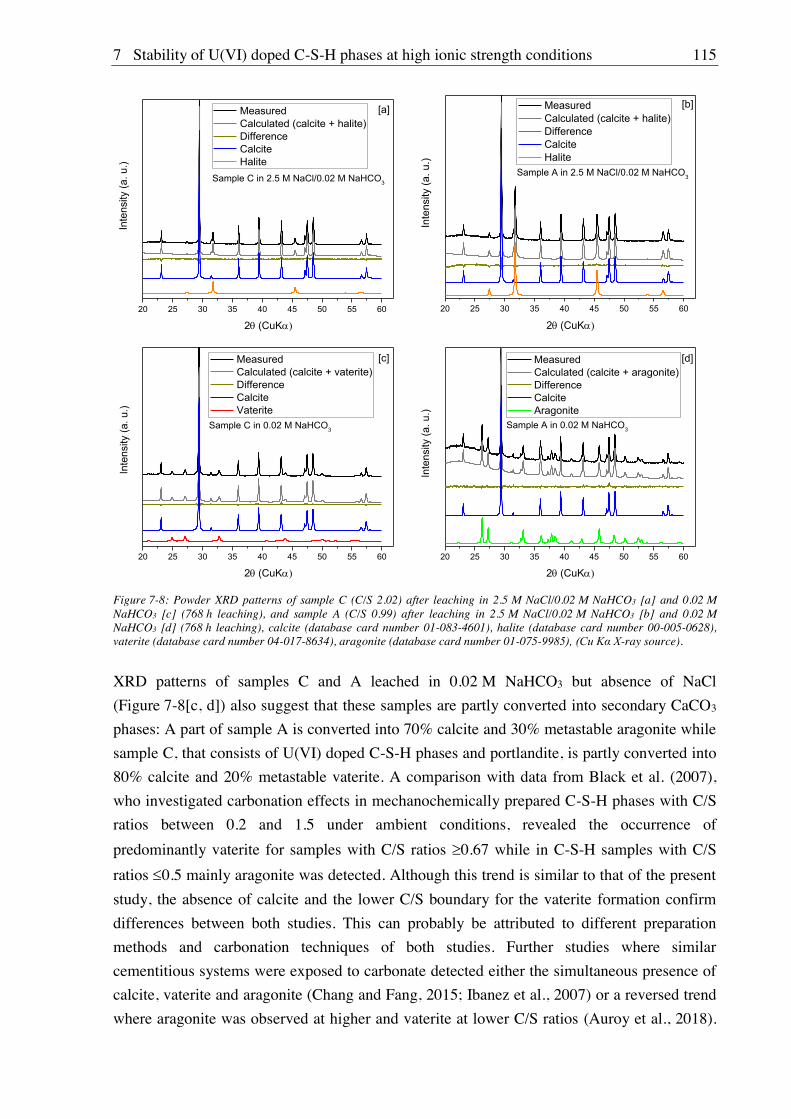
7 Stability of U(VI) doped C-S-H phases at high ionic strength conditions 115
20 25 30 35 40 45 50 55 60
Measured Calculated (calcite + halite) Difference Calcite Halite
Inte
nsity
(a. u
.)
2 (CuK
[a]
Sample C in 2.5 M NaCl/0.02 M NaHCO3
20 25 30 35 40 45 50 55 60
Measured Calculated (calcite + halite) Difference Calcite Halite
Inte
nsity
(a. u
.)
2 (CuK
[b]
Sample A in 2.5 M NaCl/0.02 M NaHCO3
20 25 30 35 40 45 50 55 60
Inte
nsity
(a. u
.)
2 (CuK
Measured Calculated (calcite + vaterite) Difference Calcite Vaterite
[c]
Sample C in 0.02 M NaHCO3
20 25 30 35 40 45 50 55 60
Inte
nsity
(a. u
.)
2 (CuK
Measured Calculated (calcite + aragonite) Difference Calcite Aragonite
[d]
Sample A in 0.02 M NaHCO3
Figure 7-8: Powder XRD patterns of sample C (C/S 2.02) after leaching in 2.5 M NaCl/0.02 M NaHCO3 [a] and 0.02 M NaHCO3 [c] (768 h leaching), and sample A (C/S 0.99) after leaching in 2.5 M NaCl/0.02 M NaHCO3 [b] and 0.02 M NaHCO3 [d] (768 h leaching), calcite (database card number 01-083-4601), halite (database card number 00-005-0628), vaterite (database card number 04-017-8634), aragonite (database card number 01-075-9985), (Cu K X-ray source).
XRD patterns of samples C and A leached in 0.02 M NaHCO3 but absence of NaCl
(Figure 7-8[c, d]) also suggest that these samples are partly converted into secondary CaCO3
phases: A part of sample A is converted into 70% calcite and 30% metastable aragonite while
sample C, that consists of U(VI) doped C-S-H phases and portlandite, is partly converted into
80% calcite and 20% metastable vaterite. A comparison with data from Black et al. (2007),
who investigated carbonation effects in mechanochemically prepared C-S-H phases with C/S
ratios between 0.2 and 1.5 under ambient conditions, revealed the occurrence of
predominantly vaterite for samples with C/S ratios 0.67 while in C-S-H samples with C/S
ratios 0.5 mainly aragonite was detected. Although this trend is similar to that of the present
study, the absence of calcite and the lower C/S boundary for the vaterite formation confirm
differences between both studies. This can probably be attributed to different preparation
methods and carbonation techniques of both studies. Further studies where similar
cementitious systems were exposed to carbonate detected either the simultaneous presence of
calcite, vaterite and aragonite (Chang and Fang, 2015; Ibanez et al., 2007) or a reversed trend
where aragonite was observed at higher and vaterite at lower C/S ratios (Auroy et al., 2018).
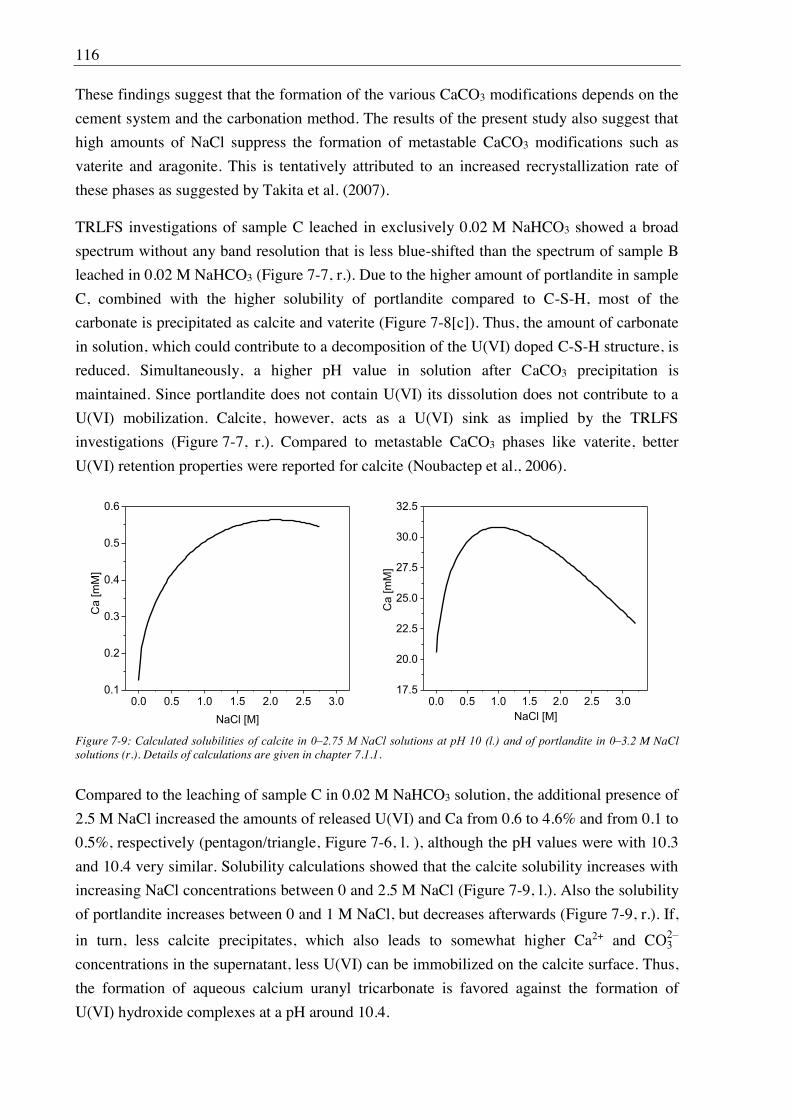
116
These findings suggest that the formation of the various CaCO3 modifications depends on the
cement system and the carbonation method. The results of the present study also suggest that
high amounts of NaCl suppress the formation of metastable CaCO3 modifications such as
vaterite and aragonite. This is tentatively attributed to an increased recrystallization rate of
these phases as suggested by Takita et al. (2007).
TRLFS investigations of sample C leached in exclusively 0.02 M NaHCO3 showed a broad
spectrum without any band resolution that is less blue-shifted than the spectrum of sample B
leached in 0.02 M NaHCO3 (Figure 7-7, r.). Due to the higher amount of portlandite in sample
C, combined with the higher solubility of portlandite compared to C-S-H, most of the
carbonate is precipitated as calcite and vaterite (Figure 7-8[c]). Thus, the amount of carbonate
in solution, which could contribute to a decomposition of the U(VI) doped C-S-H structure, is
reduced. Simultaneously, a higher pH value in solution after CaCO3 precipitation is
maintained. Since portlandite does not contain U(VI) its dissolution does not contribute to a
U(VI) mobilization. Calcite, however, acts as a U(VI) sink as implied by the TRLFS
investigations (Figure 7-7, r.). Compared to metastable CaCO3 phases like vaterite, better
U(VI) retention properties were reported for calcite (Noubactep et al., 2006).
0.0 0.5 1.0 1.5 2.0 2.5 3.00.1
0.2
0.3
0.4
0.5
0.6
Ca
[mM
]
NaCl [M]0.0 0.5 1.0 1.5 2.0 2.5 3.0
17.5
20.0
22.5
25.0
27.5
30.0
32.5
Ca
[mM
]
NaCl [M]
Figure 7-9: Calculated solubilities of calcite in 0 2.75 M NaCl solutions at pH 10 (l.) and of portlandite in 0 3.2 M NaCl solutions (r.). Details of calculations are given in chapter 7.1.1.
Compared to the leaching of sample C in 0.02 M NaHCO3 solution, the additional presence of
2.5 M NaCl increased the amounts of released U(VI) and Ca from 0.6 to 4.6% and from 0.1 to
0.5%, respectively (pentagon/triangle, Figure 7-6, l. ), although the pH values were with 10.3
and 10.4 very similar. Solubility calculations showed that the calcite solubility increases with
increasing NaCl concentrations between 0 and 2.5 M NaCl (Figure 7-9, l.). Also the solubility
of portlandite increases between 0 and 1 M NaCl, but decreases afterwards (Figure 7-9, r.). If,
in turn, less calcite precipitates, which also leads to somewhat higher Ca2+ and C
concentrations in the supernatant, less U(VI) can be immobilized on the calcite surface. Thus,
the formation of aqueous calcium uranyl tricarbonate is favored against the formation of
U(VI) hydroxide complexes at a pH around 10.4.
8 Stability of Cm(III) doped C-S-H phases at high ionic strength conditions 117
8. Stability of Cm(III) doped C-S-H phases at high ionic strength conditions
8.1. Experimental
For material, device and technique descriptions see chapter 7.1.1.
8.1.1. Direct synthesis of Cm(III) doped C-S-H phases
For the synthesis of Cm(III) doped C-S-H phases, 3.6 mL of a 4×10 6 M Cm(III) stock
solution and 1.4 mL of deionized water were added in 15 mL centrifuge tubes (polypropylene,
Greiner bio-one, Kremsmünster, Austria) to 120 mg of a mixture of carbonate-free CaO and
fumed silica, resulting in an initial Cm(III) concentration of 2.88×10 6 M. The ratios of CaO
and fumed silica were varied according to the targeted C/S ratios 1.0 and 2.0 (sample M and
N, Table 8-1). Immediately, the suspensions were homogenized and carbonate-free NaOH
was added to achieve a NaOH concentration of 0.294 M. After 14 d of shaking the samples
end-over-end, the phases of the suspensions were separated via centrifugation at 3,059×g for
1 h (EBA 280, Hettich Lab Technology, Tuttlingen, Germany). Then, the supernatant
solutions were analyzed for Cm(III) with LSC. The synthesized Cm(III) doped C-S-H
samples were stored as wet pastes.
8.1.2. Batch leaching of Cm(III) doped C-S-H phases
Wet pastes of Cm(III) doped samples were equilibrated in 0.02 M NaHCO3 or in 2.5 M
NaCl/0.02 M NaHCO3 at a S/L ratio of 10 g/L by shaking the samples end-over-end for 14 or
60 d. Then, the phases of the suspensions were separated by centrifugation at 3,059×g for 1 h.
Each supernatant solution was analyzed for Cm(III) concentration with LSC and final pH
values were determined. Leached C-S-H samples were stored as wet pastes for TRLFS
investigations. All leaching experiments were performed as duplicates.
8.2. Results and discussion
8.2.1. Composition of Cm(III) doped C-S-H phases
Table 8-1: Amount of Cm(III) incorporated into C-S-H phases in dependence on C/S ratios. * Determined with Eu(III) after centrifugation at 40,000×g.
Sample C/S Cm(III) [%] Cm(III) [ppm] Cm(III) [mol/kg] log(Rd) [log(L/kg)]
M 1.0 98.5 28.5 1.15×10 4 3.4/6.2*
N 2.0 97.1 28.1 1.13×10 4 3.1/6.2*
The exposure of CaO and fumed silica to the alkaline Cm(III) solution led to the formation of
C-S-H phases having C/S ratios of 1.0 and 2.0 and a Cm(III) uptake of 98.5 and 97.1% into
the solid C-S-H phases. This corresponds to log(Rd) values of 3.4 and 3.1 (Table 8-1).
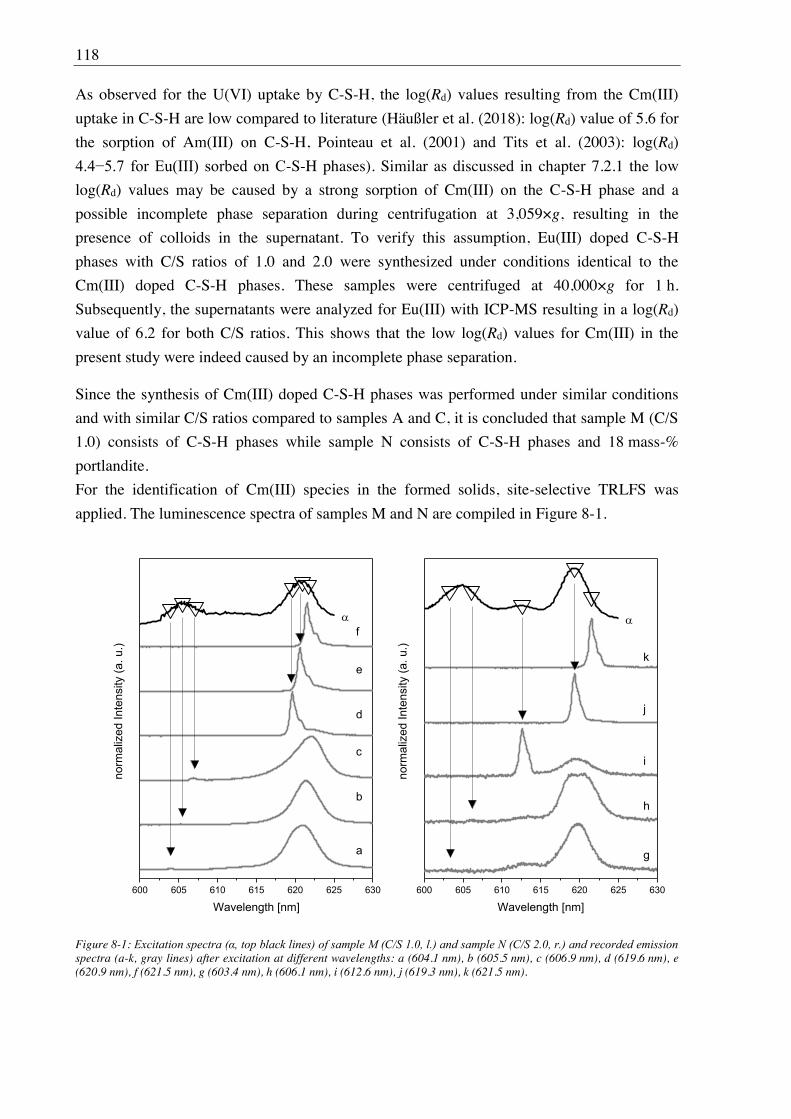
118
As observed for the U(VI) uptake by C-S-H, the log(Rd) values resulting from the Cm(III)
uptake in C-S-H are low compared to literature (Häußler et al. (2018): log(Rd) value of 5.6 for
the sorption of Am(III) on C-S-H, Pointeau et al. (2001) and Tits et al. (2003): log(Rd)
-S-H phases). Similar as discussed in chapter 7.2.1 the low
log(Rd) values may be caused by a strong sorption of Cm(III) on the C-S-H phase and a
possible incomplete phase separation during centrifugation at 3,059×g, resulting in the
presence of colloids in the supernatant. To verify this assumption, Eu(III) doped C-S-H
phases with C/S ratios of 1.0 and 2.0 were synthesized under conditions identical to the
Cm(III) doped C-S-H phases. These samples were centrifuged at 40,000×g for 1 h.
Subsequently, the supernatants were analyzed for Eu(III) with ICP-MS resulting in a log(Rd)
value of 6.2 for both C/S ratios. This shows that the low log(Rd) values for Cm(III) in the
present study were indeed caused by an incomplete phase separation.
Since the synthesis of Cm(III) doped C-S-H phases was performed under similar conditions
and with similar C/S ratios compared to samples A and C, it is concluded that sample M (C/S
1.0) consists of C-S-H phases while sample N consists of C-S-H phases and 18 mass-%
portlandite.
For the identification of Cm(III) species in the formed solids, site-selective TRLFS was
applied. The luminescence spectra of samples M and N are compiled in Figure 8-1.
600 605 610 615 620 625 630
norm
aliz
ed In
tens
ity (a
. u.)
Wavelength [nm]
a
b
c
d
e
f
600 605 610 615 620 625 630
norm
aliz
ed In
tens
ity (a
. u.)
Wavelength [nm]
g
h
i
j
k
Figure 8-1: Excitation spectra ( , top black lines) of sample M (C/S 1.0, l.) and sample N (C/S 2.0, r.) and recorded emission spectra (a-k, gray lines) after excitation at different wavelengths: a (604.1 nm), b (605.5 nm), c (606.9 nm), d (619.6 nm), e (620.9 nm), f (621.5 nm), g (603.4 nm), h (606.1 nm), i (612.6 nm), j (619.3 nm), k (621.5 nm).
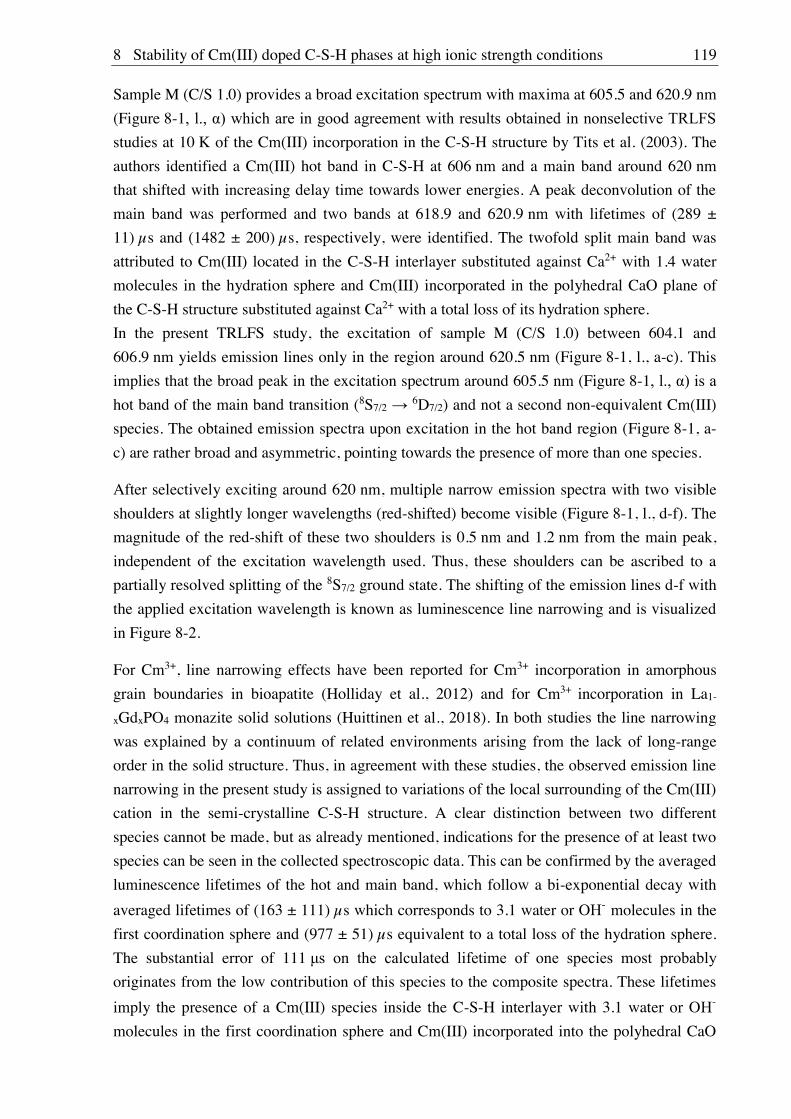
8 Stability of Cm(III) doped C-S-H phases at high ionic strength conditions 119
Sample M (C/S 1.0) provides a broad excitation spectrum with maxima at 605.5 and 620.9 nm
(Figure 8-1
studies at 10 K of the Cm(III) incorporation in the C-S-H structure by Tits et al. (2003). The
authors identified a Cm(III) hot band in C-S-H at 606 nm and a main band around 620 nm
that shifted with increasing delay time towards lower energies. A peak deconvolution of the
main band was performed and two bands at 618.9 and 620.9 nm with lifetimes of (289 ±
11) s and (1482 ± 200) s, respectively, were identified. The twofold split main band was
attributed to Cm(III) located in the C-S-H interlayer substituted against Ca2+ with 1.4 water
molecules in the hydration sphere and Cm(III) incorporated in the polyhedral CaO plane of
the C-S-H structure substituted against Ca2+ with a total loss of its hydration sphere.
In the present TRLFS study, the excitation of sample M (C/S 1.0) between 604.1 and
606.9 nm yields emission lines only in the region around 620.5 nm (Figure 8-1, l., a-c). This
implies that the broad peak in the excitation spectrum around 605.5 nm (Figure 8-1
hot band of the main band transition (8S7/2 6D7/2) and not a second non-equivalent Cm(III)
species. The obtained emission spectra upon excitation in the hot band region (Figure 8-1, a-
c) are rather broad and asymmetric, pointing towards the presence of more than one species.
After selectively exciting around 620 nm, multiple narrow emission spectra with two visible
shoulders at slightly longer wavelengths (red-shifted) become visible (Figure 8-1, l., d-f). The
magnitude of the red-shift of these two shoulders is 0.5 nm and 1.2 nm from the main peak,
independent of the excitation wavelength used. Thus, these shoulders can be ascribed to a
partially resolved splitting of the 8S7/2 ground state. The shifting of the emission lines d-f with
the applied excitation wavelength is known as luminescence line narrowing and is visualized
in Figure 8-2.
For Cm3+, line narrowing effects have been reported for Cm3+ incorporation in amorphous
grain boundaries in bioapatite (Holliday et al., 2012) and for Cm3+ incorporation in La1-
xGdxPO4 monazite solid solutions (Huittinen et al., 2018). In both studies the line narrowing
was explained by a continuum of related environments arising from the lack of long-range
order in the solid structure. Thus, in agreement with these studies, the observed emission line
narrowing in the present study is assigned to variations of the local surrounding of the Cm(III)
cation in the semi-crystalline C-S-H structure. A clear distinction between two different
species cannot be made, but as already mentioned, indications for the presence of at least two
species can be seen in the collected spectroscopic data. This can be confirmed by the averaged
luminescence lifetimes of the hot and main band, which follow a bi-exponential decay with
averaged lifetimes of (163 ± 111) s which corresponds to 3.1 water or O - molecules in the
first coordination sphere and (977 ± 51) s equivalent to a total loss of the hydration sphere.
The substantial error of 111
originates from the low contribution of this species to the composite spectra. These lifetimes
imply the presence of a Cm(III) species inside the C-S-H interlayer with 3.1 water or O -
molecules in the first coordination sphere and Cm(III) incorporated into the polyhedral CaO
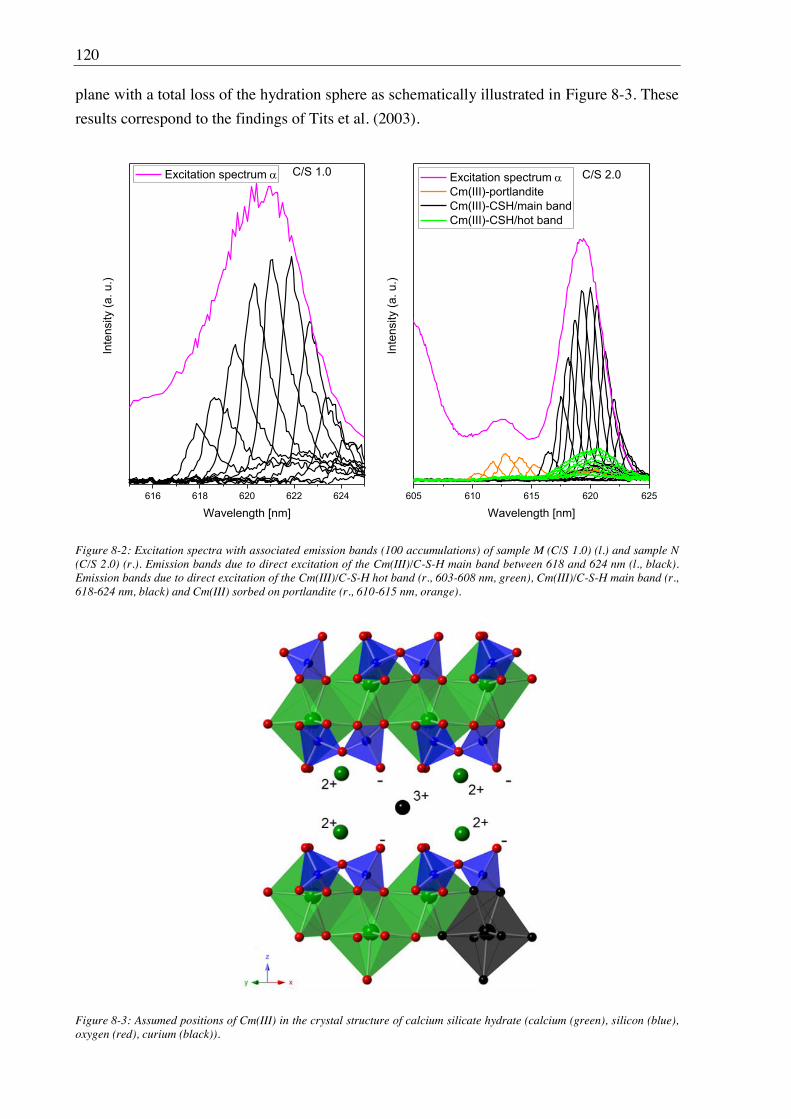
120
plane with a total loss of the hydration sphere as schematically illustrated in Figure 8-3. These
results correspond to the findings of Tits et al. (2003).
616 618 620 622 624
Inte
nsity
(a. u
.)
Wavelength [nm]
Excitation spectrum C/S 1.0
605 610 615 620 625
Excitation spectrum Cm(III)-portlandite Cm(III)-CSH/main band Cm(III)-CSH/hot band
Inte
nsity
(a. u
.)
Wavelength [nm]
C/S 2.0
Figure 8-2: Excitation spectra with associated emission bands (100 accumulations) of sample M (C/S 1.0) (l.) and sample N (C/S 2.0) (r.). Emission bands due to direct excitation of the Cm(III)/C-S-H main band between 618 and 624 nm (l., black). Emission bands due to direct excitation of the Cm(III)/C-S-H hot band (r., 603-608 nm, green), Cm(III)/C-S-H main band (r., 618-624 nm, black) and Cm(III) sorbed on portlandite (r., 610-615 nm, orange).
Figure 8-3: Assumed positions of Cm(III) in the crystal structure of calcium silicate hydrate (calcium (green), silicon (blue), oxygen (red), curium (black)).
8 Stability of Cm(III) doped C-S-H phases at high ionic strength conditions 121
The site-selective luminescence study of sample N (C/S 2.0) shows a similar excitation
spectrum as recorded for sample M with the lower C/S ratio (Figure 8-1, r.). However, in
addition to the hot band signal around 604.5 nm and the corresponding main band for Cm(III)
associated with the C-S-H structure (~619 nm), a weak signal around 613 nm can be
discerned in the excitation spectrum, which was not observed in sample M (C/S 1.0).
Excitation at this peak maximum (612.6 nm) yields an emission signal with a shoulder on the
red side (~613.5 nm) (Figure 8-1, r., i) and a lifetime of (155 ± 15) s which corresponds to
3.3 water molecules in the Cm(III) coordination sphere. Please note that these emission lines
are strongly red-shifted compared to emission lines of the Cm3+ aquo ion (593.8 nm) and the
Cm(III) hydroxo complexes (Cm(OH)2+ 598.7 nm (Moulin et al., 1992), Cm(OH)2+ 603.5 nm
(Fanghänel et al., 1994), and Cm(OH)3(aq) 607.1 nm (Tits et al., 2003)) suggesting the
formation of a Cm(III)/OH inner-sphere complex. As previously shown by XRD (Figure 7-1,
l.) and TGA (Figure 7-2, l.) investigations, sample C (C/S 2.0) contains around 18 mass-%
portlandite in addition to the C-S-H phase. Thus, the additional peak observed for sample N is
assumed to arise from Cm(III) association with portlandite. TRLFS investigations of Cm(III)
sorbed on HCP/portlandite by Stumpf et al. (2004) showed the formation of an inner-sphere
Cm(III)/portlandite complex with an emission spectrum at 613.6 nm and a lifetime of
(66 ± 1) s which corresponds to 9 O - molecules in the first coordination sphere. The peak
position corresponds well with that observed in the present study even though the lifetimes
are different. This may be due to the different experimental conditions employed in the two
studies (here site-selective excitation of Cm(III) in a mixture of dried C-S-H and portlandite at
10 K in comparison to Cm(III) exposed to a portlandite suspension for 30 d excited with
395 nm at room temperature by Stumpf et al. (2004)). Thus, it is assumed that the amount of
H2O and OH in portlandite was higher in the study of Stumpf et al., which explains the
longer lifetimes observed in the present study. Nonetheless, in agreement with the study by
Stumpf et al. (2004) the signal at ~613 nm is assigned to a Cm(III) inner-sphere complex
incorporated in the formed portlandite phase.
As already indicated for sample M (C/S 1.0), the emission spectra of sample N obtained after
selective excitation in the hot band region, espe ex = 606.1 nm (Figure 8-1, r., h),
shows a very asymmetric emission peak with two clear maxima, corroborating the presence of
two non-equivalent Cm(III) species in the C-S-H structure. Furthermore, the lifetime decay
analyses after excitation of the C-S-H hot- and main bands of this sample show a bi-
exponential decay behavior with averaged lifetimes of (214 ± 28) s and (928 ± 109) s,
corresponding to Cm(III) species with 2 and 0 water molecules, respectively, in the first
coordination sphere of the actinide cation.
122
8.2.2. Leaching of Cm(III) doped C-S-H phases
8.2.2.1. Leaching in 0.02 M NaHCO3 and 2.5 M NaCl/0.02 M NaHCO3
The exposure of sample M (C/S 1.0) to solutions that contain either 0.02 M NaHCO3 or 2.5 M
NaCl/0.02 M NaHCO3 over a time period of 14 or 60 d led to a negligible Cm(III)
mobilization between 0.01 and 0.5% of the previously incorporated Cm(III) (Table 8-2).
Comparable leaching experiments performed with U(VI) doped C-S-H samples A-C showed a
much higher U(VI) release (up to 40%) which was attributed to the formation of
Ca2UO2(CO3)3 in solution at pH values 10.4. Since samples A-C were leached at lower S/L
r g/L) compared to samples M and N (10 g/L) the pH of the leaching solutions
for sample M was higher (cf. Table 7-5 and Table 8-2). Thus, the formation of Cm(III)
hydroxide complexes is favored against Cm(III) carbonate complexes. Furthermore, Cm(III)
carbonate complexation studies performed in solutions containing 0 to 6 M NaCl by
Fanghänel et al. (1999) indicated the presence of Cm(CO3)n complexes at pH < 10 and
10 4 M. A comparison of the stability constants at infinite dilution
(log 0) reveals lower stability constants for Cm(CO3)n (log 0101 = 8.1 ± 0.3, log 0
102 =
13.0 ± 0.6, log 0103 = 15.2 ± 0.4, and log 0
104 = 13.0 ± 0.5 (Fanghänel et al., 1999))
compared to Ca2UO2(CO3)3(aq) (log 0213 = 30.45 ± 0.35 (Bernhard et al., 2001)). Therefore,
comparable NaHCO3 concentrations should lead to a stronger complexation of U(VI) by
carbonate compared to Cm(III). Furthermore, differences in the S/L ratio and a higher pH
after leaching contribute to the lower Cm(III) release compared to U(VI).
Table 8-2: Amount of Cm(III) leached from sample M (C/S 1.0) and final pH values of 0.02 M NaHCO3 or 2.5 M NaCl/0.02 M NaHCO3 leaching solutions.
Conditions Cm(III) leached [M] Cm(III) leached [%] pH
NaHCO3, 14 d 3.8×10 10 0.014 10.9 ± 0.2
NaHCO3, 60 d 2.4×10 9 0.086 10.9 ± 0.1
NaCl/NaHCO3, 14 d 2.2×10 10 0.008 10.6 ± 0.3
NaCl/NaHCO3, 60 d 1.4×10 8 0.498 10.7 ± 0.3
To investigate the influence of the portlandite phase on the stability of the Cm(III) doped C-S-
H system, sample N (C/S 2.0) was leached in either 0.02 M NaHCO3 or 2.5 M NaCl/0.02 M
NaHCO3. Comparable to sample M, the leaching of sample N leads only to a very low
Cm(III) release between 0.05 and 0.7% of the previously incorporated Cm(III) (Table 8-3).
To identify factors such as secondary phase formation that might be responsible for the low
Cm(III) releases, site-selective TRLFS spectra of samples M and N were recorded and
discussed in comparison to the XRD patterns of samples A (C/S 1.0) and C (C/S 2.0) after
leaching in 0.02 M NaHCO3 or 2.5 M NaCl/0.02 M NaHCO3 (Figure 7-8[a-d]).
8 Stability of Cm(III) doped C-S-H phases at high ionic strength conditions 123
Table 8-3: Amount of Cm(III) leached from sample N (C/S 2.0) and final pH values of 0.02 M NaHCO3 or 2.5 M NaCl/0.02 M NaHCO3 leaching solutions.
Conditions Cm(III) leached [M] Cm(III) leached [%] pH
NaHCO3, 14 d 1.2×10 9 0.045 12.1 ± 0.01
NaHCO3, 60 d 2.0×10 9 0.075 12.2 ± 0.01
NaCl/NaHCO3, 14 d 4.6×10 9 0.170 12.0 ± 0.01
NaCl/NaHCO3, 60 d 2.0×10 8 0.737 12.1 ± 0.01
The results of the XRD study revealed that a part of the C-S-H phase with a C/S ratio of 1.0 is
converted into secondary CaCO3 phases such as calcite (70%) and aragonite (30%) while the
C-S-H phase with a C/S ratio of 2.0 is partly converted into an average of 80% calcite and
20% vaterite after leaching in 0.02 M NaHCO3 (Figure 7-8[c, d]). The additional presence of
2.5 M NaCl led to the exclusive formation of calcite, independent of the C/S ratio
(Figure 7-8[a, b]). At a S/L ratio of 10 g/L, a 0.02 M NaHCO3 solution could convert a
maximum of 23 mol-% of sample M and 18 mol-% of sample N into CaCO3.
Despite the clear transformation of a part of the C-S-H structure into secondary phases, the
very low Cm(III) release from C-S-H phases points towards either incongruent leaching of the
samples, where Cm(III) remains in the C-S-H structure, or a Cm(III)-re-immobilization into
the formed secondary CaCO3 phases. To trace the association of Cm(III) in the solid mixtures,
site-selective TRLFS analyses of the solids after leaching were performed.
The excitation spectrum of sample M (C/S 1.0) leached in 0.02 M NaHCO3 for 14 d shows a
new broad peak between 607.7 and 612.8 nm (Figure 8-4
Cm(III)/C-S-H hot and main bands at 606 and 620 nm, respectively (Figure 8-4
After selective excitation in the region where the new Cm(III) species is detected, threefold
split emission spectra (Figure 8-4, l., b, c) with lifetimes of (734 ± 55) s are obtained which
corresponds to a total loss of the hydration sphere. In order to assign the new Cm(III) species,
the obtained data in terms of emission peak position and lifetime are compared to published
data for Cm(III) association with the CaCO3 polymorphs calcite, vaterite and aragonite
(Table 8-4). Marques Fernandes et al. (2008) investigated the association of Cm(III) with
calcite at a pH value of 12.5. At these solution conditions, the authors found a Cm(OH)2+
species incorporated within the calcite structure with an emission band at 608.2 nm and a
lifetime of (477 ± 25) s. Other calcite species were reported with emission peak maxima at
606.2 nm and 620.3 nm (Marques Fernandes et al., 2008).
124
600 605 610 615 620 625 630
14 d
norm
aliz
ed In
tens
ity (a
. u.)
Wavelength [nm]
a
b
c
d
C/S 1.0 after leaching in 0.02 M NaHCO3
600 605 610 615 620 625 630
14 d
norm
aliz
ed In
tens
ity (a
. u.)
Wavelength [nm]
60 d
e
f
g
h
C/S 1.0 after leaching in 2.5 M NaCl/0.02 M NaHCO3
Figure 8-4: TRLFS spectra of sample M (C/S 1.0) after leaching in 0.02 M NaHCO3 (l.) for 14 d and in 2.5 M NaCl/0.02 M NaHCO3 (r.) for 14 d (gray lines) and 60 d (blue lines). - : Excitation spectra after 14 d (black lines); - : Excitation spectra after 60 d (blue lines); , : Integrated over the complete emission spectrum; , : Integrated over the C-S-H main band (~615-625 nm); , : Integrated between the C-S-H hot and main band (~605-615 nm). Recorded emission spectra after excitation at different wavelengths: a (605.2 nm), b (609.2 nm), c (612.2 nm), d (621.4 nm), e (605.2 nm), f (608.0 nm), g (612.8 nm), h (621.4 nm).
These peak positions overlap with the hot and main band transitions of the Cm(III)/C-S-H
species in the present study and thus, no assignment to Cm(III)/calcite species in this emission
wavelength range can be made. Cm(III) incorporated in aragonite was found by Schmidt et al.
(2009) to result in a main band transition at 612.7 nm, a corresponding hot band transition at
607.5 nm and a lifetime of (637 ± 77) s (Table 8-4). Even though the signal obtained in the
present study for the presumed Cm(III)/CaCO3 species is very broad, the two local maxima at
607.7 nm and 612.8 nm can be distinguished in the excitation spectrum integrated between
605 and 615 nm (Figure 8-4, l.,
the formed aragonite phase as a result of the C-S-H phase conversion. However, the broad
nature of the excitation peak recorded in the present study implies that other
sorption/incorporation processes may contribute to the Cm(III) speciation after leaching in
0.02 M NaHCO3 solutions which cannot be conclusively assigned based on the recorded
luminescence data.
Excitation spectra of sample M (C/S 1.0) leached for 14 and 60 d in 2.5 M NaCl/0.02 M
NaHCO3 are presented in Figure 8-4, r., as black - -
Although XRD confirmed the exclusive presence of calcite, TRLFS shows multiple low-
intensity emission lines between 608.0 and 612.8 nm (Figure 8-4, r., f, g, gray lines).
8 Stability of Cm(III) doped C-S-H phases at high ionic strength conditions 125
Table 8-4: Band positions and lifetimes of Cm(III) species in system relevant phases.
Cm(III) species Band position
[nm]
(Marques Fernandes et al., 2008)
606.2 386 ± 40 (298 K)
CmOH2+ incorporated in calcite, pH 12.5 (Marques
Fernandes et al., 2008)
608.2 477 ± 25 (298 K)
(Marques
Fernandes et al., 2008)
620.3 1874 ± 200 (298 K)
Cm(III) incorporated in vaterite (Schmidt et al.,
2010)
612.1 1802 ± 216 (< 20 K)
619.1 2569 ± 308 (< 20 K)
Cm(III) incorporated in aragonite (Schmidt et al.,
2009)
607.5 637 ± 77 (< 20 K)
612.7 637 ± 77 (< 20 K)
Cm(III) incorporated in portlandite (Ca(OH)2)
(Stumpf et al., 2004)
613.6 62 ± 8 (298 K)
Cm(III) in C-S-H interlayer (Tits et al., 2003) 618.9 289 ± 11 (10 K)
Cm(III) in C-S-H polyhedral CaO plane (Tits et al.,
2003)
620.9 1482 ± 200 (10 K)
After excitation at 612.8 nm, a splitting of the emission line in four separated peaks is
observed (Figure 8-4, r., g, gray line). This fourfold splitting was also observed by Schmidt et
al. (2009) after excitation of Cm(III)-containing aragonite at 612.7 nm caused by a fourfold
ground state splitting of the 8S7/2 state. The decreased intensity of these emission lines after
60 d of leaching in 2.5 M NaCl/0.02 M NaHCO3 (Figure 8-4, r., f, g, blue lines) at 608.0 and
612.8 nm indicates that these emission lines are caused by Cm(III) incorporation into
aragonite that is probably present in amounts below the XRD detection limit. The aragonite
phase is converted into calcite over time due to its metastable nature, thus, causing the
decrease of the Cm(III)/aragonite emission lines. However as discussed above, due to the
overlap of the signals of Cm(III) incorporated in calcite with those of Cm(III) in C-S-H, this
species cannot be detected in the current system.
In contrast to the leached sample M (C/S 1.0), sample N (C/S 2.0) leached in 0.02 M NaHCO3
shows no emission line between 608 and 609 nm (Figure 8-5, l., b), but a weak emission line
around 612.0 nm (Figure 8-5, l., c). This emission line differs from the emission lines of
Cm(III) incorporated into aragonite, observed for sample M (C/S 1.0) after leaching in 0.02 M
NaHCO3 (cf. Figure 8-4, b).
126
600 605 610 615 620 625 630
norm
aliz
ed In
tens
ity (a
. u.)
Wavelength [nm]
14 d
a
b
c
d
e
C/S 2.0 after leaching in 0.02 M NaHCO3
600 605 610 615 620 625 630
norm
aliz
ed In
tens
ity (a
. u.)
Wavelength [nm]
60 d
14 d
f
g
h
i
C/S 2.0 after leaching in 2.5 M NaCl/0.02 M NaHCO3
Figure 8-5: TRLFS spectra of sample N (C/S 2.0) after leaching in 0.02 M NaHCO3 (l.) for 14 d and in 2.5 M NaCl/0.02 M NaHCO3 (r.) for 14 d (gray lines) and 60 d (blue lines). - : Excitation spectra after 14 d (black lines); - : Excitation spectra after 60 d (blue lines); , : Integrated over the complete emission spectrum; , : Integrated over the C-S-H main band (~615-625 nm); , : Integrated between the C-S-H hot and main band (~605-615 nm). Recorded emission spectra after excitation at different wavelengths: a (605.4 nm), b (609.2 nm), c (612.0 nm), d (620.2 nm), e (621.4 nm), f (605.4 nm), g (612.8 nm), h (620.0 nm), i (621.4 nm).
The new emission line at 612.0 nm is either caused by Cm(III) that is still incorporated into
portlandite (612.6 and 613.5 s) or Cm(III) incorporated into the secondary phase
vaterite (612.1 s (Schmidt et al., 2010)). Since the intensity of the emission line
at 612.0 nm (Figure 8-5, l., c) is near the noise level after 5,000 accumulations, a lifetime
analysis with the applied 100 accumulations was not feasible. Since Cm(III) incorporated into
vaterite would possess a very long lifetime of 1,802 s as observed by Schmidt et al. (2010),
it is concluded that the band at 612.0 nm (Figure 8-5, l., c) is caused by Cm(III) remaining in
portlandite. The excitation and emission spectra of sample N (C/S 2.0), recorded after 14 and
60 d of leaching in 2.5 M NaCl/0.02 M NaHCO3, are shown in Figure 8-5 (r.). The presence
of the emission line around 612.8 nm (Figure 8-5, r., g, gray line) that also possesses a low
intensity and a rather short lifetime ( : (312 ± 39) s) indicates that this band is caused by
Cm(III) incorporated in portlandite instead in metastable vaterite. Furthermore, the
persistence of this emission line after 60 d of leaching (Figure 8-5, r., g, blue line) underlines
this assumption.
Combined results of TRLFS and XRD investigations suggest that the majority of Cm(III)
remains in the C-S-H and portlandite phases after leaching in saline carbonate-containing
solutions. A minor incorporation or sorption of Cm(III) in calcite can neither be excluded nor
verified due to the main band overlap of the Cm(III)/calcite and Cm(III)/C-S-H system.
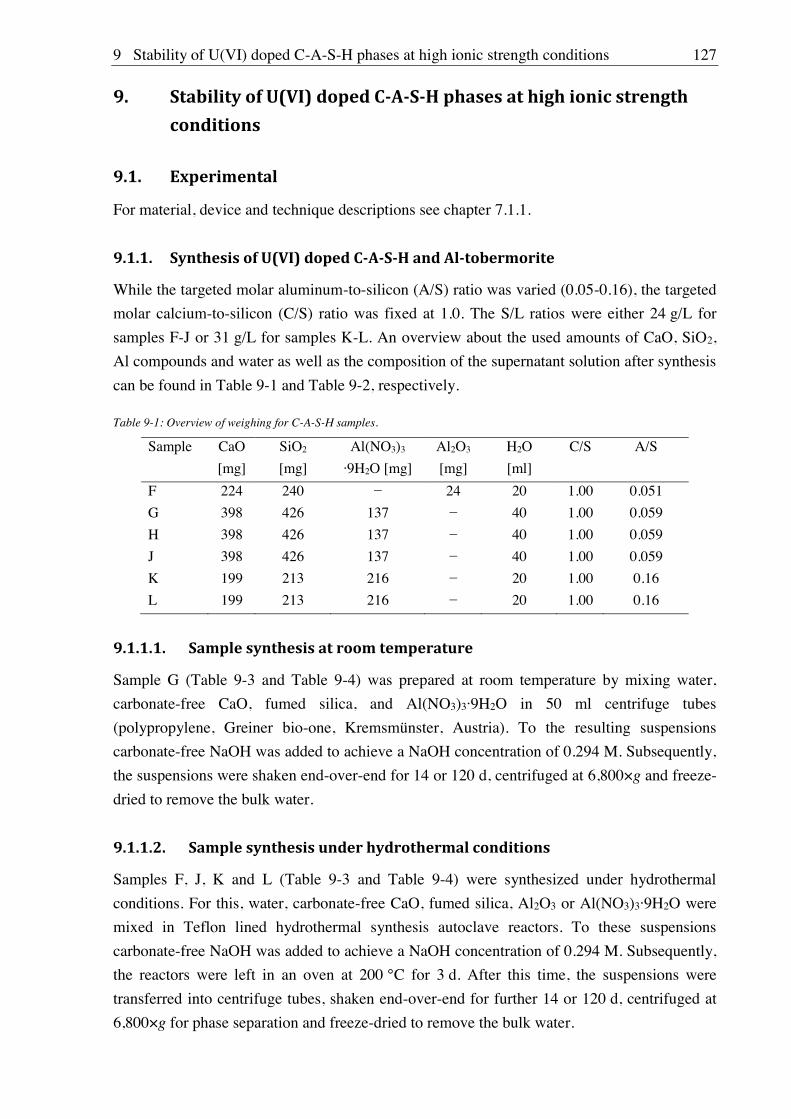
9 Stability of U(VI) doped C-A-S-H phases at high ionic strength conditions 127
9. Stability of U(VI) doped C-A-S-H phases at high ionic strength conditions
9.1. Experimental
For material, device and technique descriptions see chapter 7.1.1.
9.1.1. Synthesis of U(VI) doped C-A-S-H and Al-tobermorite
While the targeted molar aluminum-to-silicon (A/S) ratio was varied (0.05-0.16), the targeted
molar calcium-to-silicon (C/S) ratio was fixed at 1.0. The S/L ratios were either 24 g/L for
samples F-J or 31 g/L for samples K-L. An overview about the used amounts of CaO, SiO2,
Al compounds and water as well as the composition of the supernatant solution after synthesis
can be found in Table 9-1 and Table 9-2, respectively.
Table 9-1: Overview of weighing for C-A-S-H samples.
Sample CaO
[mg]
SiO2
[mg]
Al(NO3)3
9H2O [mg]
Al2O3
[mg]
H2O
[ml]
C/S A/S
F 224 240 24 20 1.00 0.051
G 398 426 137 40 1.00 0.059
H 398 426 137 40 1.00 0.059
J 398 426 137 40 1.00 0.059
K 199 213 216 20 1.00 0.16
L 199 213 216 20 1.00 0.16
9.1.1.1. Sample synthesis at room temperature
Sample G (Table 9-3 and Table 9-4) was prepared at room temperature by mixing water,
carbonate-free CaO, fumed silica, and Al(NO3)3 9H2O in 50 ml centrifuge tubes
(polypropylene, Greiner bio-one, Kremsmünster, Austria). To the resulting suspensions
carbonate-free NaOH was added to achieve a NaOH concentration of 0.294 M. Subsequently,
the suspensions were shaken end-over-end for 14 or 120 d, centrifuged at 6,800×g and freeze-
dried to remove the bulk water.
9.1.1.2. Sample synthesis under hydrothermal conditions
Samples F, J, K and L (Table 9-3 and Table 9-4) were synthesized under hydrothermal
conditions. For this, water, carbonate-free CaO, fumed silica, Al2O3 or Al(NO3)3 9H2O were
mixed in Teflon lined hydrothermal synthesis autoclave reactors. To these suspensions
carbonate-free NaOH was added to achieve a NaOH concentration of 0.294 M. Subsequently,
the reactors were left in an oven at 200 °C for 3 d. After this time, the suspensions were
transferred into centrifuge tubes, shaken end-over-end for further 14 or 120 d, centrifuged at
6,800×g for phase separation and freeze-dried to remove the bulk water.
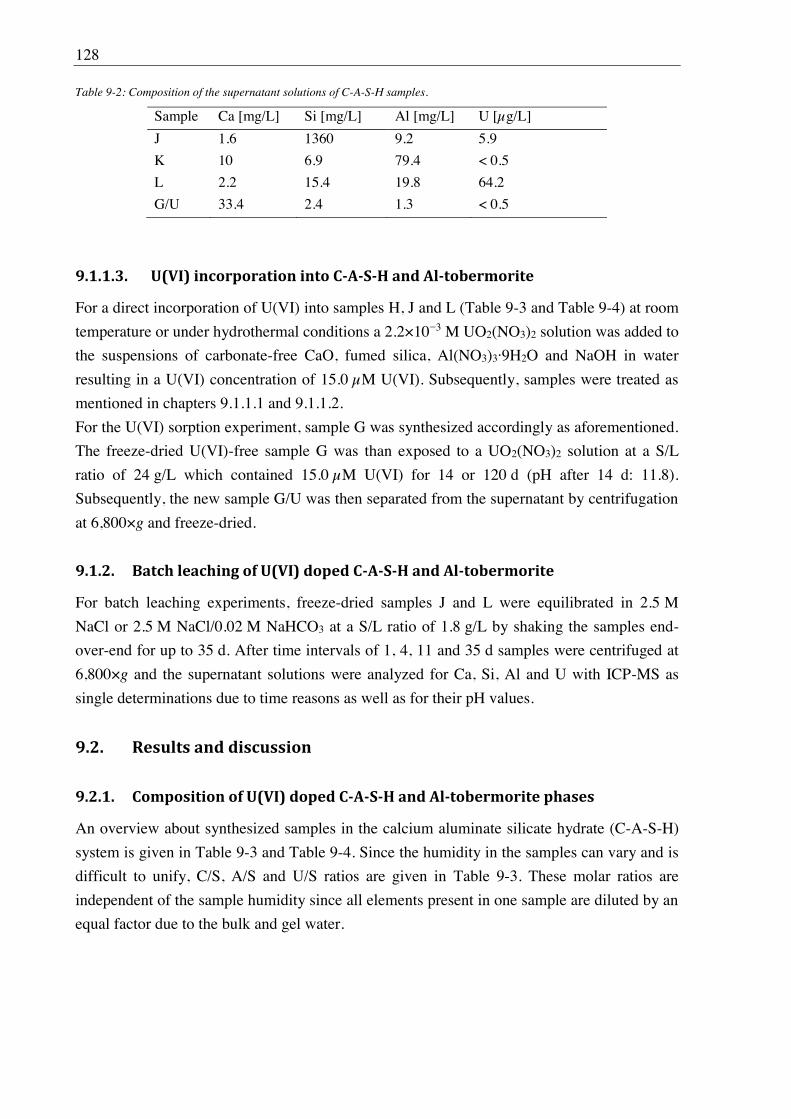
128
Table 9-2: Composition of the supernatant solutions of C-A-S-H samples.
Sample Ca [mg/L] Si [mg/L] Al [mg/L] U [ g/L]
J 1.6 1360 9.2 5.9
K 10 6.9 79.4 < 0.5
L 2.2 15.4 19.8 64.2
G/U 33.4 2.4 1.3 < 0.5
9.1.1.3. U(VI) incorporation into C-A-S-H and Al-tobermorite
For a direct incorporation of U(VI) into samples H, J and L (Table 9-3 and Table 9-4) at room
temperature or under hydrothermal conditions a 2.2×10 3 M UO2(NO3)2 solution was added to
the suspensions of carbonate-free CaO, fumed silica, Al(NO3)3 9H2O and NaOH in water
resulting in a U(VI) concentration of 15.0 M U(VI). Subsequently, samples were treated as
mentioned in chapters 9.1.1.1 and 9.1.1.2.
For the U(VI) sorption experiment, sample G was synthesized accordingly as aforementioned.
The freeze-dried U(VI)-free sample G was than exposed to a UO2(NO3)2 solution at a S/L
ratio of 24 g/L which contained 15.0 M U(VI) for 14 or 120 d (pH after 14 d: 11.8).
Subsequently, the new sample G/U was then separated from the supernatant by centrifugation
at 6,800×g and freeze-dried.
9.1.2. Batch leaching of U(VI) doped C-A-S-H and Al-tobermorite
For batch leaching experiments, freeze-dried samples J and L were equilibrated in 2.5 M
NaCl or 2.5 M NaCl/0.02 M NaHCO3 at a S/L ratio of 1.8 g/L by shaking the samples end-
over-end for up to 35 d. After time intervals of 1, 4, 11 and 35 d samples were centrifuged at
6,800×g and the supernatant solutions were analyzed for Ca, Si, Al and U with ICP-MS as
single determinations due to time reasons as well as for their pH values.
9.2. Results and discussion
9.2.1. Composition of U(VI) doped C-A-S-H and Al-tobermorite phases
An overview about synthesized samples in the calcium aluminate silicate hydrate (C-A-S-H)
system is given in Table 9-3 and Table 9-4. Since the humidity in the samples can vary and is
difficult to unify, C/S, A/S and U/S ratios are given in Table 9-3. These molar ratios are
independent of the sample humidity since all elements present in one sample are diluted by an
equal factor due to the bulk and gel water.
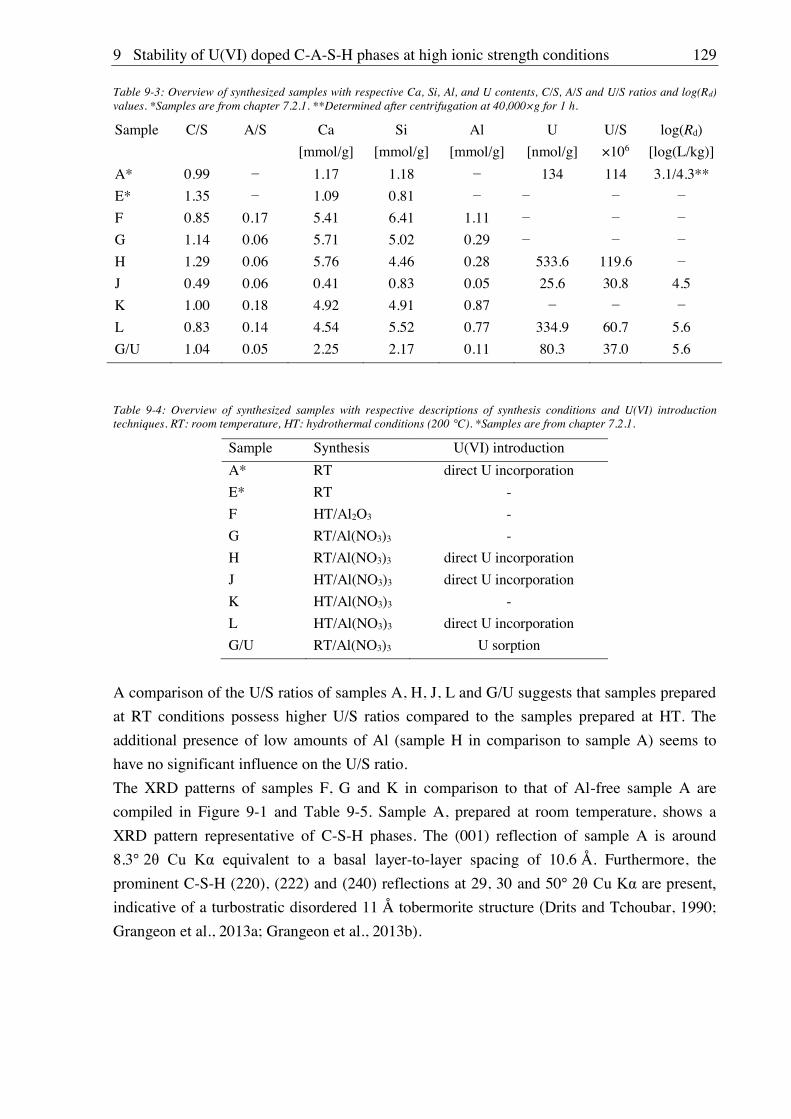
9 Stability of U(VI) doped C-A-S-H phases at high ionic strength conditions 129
Table 9-3: Overview of synthesized samples with respective Ca, Si, Al, and U contents, C/S, A/S and U/S ratios and log(Rd) values. *Samples are from chapter 7.2.1. **Determined after centrifugation at 40,000×g for 1 h.
Sample C/S A/S Ca
[mmol/g]
Si
[mmol/g]
Al
[mmol/g]
U
[nmol/g]
U/S
×106
log(Rd)
[log(L/kg)]
A* 0.99 1.17 1.18 134 114 3.1/4.3**
E* 1.35 1.09 0.81
F 0.85 0.17 5.41 6.41 1.11
G 1.14 0.06 5.71 5.02 0.29
H 1.29 0.06 5.76 4.46 0.28 533.6 119.6
J 0.49 0.06 0.41 0.83 0.05 25.6 30.8 4.5
K 1.00 0.18 4.92 4.91 0.87
L 0.83 0.14 4.54 5.52 0.77 334.9 60.7 5.6
G/U 1.04 0.05 2.25 2.17 0.11 80.3 37.0 5.6
Table 9-4: Overview of synthesized samples with respective descriptions of synthesis conditions and U(VI) introduction techniques. RT: room temperature, HT: hydrothermal conditions (200 °C). *Samples are from chapter 7.2.1.
Sample Synthesis U(VI) introduction
A* RT direct U incorporation
E* RT -
F HT/Al2O3 -
G RT/Al(NO3)3 -
H RT/Al(NO3)3 direct U incorporation
J HT/Al(NO3)3 direct U incorporation
K HT/Al(NO3)3 -
L HT/Al(NO3)3 direct U incorporation
G/U RT/Al(NO3)3 U sorption
A comparison of the U/S ratios of samples A, H, J, L and G/U suggests that samples prepared
at RT conditions possess higher U/S ratios compared to the samples prepared at HT. The
additional presence of low amounts of Al (sample H in comparison to sample A) seems to
have no significant influence on the U/S ratio.
The XRD patterns of samples F, G and K in comparison to that of Al-free sample A are
compiled in Figure 9-1 and Table 9-5. Sample A, prepared at room temperature, shows a
XRD pattern representative of C-S-H phases. The (001) reflection of sample A is around
8.3° -to-layer spacing of 10.6 Å. Furthermore, the
prominent C-S-H (220), (222) and (240) reflections at 29, 30 and 50°
indicative of a turbostratic disordered 11 Å tobermorite structure (Drits and Tchoubar, 1990;
Grangeon et al., 2013a; Grangeon et al., 2013b).
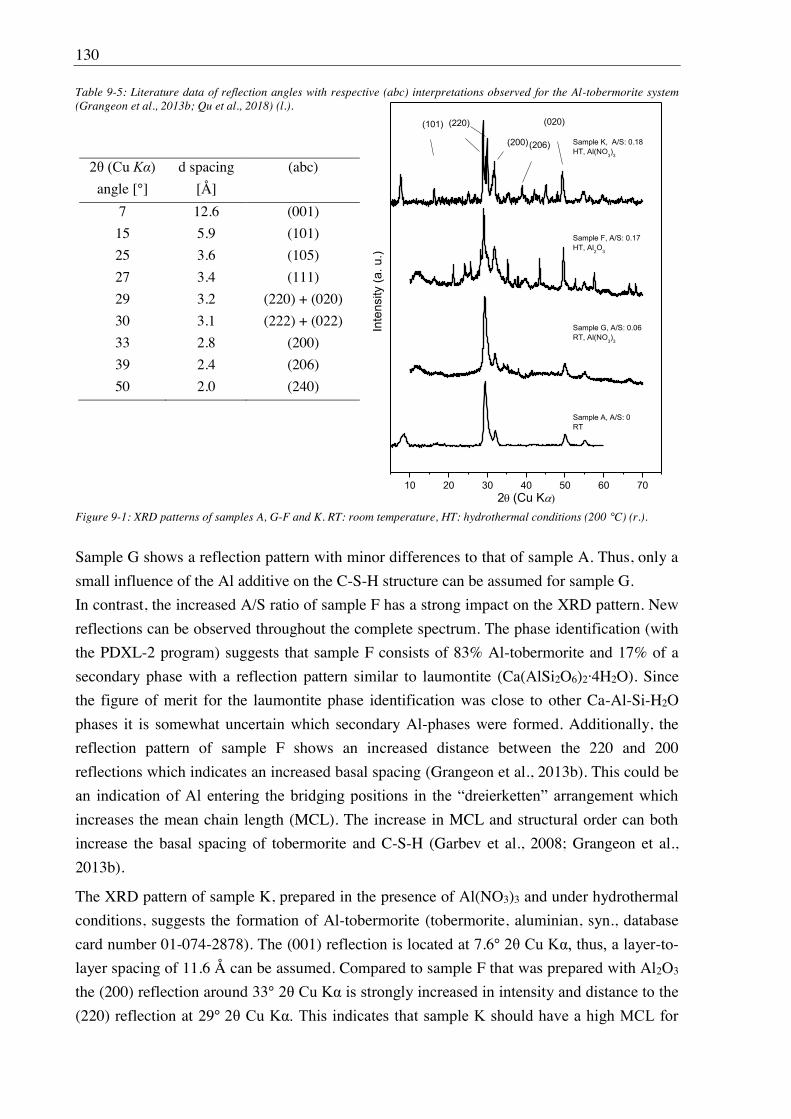
130
Table 9-5: Literature data of reflection angles with respective (abc) interpretations observed for the Al-tobermorite system (Grangeon et al., 2013b; Qu et al., 2018) (l.).
Figure 9-1: XRD patterns of samples A, G-F and K. RT: room temperature, HT: hydrothermal conditions (200 °C) (r.).
Sample G shows a reflection pattern with minor differences to that of sample A. Thus, only a
small influence of the Al additive on the C-S-H structure can be assumed for sample G.
In contrast, the increased A/S ratio of sample F has a strong impact on the XRD pattern. New
reflections can be observed throughout the complete spectrum. The phase identification (with
the PDXL-2 program) suggests that sample F consists of 83% Al-tobermorite and 17% of a
secondary phase with a reflection pattern similar to laumontite (Ca(AlSi2O6)2 4H2O). Since
the figure of merit for the laumontite phase identification was close to other Ca-Al-Si-H2O
phases it is somewhat uncertain which secondary Al-phases were formed. Additionally, the
reflection pattern of sample F shows an increased distance between the 220 and 200
reflections which indicates an increased basal spacing (Grangeon et al., 2013b). This could be
increases the mean chain length (MCL). The increase in MCL and structural order can both
increase the basal spacing of tobermorite and C-S-H (Garbev et al., 2008; Grangeon et al.,
2013b).
The XRD pattern of sample K, prepared in the presence of Al(NO3)3 and under hydrothermal
conditions, suggests the formation of Al-tobermorite (tobermorite, aluminian, syn., database
card number 01-074-2878). The (001) reflection is located at 7.6° -to-
layer spacing of 11.6 Å can be assumed. Compared to sample F that was prepared with Al2O3
the (200) reflection around 33°
(220) reflection at 29°
K )
angle [°]
d spacing
[Å]
(abc)
7 12.6 (001)
15 5.9 (101)
25 3.6 (105)
27 3.4 (111)
29 3.2 (220) + (020)
30 3.1 (222) + (022)
33 2.8 (200)
39 2.4 (206)
50 2.0 (240)
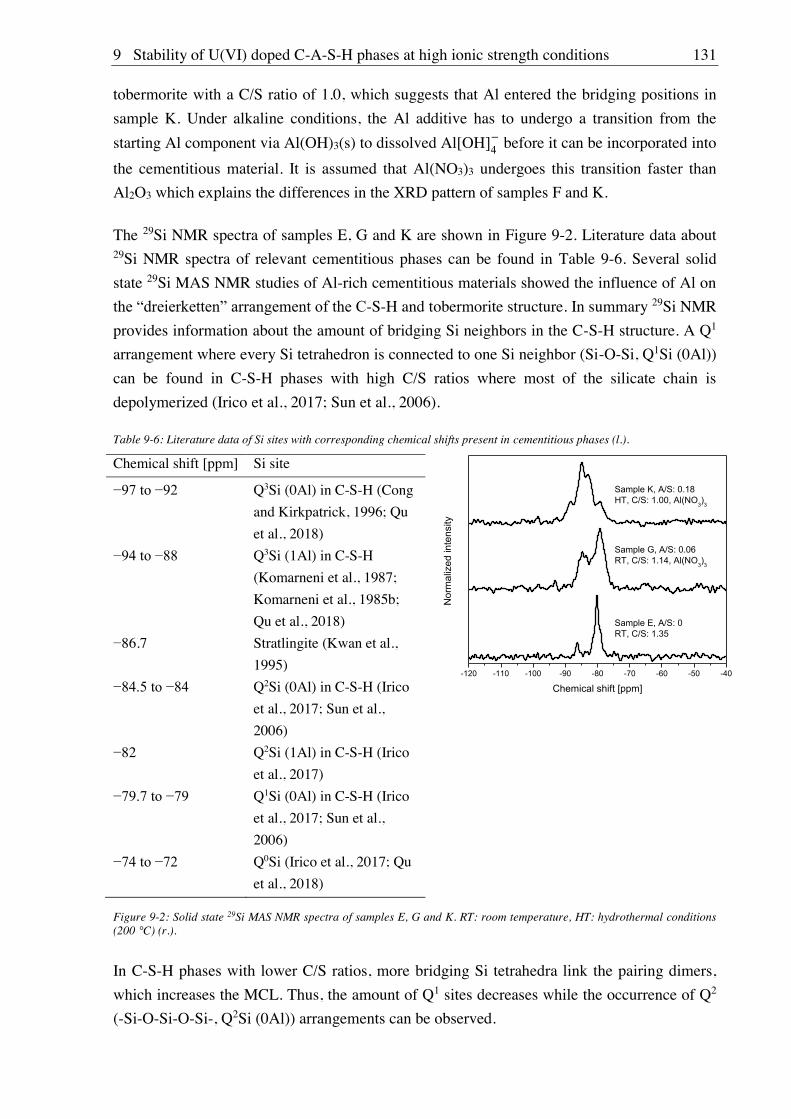
9 Stability of U(VI) doped C-A-S-H phases at high ionic strength conditions 131
tobermorite with a C/S ratio of 1.0, which suggests that Al entered the bridging positions in
sample K. Under alkaline conditions, the Al additive has to undergo a transition from the
starting Al component via Al(OH)3(s) to dissolved Al[OH before it can be incorporated into
the cementitious material. It is assumed that Al(NO3)3 undergoes this transition faster than
Al2O3 which explains the differences in the XRD pattern of samples F and K.
The 29Si NMR spectra of samples E, G and K are shown in Figure 9-2. Literature data about 29Si NMR spectra of relevant cementitious phases can be found in Table 9-6. Several solid
state 29Si MAS NMR studies of Al-rich cementitious materials showed the influence of Al on
-S-H and tobermorite structure. In summary 29Si NMR
provides information about the amount of bridging Si neighbors in the C-S-H structure. A Q1
arrangement where every Si tetrahedron is connected to one Si neighbor (Si-O-Si, Q1Si (0Al))
can be found in C-S-H phases with high C/S ratios where most of the silicate chain is
depolymerized (Irico et al., 2017; Sun et al., 2006).
Table 9-6: Literature data of Si sites with corresponding chemical shifts present in cementitious phases (l.).
Figure 9-2: Solid state 29Si MAS NMR spectra of samples E, G and K. RT: room temperature, HT: hydrothermal conditions (200 °C) (r.).
In C-S-H phases with lower C/S ratios, more bridging Si tetrahedra link the pairing dimers,
which increases the MCL. Thus, the amount of Q1 sites decreases while the occurrence of Q2
(-Si-O-Si-O-Si-, Q2Si (0Al)) arrangements can be observed.
Chemical shift [ppm] Si site
Q3Si (0Al) in C-S-H (Cong
and Kirkpatrick, 1996; Qu
et al., 2018)
Q3Si (1Al) in C-S-H
(Komarneni et al., 1987;
Komarneni et al., 1985b;
Qu et al., 2018)
86.7 Stratlingite (Kwan et al.,
1995)
Q2Si (0Al) in C-S-H (Irico
et al., 2017; Sun et al.,
2006)
82 Q2Si (1Al) in C-S-H (Irico
et al., 2017)
Q1Si (0Al) in C-S-H (Irico
et al., 2017; Sun et al.,
2006)
Q0Si (Irico et al., 2017; Qu
et al., 2018)
132
With regard to Al, it was reported that Al tetrahedra can occupy the positions of bridging Si
tetrahedra, increasing the silicate chain length, thus, reducing Si Q1 peaks and increasing Q2
peaks (Q2Si (1Al)). At very high Al contents in cementitious materials even a cross-linking
between C-S-H layers was observed, resulting in the occurrence of Q3 sites (Q3Si (1Al))
(Komarneni et al., 1987; Komarneni et al., 1985b).
From the Q integrals of a 29Si NMR spectrum MCL and cross-linking quotients (CLQ) of a
sample can be determined according to equations (9.1) and (9.2) developed by Coleman
(2006) and applied by Qu et al. (2018).
(9.1)
(9.2)
Sample E (C/S 1.35) shows a typical 29Si NMR spectrum for Al-free C-S-H phases with a
medium to high C/S ratio. Its Q1 ppm which accounts roughly to
85% of the observed signal area, indicating a low degree of silica chain polymerization. The
ppm has to be caused by a Q2Si (0Al) site since sample E is Al-free.
The MCL calculation results in a MCL of 2.3 silica units supporting the assumption that the
silica chain in sample E is nearly depolymerized.
Sample G, that was prepared at RT similar to sample E but in the additional presence of
Al(NO3)3 (A/S: 0.06), shows a pronounced reduction of the Q1 ppm to 50% of
ppm, caused by the Q2Si (0Al) site, amounts to 34% of the
signal area and results from the lower C/S ratio of sample G (C/S: 1.14). The signal at
ppm, caused by (Q2Si (1Al)) shows that 17% of the bridging positions in sample G are
occupied by Al. Thus, the MCL of sample G is increased to 4.1 indicating a higher degree of
(alumino)silicate chain polymerization (Qu et al., 2018).
The reduction of Q1 peaks is even more pronounced in the Al-rich hydrothermally prepared
sample K that consists of tobermorite as shown by XRD. The Q1 peak is reduced to only 11%
of the total peak area, while high intensity Q2Si (1Al) and Q2Si (0Al) peaks become visible at
ppm, respectively. Thus sample K shows a high degree of (alumino)silicate
chain polymerization by bridging Si (47%) and bridging Al (31%). Additionally, a peak at
ppm was observed that could be either caused by strat ppm) or by layer
cross-linking Q3 ppm). Therefore, sample K shows the highest MCL
of 18.5 and a CLQ of 0.128. No Q3 ppm could be
observed, implying that only alumina units occupy the cross-linking positions. Qu et al.
(2018) synthesized Al-rich tobermorite samples with Al/(Si+Al) ratios between 0.01 and 0.12
at 180 °C and 7 h of synthesis times. The authors found a decrease of the MCL at
Al/(Si+Al)>0.03. At an Al/(Si+Al) ratio of 0.12 they found a MCL of 11.4 and CLQ of 0.13.
Thus, the CLQ is comparable while the MCL in the present study is higher, probably due to
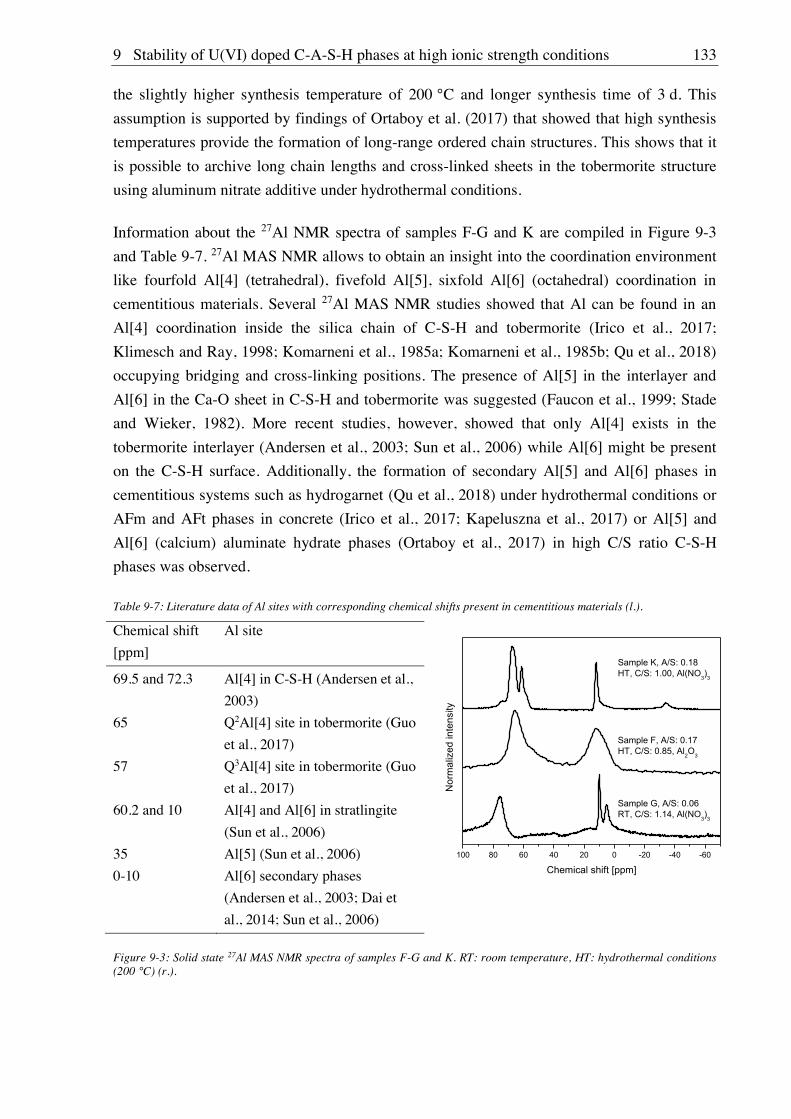
9 Stability of U(VI) doped C-A-S-H phases at high ionic strength conditions 133
the slightly higher synthesis temperature of 200 °C and longer synthesis time of 3 d. This
assumption is supported by findings of Ortaboy et al. (2017) that showed that high synthesis
temperatures provide the formation of long-range ordered chain structures. This shows that it
is possible to archive long chain lengths and cross-linked sheets in the tobermorite structure
using aluminum nitrate additive under hydrothermal conditions.
Information about the 27Al NMR spectra of samples F-G and K are compiled in Figure 9-3
and Table 9-7. 27Al MAS NMR allows to obtain an insight into the coordination environment
like fourfold Al[4] (tetrahedral), fivefold Al[5], sixfold Al[6] (octahedral) coordination in
cementitious materials. Several 27Al MAS NMR studies showed that Al can be found in an
Al[4] coordination inside the silica chain of C-S-H and tobermorite (Irico et al., 2017;
Klimesch and Ray, 1998; Komarneni et al., 1985a; Komarneni et al., 1985b; Qu et al., 2018)
occupying bridging and cross-linking positions. The presence of Al[5] in the interlayer and
Al[6] in the Ca-O sheet in C-S-H and tobermorite was suggested (Faucon et al., 1999; Stade
and Wieker, 1982). More recent studies, however, showed that only Al[4] exists in the
tobermorite interlayer (Andersen et al., 2003; Sun et al., 2006) while Al[6] might be present
on the C-S-H surface. Additionally, the formation of secondary Al[5] and Al[6] phases in
cementitious systems such as hydrogarnet (Qu et al., 2018) under hydrothermal conditions or
AFm and AFt phases in concrete (Irico et al., 2017; Kapeluszna et al., 2017) or Al[5] and
Al[6] (calcium) aluminate hydrate phases (Ortaboy et al., 2017) in high C/S ratio C-S-H
phases was observed.
Table 9-7: Literature data of Al sites with corresponding chemical shifts present in cementitious materials (l.).
Figure 9-3: Solid state 27Al MAS NMR spectra of samples F-G and K. RT: room temperature, HT: hydrothermal conditions (200 °C) (r.).
Chemical shift
[ppm]
Al site
69.5 and 72.3 Al[4] in C-S-H (Andersen et al.,
2003)
65 Q2Al[4] site in tobermorite (Guo
et al., 2017)
57 Q3Al[4] site in tobermorite (Guo
et al., 2017)
60.2 and 10 Al[4] and Al[6] in stratlingite
(Sun et al., 2006)
35 Al[5] (Sun et al., 2006)
0-10 Al[6] secondary phases
(Andersen et al., 2003; Dai et
al., 2014; Sun et al., 2006)
134
The 27Al NMR spectrum of sample G shows peaks at 76, 9.9 and 5 ppm. Andersen et al.
(2003) reported the presence of Al[4] in the C-S-H structure similar to tobermorite with a
chemical shift between 69.5 and 72.3 ppm, while Dai et al. (2014) detected Al[6] on the C-S-
H surface around 10 ppm. Thus, the peaks at 76 and 9.9 ppm can be attributed to Al
incorporated into the C-S-H silica chain and sorbed on the C-S-H surface. The XRD study of
sample G suggested some minor reflections of an unidentified phase. Since the 27Al NMR
spectrum shows an Al[6] peak at 5 ppm, this unidentified secondary phase probably contains
Al.
Sample F shows a spectrum with a very broad Al[4] peak between 60 and 65 ppm as well an
Al[6] peak at 10 ppm that probably belongs to secondary Al[6] phase with a XRD pattern
similar to laumontite (Ca(AlSi2O6)2 4H2O) that amounted to 17% of sample F. Although the 27Al NMR peak positions are comparable to those of stratlingite (Lothenbach et al., 2011), no
stratlingite was detected in the XRD patterns.
Sample K shows main peaks at 67.6, 58.3 and 11 ppm in its 27Al NMR spectrum. This
indicates that sample K possesses Al[4] in Q2 and Q3 sites in the tobermorite structure as
already detected in its 29Si NMR spectrum. Additionally, the band positions are in agreement
with those reported for stratlingite (Sun et al., 2006). Since also the 29Si NMR spectrum of
sample K suggested the presence of stratlingite it could be present in small quantities below
ppm are rotation side
bands originating from a too low MAS frequency. This shows that the static line width (tensor
without MAS) of sample K is greater than the chosen MAS frequency of 20 kHz. The high
amounts of Al seem to increase the line width which makes NMR investigations of Al
containing cementitious materials technically challenging.
TRLFS measurements were applied to identify the U(VI) incorporation into the formed Al-
tobermorite phases. In Figure 9-4 the luminescence spectra of samples A, H, J, L and G/U are
compiled. Determined band positions and lifetimes are compiled in Table 9-8. The U(VI)
luminescence spectrum of sample A (Al-free C-S-H phase) shows a luminescence of U(VI)
sorbed on the C-S-H surface (37.1%) and incorporated (62.9%) in the C-S-H interlayer with
lifetimes of 118 and 604 s, respectively. U(VI)/C-S-H spectra were discussed in the previous
chapter 7.2.1. An incorporation of U(VI) in the C-S-H interlayer resulted in an increased red
shift compared to U(VI) exclusively sorbed on the C-S-H surface (Tits et al., 2011). The
incorporation of U(VI) from the C-S-H surface into the interlayer took longer time periods
due to C-S-H re-crystallization compared to a direct U(VI) incorporation.
For sample H, a luminescence spectrum comparable to sample A with luminescence lifetimes
of 118 and 604 s was recorded and assigned to a U(VI)/C-S-H surface complex and U(VI)
incorporated in the C-S-H structure.
9 Stability of U(VI) doped C-A-S-H phases at high ionic strength conditions 135
Table 9-8: Band positions and lifetimes of samples A, H, J, L and G/U determined in TRLFS investigations (l.).
Sample
(days)
Band positions [nm] Lifetimes
[ s]
L (120) 505.5, 525.3, 545.3
L (14) 505.4, 522.3, 542.3 7/202
J (120) 517.1, 538.8, 562.0 260/720
J (14) 516.2, 537.5, 560.2
H (14) 516.3, 539.6, 563.2
G/U
(120)
501.4, 522.3, 546.7 188/601
G/U (14) 501.6, 522.9, 547.0
A (14) 497.1, 517.2, 538.9 118/604
Figure 9-4: TRLFS spectra of samples A, H, J, L and G/U after 14 or 120 d of equilibration time. RT: room temperature, HT: hydrothermal conditions (200 °C) (r.). The decrease in line resolution for samples L and G/U after 120 d was caused by malfunctions of the spectrograph.
This indicates that C-S-H with low to moderate amounts of Al remains capable of
incorporating U(VI) in its interlayer. The luminescence spectrum of sample J shows a close
resemblance to U(VI) incorporated into C-S-H structure, but with a better band resolution.
Since the hydrothermal synthesis conditions of sample J leads to the formation of tobermorite,
which is a crystalline form of C-S-H, the increase in band resolution can be explained by a
more defined chemical environment of U(VI) in the tobermorite interlayer. The Al-additives
seem to have no major influence on the chemical environment of U(VI) in the tobermorite
interlayer at low A/S ratios. With increasing equilibration time the spectrum of sample J
remains unchanged. Two U(VI) luminescence lifetimes of 260 (81.4%) and 720 s (18.6%)
were determined for sample J suggesting that some U(VI) is also located in the tobermorite
interlayer but to a larger amount on the tobermorite surface.
If the amount of Al in hydrothermally prepared tobermorite is increased to a A/S ratio of 0.14
changes in the U(VI) luminescence spectrum become visible (sample L in Figure 9-4). The
band resolution decreases drastically while the lifetime analysis provides lifetimes of 7 and
202 s. This implies that U(VI) is only located on the tobermorite surface but not in the
tobermorite interlayer. It is possible that the Al distorts the tobermorite structure to a point
that no further U(VI) can be incorporated in the interlayer. This could be caused by the Q3Si
(1Al) sites which are present at high A/S ratios and cross-link single layers which could result
136
in a decreased U(VI) retention capability for Al-saturated tobermorite which should be
reflected in the leaching experiments.
The sorption of U(VI) on C-S-H with small amounts of Al (G/U after 14 d, Figure 9-4) leads
to a spectrum similar to U(VI) sorbed on the C-S-H surface as shown for sample E/U in
Figure 7-2 or reported by Tits et al. (2011). With increasing sorption time the spectrum
becomes slightly red shifted due to the ongoing incorporation of U(VI) in the C-S-H
interlayer caused by C-S-H re-crystallization (G/U after 120 d, Figure 9-4). Such a time-
dependent effect was also observed by Tits et al. (2011). This shows that C-A-S-H remains its
sorption and incorporation capabilities for U(VI).
9.2.2. Leaching of U(VI) doped Al-tobermorite
9.2.2.1. Leaching in 2.5 M NaCl
Figure 9-5: Silicon [a], uranium [b], calcium [c] and aluminum [d] concentration in the supernatant solution after leaching of samples J (C/S 0.49, A/S 0.06) and L (C/S 0.83, A/S 0.14) (HT, Al(NO3)3) in 2.5 M NaCl as a function of time.
9 Stability of U(VI) doped C-A-S-H phases at high ionic strength conditions 137
The leaching of sample J (C/S 0.49, A/S 0.06) in 2.5 M NaCl at a S/L of 1.8 g/L leads to the
release of mM Si (Figure 9-5[a]) and mM Ca (Figure 9-5[c]). Compared
to the leaching of sample A (C/S 1.0) in 2.5 M NaCl (0.64 mM Si, Table 7-5) the Si release of
sample J is slightly lower. Thus, tobermorite seems to be more stable in saline solutions
probably caused by its higher crystallinity.
mM) compared to
sample J which is probably caused by the higher C/S ratio of sample L.
The U(VI) release from samples J and L after 35 d ranges between ×10 3 M U
comparable (Figure 9-5[b]). Although the TRLFS investigation showed that sample J
possesses U(VI) in the interlayers and at the surface while the U(VI) in sample L is
exclusively located on the tobermorite surface, the U(VI) retention for sample L remains high
in 2.5 M NaCl. It was reported that even the inner-sphere surface sorption of U(VI) complex
provides a strong U(VI) retention by C-S-H at high pH values (Tits et al., 2011). This shows
that a 2.5 M NaCl solution is not capable of removing the uranyl inner-sphere complex from a
C-S-H and tobermorite surface at high pH values.
9.2.2.2. Leaching in 2.5 M NaCl/0.02 M NaHCO3
For samples L and J the Al concentration in the leaching solution was near the ICP-MS
detection limit (Figure 9-6
9.6 due to the presence of carbonate in solution.
Thus, the Al speciation in the liquid phase should change from Al[OH - to Al(OH)3 which is
highly insoluble (0.02 mM). The Ca concentration in solution (Figure 9-6[c]) is around one
order of magnitude lower (8.0×10 2 mM) compared to the carbonate-free leaching because of
the precipitation of CaCO3.
Nonetheless, samples L and J show an increased Si release into 2.5 M NaCl/0.02 M NaHCO3
mM, Figure 9-6[a]) compared to the
leaching in 2.5 mM, Figure 9-5[a]). This indicates a stronger dissolution
of Al-tobermorite in the presence of 2.5 M NaCl/0.02 M NaHCO3 compared to 2.5 M NaCl.
The U(VI) release from sample A into 2.5 M NaCl/0.02 M NaHCO3 amounted to 0.18 M
(Table 7-5). The U(VI) release from sample J (C/S 0.49, A/S 0.06) was with 0.16 M (Figure
9-6[b]) almost identical, which shows that at low A/S ratios Al-tobermorite possesses a
similar U(VI) retention capability than Al-free C-S-H phases. At a high A/S ratio the U(VI)
release increased from 0.16 to 0.41 M (sample L in Figure 9-6[b]). TRLFS measurements
already suggested a reduced U(VI) retention capability of sample L due to an inaccessibility
of the tobermorite interlayers for U(VI). The U(VI) of sample L is located on the surface of
Al-rich tobermorite were it is easily accessible for the carbonate ions that enhance the U(VI)
mobility in this pH range.
138
Figure 9-6: Silicon [a], uranium [b], calcium [c] and aluminum [d] concentration in the supernatant solution after leaching of sample J (C/S 0.49, A/S 0.06) and L (C/S 0.83, A/S 0.14) (HT, Al(NO3)3) in 2.5 M NaCl/0.02 M NaHCO3 as a function of time (ICP-MS detection limit for Al is 3.7×10 4 mM (dashed line)).
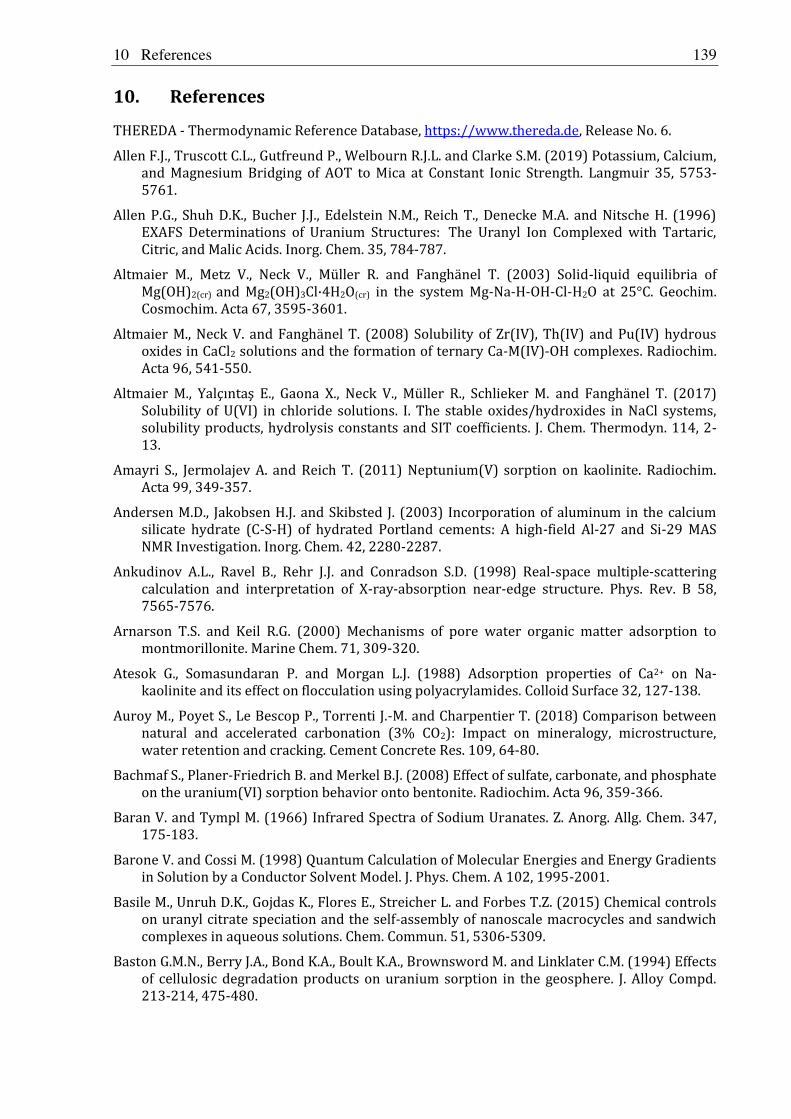
10 References 139
10. References
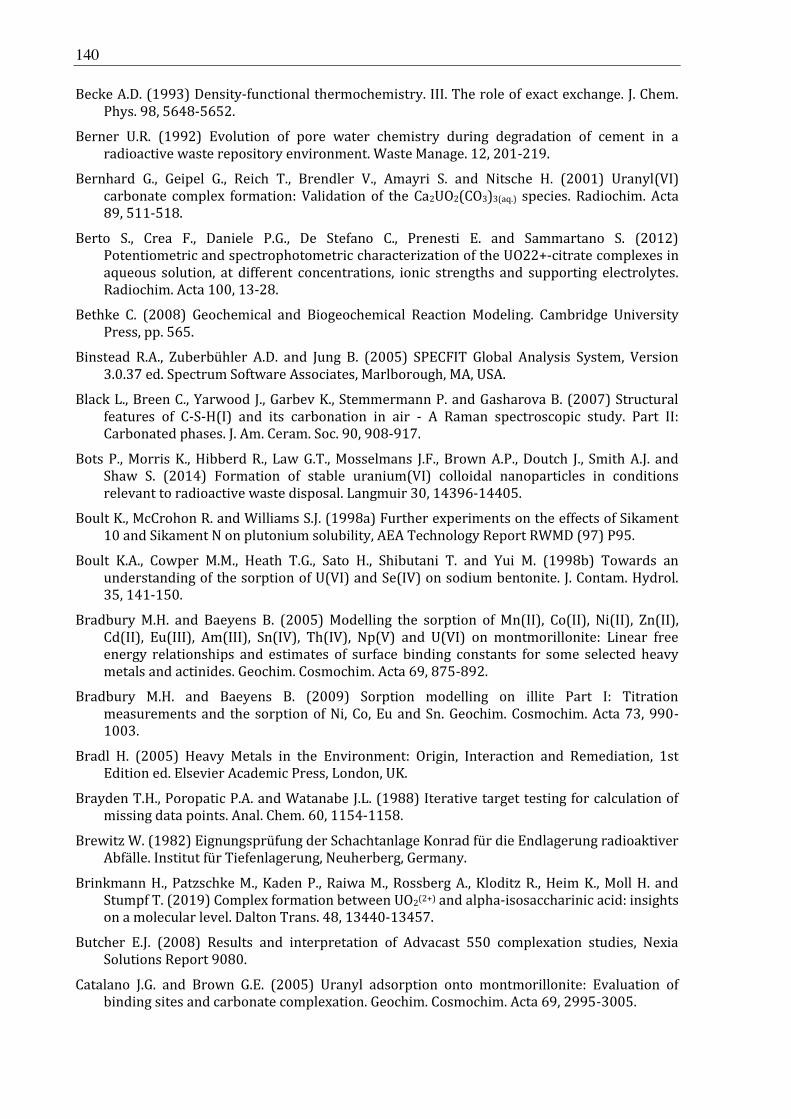
140
10 References 141
142
10 References 143
144
10 References 145
146
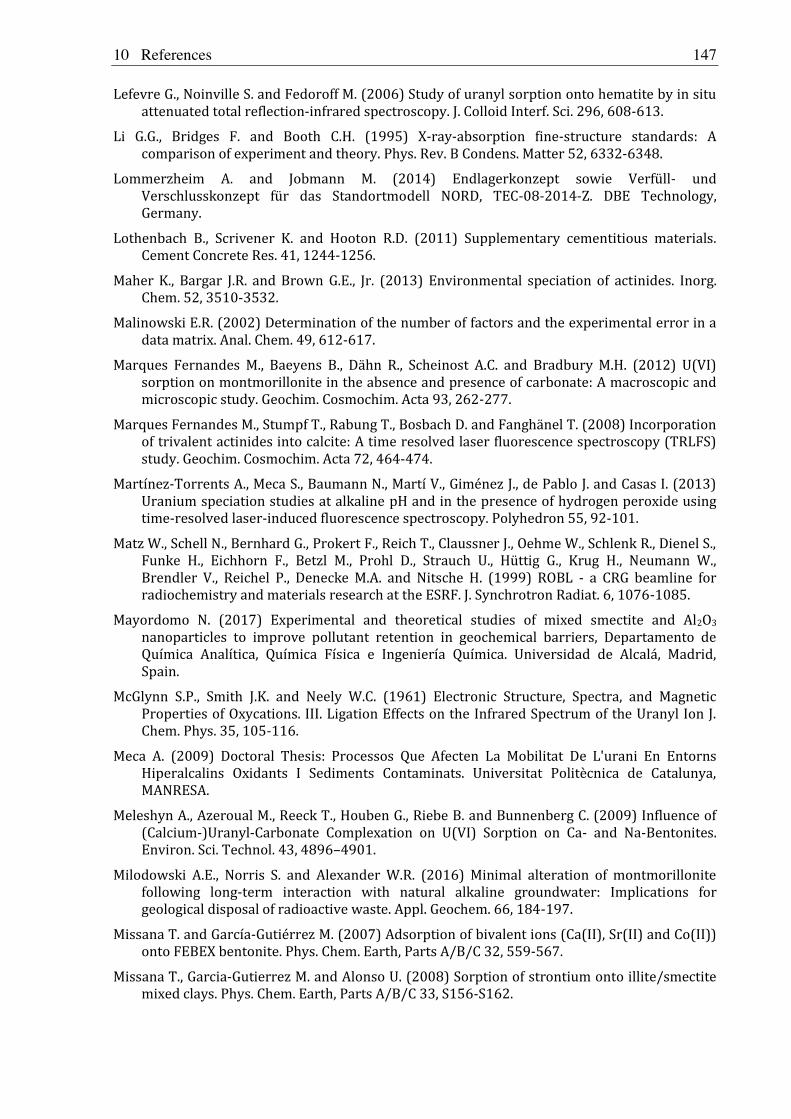
10 References 147
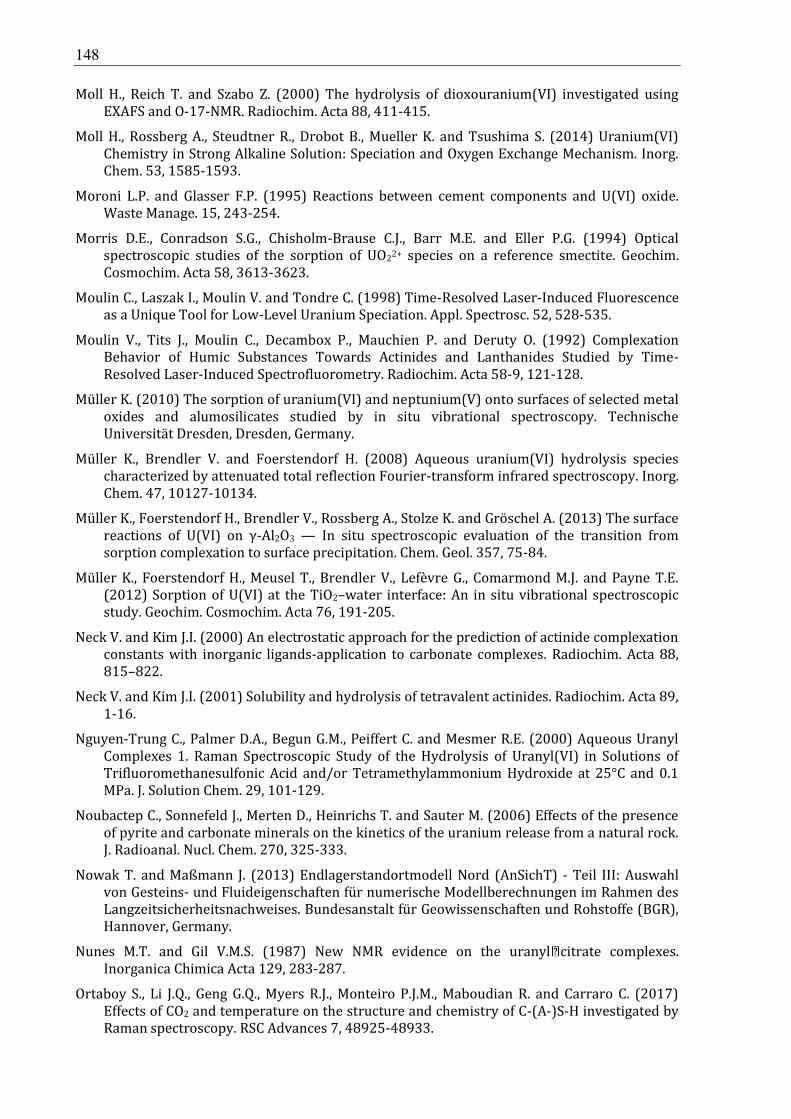
148
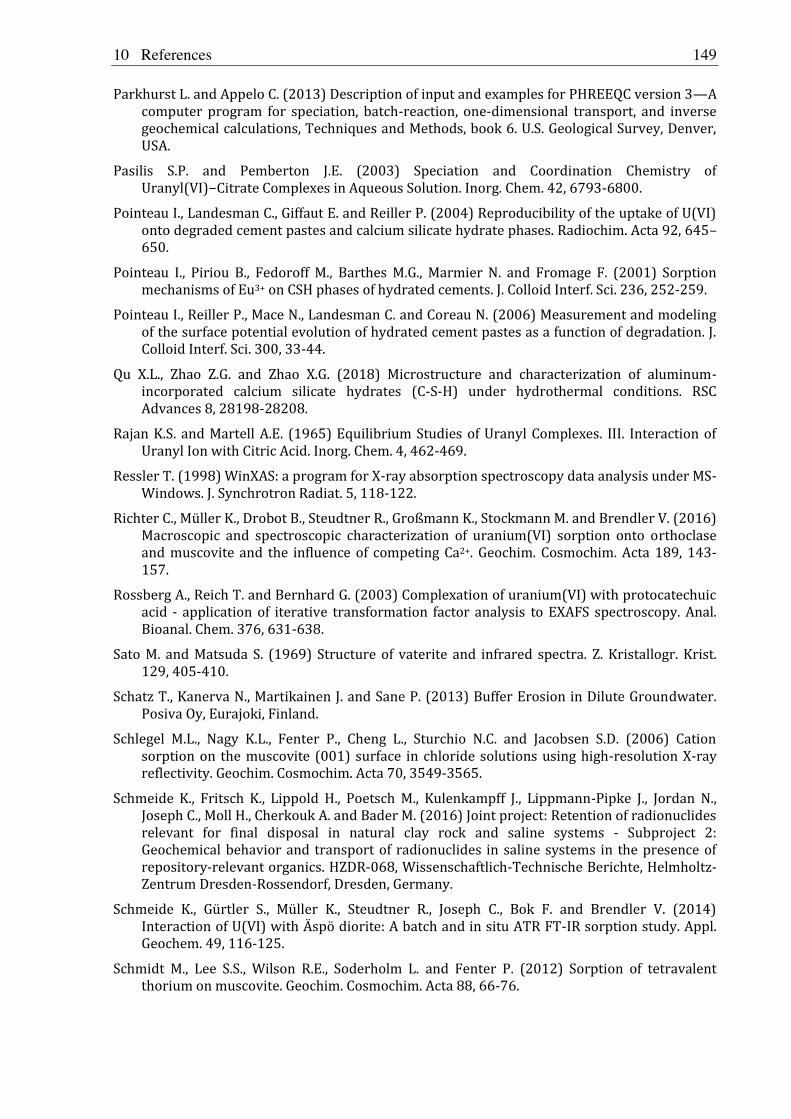
10 References 149
150
10 References 151
152
153
11. Publications of the Helmholtz-Zentrum Dresden-Rossendorf (HZDR) within the GRaZ project
Publications (peer-reviewed):
Lippold, H., Zedek, L.: Metal dissociation from humic colloids: Kinetics with time-dependent rate constants. Chemosphere 275, 130045 (2021).
Kretzschmar, J., Tsushima, S., Drobot, B., Steudtner, R., Schmeide, K., Stumpf, T.: Trimeric uranyl(VI) citrate forms Na+, Ca2+, and La3+ sandwich complexes in aqueous solution. Chemical Communications 56, 13133-13136 (2020).
Kretzschmar, J., Strobel, A., Haubitz, T., Drobot, B., Steudtner, R., Barkleit, A., Brendler, V., Stumpf, T.: Uranium(VI) complexes of glutathione disulfide forming in aqueous solution. Inorganic Chemistry 59, 4244-4254 (2020).
Wolter, J.-M., Schmeide, K., Huittinen, N., Stumpf, T.: Cm(III) retention by calcium silicate hydrate (C-S-H) gel and secondary alteration phases in carbonate solutions with high ionic strength: A site-selective TRLFS study. Scientific Reports 9, 14255 (2019).
Philipp, T., Shams Aldin Azzam, S., Rossberg, A., Huittinen, N., Schmeide, K., Stumpf, T.: U(VI) sorption on Ca-bentonite at (hyper)alkaline conditions Spectroscopic investigations of retention mechanisms. Science of the Total Environment 676, 469-481 (2019).
Wolter, J.-M., Schmeide, K., Weiss, S., Bok, F., Brendler, V., Stumpf, T.: Stability of U(VI) doped calcium silicate hydrate gel in repository-relevant brines studied by leaching experiments and spectroscopy. Chemosphere 218, 241-251 (2019).
Ph.D. theses / Master theses:
Wolter, J.-M.: Stability of U(VI) and Cm(III) doped calcium (alumino)silicate hydrate phases at high ionic strengths. Ph.D. thesis, Technische Universität Dresden (2020).
Philipp, T.: U(VI) retention by Ca-bentonite and clay minerals at (hyper)alkaline conditions. Ph.D. thesis, Technische Universität Dresden (2020).
Dullies, P.: Untersuchungen zum Einfluss von Isosaccharinsäure auf die U(VI)-Rückhaltung an Ca-Bentonit unter alkalischen Bedingungen (Studies on the influence of isosaccharic acid on the U(VI) retention of Ca-bentonite under alkaline conditions). Master thesis, Hochschule für Technik und Wirtschaft Dresden (2019).
Oral presentations:
Schmeide, K., Philipp, T., Wolter, J.-M., Kretzschmar, J., Dullis, P., Schymura, S., Lippold, H., Stumpf, T.: Einfluss erhöhter Ionenstärken auf die Wechselwirkung von Actiniden/Lanthaniden mit Ca-Bentonit, Zementphasen und organischen Liganden unter hyperalkalinen Bedingungen. Abschlussworkshop des Verbundprojektes "Geochemische Radionuklidrückhaltung an Zementalterationsphasen (GRaZ)", 21.-22.01.2020, Mainz, Germany.
Kretzschmar, J., Tsushima, S., Jäckel, E., Meyer, R., Steudtner, R., Müller, K., Schmeide, K., Brendler, V., Stumpf, T.: Dimeric Uranium(VI) Citrate Complexes: Structures and Dynamics. Jahrestagung der Fachgruppe Nuklearchemie der GDCh 2019, 25.-27.09.2019, Dresden, Germany.
Philipp, T., Schmeide, K., Rossberg, A., Huittinen, N., Stumpf, T.: Influence of pH, carbonate and calcium concentration on U(VI) retention by clay minerals at (hyper)alkaline conditions A batch sorption and spectroscopy study. International Conference on Clay Science and Technology EUROCLAY 2019, 01.-05.07.2019, Paris, France.
154
Philipp, T., Schmeide, K., Stumpf, T.: Influence of calcium on uranium and neptunium sorption on clay minerals at (hyper)alkaline conditions. 2nd International Conference on Radioanalytical and Nuclear Chemistry (RANC 2019), 05.-10.05.2019, Budapest, Hungary.
Philipp, T., Schmeide, K., Rossberg, A., Stumpf, T.: U(VI) sorption by Ca-bentonite at pH 8-13: Spectroscopic investigation of retention mechanisms. 28th Goldschmidt Conference 2018, 12.-17.08.2018, Boston, USA.
Steudtner, R., Müller, K., Schmeide, K., Brendler, V.: The uranium citric acid system and its sorption onto hematite. GDCh-Wissenschaftsforum Chemie 2017, 11.-14.09.2017, Berlin, Germany.
Posters:
Lippold, H., Becker, M., Schymura, S.: Einfluss polymerer Zementadditive auf die Mobilität von Radionukliden unter Nahfeldbedingungen eines Endlagers. Jahrestagung der Fachgruppe Nuklearchemie der GDCh 2019, 25.-27.09.2019, Dresden, Germany.
Wolter, J.-M., Schmeide, K., Huittinen, N., Bok, F., Weiss, S., Brendler, V., Stumpf, T.: Comparison of the stability of U(VI) and Cm(III) doped calcium (aluminum) silicate hydrate (C-(A)-S-H) phases at saline conditions. Migration 2019 - 17th International Conference on the Chemistry and Migration Behavior of Actinides and Fission Products in the Geosphere, 15.-20.09.2019, Kyoto, Japan.
Wolter, J.-M., Schmeide, K., Huittinen, N., Bok, F., Weiss, S., Brendler, V., Stumpf, T.: Leaching of U(VI) and Cm(III) doped calcium (aluminum) silicate hydrate gel (C-(A)-S-H) and tobermorite in saline brines. 5th
-27.03.2019, Karlsruhe, Germany.
Philipp, T., Schmeide, K., Rossberg, A., Stumpf, T.: Competition of U(VI) hydroxide and carbonate -bentonite. RadChem
2018 - 18th Radiochemical Conference, 13.05.-
Wolter, J.-M., Schmeide, K., Huittinen, N., Stumpf, T.: Stability investigations of actinide doped calcium silicate hydrate phases in highly saline electrolytes. RadChem 2018 - 18th Radiochemical Conference, 13.05.-
Wolter, J.-M., Schmeide, K., Huittinen, N., Stumpf, T.: Stability of U(VI) and Cm(III) doped calcium silicate hydrate phases in highly saline brines. 2nd Workshop on Calcium Silicate Hydrates containing Aluminium: C-A-S-H II, 23.04.-24.04.2018, Dübendorf, Switzerland.
Philipp, T., Schmeide, K., Stumpf, T.: Retention of uranium(VI) by Ca-bentonite at high ionic strength and high pH studied by batch sorption tests and TRLFS. 7th International Conference on Clays in Natural and Engineered Barriers for Radioactive Waste Confinement, 24.-27.09.2017, Davos, Switzerland.
Wolter, J.-M., Schmeide, K., Stumpf, T.: Interactions between U(VI) doped CSH phases and high saline brines. Migration 2017 - 16th International Conference on the Chemistry and Migration Behaviour of Actinides and Fission Products in the Geosphere, 10.-15.09.2017, Barcelona, Spain.
Philipp, T., Schmeide, K., Stumpf, T.: U(VI) sorption by Ca-bentonite under alkaline and saline conditions as a function of pH and carbonate content. Migration 2017 - 16th International Conference on the Chemistry and Migration Behaviour of Actinides and Fission Products in the Geosphere, 10.-15.09.2017, Barcelona, Spain.
Wolter, J.-M., Schmeide, K., Stumpf, T.: Interactions between U(VI) doped CSH phases and high saline brines. ABC Salt V Actinide and Brine Chemistry in a Salt Repository Workshop (V), 26.-28.03.2017, Ruidoso, USA.
Becker, M., Lippold, H.: Complexation and adsorption of [152Eu]Eu(III) to superplasticizers and bentonite at variable salt concentrations. 2nd Petrus-OPERA PhD and Early-Stage Researchers Conference on Radioactive Waste Management and Disposal, 27.06.-01.07.2016, Delft, Netherlands.
155
Acknowledgements
The authors thank the Federal Ministry for Economic Affairs and Energy (BMWi) and the
Project Management Agency Karlsruhe - Water Technology and Waste Management (PTKA-
WTE) for financial support (no. 02E11415B).
For support during spectroscopic measurements and help in spectra interpretation we thank
Dr. André Rossberg (EXAFS), Dr. Nina Huittinen (site-selective TRLFS), Dr. Gerhard
Geipel, Dr. Robin Steudtner and Hannes Brinkmann (TRLFS), Dr. Katharina Müller and Dr.
Harald Foerstendorf (ATR FT-IR), Dr. Moritz Schmidt (CTR/RAXR) and Dr. Frank Bok
(thermodynamic calculations).
Furthermore, we would like to thank Dr. Silvia Paasch (TU Dresden) and Kaitlin
Kammerlander (TU Dresden) for 27Al and 29Si MAS NMR measurements. Dr. Atsushi Ikeda,
Andrea Scholz and Dr. Jörg Grenzer is thanked for XRD measurements and helpful
discussions in terms of XRD pattern improvement.
Prof. Thorsten Stumpf, Prof. Vinzenz Brendler, Dr. Jan Tits (PSI) and Dr. Barbara
Lothenbach (Empa) is thanked for helpful discussions and advice.
For essential support in the daily laboratory work we thank Salim Shams Aldin Azzam and
Stephan Weiss. Furthermore, we thank Carola Eckardt, Sabrina Beutner, Birke Pfützner,
Stephanie Bachmann, Karsten Heim, Kathrin Nebe, Anette Rumpel, Susanna Jiminez, Christa
Müller and Steffen Henke for ICP-MS analyses, ion chromatography, TIC measurements,
BET determinations, IR and LSC measurements as well as for support in various other
laboratory applications and radiation protection issues.
Measurements outside of Rossendorf were only possible thanks to the help of Peter Eng (at
GeoSoilEnviroCARS (Sector 13), Advanced Photon Source (APS) of the Argonne National
Laboratory, Lemont, IL 60439 USA), Klaus Meier (Helmholtz-Institut Freiberg für
Ressourcentechnologie, 09599 Freiberg) and the cooperation with Prof. Tobias Reich, Dr.
Samer Amayri, Verena Häußler and Tobias Stern (all at Johannes Gutenberg-Universität
Mainz, Institut für Kernchemie, 55099 Mainz).
Finally, we would like to thank all other colleagues who contributed to the success of the
project.


Institute of Resource EcologyBautzner Landstr. 400 01328 Dresden, Germany Tel. +49351260-2436 Fax +49351260-12436 [email protected] http://www.hzdr.de