Embed Size (px)
Citation preview
Analysis the Temporal-Spatial Structure of Beijing from the Point View of Social Media
UNIVERSIDAD POLITECNICA DE CATALUNYA ESCUELA TECNICA SUPERIOR DE ARQUTECTURA DE BARCELONA MASTER EN GESTION Y VALORACION URBANA AÑO ACADEMICO 2015 - 2016
Alumna: Liya Yang
Tutor: Carlos Marmolejo Duarte
PROPOSAL OF MASTER THESIS
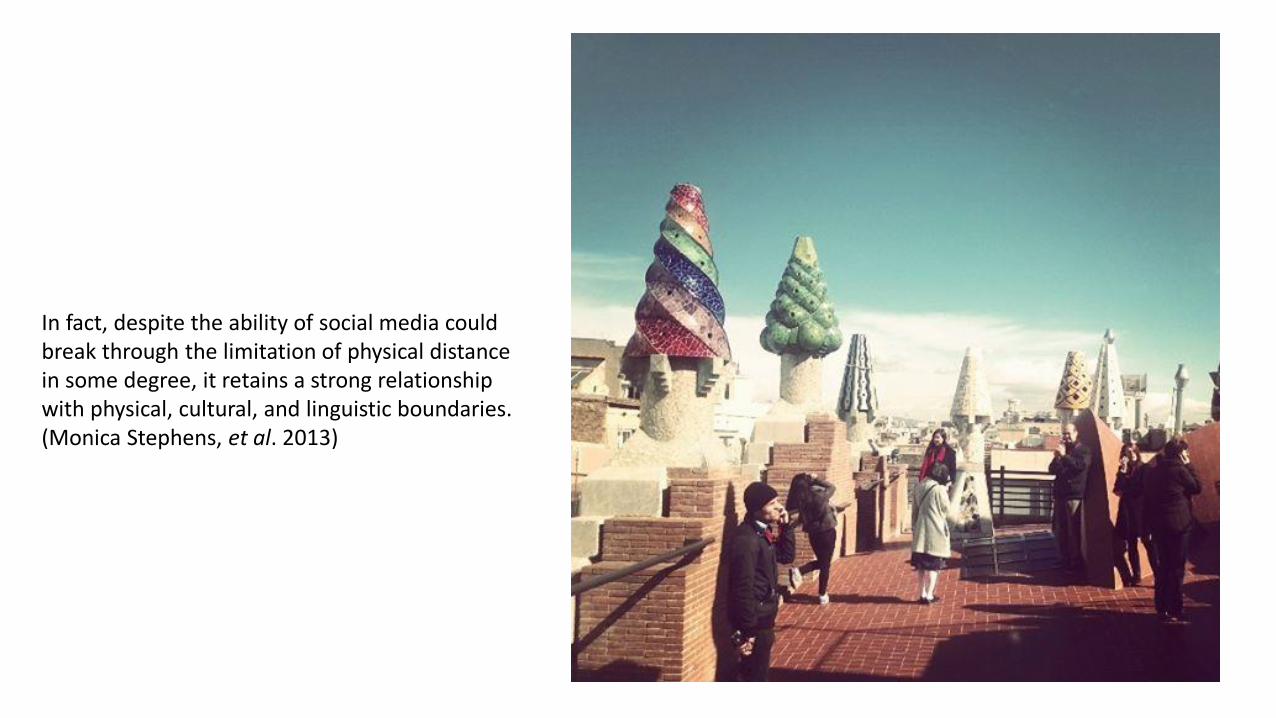
In fact, despite the ability of social media could break through the limitation of physical distance in some degree, it retains a strong relationship with physical, cultural, and linguistic boundaries. (Monica Stephens, et al. 2013)
INTRODUCTION-STUDY AREA: Beijing Municipality
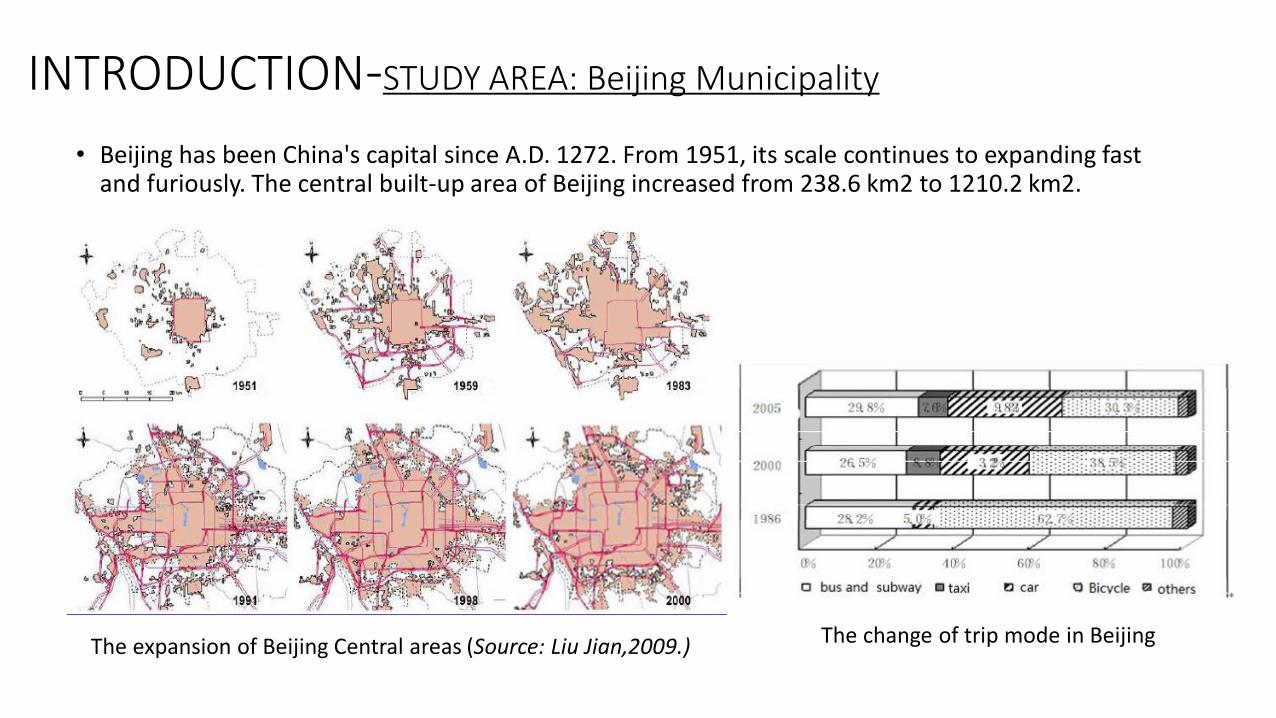
• Beijing has been China's capital since A.D. 1272. From 1951, its scale continues to expanding fast and furiously. The central built-up area of Beijing increased from 238.6 km2 to 1210.2 km2.
The expansion of Beijing Central areas (Source: Liu Jian,2009.)
The change of trip mode in Beijing
INTRODUCTION-STUDY AREA: Beijing Municipality
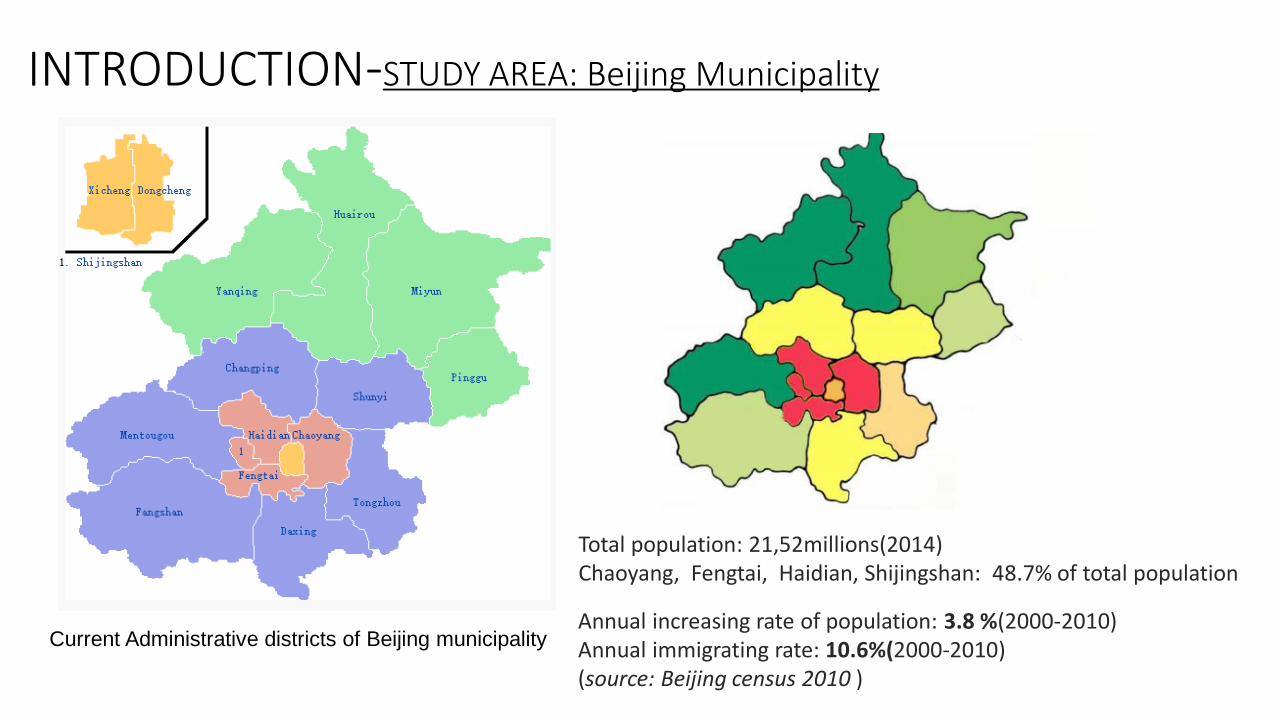
Current Administrative districts of Beijing municipality
Total population: 21,52millions(2014) Chaoyang, Fengtai, Haidian, Shijingshan: 48.7% of total population Annual increasing rate of population: 3.8 %(2000-2010) Annual immigrating rate: 10.6%(2000-2010) (source: Beijing census 2010 )
INTRODUCTION-STUDY AREA: Beijing Municipality
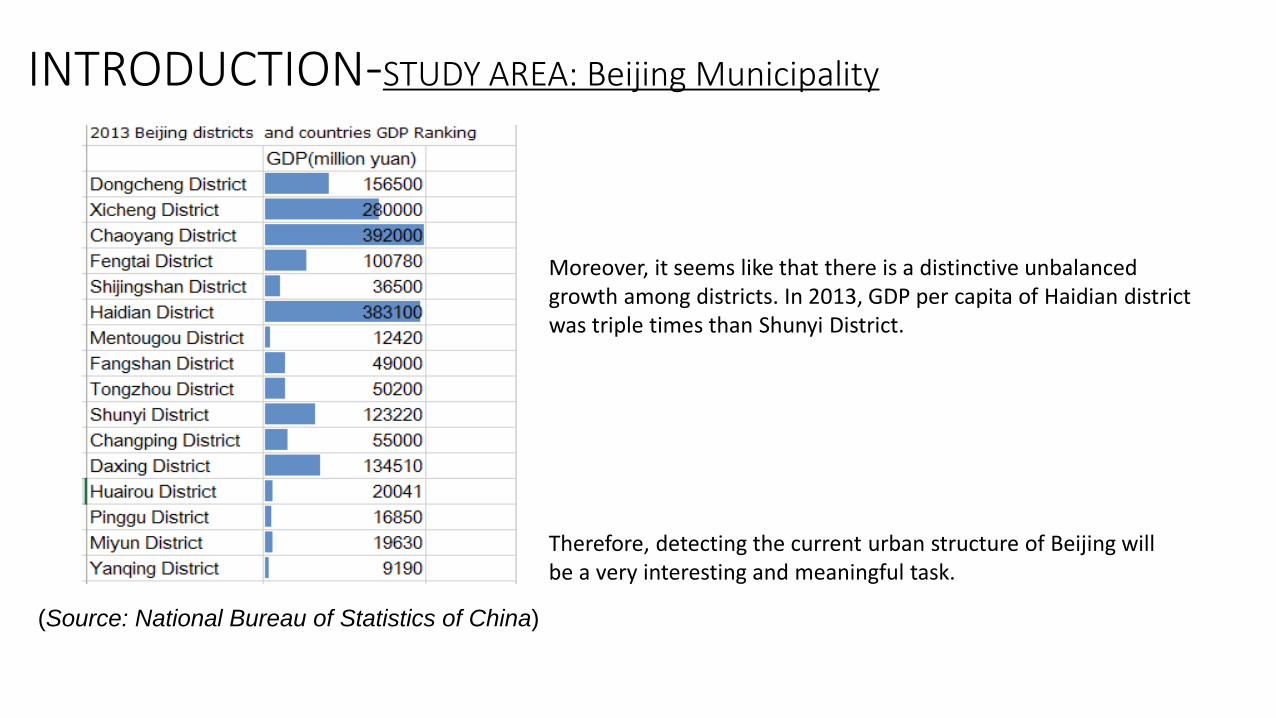
(Source: National Bureau of Statistics of China)
Moreover, it seems like that there is a distinctive unbalanced growth among districts. In 2013, GDP per capita of Haidian district was triple times than Shunyi District.
Therefore, detecting the current urban structure of Beijing will be a very interesting and meaningful task.
INTRODUCTION-WEIBO and WEIBO API
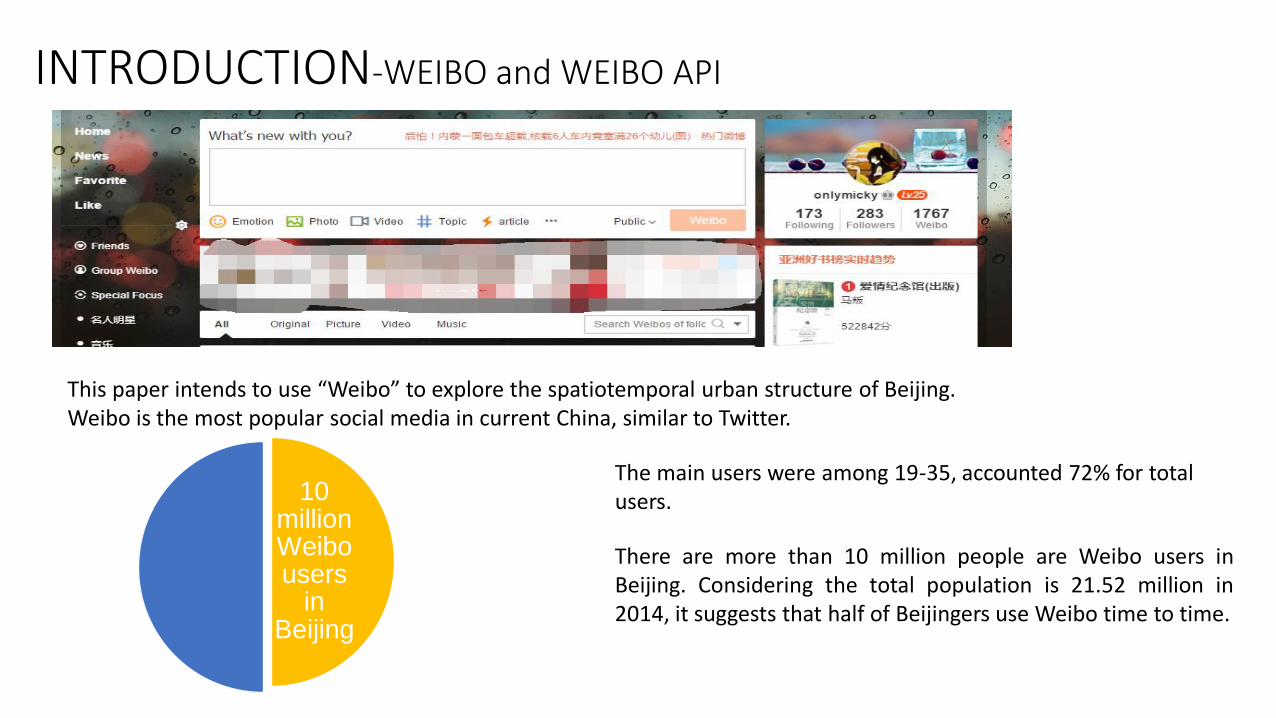
This paper intends to use “Weibo” to explore the spatiotemporal urban structure of Beijing. Weibo is the most popular social media in current China, similar to Twitter.
10 million Weibo users
in Beijing
The main users were among 19-35, accounted 72% for total users.
There are more than 10 million people are Weibo users in Beijing. Considering the total population is 21.52 million in 2014, it suggests that half of Beijingers use Weibo time to time.
INTRODUCTION-WEIBO and WEIBO API
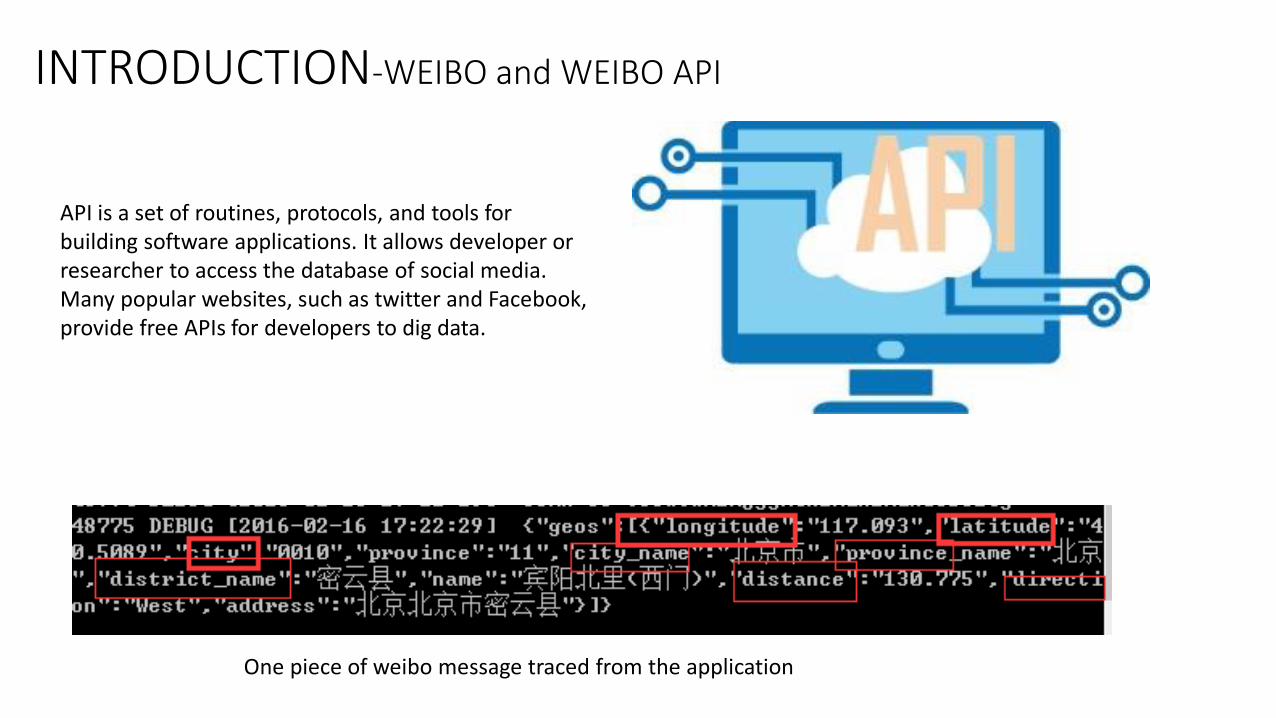
API is a set of routines, protocols, and tools for building software applications. It allows developer or researcher to access the database of social media. Many popular websites, such as twitter and Facebook, provide free APIs for developers to dig data.
One piece of weibo message traced from the application
Hypothesis In this paper, it assumes that there are obvious differences of development between districts in Beijing urban areas, though it shows a trend of polycentrism. Thanks to the geo-information provided by Weibo, this thesis could detect “hot areas” dynamically and compare them with the sub-centers according to the official city plan.
This thesis would detect the temporal-spatial structure of Beijing metropolitan area via social media
(Weibo) data, investigate the pattern of the changes of the temporal-spatial structure during one week in
Beijing. Furthermore, it is expected to analyze the relation between dynamic spatial-temporal structure and social urban factors – such as density of population, GDP per capital etc.
1. Studying the relationship between urban study and the use of geo-technologies. It is necessary to review the great potentials of these techniques that could bring to urban researches, as well as its limitations.
2. Monitoring the activities of Weibo to distinguish those dynamic “hot areas” of Beijing during one week. It is
expected to use Arcgis to present it on map. Then, compared it with the master planning of Beijing, to find out the distributional difference between virtual and planning map.
3. Figuring out the spatiotemporal characteristics of weibo flows in Beijing Metropolitan areas, through statistic
analyzing tools such as cumulative probability and percent.
4. Building a regressive model to examine those factors which affects the density flow of weibo in Beijing metropolitan area.
Objective
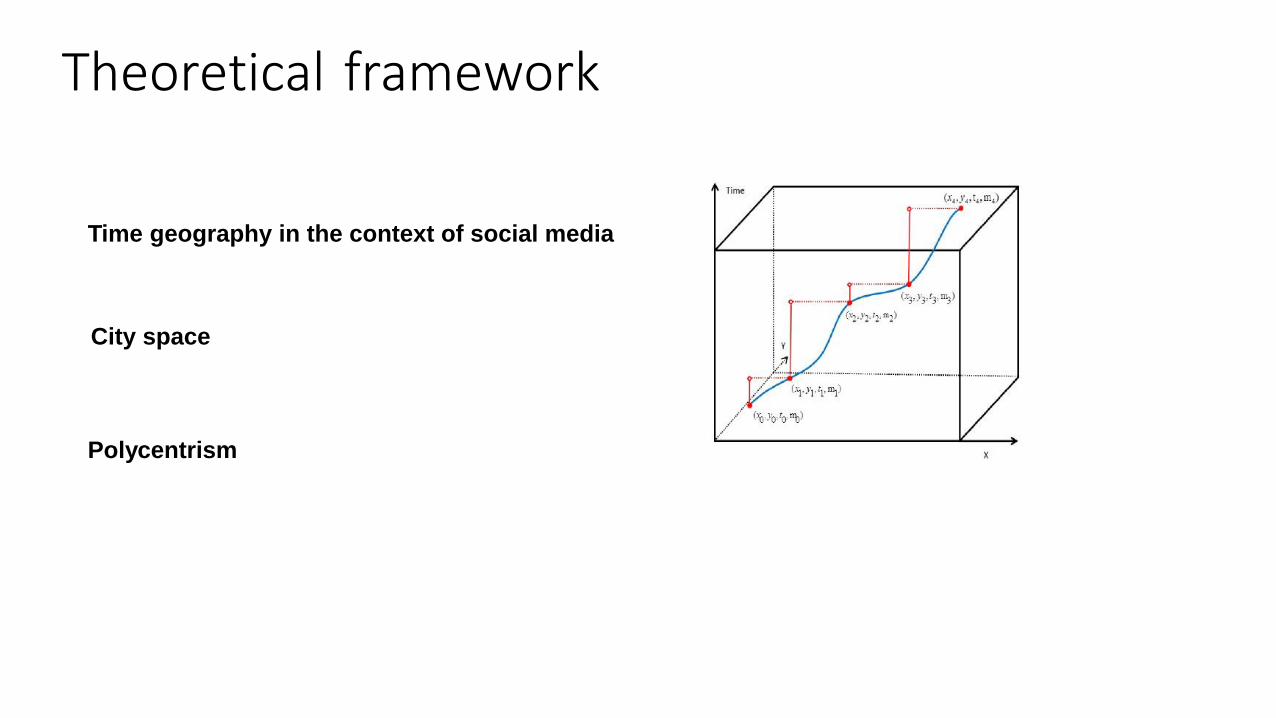
Theoretical framework
Time geography in the context of social media
Polycentrism
City space
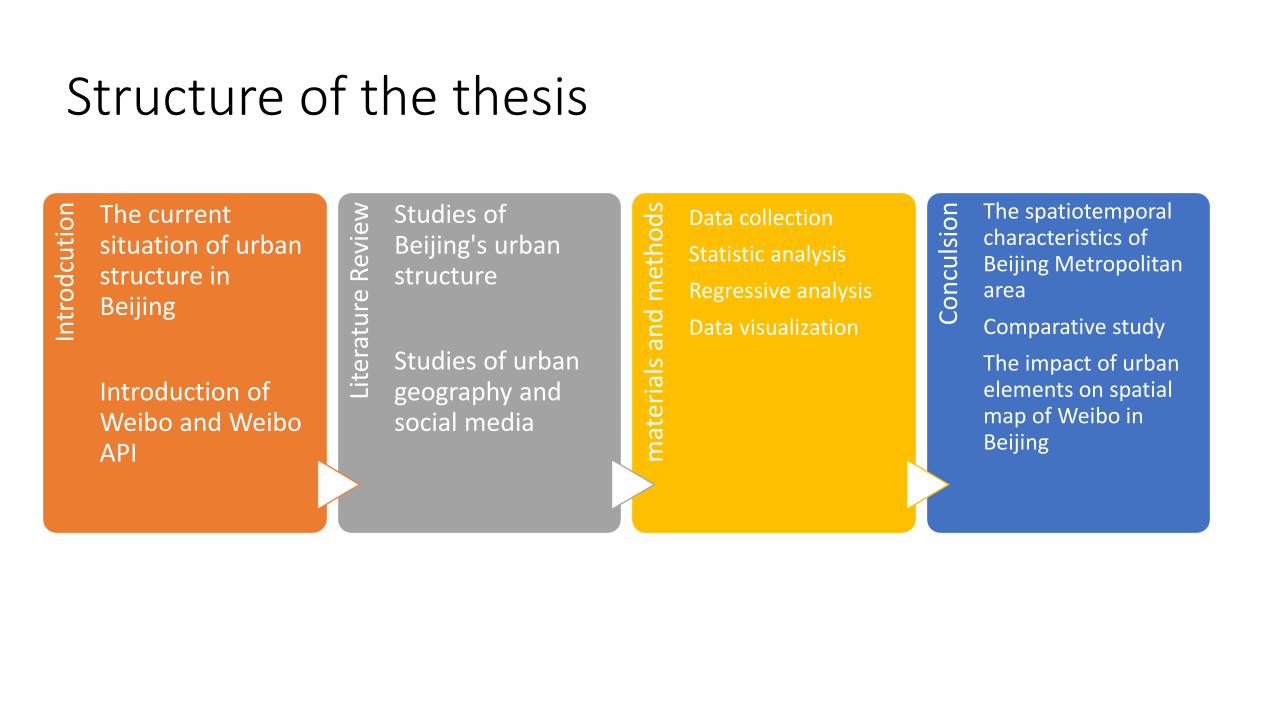
Structure of the thesis In
tro
dcu
tio
n
The current situation of urban structure in Beijing
Introduction of Weibo and Weibo API
Lite
ratu
re R
evie
w
Studies of Beijing's urban structure
Studies of urban geography and social media
mat
eria
ls a
nd
met
ho
ds
Data collection
Statistic analysis
Regressive analysis
Data visualization
Co
ncu
lsio
n
The spatiotemporal characteristics of Beijing Metropolitan area
Comparative study
The impact of urban elements on spatial map of Weibo in Beijing
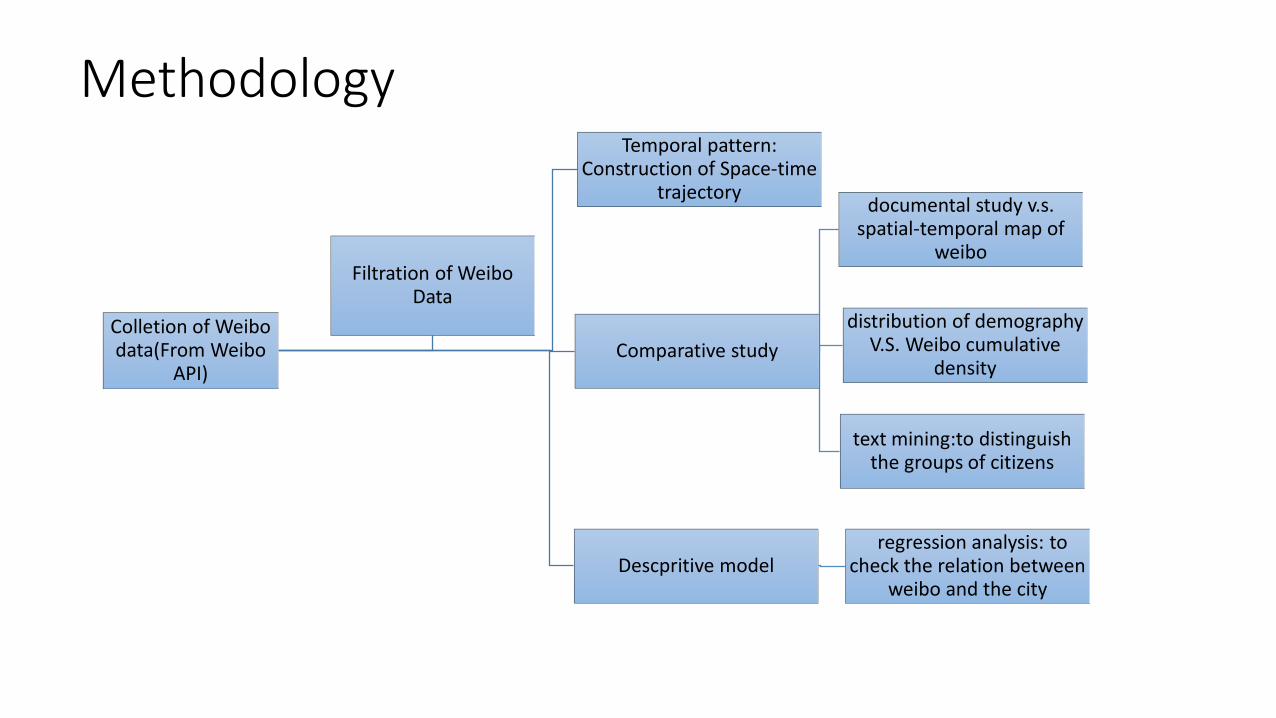
Methodology
Colletion of Weibo data(From Weibo
API)
Temporal pattern: Construction of Space-time
trajectory
Descpritive model regression analysis: to
check the relation between weibo and the city
Comparative study
distribution of demography V.S. Weibo cumulative
density
documental study v.s. spatial-temporal map of
text mining:to distinguish the groups of citizens
Filtration of Weibo Data
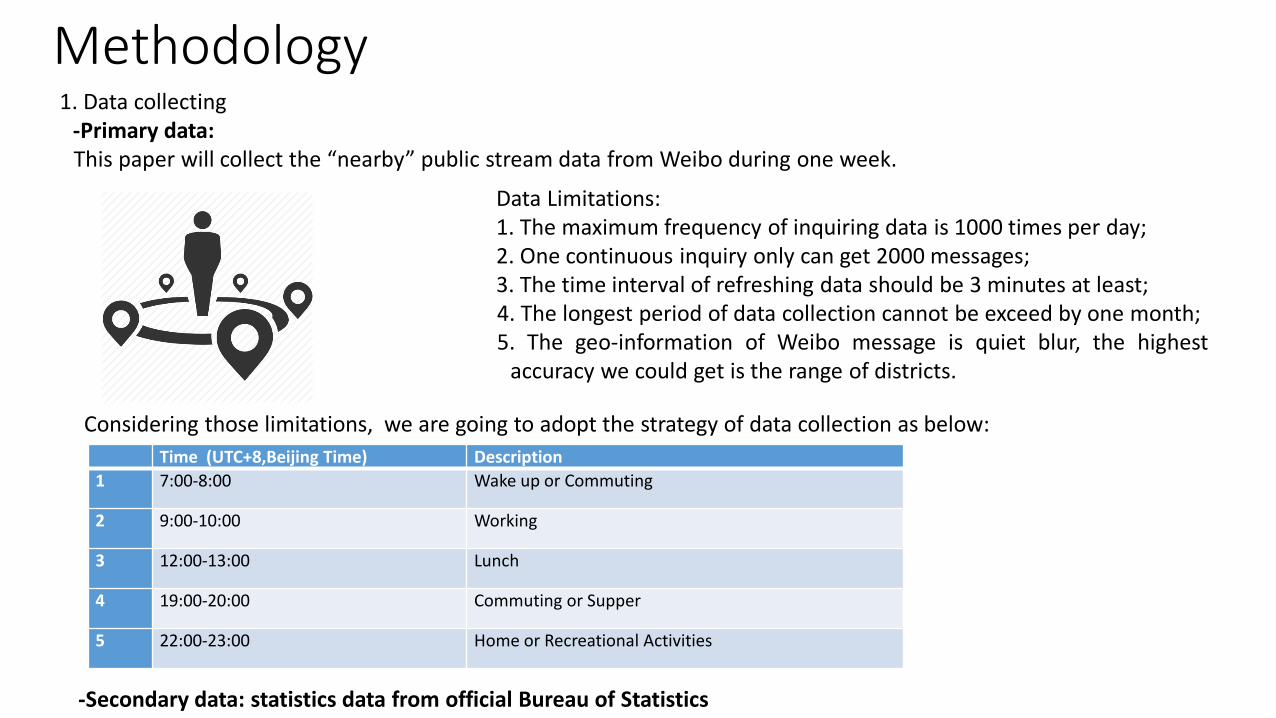
1. Data collecting -Primary data: This paper will collect the “nearby” public stream data from Weibo during one week.
Considering those limitations, we are going to adopt the strategy of data collection as below:
Time (UTC+8,Beijing Time) Description
1 7:00-8:00 Wake up or Commuting
2 9:00-10:00 Working
3 12:00-13:00 Lunch
4 19:00-20:00 Commuting or Supper
5 22:00-23:00 Home or Recreational Activities
Data Limitations: 1. The maximum frequency of inquiring data is 1000 times per day; 2. One continuous inquiry only can get 2000 messages; 3. The time interval of refreshing data should be 3 minutes at least; 4. The longest period of data collection cannot be exceed by one month; 5. The geo-information of Weibo message is quiet blur, the highest
accuracy we could get is the range of districts.
Methodology
-Secondary data: statistics data from official Bureau of Statistics
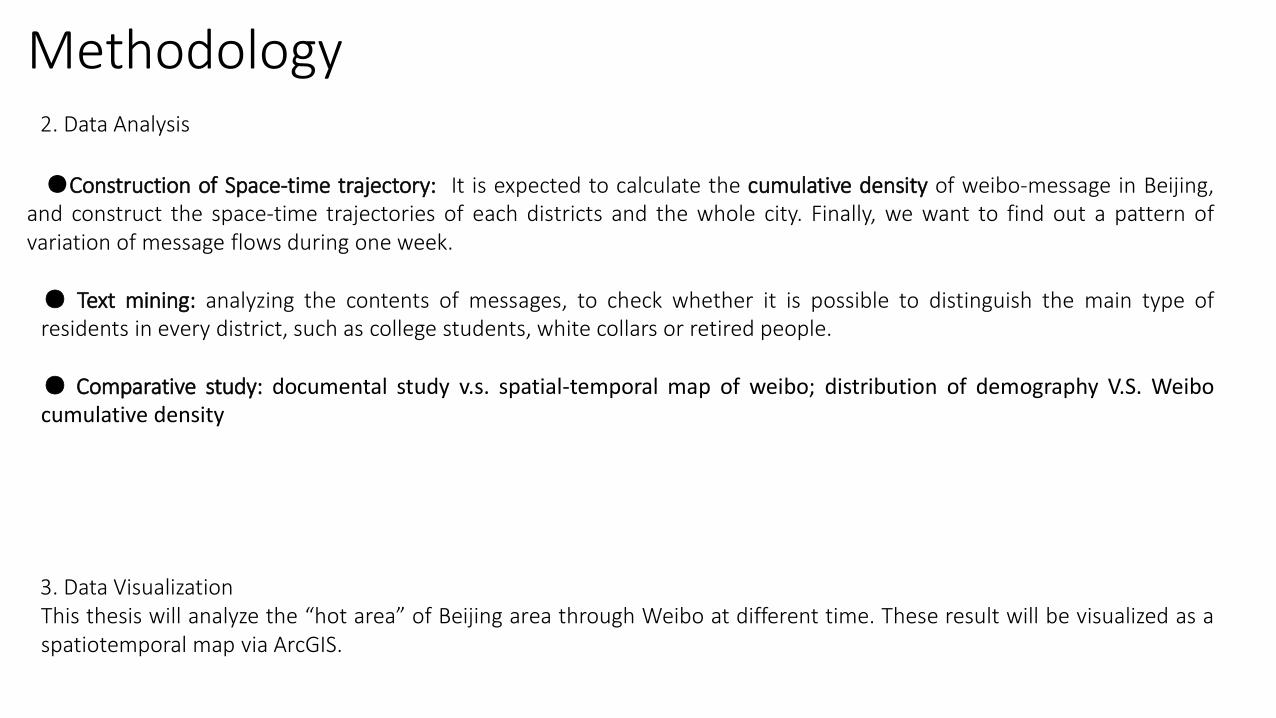
Methodology 2. Data Analysis
●Construction of Space-time trajectory: It is expected to calculate the cumulative density of weibo-message in Beijing,
and construct the space-time trajectories of each districts and the whole city. Finally, we want to find out a pattern of variation of message flows during one week. ● Text mining: analyzing the contents of messages, to check whether it is possible to distinguish the main type of
residents in every district, such as college students, white collars or retired people. ● Comparative study: documental study v.s. spatial-temporal map of weibo; distribution of demography V.S. Weibo
cumulative density
3. Data Visualization This thesis will analyze the “hot area” of Beijing area through Weibo at different time. These result will be visualized as a spatiotemporal map via ArcGIS.
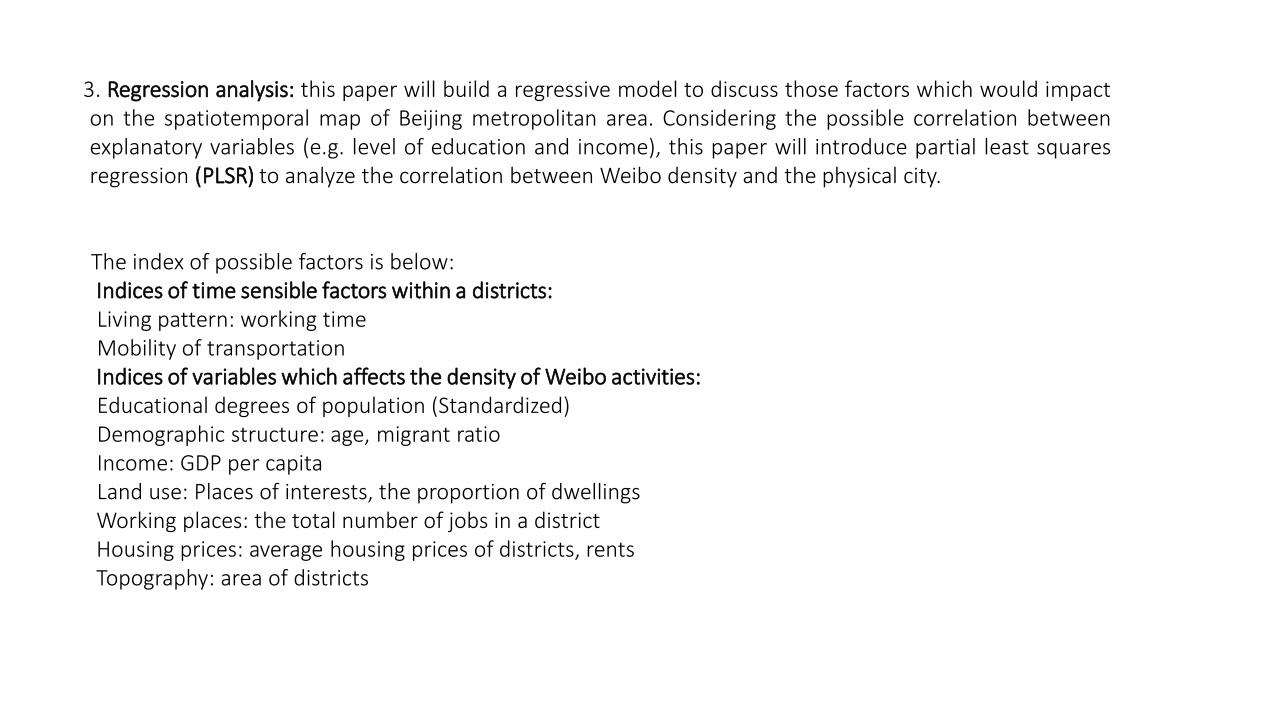
3. Regression analysis: this paper will build a regressive model to discuss those factors which would impact on the spatiotemporal map of Beijing metropolitan area. Considering the possible correlation between explanatory variables (e.g. level of education and income), this paper will introduce partial least squares regression (PLSR) to analyze the correlation between Weibo density and the physical city.
The index of possible factors is below: Indices of time sensible factors within a districts: Living pattern: working time Mobility of transportation Indices of variables which affects the density of Weibo activities: Educational degrees of population (Standardized) Demographic structure: age, migrant ratio Income: GDP per capita Land use: Places of interests, the proportion of dwellings Working places: the total number of jobs in a district Housing prices: average housing prices of districts, rents Topography: area of districts
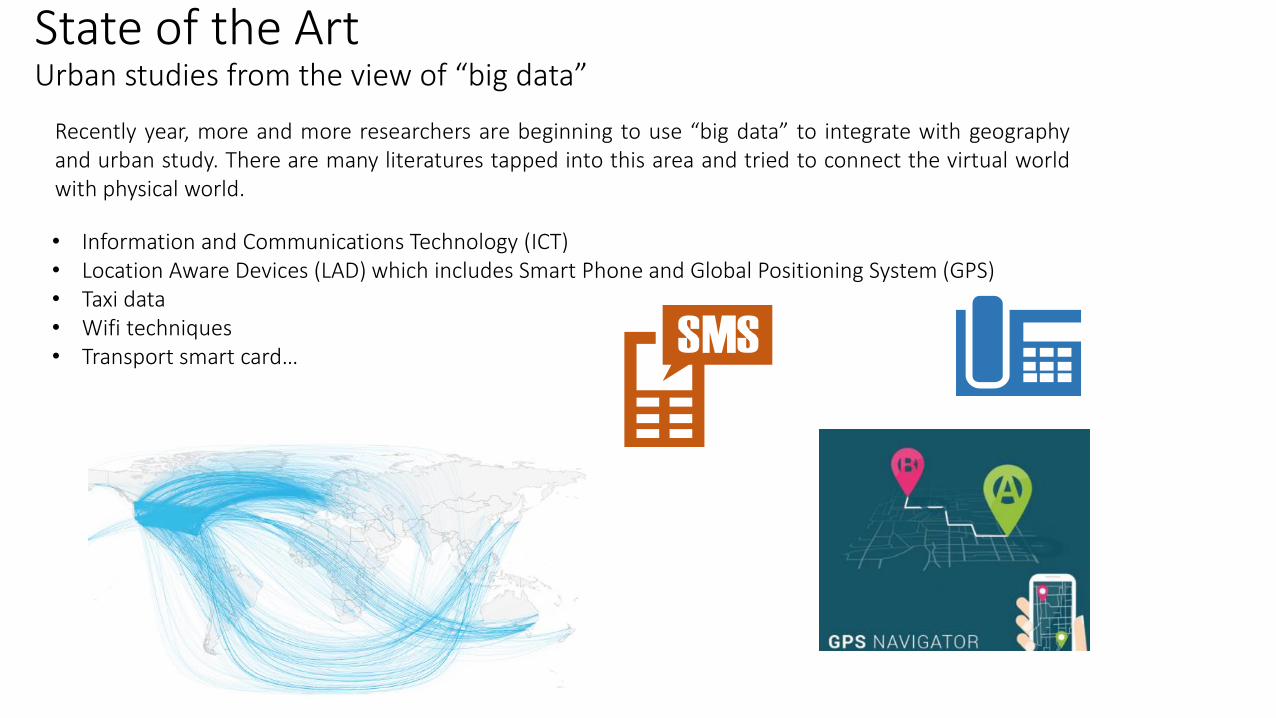
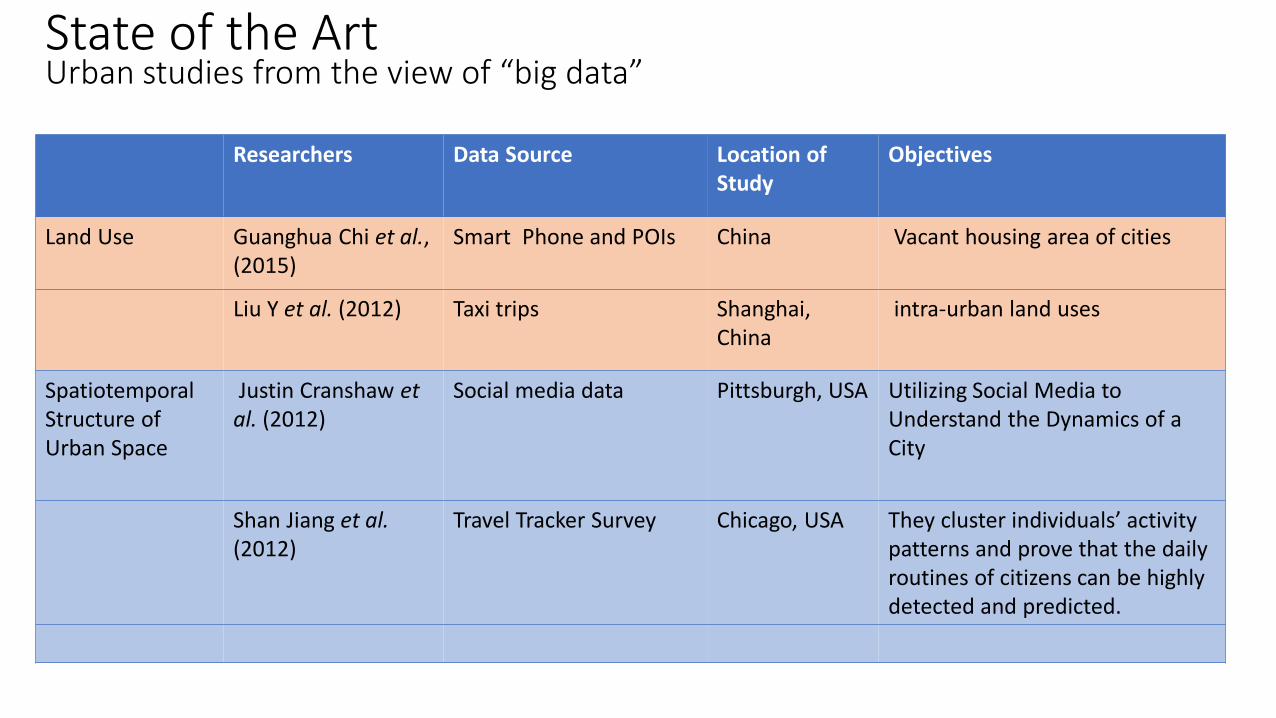
State of the Art Urban studies from the view of “big data”
Recently year, more and more researchers are beginning to use “big data” to integrate with geography and urban study. There are many literatures tapped into this area and tried to connect the virtual world with physical world.
• Information and Communications Technology (ICT) • Location Aware Devices (LAD) which includes Smart Phone and Global Positioning System (GPS) • Taxi data • Wifi techniques • Transport smart card…
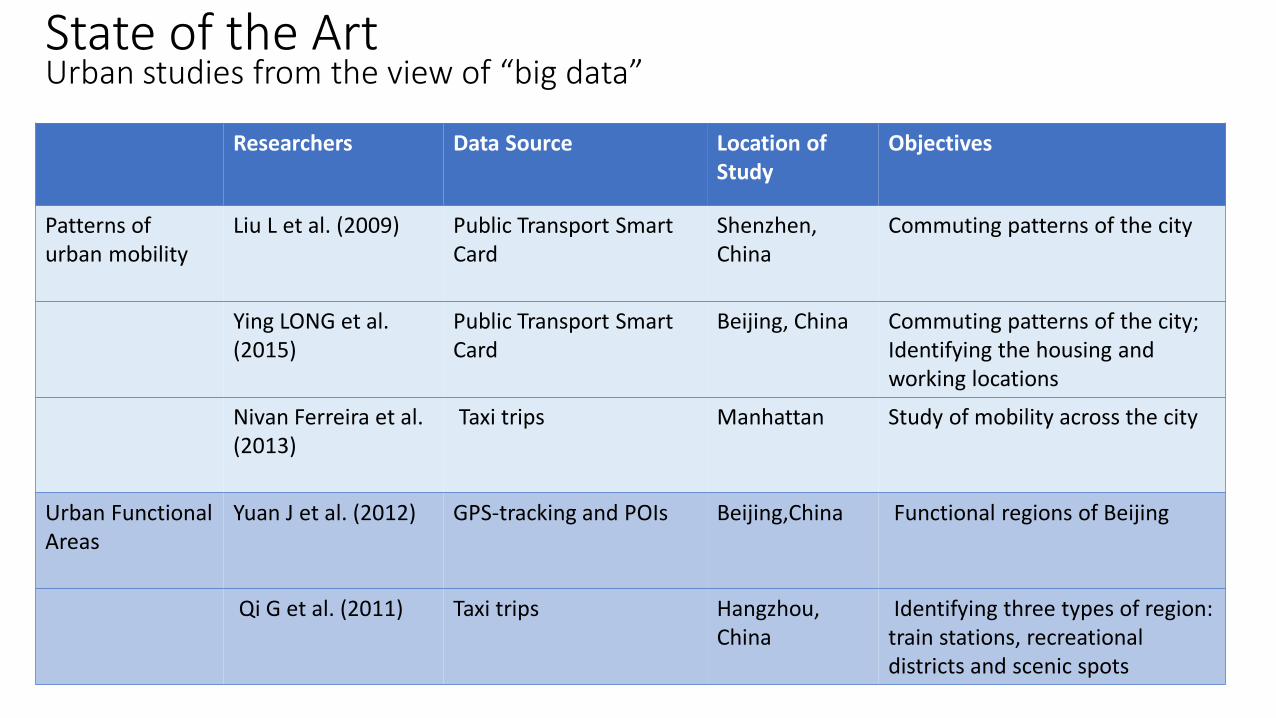
State of the Art Urban studies from the view of “big data”
Researchers Data Source Location of Study
Objectives
Patterns of urban mobility
Liu L et al. (2009) Public Transport Smart Card
Shenzhen, China
Commuting patterns of the city
Ying LONG et al. (2015)
Public Transport Smart Card
Beijing, China Commuting patterns of the city; Identifying the housing and working locations
Nivan Ferreira et al. (2013)
Taxi trips Manhattan Study of mobility across the city
Urban Functional Areas
Yuan J et al. (2012)
GPS-tracking and POIs Beijing,China
Functional regions of Beijing
Qi G et al. (2011)
Taxi trips Hangzhou, China
Identifying three types of region: train stations, recreational districts and scenic spots
Researchers Data Source Location of Study
Objectives
Land Use
Guanghua Chi et al., (2015)
Smart Phone and POIs China Vacant housing area of cities
Liu Y et al. (2012) Taxi trips
Shanghai, China
intra-urban land uses
Spatiotemporal Structure of Urban Space
Justin Cranshaw et al. (2012)
Social media data Pittsburgh, USA Utilizing Social Media to Understand the Dynamics of a City
Shan Jiang et al. (2012)
Travel Tracker Survey Chicago, USA They cluster individuals’ activity patterns and prove that the daily routines of citizens can be highly detected and predicted.
State of the Art Urban studies from the view of “big data”
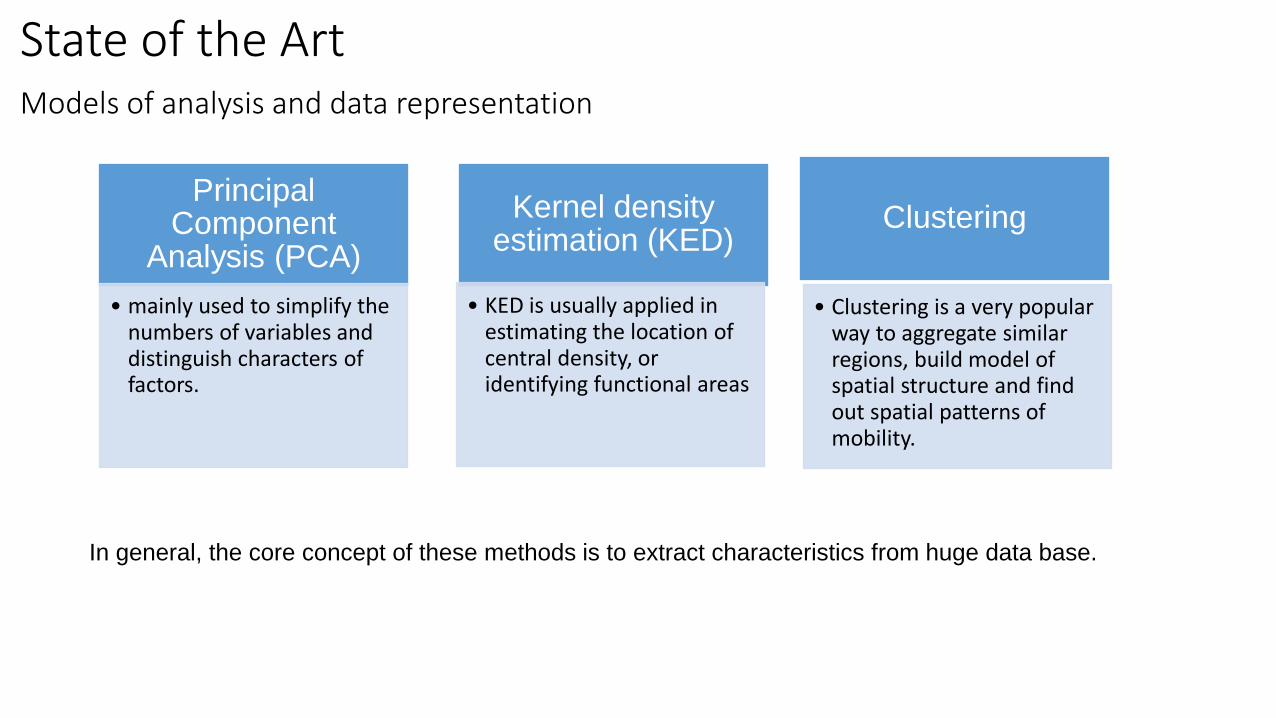
Models of analysis and data representation
Principal Component
Analysis (PCA)
• mainly used to simplify the numbers of variables and distinguish characters of factors.
Kernel density estimation (KED)
• KED is usually applied in estimating the location of central density, or identifying functional areas
Clustering
• Clustering is a very popular way to aggregate similar regions, build model of spatial structure and find out spatial patterns of mobility.
State of the Art
In general, the core concept of these methods is to extract characteristics from huge data base.
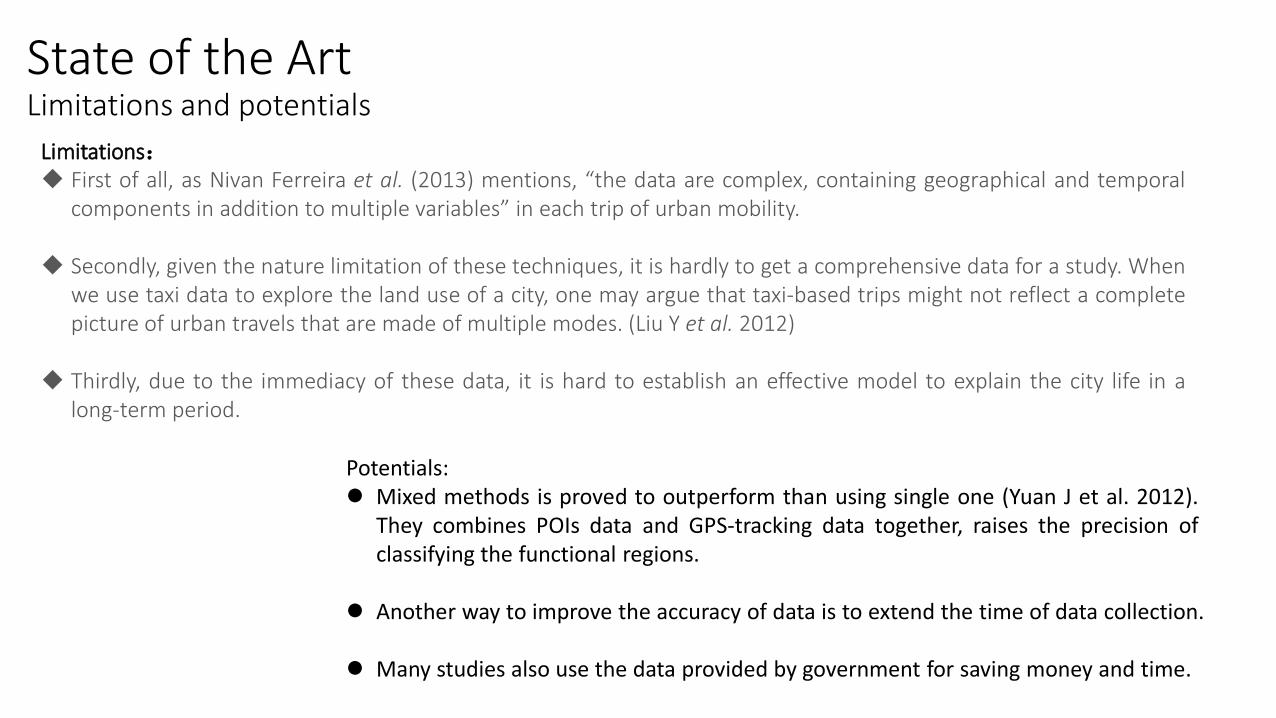
State of the Art Limitations and potentials
Limitations: First of all, as Nivan Ferreira et al. (2013) mentions, “the data are complex, containing geographical and temporal
components in addition to multiple variables” in each trip of urban mobility.
Secondly, given the nature limitation of these techniques, it is hardly to get a comprehensive data for a study. When we use taxi data to explore the land use of a city, one may argue that taxi-based trips might not reflect a complete picture of urban travels that are made of multiple modes. (Liu Y et al. 2012)
Thirdly, due to the immediacy of these data, it is hard to establish an effective model to explain the city life in a long-term period.
Potentials: Mixed methods is proved to outperform than using single one (Yuan J et al. 2012).
They combines POIs data and GPS-tracking data together, raises the precision of classifying the functional regions.
Another way to improve the accuracy of data is to extend the time of data collection.
Many studies also use the data provided by government for saving money and time.
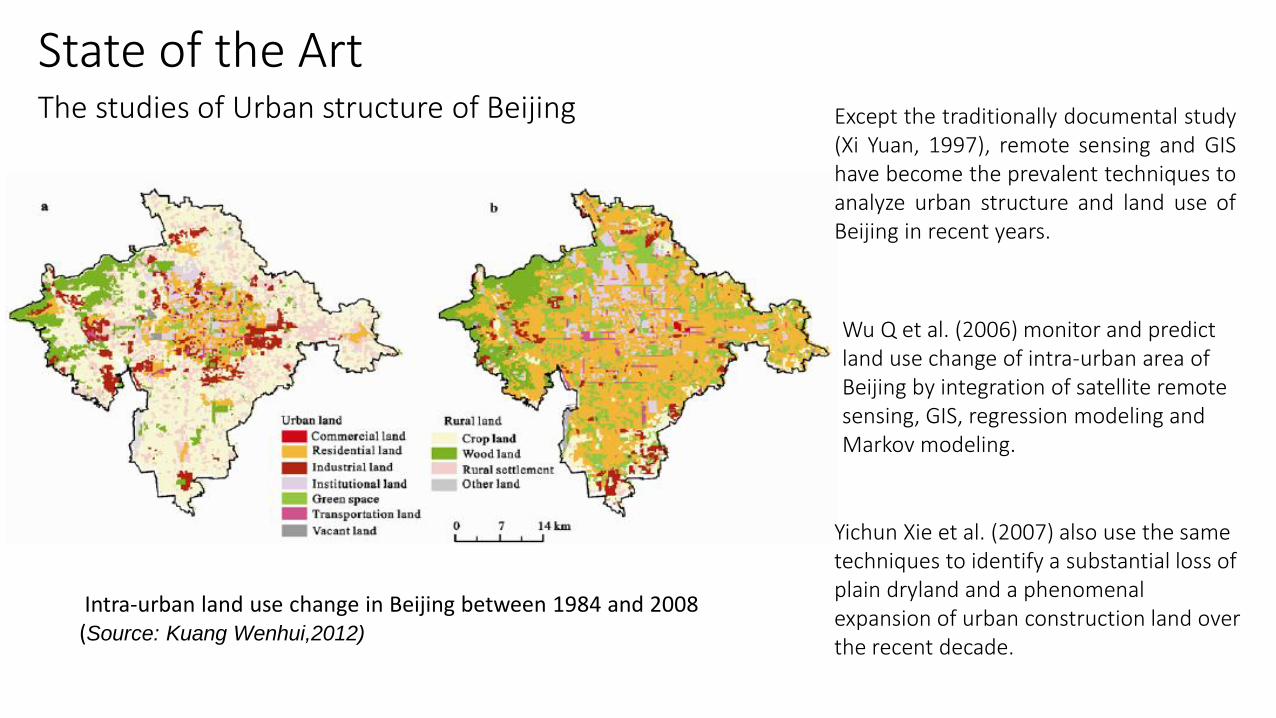
The studies of Urban structure of Beijing
State of the Art Except the traditionally documental study
(Xi Yuan, 1997), remote sensing and GIS have become the prevalent techniques to analyze urban structure and land use of Beijing in recent years.
Wu Q et al. (2006) monitor and predict land use change of intra-urban area of Beijing by integration of satellite remote sensing, GIS, regression modeling and Markov modeling.
Yichun Xie et al. (2007) also use the same techniques to identify a substantial loss of plain dryland and a phenomenal expansion of urban construction land over the recent decade.
Intra-urban land use change in Beijing between 1984 and 2008 (Source: Kuang Wenhui,2012)
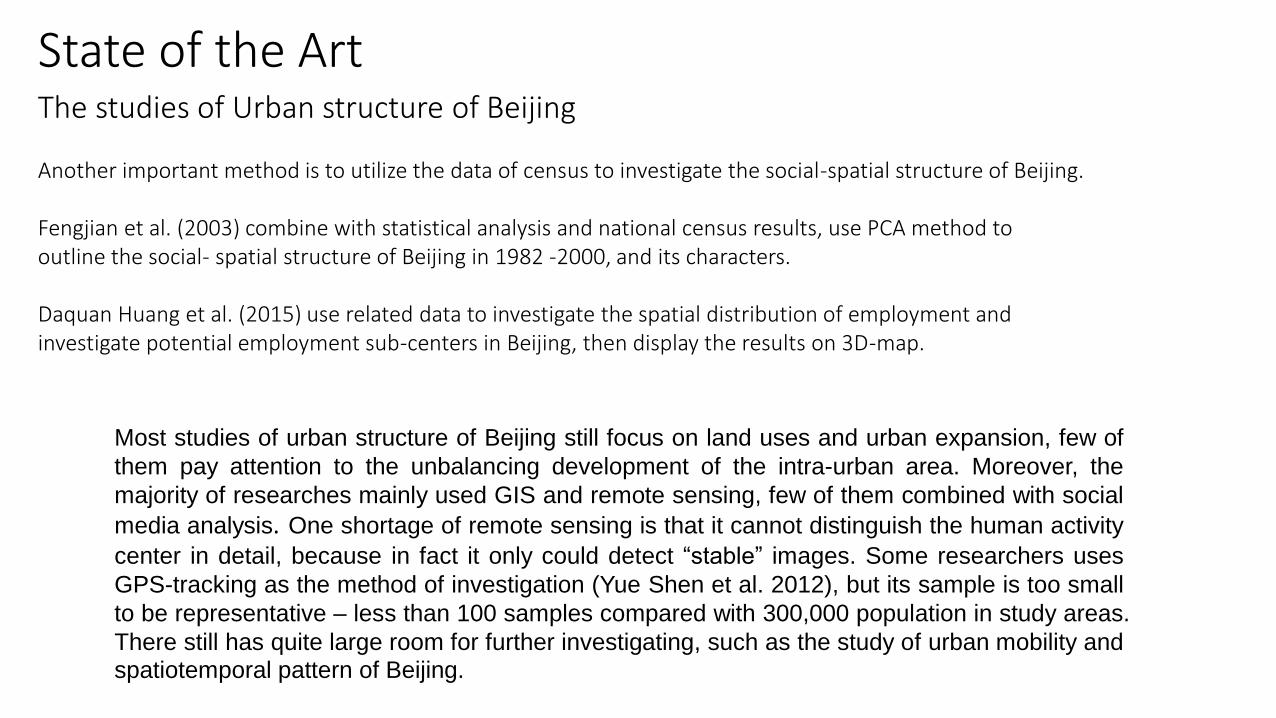
Another important method is to utilize the data of census to investigate the social-spatial structure of Beijing. Fengjian et al. (2003) combine with statistical analysis and national census results, use PCA method to outline the social- spatial structure of Beijing in 1982 -2000, and its characters. Daquan Huang et al. (2015) use related data to investigate the spatial distribution of employment and investigate potential employment sub-centers in Beijing, then display the results on 3D-map.
State of the Art The studies of Urban structure of Beijing
Most studies of urban structure of Beijing still focus on land uses and urban expansion, few of
them pay attention to the unbalancing development of the intra-urban area. Moreover, the
majority of researches mainly used GIS and remote sensing, few of them combined with social
media analysis. One shortage of remote sensing is that it cannot distinguish the human activity
center in detail, because in fact it only could detect “stable” images. Some researchers uses
GPS-tracking as the method of investigation (Yue Shen et al. 2012), but its sample is too small
to be representative – less than 100 samples compared with 300,000 population in study areas.
There still has quite large room for further investigating, such as the study of urban mobility and spatiotemporal pattern of Beijing.
Bibliography
Articles:
• AI Wei, ZHUANG Dafang, LIU Youzha (2008): “The Variation of Urban Land Use in Beijing in the Last One Hundred Years”,in Geo-Information Science 10(4): 489-494.
• Chengri Ding, Xingshuo Zhao(2014,): “Land market, land development and urban spatial structure in Beijing” , in Land Use Policy 40(40):83-90.
• Daquan Huang, Zhen Liu and Xingshuo Zhao(2015): Monocentric or Polycentric? The Urban Spatial Structure of Employment in Beijing” in Sustainability, 7(9), 11632-11656
• Feixiong Luo, Guofeng Cao, Kevin Mulligan, Xiang Li(2015): “Explore Spatiotemporal and Demographic Characteristics of Human Mobility via Twitter: A Case Study of Chicago”.
• Feng Jian, Zhou Yixing (2003) “The social spatial structure of Beijing Metropolitan Area and its evolution : 1982 – 2000” in Geographical Research, 22 (4), pp. 465-483.
• Harvey J. Miller (2005):“A Measurement Theory for Time Geography” in Geographical Analysis Vol.37, Issue 1, pp.17–45.
• Jing Yuan,Yu Zheng, Xing Xie(2012): “Discovering Regions of Different Functions in a City Using Human Mobility and POIs” in KDD 2012, ACM, 12.
Books: 1. Beijing Census 2010 2. Edward W. Soja(2000): Postmetropolis—Critical Studies of Cities and Regions, Wiley-Blackwell 3.The Castell reader on Cities and social theory, edited by Ida Susser, (2002), Blackwell Publisher Inc. 4. Michael Pacione (2011): Urban Geography – A global perspective, Routledge
• Linna Li , Michael F. Goodchild & Bo Xu(2013): “Spatial, temporal, and socioeconomic patterns in the use of Twitter and Flickr” in Cartography and Geographic Information Science, Vol 40, Issue 2,pp. 61-77.
• ROCA, J; MOIX, M. y MARMOLEJO, C. (2009): “Urban Structure and Polycentrism: Towards a Redefinition of the Sub-centre Concept”, in Urban Studies, 46(13) 2841–2868.
• Shan Jiang, Joseph Ferreira, Jr. ,Marta C. Gonzalez (2012) “Discovering Urban Spatial Temporal Structure from Human Activity Patterns”, in Proceedings of the ACM SIGKDD International Workshop on Urban Computing, pp. 95-102. Beijing, China
• Stephens, M., & Poorthuis, A. (2014): Follow thy neighbor: “Connecting the social and the spatial networks on Twitte” in Computers, Environment and Urban Systems, the available source is http://dx.doi.org/10.1016/j.compenvurbsys.2014.07.002
• Torsten Hägerstrand(1970): “What about people in regional science?”, in Regional Science Vol24, Issue 1, pp. 7–24.
• Ye Zhi, Yu Liu, Shaowen Wang, Min Deng, Jing Gao, Haifeng Li (2014):“Urban spatial-temporal activity structures: a New Approach to Inferring the Intra-urban Functional Regions via Social Media Check-In Data”, link: arXiv:1412.7253
• Yichun Xie, Chuanglin Fang, George C.S. Lin, Hongmian Gong and Biao Qiao ( 2007): “Tempo-Spatial Patterns of Land Use Changes and Urban Development in Globalizing China: A Study of Beijing”, in Sensors, 7(11), 2881-2906.
• Ying LONG, Jean-Claude THILL(2015): “Combining smart card data and household travel survey to analyze jobs-housing relationships in Beijing” in Computers, Environment and Urban Systems, Vol.53, pp.19–35.
Justin Cranshaw, Raz Schwartz, Jason I. Hong, Norman Sadeh(2012) “The Livehoods Project: Utilizing Social Media to Understand the Dynamics of a City” in International AAAI Conference on Weblogs and Social Media, p. 58. Kuang Wenhui (2012) “Spatio-temporal Patterns of Intra-urban Land Use Change in Beijing, China Between 1984 and 2008” in Chinese Geographical Science, 22(2), pp. 210–220. Liang Liu, Anyang Hou, Assaf Biderman, Carlo Ratti, Jun Chen (2009): “Understanding individual and collective mobility patterns from smart card records: a case study in Shenzhen”, in IEEE.pp.384-388.

Thank you