Embed Size (px)
Citation preview

������������� ���������
������������ ���
��������������������������� !��������"#��
����������������� ����������������
��$ ���%�����&��"'�(��$)*$�
���%��+�����,�� �-��.�/��
�����0�0����������1���2
��������������
����������
���)�
������������������������������ !����"� #�$�������������%��&��' �� #�(��)'�����*�(��������+#�,-.�(���/�0$�������*"���� � �������12"#���*��'��*���� ��3(� #�(���#�4������5���"���#�*�� 67� #��/�0$������� ���/-�0� �8+��$�� #� �#�9*��.��%��&��' ���8+.#�'"���.�������2# #�� :� �����!��*��� �*"���+#�;<=� $������������� #�(��)'�����*�(��������+#����>?@�2��#�"���� 9�AB(���*������� C*���� ������D2��/�0$�����������*����+#���� � ;=��������.��2"#$������������� #�(���/�0$�������*"����.������2�#�2��2���9�*#�"��%�*�4��%�4"����.�/�0$������*��>?@�2���+##���� � �*�� � ;:=� ����������������� �������.������*"���2*#��������������3� �����������.�������� �8+.#�#+�#2"#��� ���2��#�"����.��+� #��/�0$���%���������*�������5��4"����
�#�������� ��������������������BE-� � ����.�����1 #�(���������%������5�2���*�����������8��������"��(��)'�����*�(��������+#�� �*������������������1 #��*��)����(� �*�*����8�F��2*���������� #�������5�#�"����.�2"#���>?@�2��#�"����.��+� #��/�0$���2"#���
������������������������������������� ���� ��� !�"�#$%����&������'���(�������� �)�����*�#��+�,"��
������ ���
����������������� !"��#�$%&��%'()*!�+�,-.��/)0�1�/)��021���������34�5%�678/).!#��'�).��)+�,��98/)�#:9)���1:!!;:)!5#<�)�6!7=:%'0218#9�;0.>9?)&%0218/)�#:9)�8(%&%0.>9?)&%8/).!#��*);?>*��.2@�-�8>*���9���;�2A)��!#*�!@����021����B)C+B%D�8%+B%:�2021���597E6#: %D�8���8*:'):+�;*%��!)1.E�9%�+��B�!:%'�8)��F��)�:)!�9%��B3+"�8/).!#�:)!'# +/)���;�2A)�B�!:%'���021��������� !"�3G&%� %7�+#&�'):+�;:2��+BE�F��)�:)!�9%��8)��F��)�:)!�9%��8/).!#��/)0�1�/)-�:)!�!����!��9�+�*);�021�5@,��5�#:9)�8)��F��)�:)!�9%�+�,-.�:/)2#9-'021:)!8�#�8�����>)9 ��%,9
1
BOT Symposium 2003
Balance Sheets and Economic Recovery
Chirathep Senivongs na Ayudhya
Pornvipa Tangcharoenmonkong
Thitima Chucherd
Monetary Policy Group
August 2003
Abstract
This paper assesses the current strength of balance sheets of the corporate and household sectors that together account, through private investment and consumption, for over 70 percent of the Thai economy. On the basis of the available data, it seeks to answer three questions. First, have the balance sheet conditions of corporations and households recovered fully from the crisis? Second, what are the risks associated with these sectoral balance sheets that should be monitored closely as the economy recovers? Third, how should such risks be managed and monetary policy conducted in order to facilitate medium-term sustainable growth?
This paper also analyzes the important role of the financial sector in intermediating resources between corporations and households, and highlights the importance of good governance and financial market development in sustaining the economic recovery.
The authors are grateful to Dr. Bandid Nijathaworn for his support and guidance. Special thanks go to staffs at NESDB and NSO for their kind assistance on the household data and to Khatharit Sitthikul and Pongsak Sooksawak, Economists of Business Finance Analysis Team, Monetary Policy Group, BOT, for their initiatives and efforts in constructing the corporate sector data. We would also like to thank Dr. Piti Disyatat, Economist, Monetary Policy Strategy Team, for his editorial comments and our colleagues in the Monetary Policy Group for their technical and moral supports.
The views expressed in this paper are those of the authors and do not necessarily represent those of the BOT.
2
Contents Page
I. Introduction ........................................................................................... 1
II. Balance Sheet Adjustments of Thailand’s Corporate Sector................. 2 2.1 Overview of Adjustments.............................................................. 2 2.2 Adjustments of Four Key Sectors.................................................. 6
2.3 Outlook for Corporate Balance Sheet Expansion.......................... 9
III. Balance Sheet Adjustments of The Thai Household ............................. 11 3.1 Development of Households’ Income ........................................... 12 3.2 Changes in Households’ Wealth ................................................... 14 3.3 Adjustment in Households’ Consumption .................................... 18 3.4 Debt Accumulation........................................................................ 20
IV. Implications for Economic Recovery, Risk Management, and Monetary Policy..................................................................................... 27
4.1 Implications for the Economic Recovery ...................................... 27 4.2 Implications for Risk Management and Financial Market
Development ................................................................................. 28 4.3 Implications for Monetary Policy.................................................. 30
V. Conclusion............................................................................................. 31
VI. Appendix
References
3
Tables
Table 3.1 Real Personal Income Growth........................................................... 13 Table 3.2 Share of Total Personal Income ........................................................ 13 Table 3.3 Contribution to Growth of Personal Income ..................................... 13 Table 3.4 Average Share of Household Savings ............................................... 15 Table 3.5 Share of Total Personal Expenses ..................................................... 19 Table 3.6 Contribution to Growth of Personal Expenses .................................. 19 Table 3.7 Average Debt per Household by Group ............................................ 22 Table 3.8 Average Debt per Household (Relative to 1994) .............................. 22 Table 3.9 Socio-Economic Class of Households .............................................. 25
Figures
Figure 2.1A Growth of Sales, Cost of Sales, and Gross Profit of Non-Bank Listed Companies .............................................................................. 3
Figure 2.1B Operating Asset, Total Asset Turnover, and Adjusted EBIT / Sales of Non-Bank Listed Companies ....................................................... 3
Figure 2.1C Interest Expense and Interest / Sales of Non-Bank Listed Companies......................................................................................... 3
Figure 2.1D Liquidity and Interest Coverage Ratio of Non-Bank Listed Companies......................................................................................... 4
Figure 2.1E Asset Component of Non-Bank Listed Companies ex PTT.............. 4 Figure 2.1F Total Liabilities of Non-Bank Listed Companies.............................. 4 Figure 2.2 Non-Bank Listed Companies’ Source of Short-Term Financing ...... 5 Figure 2.3 Financial Condition ........................................................................... 5 Figure 2.4 D/E of Non-Bank Listed Companies................................................. 6 Figure 2.5 D/E of Non-Bank Listed Companies................................................. 6 Figure 2.6 Non-Bank Listed Companies’ Component of Equities ..................... 6 Figure 2.7 Sectoral Development (1).................................................................. 7 Figure 2.8 Accumulated Debt-Equity Swap from Debt Restructuring............... 7 Figure 2.9 Private External Debt ........................................................................ 7 Figure 2.10 NPL Increase in Major Sectors.......................................................... 8 Figure 2.11 Financial Structure of Non-Bank Listed Companies......................... 8 Figure 2.12 Adjusted ROA and Tobin’s Q Ratio of Non-Bank Listed
Companies......................................................................................... 9 Figure 2.13 Sectoral Development (2).................................................................. 10 Figure 3.1 Thailand Economic Conditions ......................................................... 11 Figure 3.2 Growth of Personal Income............................................................... 12 Figure 3.3 Disposable Income per Capita........................................................... 14 Figure 3.4 Structure of Household Aggregate Balance Sheet............................. 14 Figure 3.5 Average Net Change in Households’ Assets During a Month .......... 15 Figure 3.6 Real Interest Rates............................................................................. 15 Figure 3.7 SET Index.......................................................................................... 17 Figure 3.8 Value of Land Trades ........................................................................ 17 Figure 3.9A Property Development Index............................................................. 17
4
Figure 3.9B Property Development Index (Before and After Crisis) .................... 17 Figure 3.10 New Registration of Residential Housing ......................................... 17 Figure 3.11 Construction Material Price Index..................................................... 17 Figure 3.12 Households’ Savings ......................................................................... 18 Figure 3.13 Household Expenditure on Low-Level Necessity ............................. 18 Figure 3.14 Average Debt per Household ............................................................ 22 Figure 3.15 Consumer Credits .............................................................................. 22 Figure 3.16 Debt Burden ...................................................................................... 24 Figure 3.17A Source of Debt................................................................................... 24 Figure 3.17B Source of Debt................................................................................... 24 Figure 3.18 Interest Burden of Households .......................................................... 25 Figure 3.19 Deposit by Size (Number of Accounts)............................................. 26 Figure 3.20 Deposit by Size (Amount) ................................................................. 26 Figure 3.21 Change in Households’ NPL............................................................. 26
1
I. Introduction The 1997 economic and financial crises brought a significant shock to Thailand’s
external sector and the domestic economy. As a result, substantial adjustments took place in spending and savings, as well as stock of assets and liabilities. These adjustments have varied in both degree and form across households, corporations, government, and financial institutions, with important implications for economic recovery, fiscal sustainability, and financial system soundness.
At this juncture, the Thai economy has strengthened markedly on the external front, with sustained current account surpluses, strong international reserves, and much reduced external debt. Despite the increase in total public debt following the fiscal stimulus and fiscalization of financial sector adjustment costs, the progress of fiscal consolidation has been faster than expected, driven by buoyant revenue in tandem with the momentum of overall economic recovery. Indeed, the external and public sectors accounted for about 23 percent on the demand side of nominal GDP at end-2003 Q1.
In managing the challenges of the recovery, policy makers need to have a good grasp of what had been the adjustments of consumption and investment, which made up 73 percent of GDP. In assessing the prospects of private consumption and investment, it is essential to analyze key financial variables influencing consumption and investment, and thus to examine the adjustment of corporations and households. To this end, this paper analyses the adjustment in financial conditions of the corporate and household sectors in Thailand from the 1997 crisis up to the present. Our task focuses on exploring how corporations and households, after reducing assets and restructuring liabilities in response to the crisis, have expanded assets during the recovery process. Now that the growth momentum is solidifying, we also examine how these two sectors re-accumulate liabilities, particularly debt, and assess their debt service capacity.
The paper aims to answer three key questions pertinent to medium-term macroeconomic and monetary policy formulation. First, are current financial conditions of Thai households and corporations supportive of the present economic recovery process? Second, over the medium term, what are the risks associated with these sectoral balance sheets that should be monitored closely? Third, how could such risk management as well as monetary policy be carried out effectively?
The paper is organized in six sections. After this introduction, Section II traces the adjustments of the non-bank corporate sector to assess whether its financial conditions have sufficiently improved to support the economic recovery, and to identify remaining pockets of weaknesses. Section III focuses on changes in the financial conditions of households, particularly their responses to changes in nominal and real income and wealth in terms of adjustments in spending, saving, and financing behaviours, and how these behaviours could be affected by continuing economic growth.
Section IV highlights three areas of policy implications. First is the implication of the outlook financial conditions of corporate and household sectors on the prospects of economic recovery. This is followed by policy considerations relating to the management of risks associated with the growth process and on financial market development, focusing also on implications on the financial intermediary function of banks. Finally, the paper discusses the challenges posed by the expansion of corporate and household balance sheets to the conduct of monetary policy over the medium term. The paper closes with Section V and VI, for conclusion and data appendices, respectively.
2
II. Balance Sheet Adjustments of Thailand’s Corporate Sector After six years of restructuring in response to the 1997 crisis, the aggregate
balance sheet of non-bank companies1 listed in the SET has improved considerably, particularly in terms of profitability and liquidity. Our key findings are that (1) operational and financial improvements were primarily driven by overall economic growth that helped accelerate sales and earnings, as well as declining interest rates that encouraged firms to switch to cheaper debt sources; but (2) there remain pockets of weaknesses that could constrain corporate balance sheet expansion. To elaborate on these findings, this section of the paper first reviews developments in corporate profitability and solvency from 1997 Q2 up to 2003 Q1. It then focuses on the asset and liability adjustment and prospects for expansion, paying particular attention to four key sectors, namely commerce, manufacturing, construction, and real estate, chosen for mapping balance sheet adjustments with broader developments in consumption, investment, and property markets, respectively.
In analyzing these sectors, SET data were reclassified according to the International Standard Industrial Classification (ISIC) to reassign firms, particularly those classified as rehabilitation companies, in accordance with core business functions. As a result, profitability and solvency measures, as well as assets and liabilities of listed non-bank firms presented in this section are different from those reported by the SET. 2.1 Overview of Adjustments
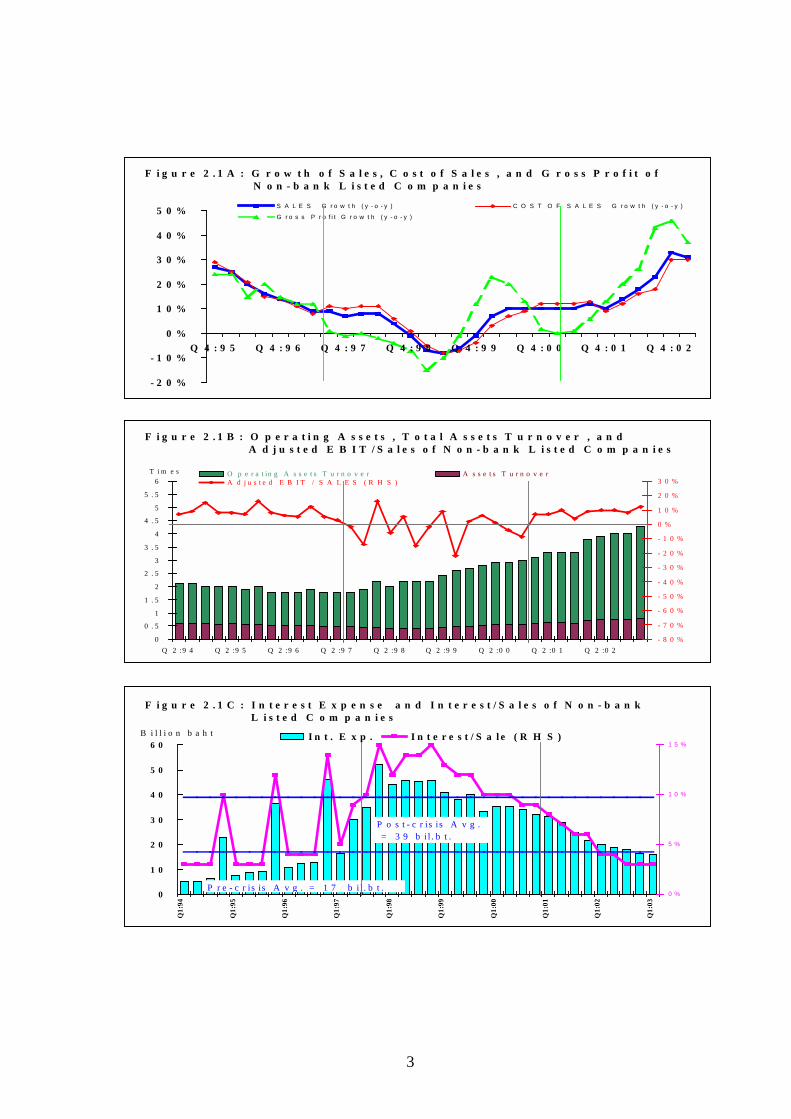
Prior to the 1997 crisis, non-bank companies listed in the SET diversified from core businesses, which had become less competitive, and turned to the rising asset prices. From 1994 to 1997 Q2, they increased debt to expand asset base despite the moderating growth in sales and gross profit and the rising average borrowing cost (Figure 2.1A). Although the ratio of earnings before interest and tax (EBIT) to sales was relatively stable, the operating asset turnover had been falling (Figure 2.1B). When the 1997 crisis hit, the profitability and solvency strengths of Thailand’s corporate sector were already weak. Following the crisis, gross profit and interest rate coverage dropped sharply as interest expenses jumped, owing to sharp exchange rate depreciation and interest rate increases (Figure 2.1C). Indeed, interest expenses remained at high levels throughout 1998-2000.
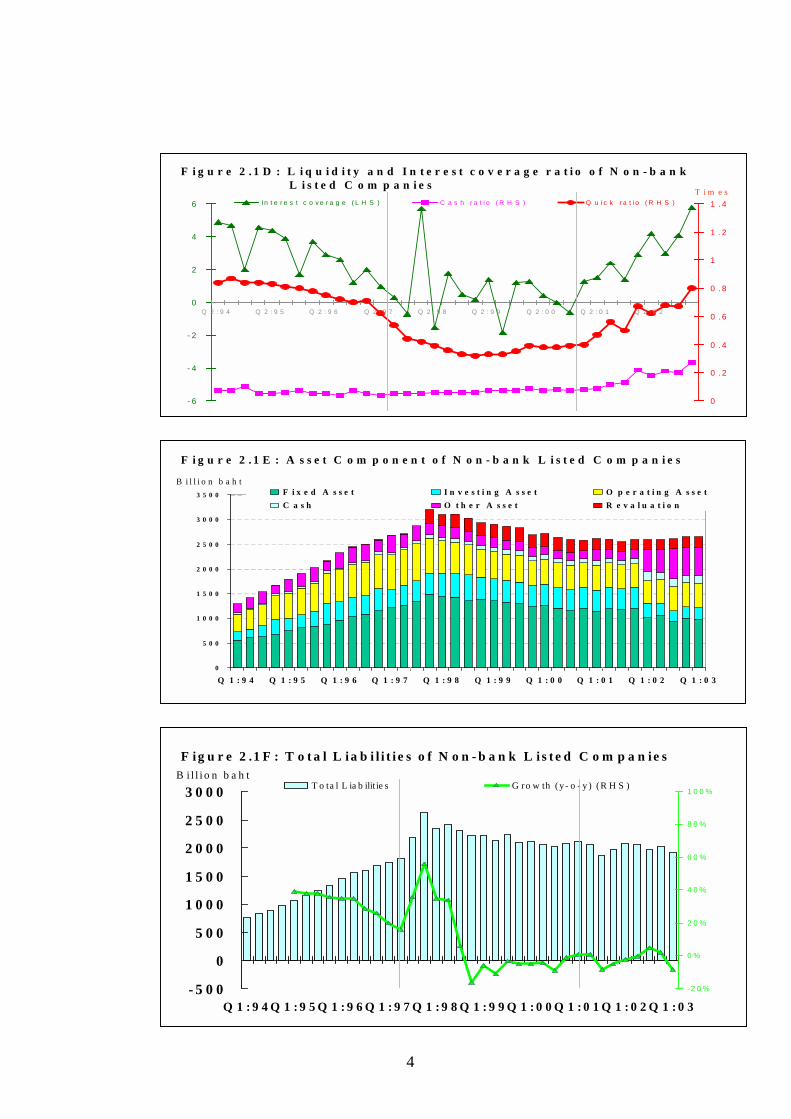
In adjusting to the crisis, Dupont-type ratios (definitions in Part VI) namely the operating asset turnover, the ratio of EBIT over sales, and the return on assets, showed noticeable improvements as the country’s growth momentum strengthened since 2001. This was in contrast to the marked deterioration of these indicators from 1997 Q2, before stabilizing in 1999 and improving somewhat from then to 2000 Q4. During these same periods, liquidity conditions, as represented by the Quick and Cash ratios, changed in line with profitability performance and the economy’s overall growth. Together with the downtrend of lending rates, the reduction in total corporate liabilities, and substitution away from bank loans towards cheaper debt sources, the debt service capacity of the corporate sector improved significantly. This was evidenced by higher interest coverage and interest to sales ratios (Figure 2.1D), which measure the ability of firms to use gross profit for interest expenses and proportion of sales used for interest payments, respectively.
1 Excluding banks, finance and securities companies, insurance companies, warehouse and silo companies.
3
0
0 . 5
1
1 . 5
2
2 . 5
3
3 . 5
4
4 . 5
5
5 . 5
6
Q 2 :9 4 Q 2 :9 5 Q 2 :9 6 Q 2 :9 7 Q 2 :9 8 Q 2 :9 9 Q 2 :0 0 Q 2 :0 1 Q 2 :0 2- 8 0 %
- 7 0 %
- 6 0 %
- 5 0 %
- 4 0 %
- 3 0 %
- 2 0 %
- 1 0 %
0 %
1 0 %
2 0 %
3 0 %O p e r a t in g A s s e t s T u r n o v e r A s s e t s T u r n o v e rA d j u s t e d E B I T / S A L E S ( R H S )
T i m e s
F i g u r e 2 . 1 B : O p e r a t i n g A s s e t s , T o t a l A s s e t s T u r n o v e r , a n d A d j u s t e d E B I T / S a l e s o f N o n - b a n k L i s t e d C o m p a n i e s
- 2 0 %
- 1 0 %
0 %
1 0 %
2 0 %
3 0 %
4 0 %
5 0 %
Q 4 : 9 5 Q 4 : 9 6 Q 4 : 9 7 Q 4 : 9 8 Q 4 : 9 9 Q 4 : 0 0 Q 4 : 0 1 Q 4 : 0 2
S A L E S G r o w t h ( y - o - y ) C O S T O F S A L E S G r o w t h ( y - o - y )
G r o s s P r o f i t G r o w t h ( y - o - y )
F i g u r e 2 . 1 A : G r o w t h o f S a l e s , C o s t o f S a l e s , a n d G r o s s P r o f i t o f N o n - b a n k L i s t e d C o m p a n i e s
0
1 0
2 0
3 0
4 0
5 0
6 0
Q1:
94
Q1:
95
Q1:
96
Q1:
97
Q1:
98
Q1:
99
Q1:
00
Q1:
01
Q1:
02
Q1:
03
0 %
5 %
1 0 %
1 5 %I n t . E x p . I n t e r e s t / S a l e ( R H S )
P r e - c r is is A v g . = 1 7 b i l . b t .
P o s t - c r is is A v g . = 3 9 b i l . b t .
B i l l i o n b a h t
F i g u r e 2 . 1 C : I n t e r e s t E x p e n s e a n d I n t e r e s t / S a l e s o f N o n - b a n k L i s t e d C o m p a n i e s
4
- 6
- 4
- 2
0
2
4
6
Q 2 : 9 4 Q 2 : 9 5 Q 2 : 9 6 Q 2 : 9 7 Q 2 : 9 8 Q 2 : 9 9 Q 2 : 0 0 Q 2 : 0 1 Q 2 : 0 2
0
0 . 2
0 . 4
0 . 6
0 . 8
1
1 . 2
1 . 4In t e r e s t c o v e r a g e ( L H S ) C a s h r a t i o ( R H S ) Q u i c k r a t i o ( R H S )T i m e s
F i g u r e 2 . 1 D : L i q u i d i t y a n d I n t e r e s t c o v e r a g e r a t i o o f N o n - b a n kL i s t e d C o m p a n i e s
0
5 0 0
1 0 0 0
1 5 0 0
2 0 0 0
2 5 0 0
3 0 0 0
3 5 0 0
Q 1 : 9 4 Q 1 : 9 5 Q 1 : 9 6 Q 1 : 9 7 Q 1 : 9 8 Q 1 : 9 9 Q 1 : 0 0 Q 1 : 0 1 Q 1 : 0 2 Q 1 : 0 3
F i x e d A s s e t I n v e s t i n g A s s e t O p e r a t i n g A s s e tC a s h O t h e r A s s e t R e v a l u a t i o n
B i l l i o n b a h t
F i g u r e 2 . 1 E : A s s e t C o m p o n e n t o f N o n - b a n k L i s t e d C o m p a n i e s
- 5 0 0
0
5 0 0
1 0 0 0
1 5 0 0
2 0 0 0
2 5 0 0
3 0 0 0
Q 1 : 9 4 Q 1 : 9 5 Q 1 : 9 6 Q 1 : 9 7 Q 1 : 9 8 Q 1 : 9 9 Q 1 : 0 0 Q 1 : 0 1 Q 1 : 0 2 Q 1 : 0 3-2 0 %
0 %
2 0 %
4 0 %
6 0 %
8 0 %
1 0 0 %T o ta l L ia b ilit ie s G ro w th (y - o - y ) (R H S )
B i l l i o n b a h t
F i g u r e 2 .1 F : T o t a l L i a b i l i t i e s o f N o n - b a n k L i s t e d C o m p a n i e s
5
0%
5%
10%
15%
20%
25%
Q2:94 Q2:95 Q2:96 Q2:97 Q2:98 Q2:99 Q2:00 Q2:01 Q2:02
OD Loan for relatedTrade Payable Trade Receivable
% of asset
Figure 2.2: Non-bank Listed Companies’ Source of Short-termFinancing
0%
2%
4%
6%
8%
10%
12%
14%
16%
18%
Q4:94 Q4:95 Q4:96 Q4:97 Q4:98 Q4:99 Q4:00 Q4:01 Q4:0205101520253035404550Avg. Borrowing rate MLR ฿/$
Figure 2.3: Financial Condition
The key developments underlying these ratio changes were:
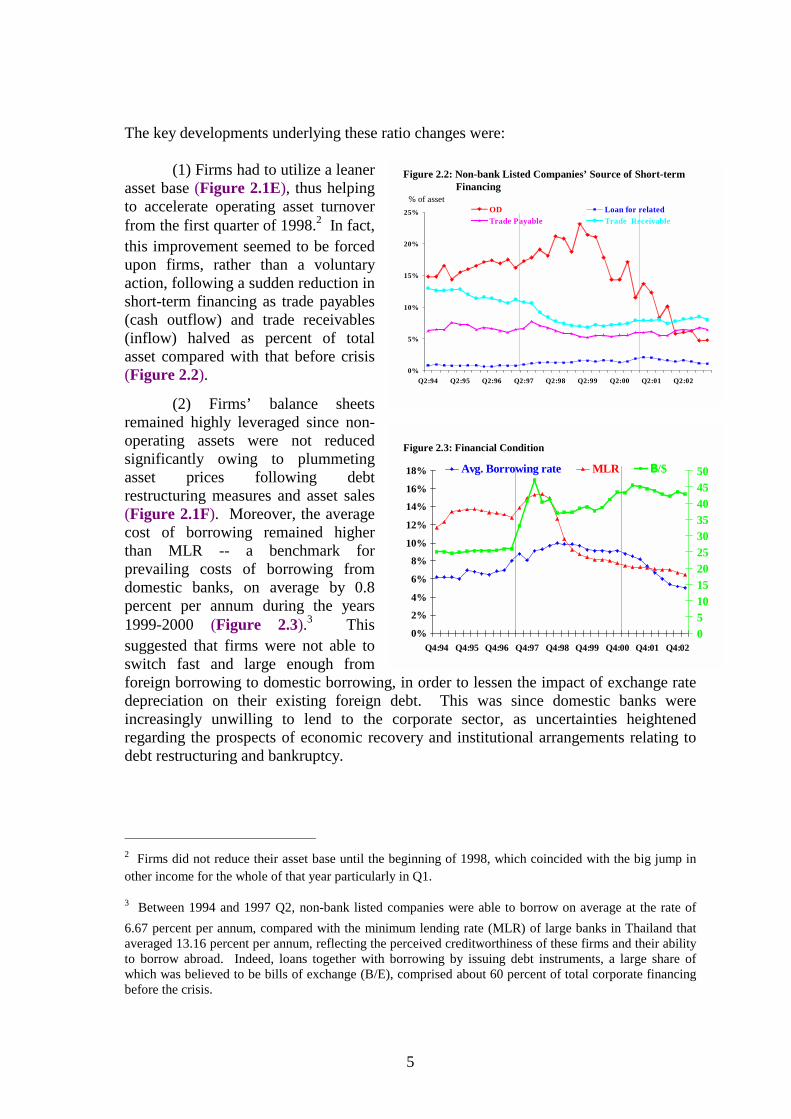
(1) Firms had to utilize a leaner asset base (Figure 2.1E), thus helping to accelerate operating asset turnover from the first quarter of 1998.2 In fact, this improvement seemed to be forced upon firms, rather than a voluntary action, following a sudden reduction in short-term financing as trade payables (cash outflow) and trade receivables (inflow) halved as percent of total asset compared with that before crisis (Figure 2.2).
(2) Firms’ balance sheets remained highly leveraged since non-operating assets were not reduced significantly owing to plummeting asset prices following debt restructuring measures and asset sales (Figure 2.1F). Moreover, the average cost of borrowing remained higher than MLR -- a benchmark for prevailing costs of borrowing from domestic banks, on average by 0.8 percent per annum during the years 1999-2000 (Figure 2.3).3 This suggested that firms were not able to switch fast and large enough from foreign borrowing to domestic borrowing, in order to lessen the impact of exchange rate depreciation on their existing foreign debt. This was since domestic banks were increasingly unwilling to lend to the corporate sector, as uncertainties heightened regarding the prospects of economic recovery and institutional arrangements relating to debt restructuring and bankruptcy.
2 Firms did not reduce their asset base until the beginning of 1998, which coincided with the big jump in other income for the whole of that year particularly in Q1.
3 Between 1994 and 1997 Q2, non-bank listed companies were able to borrow on average at the rate of 6.67 percent per annum, compared with the minimum lending rate (MLR) of large banks in Thailand that averaged 13.16 percent per annum, reflecting the perceived creditworthiness of these firms and their ability to borrow abroad. Indeed, loans together with borrowing by issuing debt instruments, a large share of which was believed to be bills of exchange (B/E), comprised about 60 percent of total corporate financing before the crisis.
6
2.41.85
0
1
2
3
4
5
Q2:94 Q2:95 Q2:96 Q2:97 Q2:98 Q2:99 Q2:00 Q2:01 Q2:02
D/E_common
D/E
Figure 2.4: D/E of Non-bank Listed Companies
Avg. D/E Pre-Crisis 1.7
Times
Business Finance Analysis Team
Avg. D/E_commonPre-Crisis 2.5
2.341.85
0
2
4
6
8
10
Q2:94 Q2:95 Q2:96 Q2:97 Q2:98 Q2:99 Q2:00 Q2:01 Q2:02
D/E ex net Appraisal gainD/E
Figure 2.5: D/E of Non-bank Listed Companies
Business Finance Analysis Team
Times
Avg. D/E Pre-Crisis 1.7
-30%
-20%
-10%
0%
10%
20%
30%
40%
50%
Q2:94 Q2:95 Q2:96 Q2:97 Q2:98 Q2:99 Q2:00 Q2:01 Q2:02
-30%
-20%
-10%
0%
10%
20%
30%
40%
50%Revaluation SHARE CAPITAL
RETAINED EARNINGS EQUITY
% of asset
Figure 2.6: Non-bank Listed Companies’ Component of Equities
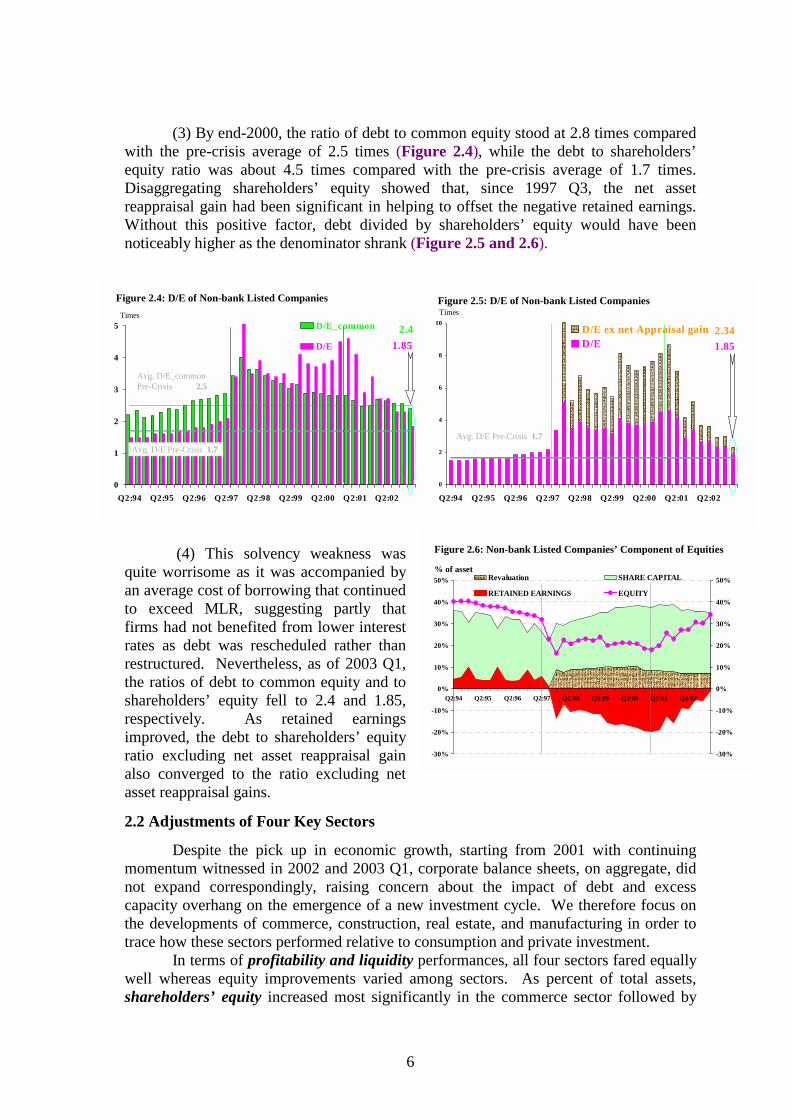
(3) By end-2000, the ratio of debt to common equity stood at 2.8 times compared with the pre-crisis average of 2.5 times (Figure 2.4), while the debt to shareholders’ equity ratio was about 4.5 times compared with the pre-crisis average of 1.7 times. Disaggregating shareholders’ equity showed that, since 1997 Q3, the net asset reappraisal gain had been significant in helping to offset the negative retained earnings. Without this positive factor, debt divided by shareholders’ equity would have been noticeably higher as the denominator shrank (Figure 2.5 and 2.6).
(4) This solvency weakness was quite worrisome as it was accompanied by an average cost of borrowing that continued to exceed MLR, suggesting partly that firms had not benefited from lower interest rates as debt was rescheduled rather than restructured. Nevertheless, as of 2003 Q1, the ratios of debt to common equity and to shareholders’ equity fell to 2.4 and 1.85, respectively. As retained earnings improved, the debt to shareholders’ equity ratio excluding net asset reappraisal gain also converged to the ratio excluding net asset reappraisal gains.
2.2 Adjustments of Four Key Sectors
Despite the pick up in economic growth, starting from 2001 with continuing momentum witnessed in 2002 and 2003 Q1, corporate balance sheets, on aggregate, did not expand correspondingly, raising concern about the impact of debt and excess capacity overhang on the emergence of a new investment cycle. We therefore focus on the developments of commerce, construction, real estate, and manufacturing in order to trace how these sectors performed relative to consumption and private investment.
In terms of profitability and liquidity performances, all four sectors fared equally well whereas equity improvements varied among sectors. As percent of total assets, shareholders’ equity increased most significantly in the commerce sector followed by
7
Manufacturing
Commerce
Construction
Real Estate-30%
-20%
-10%
0%
10%
20%
30%
40%
50%
Q2:94 Q2:95 Q2:96 Q2:97 Q2:98 Q2:99 Q2:00 Q2:01 Q2:02
-30%
-20%
-10%
0%
10%
20%
30%
40%
50%Revaluation SHARE CAPITAL
RETAINED EARNINGS EQUITY
-70%
-50%
-30%
-10%
10%
30%
50%
Q2:94 Q2:95 Q2:96 Q2:97 Q2:98 Q2:99 Q2:00 Q2:01 Q2:02
-70%
-50%
-30%
-10%
10%
30%
50%Revaluation SHARE CAPITAL
RETAINED EARNINGS EQUITY
-40%
-30%
-20%
-10%
0%
10%
20%
30%
40%
50%
Q2:94 Q2:95 Q2:96 Q2:97 Q2:98 Q2:99 Q2:00 Q2:01 Q2:02
-40%
-30%
-20%
-10%
0%
10%
20%
30%
40%
50%Revaluation SHARE CAPITAL
RETAINED EARNINGS EQUITY
-50%
-40%
-30%
-20%
-10%
0%
10%
20%
30%
40%
50%
Q2:94 Q2:95 Q2:96 Q2:97 Q2:98 Q2:99 Q2:00 Q2:01 Q2:02
-50%
-40%
-30%
-20%
-10%
0%
10%
20%
30%
40%
50%Revaluation SHARE CAPITAL
RETAINED EARNINGS EQUITY
Figure 2.7: Sectoral Development (1)
0%
5%
10%
15%
20%
25%
Q4:
00
Q4:
01
Q1:
03
Q4:
00
Q4:
01
Q1:
03
Q4:
00
Q4:
01
Q1:
03
Q4:
00
Q4:
01
Q1:
03
Q4:
00
Q4:
01
Q1:
03
COMMON STOCKS PREFERRED STOCKS
% of Previous Quarter Total Liabilities
Figure 2.8: Accumulated Debt – equity swap from debt restructuring
CorpManu Construction Commerce Real Estate
30,000
40,000
50,000
60,000
70,000
80,000
90,000
100,000
1996
1997
1998
Q1-
1999
Q2-
1999
Q3-
1999
Q4-
1999
Q1-
2000
Q2-
2000
Q3-
2000
Q4-
2000
Q1-
2001
Q2-
2001
Q3-
2001
Q4-
2001
Q1-
2002
Q2-
2002
Q3-
2002
Q4-
2002
Q1-
2003
0
10
20
30
40
50
60
70
Private debt Private debt/GDP (RHS)
%Million of US$
Figure 2.9: Private External Debt
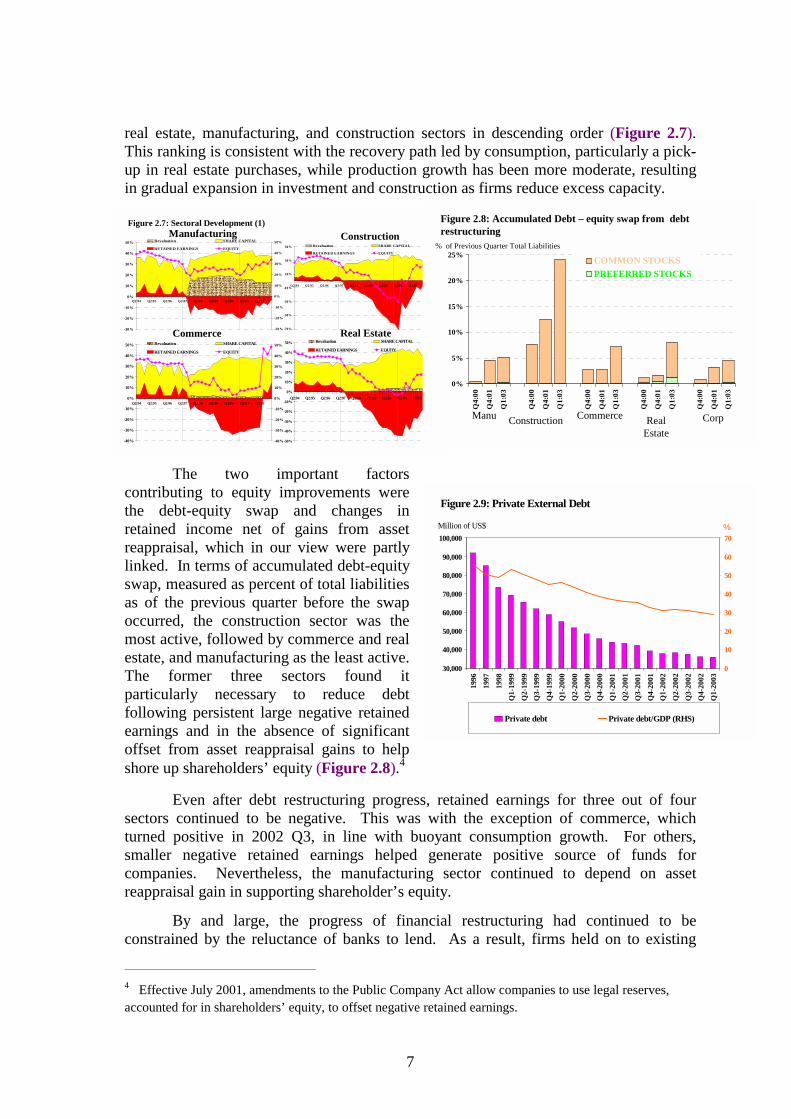
real estate, manufacturing, and construction sectors in descending order (Figure 2.7). This ranking is consistent with the recovery path led by consumption, particularly a pick-up in real estate purchases, while production growth has been more moderate, resulting in gradual expansion in investment and construction as firms reduce excess capacity.
The two important factors contributing to equity improvements were the debt-equity swap and changes in retained income net of gains from asset reappraisal, which in our view were partly linked. In terms of accumulated debt-equity swap, measured as percent of total liabilities as of the previous quarter before the swap occurred, the construction sector was the most active, followed by commerce and real estate, and manufacturing as the least active. The former three sectors found it particularly necessary to reduce debt following persistent large negative retained earnings and in the absence of significant offset from asset reappraisal gains to help shore up shareholders’ equity (Figure 2.8).4
Even after debt restructuring progress, retained earnings for three out of four sectors continued to be negative. This was with the exception of commerce, which turned positive in 2002 Q3, in line with buoyant consumption growth. For others, smaller negative retained earnings helped generate positive source of funds for companies. Nevertheless, the manufacturing sector continued to depend on asset reappraisal gain in supporting shareholder’s equity.
By and large, the progress of financial restructuring had continued to be constrained by the reluctance of banks to lend. As a result, firms held on to existing
4 Effective July 2001, amendments to the Public Company Act allow companies to use legal reserves, accounted for in shareholders’ equity, to offset negative retained earnings.
8
0
5
10
15
20
25
30
Dec
-99
Mar
-00
Jun-
00
Sep-
00
Dec
-00
Mar
-01
Jun-
01
Sep-
01
Dec
-01
Mar
-02
Jun-
02
Sep-
02
Dec
-02
0
100
200
300
400
500
600
New NPL Re-entry NPL NPL outstanding (RHS)
Billion baht Billion bahtManufacturing
0
5
10
15
20
25
30
Dec
-99
Mar
-00
Jun-
00
Sep-
00
Dec
-00
Mar
-01
Jun-
01
Sep-
01
Dec
-01
Mar
-02
Jun-
02
Sep-
02
Dec
-02
0
100
200
300
400
500
600
New NP L Re-entry NPL NPL outstanding (RHS)
Billion baht Billion bahtCommerce
0
3
6
9
12
15
Dec
-99
Mar
-00
Jun-
00
Sep-
00
Dec
-00
Mar
-01
Jun-
01
Sep-
01
Dec
-01
Mar
-02
Jun-
02
Sep-
02
Dec
-02
0
100
200
300
400
New NPL Re-entry NPL NPL outstanding (RHS)
Billion baht Billion bahtReal estates
* New definition from Dec.2002.
0
3
6
9
12
Dec
-99
Mar
-00
Jun-
00
Sep-
00
Dec
-00
Mar
-01
Jun-
01
Sep-
01
Dec
-01
Mar
-02
Jun-
02
Sep-
02
Dec
-02
0
25
50
75
100
125
150
New NPL Re-entry NPL NPL outstanding (RHS)
Billion baht Billion bahtConstruction
Figure 2.10: NPL* Increase in Major Sectors
Figure 2.11: Financial Structure of Non-bank Listed Companies
-20%
0%
20%
40%
60%
80%
100%
Q2:
97Q
4:00
Q1:
03
Q2:
97Q
4:00
Q1:
03
Q2:
97Q
4:00
Q1:
03
Q2:
97Q
4:00
Q1:
03
Q2:
97Q
4:00
Q1:
03
Equity Debt instrument Loan
Corp Manu Construction Commerce Real Estate
% of asset
assets and neither banks and nor firms were prepared to write-off debt and bore the associated losses. This was understandable as profitability had just only recently improved and retained earnings remained poor. Nevertheless, average borrowing costs of the three sectors had fallen below MLR5 since 2002 Q1, except for the construction sector where average borrowing cost fell below MLR in Q2. This implied that listed companies were able to restructure their financing more progressively, partly owing to the continued repayment of foreign borrowing and lower interest rates (Figure 2.9).
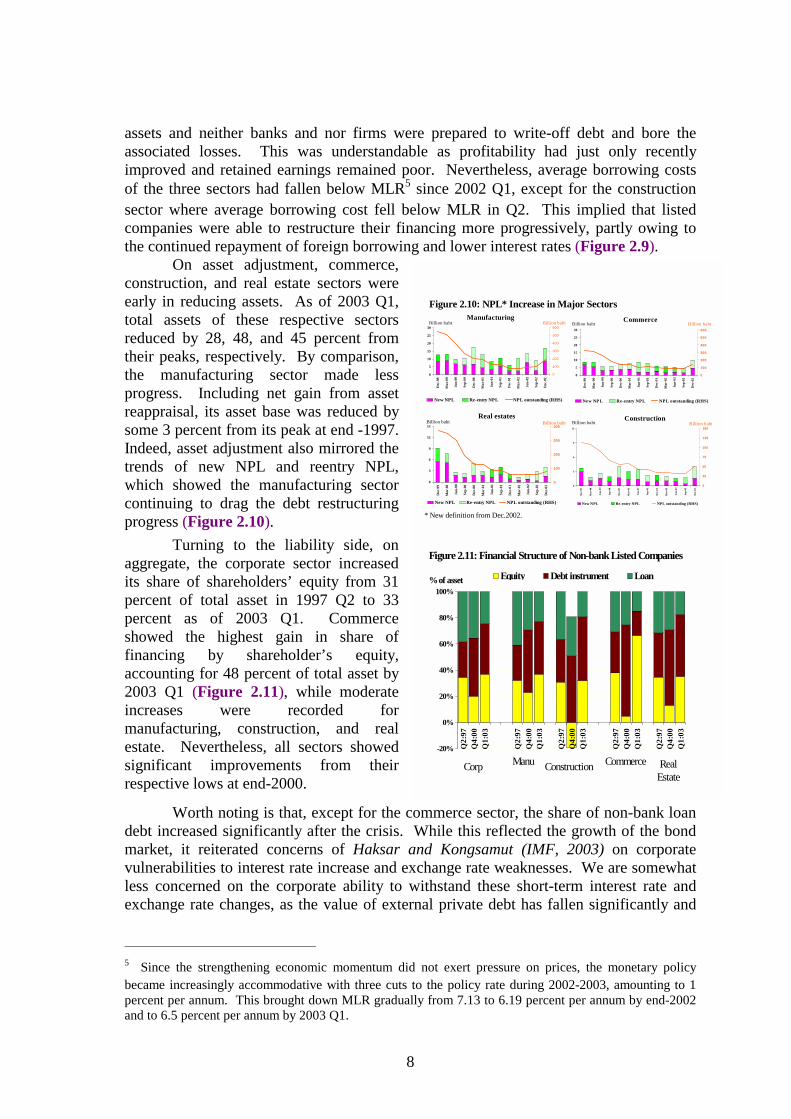
On asset adjustment, commerce, construction, and real estate sectors were early in reducing assets. As of 2003 Q1, total assets of these respective sectors reduced by 28, 48, and 45 percent from their peaks, respectively. By comparison, the manufacturing sector made less progress. Including net gain from asset reappraisal, its asset base was reduced by some 3 percent from its peak at end -1997. Indeed, asset adjustment also mirrored the trends of new NPL and reentry NPL, which showed the manufacturing sector continuing to drag the debt restructuring progress (Figure 2.10).
Turning to the liability side, on aggregate, the corporate sector increased its share of shareholders’ equity from 31 percent of total asset in 1997 Q2 to 33 percent as of 2003 Q1. Commerce showed the highest gain in share of financing by shareholder’s equity, accounting for 48 percent of total asset by 2003 Q1 (Figure 2.11), while moderate increases were recorded for manufacturing, construction, and real estate. Nevertheless, all sectors showed significant improvements from their respective lows at end-2000.
Worth noting is that, except for the commerce sector, the share of non-bank loan debt increased significantly after the crisis. While this reflected the growth of the bond market, it reiterated concerns of Haksar and Kongsamut (IMF, 2003) on corporate vulnerabilities to interest rate increase and exchange rate weaknesses. We are somewhat less concerned on the corporate ability to withstand these short-term interest rate and exchange rate changes, as the value of external private debt has fallen significantly and
5 Since the strengthening economic momentum did not exert pressure on prices, the monetary policy became increasingly accommodative with three cuts to the policy rate during 2002-2003, amounting to 1 percent per annum. This brought down MLR gradually from 7.13 to 6.19 percent per annum by end-2002 and to 6.5 percent per annum by 2003 Q1.
9
0.5
1
1.5
2
2.5
Q4:94 Q4:95 Q4:96 Q4:97 Q4:98 Q4:99 Q4:00 Q4:01 Q4:02-30%
-25%
-20%
-15%
-10%
-5%
0%
5%
10%
15%Tobin's Q (LHS) ROA adj. Avg. Borrowing rate GDP growth (y-o-y)
Figure 2.12 Adjusted ROA and Tobin’s Q ratio of Non-bank Listed Companies
the borrowing diversification to medium-term debt instruments have interest rate characteristics that are either fixed for the whole or part of their maturities. Moreover, the painful lesson from the 1997 crisis should discourage firms from borrowing short term abroad.
2.3 Outlook for Corporate Balance Sheet Expansion
As with during the economic down-cycle when the ability of the corporate sector to absorb shock diminishes but balance sheet weaknesses can linger for years without triggering the crisis, one could prima facie expect that firms may also linger for a certain period of time before expanding investment and employment even after significant balance sheet improvements.
According to the US experience, firms tend to wait before expanding investment even after significant balance sheet adjustments. This delay is not unexpected since firms start to invest again only after they regain confidence in the recovery of final demand. Meanwhile, as the liquidity improves, funding costs decline, and stock prices increase, firms will try to lock in low funding costs by continuing to restructure liabilities. Over time, with growing confidence, low cost of capital, and lean inventories that need replenishing, investment expansion can be triggered given that no significant overhang remains in the balance sheet.
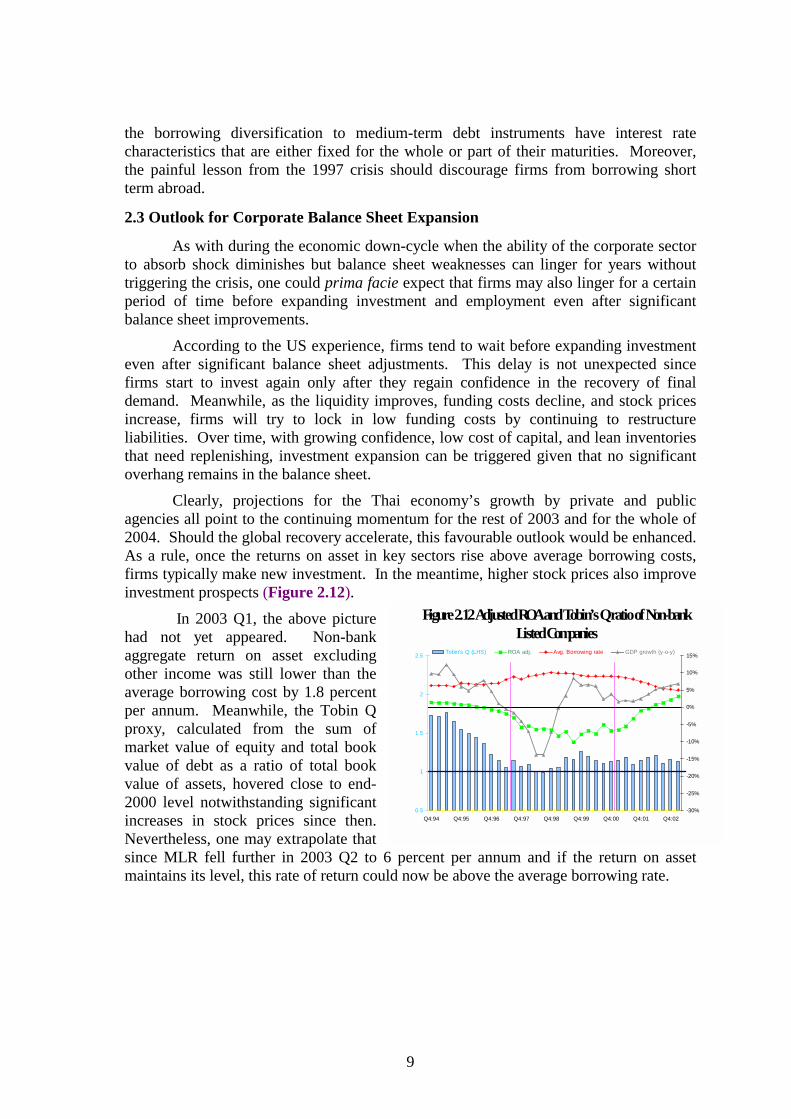
Clearly, projections for the Thai economy’s growth by private and public agencies all point to the continuing momentum for the rest of 2003 and for the whole of 2004. Should the global recovery accelerate, this favourable outlook would be enhanced. As a rule, once the returns on asset in key sectors rise above average borrowing costs, firms typically make new investment. In the meantime, higher stock prices also improve investment prospects (Figure 2.12).
In 2003 Q1, the above picture had not yet appeared. Non-bank aggregate return on asset excluding other income was still lower than the average borrowing cost by 1.8 percent per annum. Meanwhile, the Tobin Q proxy, calculated from the sum of market value of equity and total book value of debt as a ratio of total book value of assets, hovered close to end-2000 level notwithstanding significant increases in stock prices since then. Nevertheless, one may extrapolate that since MLR fell further in 2003 Q2 to 6 percent per annum and if the return on asset maintains its level, this rate of return could now be above the average borrowing rate.
10
0 . 5
1
1 . 5
2
2 . 5
Q 4 :9 4 Q 4 :9 5 Q 4 :9 6 Q 4 :9 7 Q 4 :9 8 Q 4 :9 9 Q 4 :0 0 Q 4 :0 1 Q 4 :0 2- 3 0 %
- 2 0 %
- 1 0 %
0 %
1 0 %
T o b i n 's Q ( L H S ) R O A a d j . A v g . B o r r o w i n g r a t e M P I
0 . 5
1
1 . 5
2
2 . 5
Q 4 :9 4 Q 4 :9 5 Q 4 :9 6 Q 4 :9 7 Q 4 :9 8 Q 4 :9 9 Q 4 :0 0 Q 4 :0 1 Q 4 :0 2- 5 0 %
- 4 0 %
- 3 0 %
- 2 0 %
- 1 0 %
0 %
1 0 %
2 0 %T o b in ' s Q ( L H S ) R O A a d j . A v g . B o r r o w in g r a t e P C I
M a n u f a c t u r i n g
C o m m e r c e
0 . 5
1
1 . 5
2
2 . 5
3
3 . 5
4
Q 4 : 9 4 Q 4 : 9 5 Q 4 : 9 6 Q 4 : 9 7 Q 4 : 9 8 Q 4 : 9 9 Q 4 : 0 0 Q 4 : 0 1 Q 4 : 0 2- 5 0 %
- 4 0 %
- 3 0 %
- 2 0 %
- 1 0 %
0 %
1 0 %
T o b in ' s Q ( L H S ) R O A a d j . A v g . B o r r o w in g r a t e H o u s in g L o a n G r o w t h ( y - o - y )
C o n s t r u c t i o n
0 . 5
1
1 . 5
2
2 . 5
3
Q 4 :9 4 Q 4 :9 5 Q 4 :9 6 Q 4 :9 7 Q 4 :9 8 Q 4 :9 9 Q 4 :0 0 Q 4 :0 1 Q 4 :0 2- 6 0 %
- 5 0 %
- 4 0 %
- 3 0 %
- 2 0 %
- 1 0 %
0 %
1 0 %
T o b i n 's Q ( L H S ) R O A a d j . A v g . B o r r o w i n g ra t e D e ve l o p e r L o a n G r o w t h ( y - o - y )
R e a l E s t a t e
F i g u r e 2 . 1 3 : S e c t o r a l D e v e l o p m e n t ( 2 )
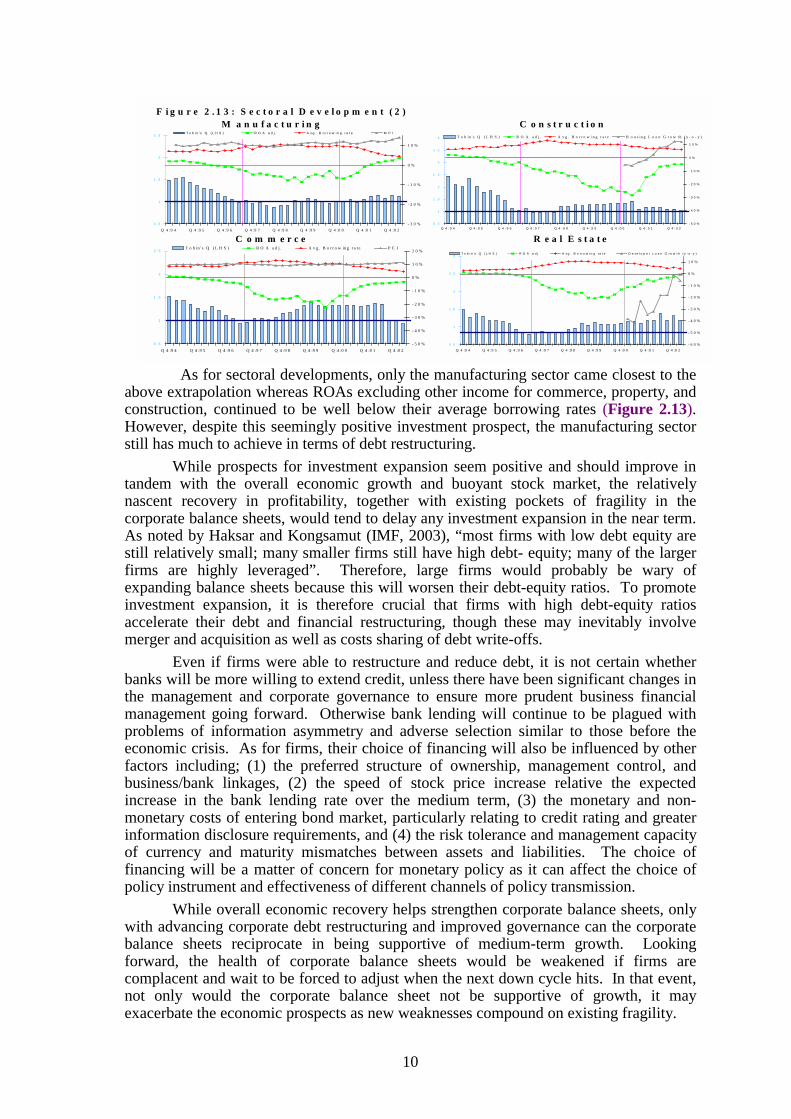
As for sectoral developments, only the manufacturing sector came closest to the above extrapolation whereas ROAs excluding other income for commerce, property, and construction, continued to be well below their average borrowing rates (Figure 2.13). However, despite this seemingly positive investment prospect, the manufacturing sector still has much to achieve in terms of debt restructuring.
While prospects for investment expansion seem positive and should improve in tandem with the overall economic growth and buoyant stock market, the relatively nascent recovery in profitability, together with existing pockets of fragility in the corporate balance sheets, would tend to delay any investment expansion in the near term. As noted by Haksar and Kongsamut (IMF, 2003), “most firms with low debt equity are still relatively small; many smaller firms still have high debt- equity; many of the larger firms are highly leveraged”. Therefore, large firms would probably be wary of expanding balance sheets because this will worsen their debt-equity ratios. To promote investment expansion, it is therefore crucial that firms with high debt-equity ratios accelerate their debt and financial restructuring, though these may inevitably involve merger and acquisition as well as costs sharing of debt write-offs.
Even if firms were able to restructure and reduce debt, it is not certain whether banks will be more willing to extend credit, unless there have been significant changes in the management and corporate governance to ensure more prudent business financial management going forward. Otherwise bank lending will continue to be plagued with problems of information asymmetry and adverse selection similar to those before the economic crisis. As for firms, their choice of financing will also be influenced by other factors including; (1) the preferred structure of ownership, management control, and business/bank linkages, (2) the speed of stock price increase relative the expected increase in the bank lending rate over the medium term, (3) the monetary and non-monetary costs of entering bond market, particularly relating to credit rating and greater information disclosure requirements, and (4) the risk tolerance and management capacity of currency and maturity mismatches between assets and liabilities. The choice of financing will be a matter of concern for monetary policy as it can affect the choice of policy instrument and effectiveness of different channels of policy transmission.
While overall economic recovery helps strengthen corporate balance sheets, only with advancing corporate debt restructuring and improved governance can the corporate balance sheets reciprocate in being supportive of medium-term growth. Looking forward, the health of corporate balance sheets would be weakened if firms are complacent and wait to be forced to adjust when the next down cycle hits. In that event, not only would the corporate balance sheet not be supportive of growth, it may exacerbate the economic prospects as new weaknesses compound on existing fragility.
11
III. Balance Sheet Adjustments of Thai Households
Between 1990-1995, Thai households benefited from continued high GDP growth averaging 9.0 percent while unemployment and inflation rates were relatively low averaging 2.5 and 5.0 percent, respectively. In 1995, disposable income per capita increased at the highest rate of 8.1 percent in real terms. Households enjoyed an asset price boom and high deposit rates of over 10.3 percent during the same period. However, as economic growth fell to 5.9 percent in 1996, growth of household disposable income trickled to 2.7 percent in real terms.
In tandem with the disposable income growth, the average debt per household in 1996, based on the NSO’s survey6, amounted to Baht 52,001, 1.7 times the level observed in 1994. This amount of debt was equivalent to 4.8 times of monthly household income. However, with personal income per household remained strong – expanding by an average 15.2 percent per year in 1996, households continued to be able to service this increase in debt.
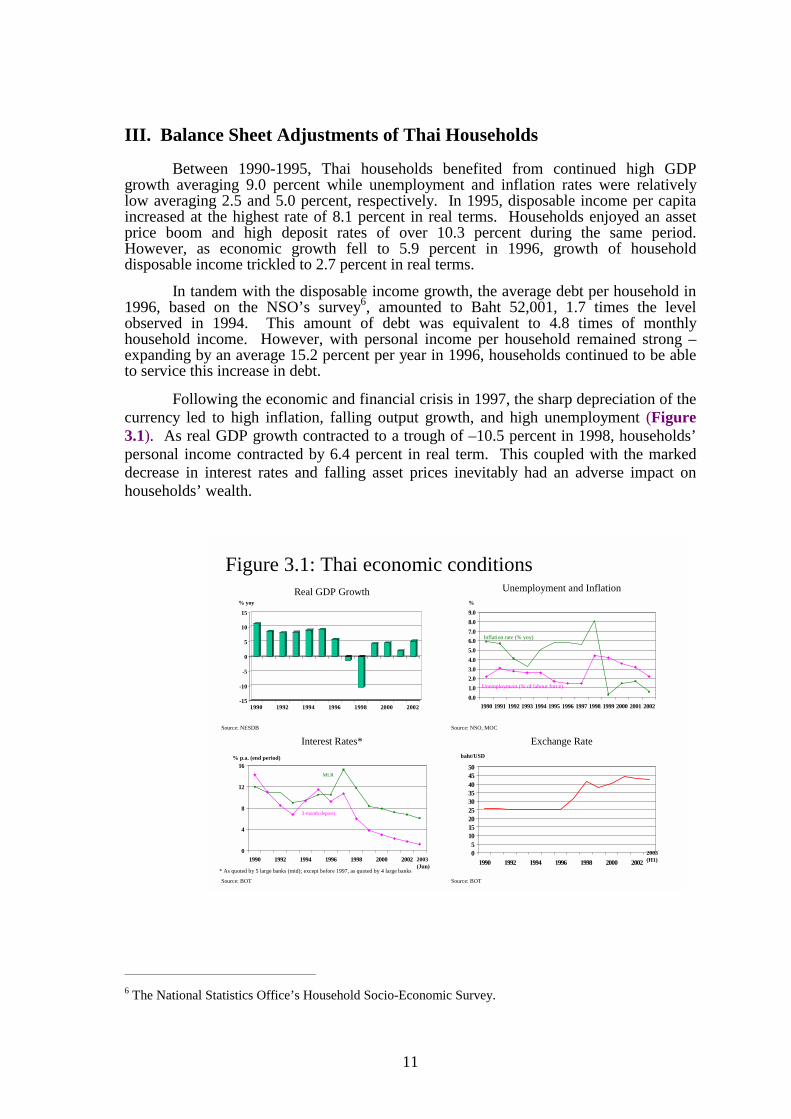
Following the economic and financial crisis in 1997, the sharp depreciation of the currency led to high inflation, falling output growth, and high unemployment (Figure 3.1). As real GDP growth contracted to a trough of –10.5 percent in 1998, households’ personal income contracted by 6.4 percent in real term. This coupled with the marked decrease in interest rates and falling asset prices inevitably had an adverse impact on households’ wealth.
6 The National Statistics Office’s Household Socio-Economic Survey.
Interest Rates*
0
4
8
12
16
1990 1992 1994 1996 1998 2000 2002
% p.a. (end period)
3-month deposit
MLR
Source: BOT
2003(Jun)
* As quoted by 5 large banks (mid); except before 1997, as quoted by 4 large banks
Real GDP Growth
-15
-10
-5
0
5
10
15
1990 1992 1994 1996 1998 2000 2002
Source: NESDB
% yoy
Exchange Rate
05
101520253035404550
1990 1992 1994 1996 1998 2000 2002
baht/USD
Source: BOT
2003(H1)
Unemployment and Inflation
0.01.02.03.04.05.06.07.08.09.0
1990 1991 1992 1993 1994 1995 1996 1997 1998 1999 2000 2001 2002
%
Unemployment (% of labour force)
Inflation rate (% yoy)
Source: NSO, MOC
Figure 3.1: Thai economic conditions
12
-40
-20
0
20
40
60
80
1994 1995 1996 1997 1998 1999 2000 2001Income from employment Income from assetTransfers from general gvt. Total income
%yoy
Source: NESDB
Figure 3.2: Growth of Personal Income
In response to the significant drop in income and wealth, both nominal and real terms, households cut down their expenditure to strengthen their financial position, which improved markedly during 1999-2001. As the economic growth began to gather momentum in late 2001, private consumption was a major contributor to growth.
This section analyses the households’ adjustment via their consumption and conversely saving to the post-crisis environment with respect to changes in income, wealth, and debt levels, in order to assess the households’ strength in supporting further recovery. Although consumption-led growth is not sustainable in the long run, the strength of households’ financial balance sheet is still crucial for the overall recovery. 3.1 Development of Households’ Income7
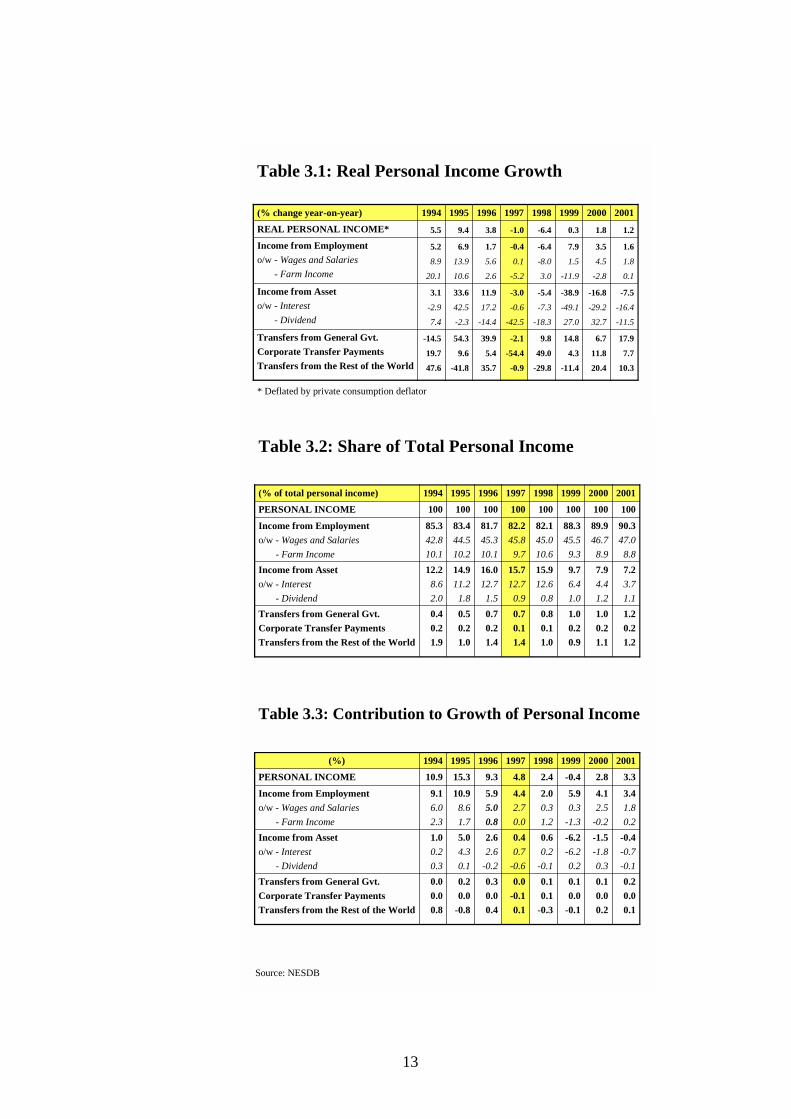
In the wake of the 1997 shocks, personal income growth in real terms fell by as much as 6.4 percent in 1998. Real wages and salaries, in particular, contracted 8.0 percent while real income from assets fell 5.4 percent in the same year (Table 3.1). Real income from assets continued its negative growth until 2001, with the deepest contraction of 38.9 percent in 1999 due largely to declines in interest income. By contrast, government transfers have been on the rise since 1998, which have helped support households’ consumption.
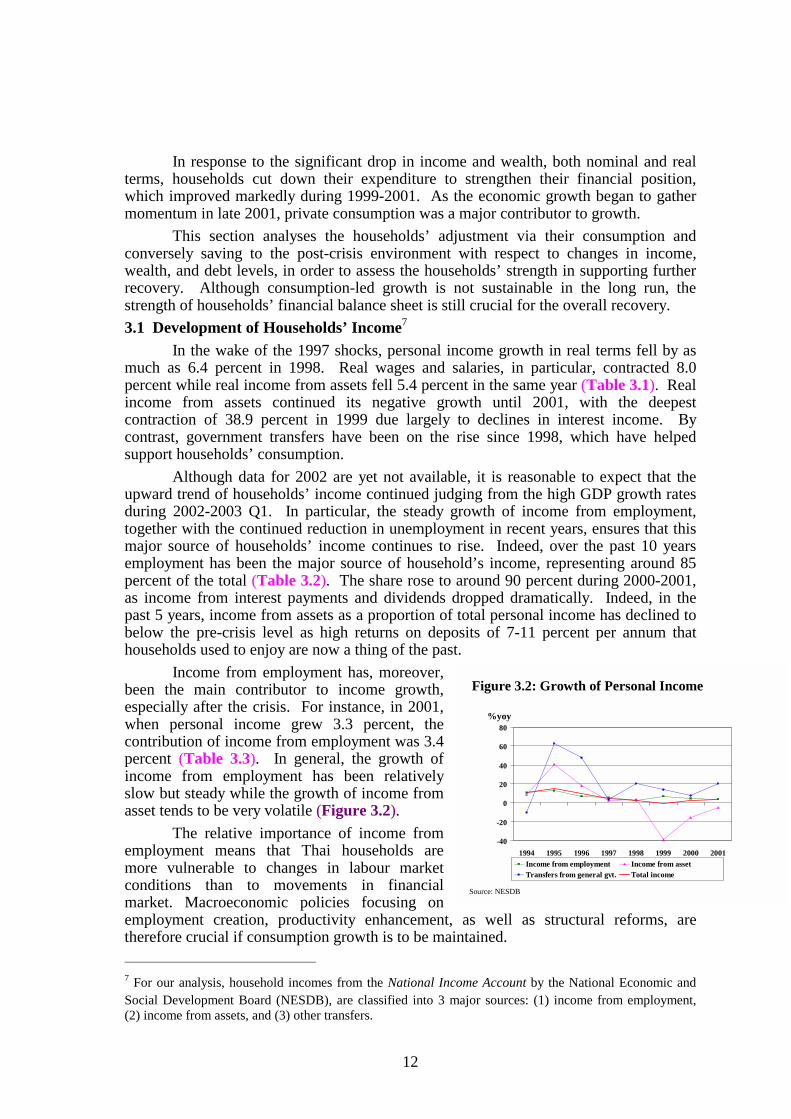
Although data for 2002 are yet not available, it is reasonable to expect that the upward trend of households’ income continued judging from the high GDP growth rates during 2002-2003 Q1. In particular, the steady growth of income from employment, together with the continued reduction in unemployment in recent years, ensures that this major source of households’ income continues to rise. Indeed, over the past 10 years employment has been the major source of household’s income, representing around 85 percent of the total (Table 3.2). The share rose to around 90 percent during 2000-2001, as income from interest payments and dividends dropped dramatically. Indeed, in the past 5 years, income from assets as a proportion of total personal income has declined to below the pre-crisis level as high returns on deposits of 7-11 percent per annum that households used to enjoy are now a thing of the past.
Income from employment has, moreover, been the main contributor to income growth, especially after the crisis. For instance, in 2001, when personal income grew 3.3 percent, the contribution of income from employment was 3.4 percent (Table 3.3). In general, the growth of income from employment has been relatively slow but steady while the growth of income from asset tends to be very volatile (Figure 3.2).
The relative importance of income from employment means that Thai households are more vulnerable to changes in labour market conditions than to movements in financial market. Macroeconomic policies focusing on employment creation, productivity enhancement, as well as structural reforms, are therefore crucial if consumption growth is to be maintained. 7 For our analysis, household incomes from the National Income Account by the National Economic and Social Development Board (NESDB), are classified into 3 major sources: (1) income from employment, (2) income from assets, and (3) other transfers.
13
Source: NESDB
-7.5
-16.4
-11.5
-16.8
-29.2
32.7
-38.9
-49.1
27.0
-5.4
-7.3
-18.3
-3.0
-0.6
-42.5
11.9
17.2
-14.4
33.6
42.5
-2.3
3.1
-2.9
7.4
Income from Asseto/w - Interest
- Dividend
17.9
7.7
10.3
6.7
11.8
20.4
14.8
4.3
-11.4
9.8
49.0
-29.8
-2.1
-54.4
-0.9
39.9
5.4
35.7
54.3
9.6
-41.8
-14.5
19.7
47.6
Transfers from General Gvt.Corporate Transfer PaymentsTransfers from the Rest of the World
1.6
1.8
0.1
3.5
4.5
-2.8
7.9
1.5
-11.9
-6.4
-8.0
3.0
-0.4
0.1
-5.2
1.7
5.6
2.6
6.9
13.9
10.6
5.2
8.9
20.1
Income from Employmento/w - Wages and Salaries
- Farm Income
1.21.80.3-6.4-1.03.89.45.5REAL PERSONAL INCOME*20012000199919981997199619951994(% change year-on-year)
* Deflated by private consumption deflator
Table 3.1: Real Personal Income Growth
Source: NESDB
7.23.71.1
7.94.41.2
9.76.41.0
15.912.6
0.8
15.712.7
0.9
16.012.71.5
14.911.2
1.8
12.28.62.0
Income from Asseto/w - Interest
- Dividend1.20.21.2
1.00.21.1
1.00.20.9
0.80.11.0
0.70.11.4
0.70.21.4
0.50.21.0
0.40.21.9
Transfers from General Gvt.Corporate Transfer PaymentsTransfers from the Rest of the World
90.347.0
8.8
89.946.78.9
88.345.5
9.3
82.145.010.6
82.245.8
9.7
81.745.310.1
83.444.510.2
85.342.810.1
Income from Employmento/w - Wages and Salaries
- Farm Income
100100100100100100100100PERSONAL INCOME20012000199919981997199619951994(% of total personal income)
Table 3.2: Share of Total Personal Income
Source: NESDB
-0.4-0.7-0.1
-1.5-1.80.3
-6.2-6.20.2
0.60.2
-0.1
0.40.7
-0.6
2.62.6
-0.2
5.04.30.1
1.00.20.3
Income from Asseto/w - Interest
- Dividend0.20.00.1
0.10.00.2
0.10.0
-0.1
0.10.1
-0.3
0.0-0.10.1
0.30.00.4
0.20.0
-0.8
0.00.00.8
Transfers from General Gvt.Corporate Transfer PaymentsTransfers from the Rest of the World
3.41.80.2
4.12.5
-0.2
5.90.3
-1.3
2.00.31.2
4.42.70.0
5.95.00.8
10.98.61.7
9.16.02.3
Income from Employmento/w - Wages and Salaries
- Farm Income
3.32.8-0.42.44.89.315.310.9PERSONAL INCOME20012000199919981997199619951994(%)
Table 3.3: Contribution to Growth of Personal Income
14
35,000
40,000
45,000
50,000
55,000
1994 1995 1996 1997 1998 1999 2000 2001-2
0
2
4
6
8
10
12
14
Disposable income per capita %yoy (RHS)
%yoy
Source: NESDB
baht
Figure 3.3: Disposable Income per Capita
Figure 3.4: Structure of Household Aggregate Balance Sheet
Assets• Housing• Other tangible assets• Gross financial assets
– Pension and life insurance funds
– Cash and deposits– Equities– Bonds– O ther
Liabilities• Gross financial
liabilities– M ortgage loans– O ther loans
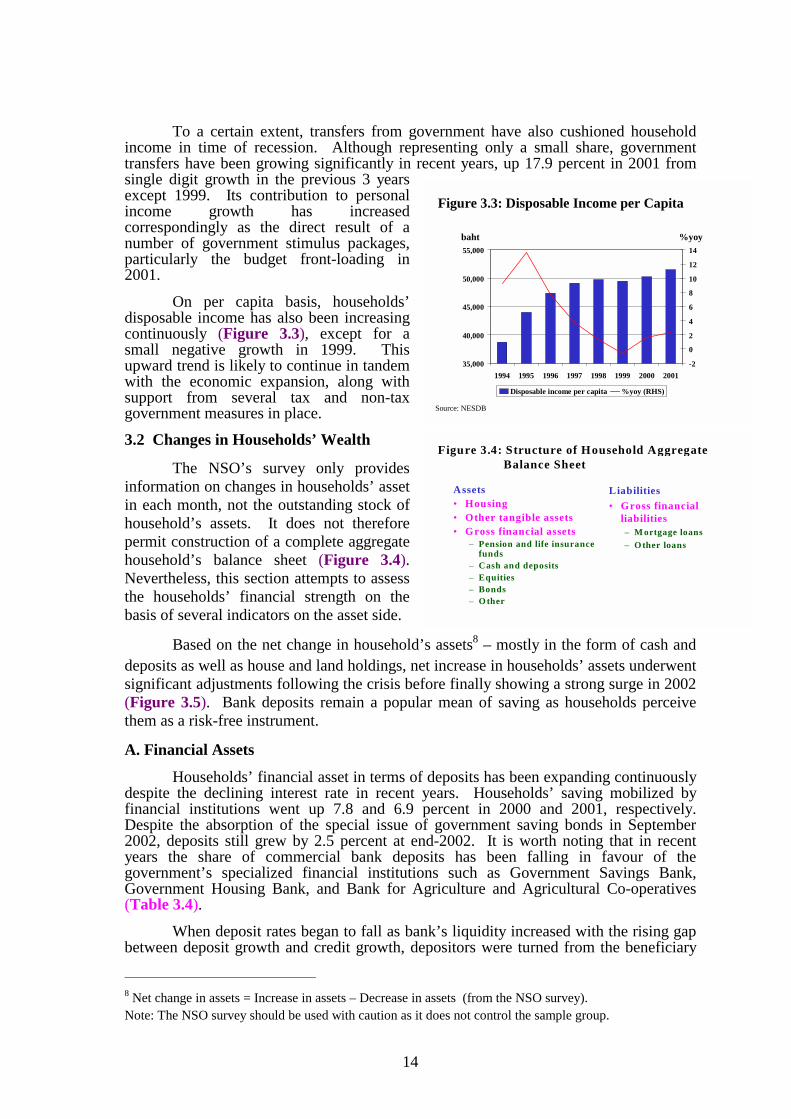
To a certain extent, transfers from government have also cushioned household income in time of recession. Although representing only a small share, government transfers have been growing significantly in recent years, up 17.9 percent in 2001 from single digit growth in the previous 3 years except 1999. Its contribution to personal income growth has increased correspondingly as the direct result of a number of government stimulus packages, particularly the budget front-loading in 2001.
On per capita basis, households’ disposable income has also been increasing continuously (Figure 3.3), except for a small negative growth in 1999. This upward trend is likely to continue in tandem with the economic expansion, along with support from several tax and non-tax government measures in place.
3.2 Changes in Households’ Wealth
The NSO’s survey only provides information on changes in households’ asset in each month, not the outstanding stock of household’s assets. It does not therefore permit construction of a complete aggregate household’s balance sheet (Figure 3.4). Nevertheless, this section attempts to assess the households’ financial strength on the basis of several indicators on the asset side.
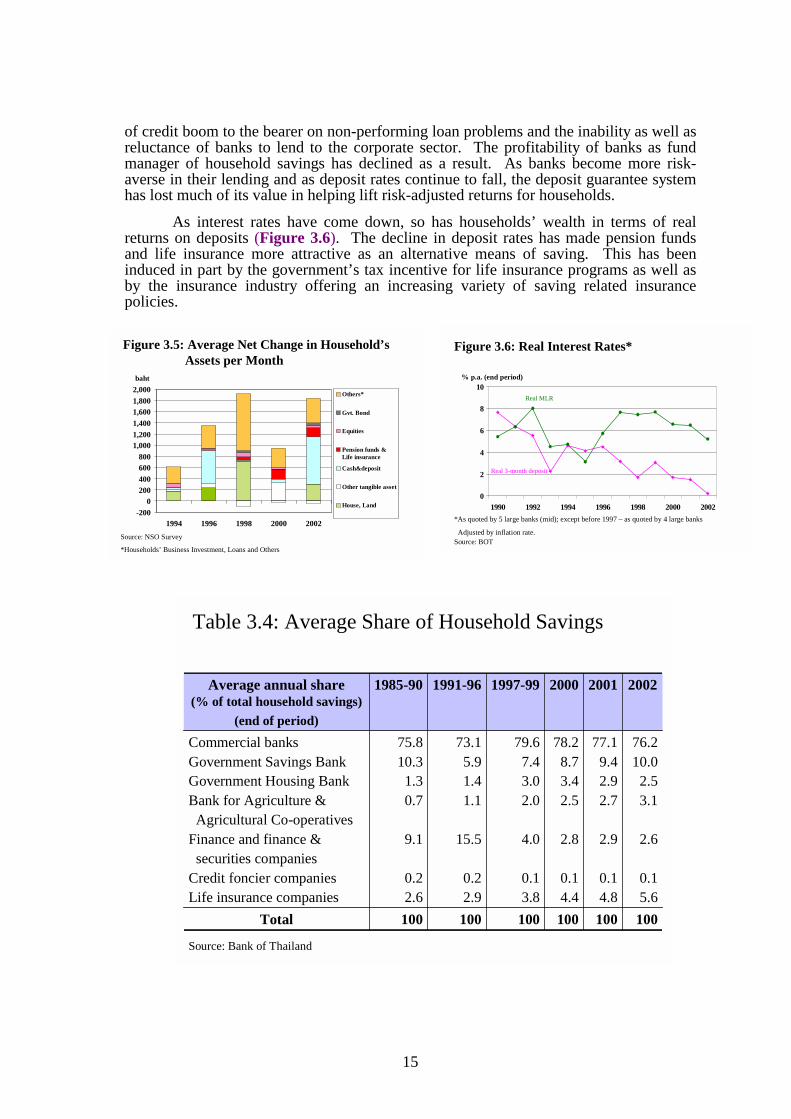
Based on the net change in household’s assets8 – mostly in the form of cash and deposits as well as house and land holdings, net increase in households’ assets underwent significant adjustments following the crisis before finally showing a strong surge in 2002 (Figure 3.5). Bank deposits remain a popular mean of saving as households perceive them as a risk-free instrument.
A. Financial Assets
Households’ financial asset in terms of deposits has been expanding continuously despite the declining interest rate in recent years. Households’ saving mobilized by financial institutions went up 7.8 and 6.9 percent in 2000 and 2001, respectively. Despite the absorption of the special issue of government saving bonds in September 2002, deposits still grew by 2.5 percent at end-2002. It is worth noting that in recent years the share of commercial bank deposits has been falling in favour of the government’s specialized financial institutions such as Government Savings Bank, Government Housing Bank, and Bank for Agriculture and Agricultural Co-operatives (Table 3.4).
When deposit rates began to fall as bank’s liquidity increased with the rising gap between deposit growth and credit growth, depositors were turned from the beneficiary
8 Net change in assets = Increase in assets – Decrease in assets (from the NSO survey). Note: The NSO survey should be used with caution as it does not control the sample group.
15
of credit boom to the bearer on non-performing loan problems and the inability as well as reluctance of banks to lend to the corporate sector. The profitability of banks as fund manager of household savings has declined as a result. As banks become more risk-averse in their lending and as deposit rates continue to fall, the deposit guarantee system has lost much of its value in helping lift risk-adjusted returns for households.
As interest rates have come down, so has households’ wealth in terms of real returns on deposits (Figure 3.6). The decline in deposit rates has made pension funds and life insurance more attractive as an alternative means of saving. This has been induced in part by the government’s tax incentive for life insurance programs as well as by the insurance industry offering an increasing variety of saving related insurance policies.
-2000
200400600800
1,0001,2001,4001,6001,8002,000
1994 1996 1998 2000 2002
Others*
Gvt. Bond
Equities
Pension funds &Life insurance
Cash&deposit
Other tangible asset
House, Land
baht
Source: NSO Survey
*Households’ Business Investment, Loans and Others
Figure 3.5: Average Net Change in Household’sAssets per Month
0
2
4
6
8
10
1990 1992 1994 1996 1998 2000 2002
% p.a. (end period)
Real 3-month deposit
Real MLR
Source: BOT
*As quoted by 5 large banks (mid); except before 1997 – as quoted by 4 large banks
Adjusted by inflation rate.
Figure 3.6: Real Interest Rates*
Table 3.4: Average Share of Household Savings
100100100100100100Total
76.210.0
2.53.1
2.6
0.15.6
77.19.42.92.7
2.9
0.14.8
78.28.73.42.5
2.8
0.14.4
79.67.43.02.0
4.0
0.13.8
73.15.91.41.1
15.5
0.22.9
75.810.31.30.7
9.1
0.22.6
Commercial banksGovernment Savings BankGovernment Housing BankBank for Agriculture &
Agricultural Co-operativesFinance and finance &
securities companiesCredit foncier companiesLife insurance companies
2002200120001997-991991-961985-90Average annual share (% of total household savings)
(end of period)
Source: Bank of Thailand
16
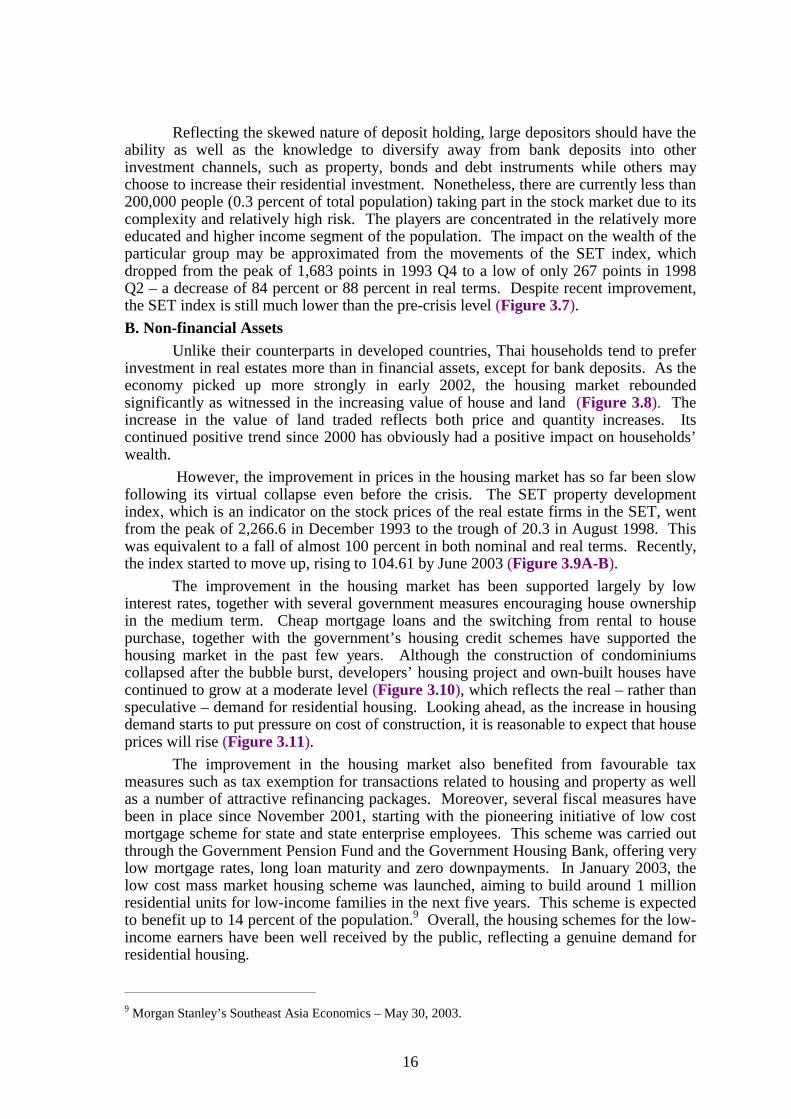
Reflecting the skewed nature of deposit holding, large depositors should have the ability as well as the knowledge to diversify away from bank deposits into other investment channels, such as property, bonds and debt instruments while others may choose to increase their residential investment. Nonetheless, there are currently less than 200,000 people (0.3 percent of total population) taking part in the stock market due to its complexity and relatively high risk. The players are concentrated in the relatively more educated and higher income segment of the population. The impact on the wealth of the particular group may be approximated from the movements of the SET index, which dropped from the peak of 1,683 points in 1993 Q4 to a low of only 267 points in 1998 Q2 – a decrease of 84 percent or 88 percent in real terms. Despite recent improvement, the SET index is still much lower than the pre-crisis level (Figure 3.7). B. Non-financial Assets
Unlike their counterparts in developed countries, Thai households tend to prefer investment in real estates more than in financial assets, except for bank deposits. As the economy picked up more strongly in early 2002, the housing market rebounded significantly as witnessed in the increasing value of house and land (Figure 3.8). The increase in the value of land traded reflects both price and quantity increases. Its continued positive trend since 2000 has obviously had a positive impact on households’ wealth.
However, the improvement in prices in the housing market has so far been slow following its virtual collapse even before the crisis. The SET property development index, which is an indicator on the stock prices of the real estate firms in the SET, went from the peak of 2,266.6 in December 1993 to the trough of 20.3 in August 1998. This was equivalent to a fall of almost 100 percent in both nominal and real terms. Recently, the index started to move up, rising to 104.61 by June 2003 (Figure 3.9A-B).
The improvement in the housing market has been supported largely by low interest rates, together with several government measures encouraging house ownership in the medium term. Cheap mortgage loans and the switching from rental to house purchase, together with the government’s housing credit schemes have supported the housing market in the past few years. Although the construction of condominiums collapsed after the bubble burst, developers’ housing project and own-built houses have continued to grow at a moderate level (Figure 3.10), which reflects the real – rather than speculative – demand for residential housing. Looking ahead, as the increase in housing demand starts to put pressure on cost of construction, it is reasonable to expect that house prices will rise (Figure 3.11).
The improvement in the housing market also benefited from favourable tax measures such as tax exemption for transactions related to housing and property as well as a number of attractive refinancing packages. Moreover, several fiscal measures have been in place since November 2001, starting with the pioneering initiative of low cost mortgage scheme for state and state enterprise employees. This scheme was carried out through the Government Pension Fund and the Government Housing Bank, offering very low mortgage rates, long loan maturity and zero downpayments. In January 2003, the low cost mass market housing scheme was launched, aiming to build around 1 million residential units for low-income families in the next five years. This scheme is expected to benefit up to 14 percent of the population.9 Overall, the housing schemes for the low-income earners have been well received by the public, reflecting a genuine demand for residential housing.
9 Morgan Stanley’s Southeast Asia Economics – May 30, 2003.
17
461.8
1,682.9
Q2-03435.68
Q4-932,227.0
0
400
800
1,200
1,600
2,000
2,400
Q1:90 Q1:92 Q1:94 Q1:96 Q1:98 Q1:00 Q1:02
points
Figure 3.7: SET Index
Source : SET
Real SET Index*
SET Index
0
10
20
30
40
50
60
Jan-91
Jan-92
Jan-93
Jan-94
Jan-95
Jan-96
Jan-97
Jan-98
Jan-99
Jan-00
Jan-01
Jan-02
Jan-03
-60
-40
-20
0
20
40
60
80billion baht % yoy
Source: Department of Lands, Ministry of Interior
% change (RHS)
Figure 3.8: Value of Land Trades
2,266.6
Dec-932,994.1
0
400
800
1,200
1,600
2,000
2,400
2,800
3,200
Jan1993
Jan1994
Jan1995
Jan1996
Jan1997
Jan1998
Jan1999
Jan2000
Jan2001
Jan2002
Jan2003
points
Figure 3.9A: Property Development Index
Source : SET
Real Property Development Index*
Property Development Index
* Adjusted by CPI
2,266.6
Dec-932,994.1
0400800
1,2001,6002,0002,4002,8003,200
Jan-93 Jan-94 Jan-95 Jan-96
points
Figure 3.9B: Property Development Index(before and after crisis)
Source : SET
Real Property Development Index
Property Development Index
050
100150200250300350
Jan-97 Jan-98 Jan-99 Jan-00 Jan-01 Jan-02 Jan-03
points
Real Property Development IndexProperty Development Index
Pre-crisis
Crisis &
Post-crisis
* Adjusted by CPI
Figure 3.11: Construction Material Price Index
708090
100110120130140150160170180
Q1 1995
Q1 1996
Q1 1997
Q1 1998
Q1 1999
Q1 2000
Q1 2001
Q1 2002
Q1 2003
CMPICementSteel
Source: Ministry of Commerce
15.7
49.1
11.3
Q1’2003
14.4
6.2
6.5
Q2’2003
24.1-10.14.90.3
15.07.04.23.1
8.80.83.90.8
H1’2003200220012000∆∆∆∆ %YOY
Cement Price Dumping
010,00020,00030,00040,00050,00060,00070,00080,000
1990 1993 1996 1999 2002020,00040,00060,00080,000100,000120,000140,000160,000180,000200,000
Developer's housing Flats-Condominium Own housing Total (RHS)
Source: Department of Lands, Ministry of Interior
UnitsUnits
2003(4months)
Figure 3.10: New Registration of Residential Housing
18
3.3 Adjustment in Households’ Consumption
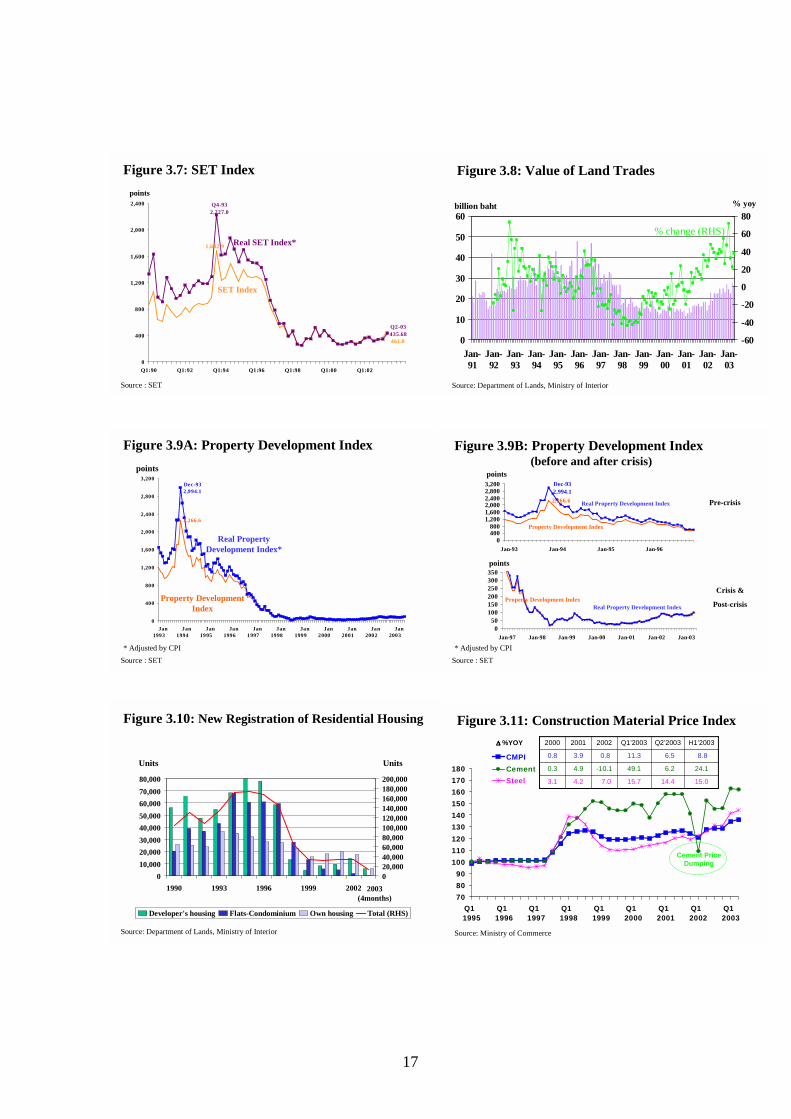
The contraction in income during the crisis led to the reduction in overall household saving and indeed dissaving by some households. The growth rate of saving (Figure 3.12) actually went negative since 1999 and continued to contract in 2000-2001. The share of saving in total personal income declined significantly from 10.9 percent in 1994 to 8.4 percent in 2001.
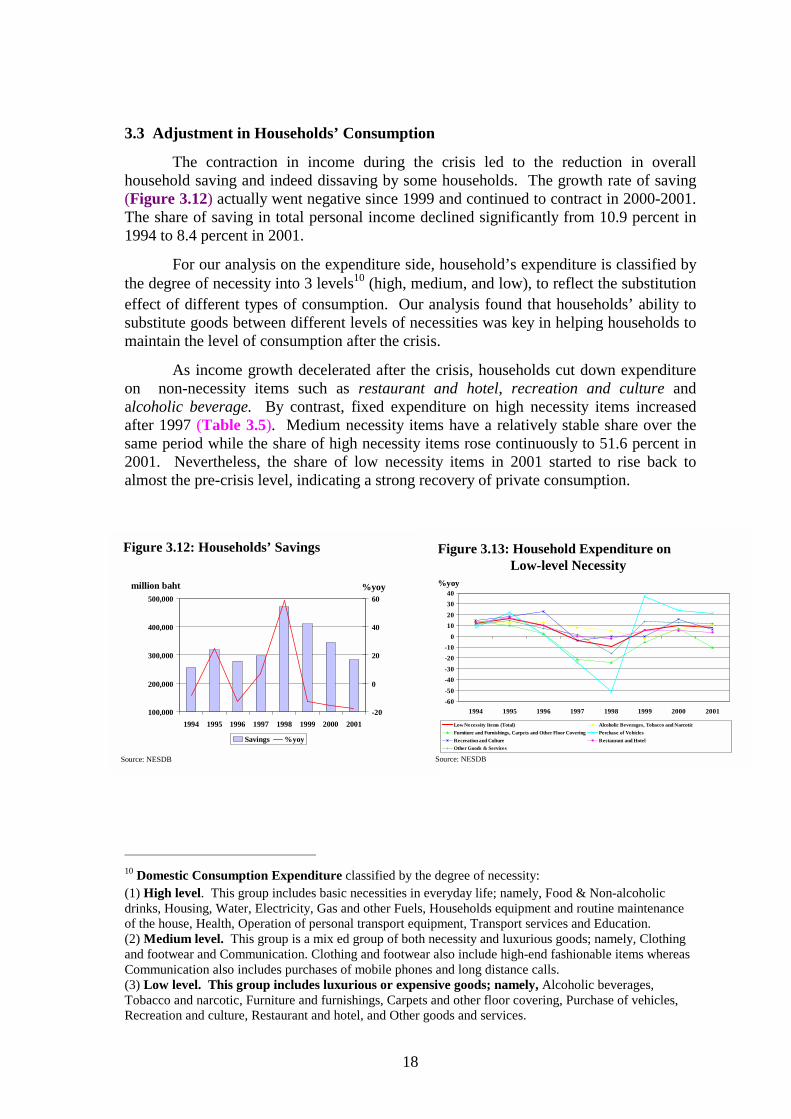
For our analysis on the expenditure side, household’s expenditure is classified by the degree of necessity into 3 levels10 (high, medium, and low), to reflect the substitution effect of different types of consumption. Our analysis found that households’ ability to substitute goods between different levels of necessities was key in helping households to maintain the level of consumption after the crisis.
As income growth decelerated after the crisis, households cut down expenditure on non-necessity items such as restaurant and hotel, recreation and culture and alcoholic beverage. By contrast, fixed expenditure on high necessity items increased after 1997 (Table 3.5). Medium necessity items have a relatively stable share over the same period while the share of high necessity items rose continuously to 51.6 percent in 2001. Nevertheless, the share of low necessity items in 2001 started to rise back to almost the pre-crisis level, indicating a strong recovery of private consumption.
10 Domestic Consumption Expenditure classified by the degree of necessity: (1) High level. This group includes basic necessities in everyday life; namely, Food & Non-alcoholic drinks, Housing, Water, Electricity, Gas and other Fuels, Households equipment and routine maintenance of the house, Health, Operation of personal transport equipment, Transport services and Education. (2) Medium level. This group is a mix ed group of both necessity and luxurious goods; namely, Clothing and footwear and Communication. Clothing and footwear also include high-end fashionable items whereas Communication also includes purchases of mobile phones and long distance calls. (3) Low level. This group includes luxurious or expensive goods; namely, Alcoholic beverages, Tobacco and narcotic, Furniture and furnishings, Carpets and other floor covering, Purchase of vehicles, Recreation and culture, Restaurant and hotel, and Other goods and services.
100,000
200,000
300,000
400,000
500,000
1994 1995 1996 1997 1998 1999 2000 2001-20
0
20
40
60
Savings %yoy
%yoy
Source: NESDB
million baht
Figure 3.12: Households’ Savings Figure 3.13: Household Expenditure on Low-level Necessity
-60-50-40-30-20-10
010203040
1994 1995 1996 1997 1998 1999 2000 2001
Low Necessity Items (Total) Alcoholic Beverages, Tobacco and NarcoticFurniture and Furnishings, Carpets and Other Floor Covering Perchase of VehiclesRecreation and Culture Restaurant and HotelOther Goods & Services
%yoy
Source: NESDB
19
Source: NESDB
0.90.73.00.10.5
0.80.92.90.20.4
0.61.13.00.20.5
0.31.64.00.20.5
0.52.13.70.20.9
0.42.13.80.10.7
0.41.93.40.10.6
0.41.73.00.10.8
Social Security ContributionInterest on Consumers’ DebtDirect TaxesOther Current Transfers to General Gvt.Current Transfers to the Rest of the World
86.384.281.778.683.183.581.983.1Private Consumption Expenditure
-5.43.1
-8.4
-5.52.7
-8.2
-5.22.4
-7.6
-5.31.8
-7.2
-4.22.4
-6.6
-4.22.7
-6.9
-3.72.9
-6.6
-2.53.2
-5.7
2) Net Exp. of Residents Abroado/w – (plus) Exp. of Residents Abroad
– (less) Exp. of Non-res. in the Country
8.410.612.914.89.59.411.710.9SAVINGS
91.751.611.029.2
89.750.611.327.9
86.949.811.226.0
83.948.710.724.5
87.347.312.427.7
87.645.012.630.1
85.644.011.829.8
85.644.611.629.5
1) Domestic Consumption Exp.o/w – High necessity
– Medium necessity– Low necessity
100100100100100100100100Disposable of Personal Income
20012000199919981997199619951994(% of total personal expenses)
Table 3.5: Share of Total Personal Expenses
Source: NESDB
0.0-0.10.20.00.1
0.3-0.20.00.0
-0.1
0.2-0.5-1.00.00.0
-0.1-0.40.40.0
-0.3
0.10.10.10.10.2
0.10.40.80.00.2
0.10.50.90.0
-0.1
0.10.30.50.00.4
Social Security ContributionInterest on Consumers’ DebtDirect TaxesOther Current Transfers to General Gvt.Current Transfers to the Rest of the World
5.04.92.8-2.63.69.311.310.7Private Consumption Expenditure
0.00.5
-0.5
-0.50.4
-0.9
0.20.5
-0.4
-1.3-0.6-0.7
-0.2-0.1-0.1
-0.80.1
-0.9
-1.80.1
-1.9
0.50.9
-0.4
2) Net Exp. of Residents Abroado/w – (plus) Exp. of Residents Abroad
– (less) Exp. of Non-res. in the Country
-1.9-2.0-1.95.60.6-1.52.6-1.1SAVINGS
5.02.70.12.3
5.32.20.42.7
2.70.90.41.4
-1.42.6
-1.4-2.6
3.84.50.4
-1.1
10.25.21.93.1
13.16.22.14.8
10.24.91.83.6
1) Domestic Consumption Exp.o/w – High necessity
– Medium necessity– Low necessity
3.32.8-0.42.44.89.315.310.9Disposable of Personal Income
20012000199919981997199619951994(%)
Table 3.6: Contribution to Growth of Personal Expenses
20
It is worth noting that households tended to switch expenditure between high and low necessity items which in turn helped absorb negative income shocks against household consumption. Calculated from the NESDB’s annual data on household’s income and expenditure, the income elasticity of consumption11 prior to the crisis was around 1. The income elasticity doubled in the more recent years, reflecting the higher ability of household to adjust consumption. Over the period 1994-2001, the income elasticity for low necessity items has a higher elasticity of 1.1, compared to 0.8 for high necessity items12. This reflects the ability of household to adjust their consumption expenditure flexibly. Households’ ability to switch between goods and services at different levels of necessity helps absorb shocks and thus maintain the overall consumption in time of crisis.
Under the low interest rate environment of the past few years, expenditure on durables which is sensitive to interest rate has expanded significantly. In particular, the purchase of vehicles (Figure 3.13) grew by an average rate of 28 percent per year during 1999-2001, contributing greatly to the growth of expenditure on low necessity items. This is consistent with the historically low rate of commercial bank lending as well as the increasing availability of consumer loans through other non-financial institutions or lending companies such as GE Capital and Aeons, which provide an easy access and alternative cheap finance to households.
The contribution to growth of domestic consumption expenditure (Table 3.6) has been increasingly important. Since 1999, domestic consumption expenditure has contributed almost to the entire growth of total expenses, coming mainly from the growth of high necessity items and low necessity items. Given the fast recovery in household consumption, overall economic activity should soon be strengthened and supportive to the growth of the Thai economy.
3.4 Debt Accumulation
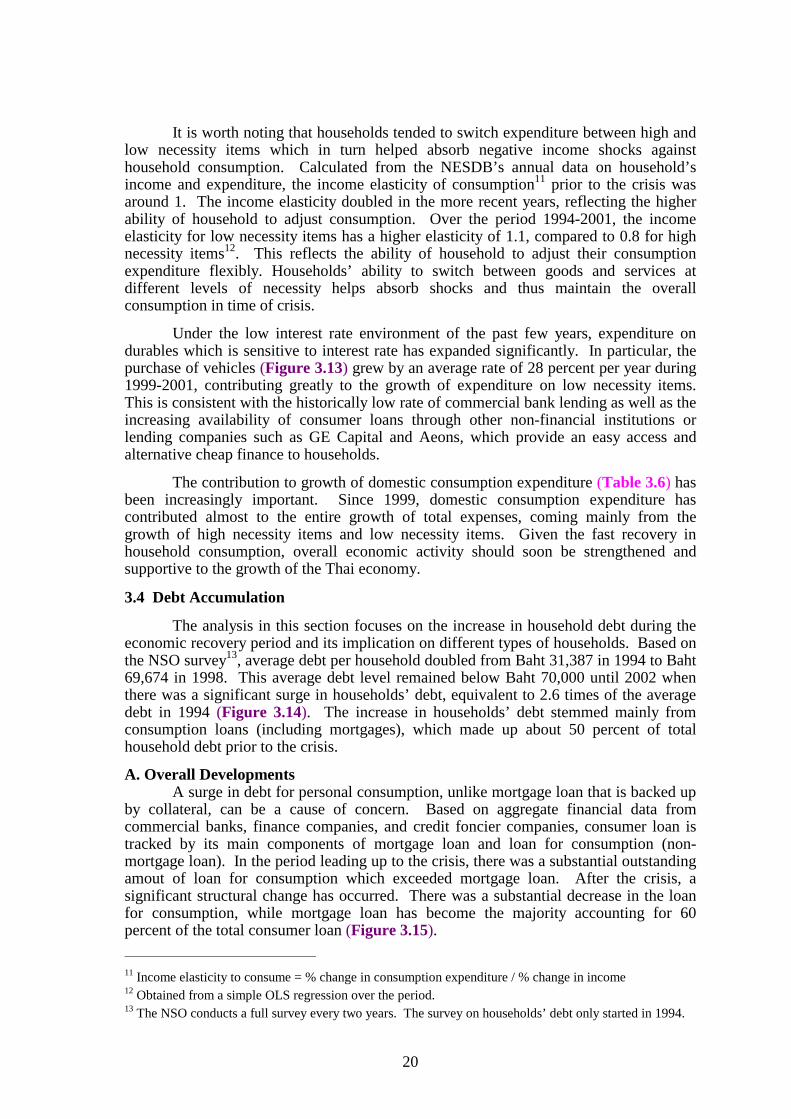
The analysis in this section focuses on the increase in household debt during the economic recovery period and its implication on different types of households. Based on the NSO survey13, average debt per household doubled from Baht 31,387 in 1994 to Baht 69,674 in 1998. This average debt level remained below Baht 70,000 until 2002 when there was a significant surge in households’ debt, equivalent to 2.6 times of the average debt in 1994 (Figure 3.14). The increase in households’ debt stemmed mainly from consumption loans (including mortgages), which made up about 50 percent of total household debt prior to the crisis.
A. Overall Developments A surge in debt for personal consumption, unlike mortgage loan that is backed up
by collateral, can be a cause of concern. Based on aggregate financial data from commercial banks, finance companies, and credit foncier companies, consumer loan is tracked by its main components of mortgage loan and loan for consumption (non-mortgage loan). In the period leading up to the crisis, there was a substantial outstanding amout of loan for consumption which exceeded mortgage loan. After the crisis, a significant structural change has occurred. There was a substantial decrease in the loan for consumption, while mortgage loan has become the majority accounting for 60 percent of the total consumer loan (Figure 3.15). 11 Income elasticity to consume = % change in consumption expenditure / % change in income 12 Obtained from a simple OLS regression over the period. 13 The NSO conducts a full survey every two years. The survey on households’ debt only started in 1994.
21
Mortgage loan outstanding did not drop significantly after the crisis while its growth rate remains low despite gradual improvement. By contrast, non-mortgage loan contracted by as much as 50 percent after the crisis but its growth has recovered relatively fast, with the growth rate of 32 percent in 2002, which exceeds those before the crisis. Its outstanding underwent a strong upward adjustment despite a small proportion relative to mortgage loan in recent years. While this is not a serious concern for now, the accumulation of household debt, particularly debt for consumptions should be monitored closely during the recovery process to make sure that it is sustainable.
B. Type of Debtors
In a more detailed analysis, households are grouped by socio-economic group into 2 groups; Group 1 - who receives higher than average income of all households, and Group 2 - who receives lower than average income of all households.
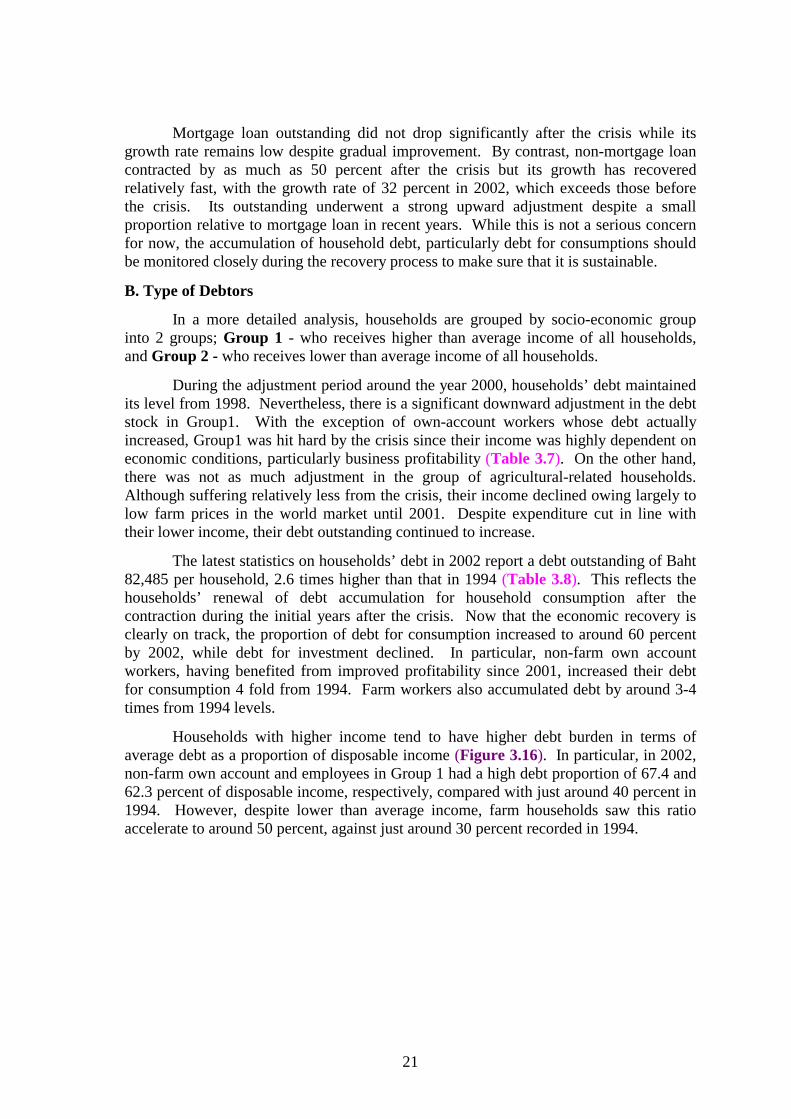
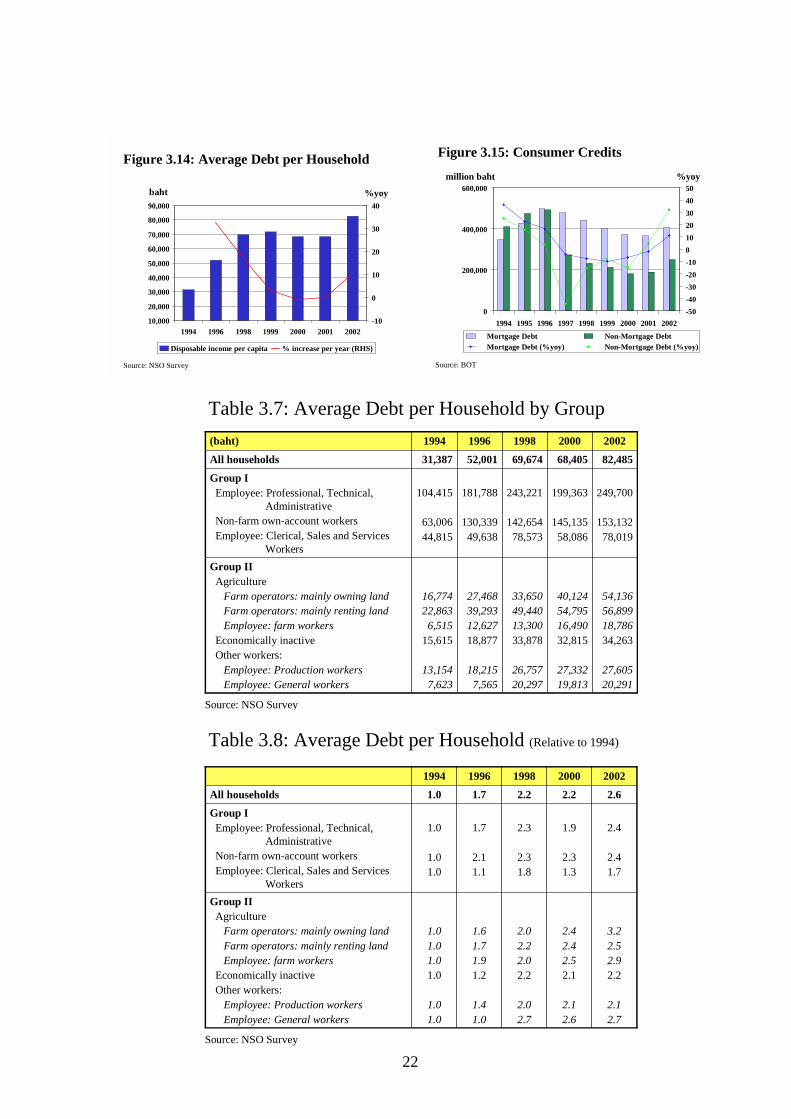
During the adjustment period around the year 2000, households’ debt maintained its level from 1998. Nevertheless, there is a significant downward adjustment in the debt stock in Group1. With the exception of own-account workers whose debt actually increased, Group1 was hit hard by the crisis since their income was highly dependent on economic conditions, particularly business profitability (Table 3.7). On the other hand, there was not as much adjustment in the group of agricultural-related households. Although suffering relatively less from the crisis, their income declined owing largely to low farm prices in the world market until 2001. Despite expenditure cut in line with their lower income, their debt outstanding continued to increase.
The latest statistics on households’ debt in 2002 report a debt outstanding of Baht 82,485 per household, 2.6 times higher than that in 1994 (Table 3.8). This reflects the households’ renewal of debt accumulation for household consumption after the contraction during the initial years after the crisis. Now that the economic recovery is clearly on track, the proportion of debt for consumption increased to around 60 percent by 2002, while debt for investment declined. In particular, non-farm own account workers, having benefited from improved profitability since 2001, increased their debt for consumption 4 fold from 1994. Farm workers also accumulated debt by around 3-4 times from 1994 levels.
Households with higher income tend to have higher debt burden in terms of average debt as a proportion of disposable income (Figure 3.16). In particular, in 2002, non-farm own account and employees in Group 1 had a high debt proportion of 67.4 and 62.3 percent of disposable income, respectively, compared with just around 40 percent in 1994. However, despite lower than average income, farm households saw this ratio accelerate to around 50 percent, against just around 30 percent recorded in 1994.
22
10,000
20,000
30,000
40,000
50,000
60,000
70,000
80,000
90,000
1994 1996 1998 1999 2000 2001 2002-10
0
10
20
30
40
Disposable income per capita % increase per year (RHS)
%yoy
Source: NSO Survey
baht
Figure 3.14: Average Debt per Household
0
200,000
400,000
600,000
1994 1995 1996 1997 1998 1999 2000 2001 2002-50-40-30-20-1001020304050
Mortgage Debt Non-Mortgage Debt Mortgage Debt (%yoy) Non-Mortgage Debt (%yoy)
%yoy
Source: BOT
million baht
Figure 3.15: Consumer Credits
Table 3.7: Average Debt per Household by Group
54,13656,89918,78634,263
27,60520,291
40,12454,79516,49032,815
27,33219,813
33,65049,44013,30033,878
26,75720,297
27,46839,29312,62718,877
18,2157,565
16,77422,863
6,51515,615
13,1547,623
Group IIAgriculture
Farm operators: mainly owning landFarm operators: mainly renting landEmployee: farm workers
Economically inactiveOther workers:
Employee: Production workersEmployee: General workers
249,700
153,13278,019
199,363
145,13558,086
243,221
142,65478,573
181,788
130,33949,638
104,415
63,00644,815
Group IEmployee: Professional, Technical,
AdministrativeNon-farm own-account workersEmployee: Clerical, Sales and Services
Workers
82,48568,40569,67452,00131,387All households
20022000199819961994(baht)
Source: NSO Survey
Table 3.8: Average Debt per Household (Relative to 1994)
3.22.52.92.2
2.12.7
2.42.42.52.1
2.12.6
2.02.22.02.2
2.02.7
1.61.71.91.2
1.41.0
1.01.01.01.0
1.01.0
Group IIAgriculture
Farm operators: mainly owning landFarm operators: mainly renting landEmployee: farm workers
Economically inactiveOther workers:
Employee: Production workersEmployee: General workers
2.4
2.41.7
1.9
2.31.3
2.3
2.31.8
1.7
2.11.1
1.0
1.01.0
Group IEmployee: Professional, Technical,
AdministrativeNon-farm own-account workersEmployee: Clerical, Sales and Services
Workers
2.62.22.21.71.0All households
20022000199819961994
Source: NSO Survey
23
C. Source of Debt
Looking at source of debt in the survey, most households obtain loans from outside the financial system (over 30 percent of total loans). This has been the general structure before the crisis, except for 1998 when commercial bank loans accounted for up to 50 percent mainly to non-farm own business borrowers. Such high proportion of loans from outside financial system reflects high demand for loans which could be absorbed into the financial system in the medium term when banks start to expand more credits and households are allowed increasing access to funds in the financial system.
The second most important source of loans before the crisis came from commercial banks. However, the role of commercial banks has declined after the crisis as households are relying increasingly on saving cooperatives and Bank for Agricultural and Agricultural Cooperatives. This is particularly evident among the non-farm own account workers and employees in professional, technical, administrative work as well as clerical, sales and services (Figure 3.17A). This group has a higher than average income and therefore has access to bank loan. However, as banks have become more risk-averse and more selective in extending credits, bank loan has shrunk substantially after the crisis.
Moreover, there are also an increasing number of alternative funds available to households. Among others are the government’s Village Funds, which may have played a part in easing financial constraints and provides more access to loans for the low income group whose access to loans within the financial system has been hitherto limited. This is particularly true among the lower middle class; namely, farm operators, agricultural and non-agricultural workers, and economically inactive persons (such as housewives) (Figure 3.17B).
D. Debt Service Capacity
Debt accumulation of different groups has different implications. Those in Group1 generally borrow from financial institutions. Thus, it is important to monitor the risk management of financial institutions. On the other hand, those in Group2 rely more on loans from outside the financial system with an increasing role of government-supported funds. In this instance, it is important to build a strong credit culture in their community to limit potential fiscal burden and to prepare this group of potential borrowers for eventual entry into the financial system in the near future.
Even though the debt stock has been rising, low interest rates have significantly lessened the debt service burden of households (Figure 3.18). The ratio of interest expense on consumers’ debt to disposable personal income fell from the peak of 2.2 percent in 1997 to 0.8 percent in 2001. This is due to declining interest rates on the one hand, and to higher growth of disposable personal income on the other. Disposable personal income per capita expanded by 2.4 percent in 2001. Interest on consumer’s debt as a proportion of total consumption expenditure also declined from the peak of 2.5 percent in 1997 to 0.9 percent in 2002. Even though the interest income declined significantly, the lower interest burden helped maintain the net interest income as a proportion of disposable personal income at just over 5 percent and declining. Such reductions of interest burden should continue to support the households’ consumption in the medium term.
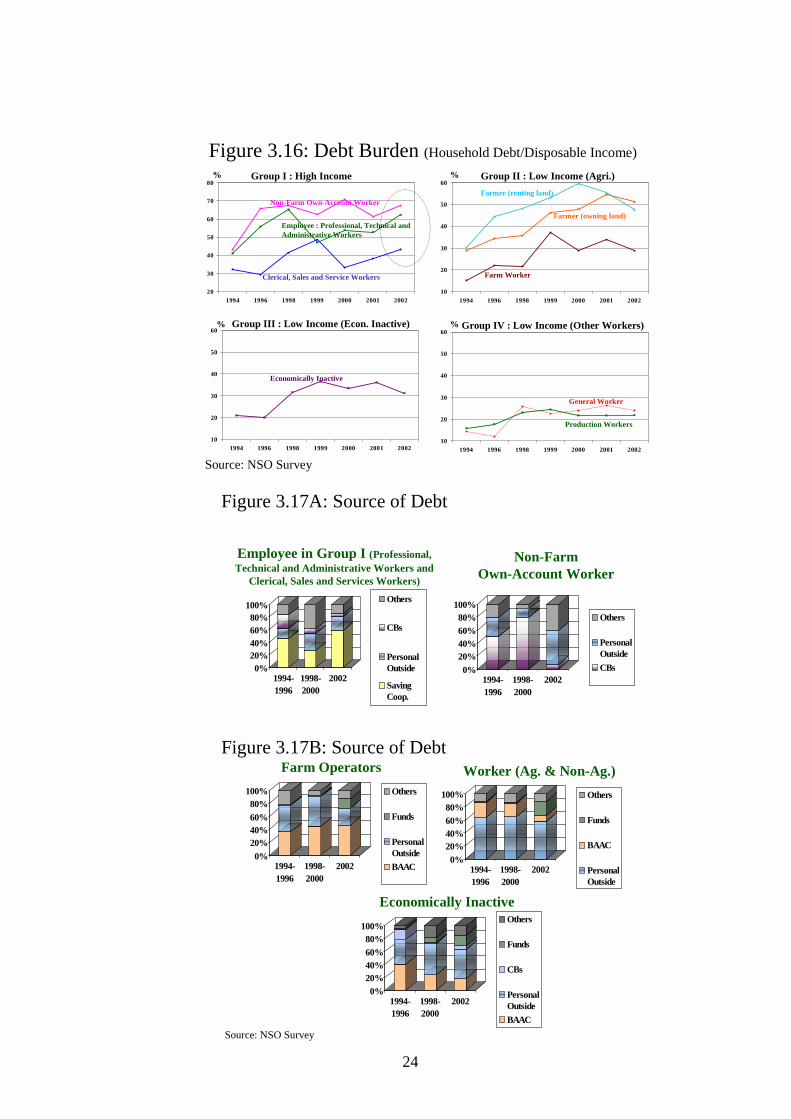
24
20
30
40
50
60
70
80
1994 1996 1998 1999 2000 2001 2002
Source: NSO Survey
Group I : High Income
Employee : Professional, Technical and Administrative Workers
Non-Farm Own-Account Worker
Clerical, Sales and Service Workers
10
20
30
40
50
60
1994 1996 1998 1999 2000 2001 2002
Group II : Low Income (Agri.)Farmer (renting land)
Farmer (owning land)
Farm Worker
10
20
30
40
50
60
1994 1996 1998 1999 2000 2001 2002
Group III : Low Income (Econ. Inactive)
Economically Inactive
10
20
30
40
50
60
1994 1996 1998 1999 2000 2001 2002
Group IV : Low Income (Other Workers)
Production Workers
General Worker
% %
% %
Figure 3.16: Debt Burden (Household Debt/Disposable Income)
Figure 3.17A: Source of Debt
Source: NSO Survey
Employee in Group I (Professional, Technical and Administrative Workers and
Clerical, Sales and Services Workers)
0%20%40%60%80%
100%
1994-1996
1998-2000
2002
Others
CBs
PersonalOutside
SavingCoop.
Non-Farm Own-Account Worker
0%20%40%60%80%
100%
1994-1996
1998-2000
2002
Others
PersonalOutsideCBs
Figure 3.17B: Source of Debt
Source: NSO Survey
Economically Inactive
0%20%40%60%80%
100%
1994-1996
1998-2000
2002
Others
Funds
CBs
PersonalOutsideBAAC
Farm Operators
0%20%40%60%80%
100%
1994-1996
1998-2000
2002
Others
Funds
PersonalOutsideBAAC
Worker (Ag. & Non-Ag.)
0%20%40%60%80%
100%
1994-1996
1998-2000
2002
Others
Funds
BAAC
PersonalOutside
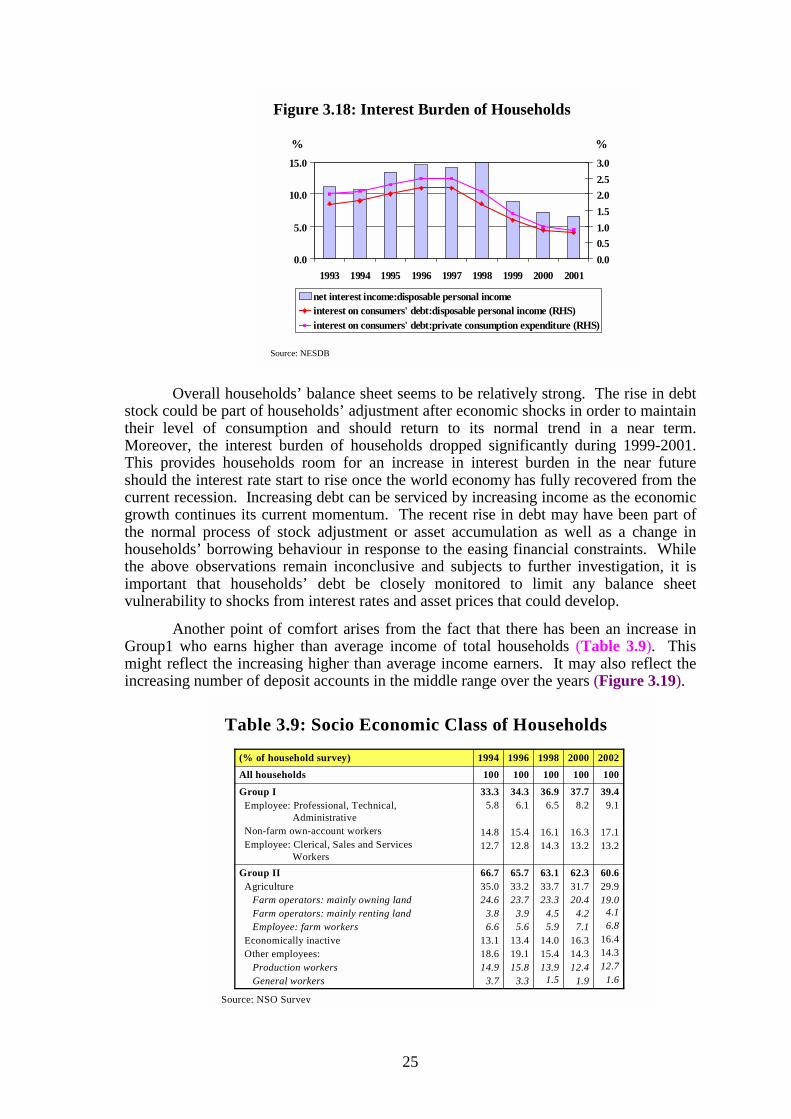
25
Overall households’ balance sheet seems to be relatively strong. The rise in debt stock could be part of households’ adjustment after economic shocks in order to maintain their level of consumption and should return to its normal trend in a near term. Moreover, the interest burden of households dropped significantly during 1999-2001. This provides households room for an increase in interest burden in the near future should the interest rate start to rise once the world economy has fully recovered from the current recession. Increasing debt can be serviced by increasing income as the economic growth continues its current momentum. The recent rise in debt may have been part of the normal process of stock adjustment or asset accumulation as well as a change in households’ borrowing behaviour in response to the easing financial constraints. While the above observations remain inconclusive and subjects to further investigation, it is important that households’ debt be closely monitored to limit any balance sheet vulnerability to shocks from interest rates and asset prices that could develop.
Another point of comfort arises from the fact that there has been an increase in Group1 who earns higher than average income of total households (Table 3.9). This might reflect the increasing higher than average income earners. It may also reflect the increasing number of deposit accounts in the middle range over the years (Figure 3.19).
60.629.919.0
4.16.8
16.414.312.7
1.6
62.331.720.4
4.27.1
16.314.312.4
1.9
63.133.723.3
4.55.9
14.015.413.9
1.5
65.733.223.7
3.95.6
13.419.115.8
3.3
66.735.024.6
3.86.6
13.118.614.9
3.7
Group IIAgriculture
Farm operators: mainly owning landFarm operators: mainly renting landEmployee: farm workers
Economically inactiveOther employees:
Production workersGeneral workers
39.49.1
17.113.2
37.78.2
16.313.2
36.96.5
16.114.3
34.36.1
15.412.8
33.35.8
14.812.7
Group IEmployee: Professional, Technical,
AdministrativeNon-farm own-account workersEmployee: Clerical, Sales and Services
Workers
100100100100100All households20022000199819961994(% of household survey)
Source: NSO Survey
Table 3.9: Socio Economic Class of Households
0.0
5.0
10.0
15.0
1993 1994 1995 1996 1997 1998 1999 2000 20010.00.51.01.52.02.53.0
net interest income:disposable personal incomeinterest on consumers' debt:disposable personal income (RHS)interest on consumers' debt:private consumption expenditure (RHS)
%
Source: NESDB
%
Figure 3.18: Interest Burden of Households
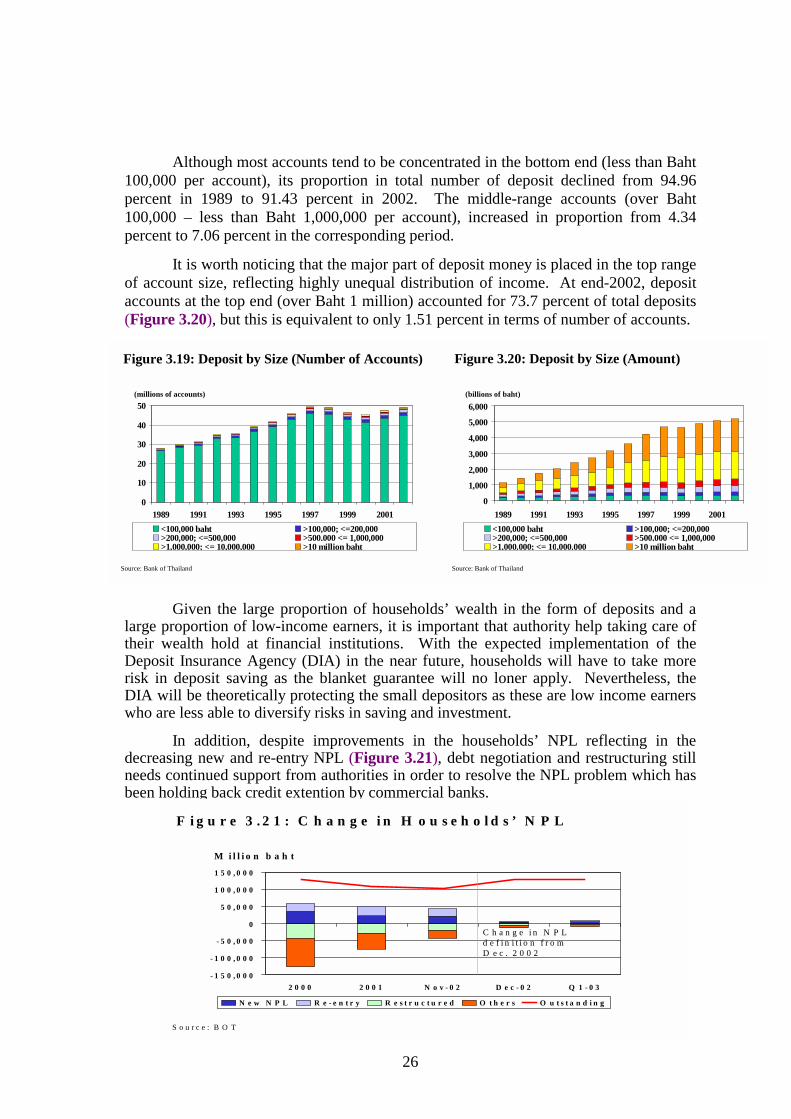
26
Although most accounts tend to be concentrated in the bottom end (less than Baht 100,000 per account), its proportion in total number of deposit declined from 94.96 percent in 1989 to 91.43 percent in 2002. The middle-range accounts (over Baht 100,000 – less than Baht 1,000,000 per account), increased in proportion from 4.34 percent to 7.06 percent in the corresponding period.
It is worth noticing that the major part of deposit money is placed in the top range of account size, reflecting highly unequal distribution of income. At end-2002, deposit accounts at the top end (over Baht 1 million) accounted for 73.7 percent of total deposits (Figure 3.20), but this is equivalent to only 1.51 percent in terms of number of accounts.
Given the large proportion of households’ wealth in the form of deposits and a large proportion of low-income earners, it is important that authority help taking care of their wealth hold at financial institutions. With the expected implementation of the Deposit Insurance Agency (DIA) in the near future, households will have to take more risk in deposit saving as the blanket guarantee will no loner apply. Nevertheless, the DIA will be theoretically protecting the small depositors as these are low income earners who are less able to diversify risks in saving and investment.
In addition, despite improvements in the households’ NPL reflecting in the decreasing new and re-entry NPL (Figure 3.21), debt negotiation and restructuring still needs continued support from authorities in order to resolve the NPL problem which has been holding back credit extention by commercial banks.
0
1,000
2,000
3,000
4,000
5,000
6,000
1989 1991 1993 1995 1997 1999 2001<100,000 baht >100,000; <=200,000>200,000; <=500,000 >500.000 <= 1,000,000>1,000,000; <= 10,000,000 >10 million baht
Source: Bank of Thailand
(billions of baht)
Figure 3.20: Deposit by Size (Amount)
S o u r c e : B O T
M i l l i o n b a h t
F i g u r e 3 . 2 1 : C h a n g e i n H o u s e h o l d s ’ N P L
- 1 5 0 , 0 0 0
- 1 0 0 , 0 0 0
- 5 0 , 0 0 0
0
5 0 , 0 0 0
1 0 0 , 0 0 0
1 5 0 , 0 0 0
2 0 0 0 2 0 0 1 N o v - 0 2 D e c - 0 2 Q 1 - 0 3
N e w N P L R e - e n t r y R e s t r u c t u r e d O t h e r s O u t s t a n d i n g
C h a n g e i n N P L d e f i n i t i o n f r o m D e c . 2 0 0 2
0
10
20
30
40
50
1989 1991 1993 1995 1997 1999 2001<100,000 baht >100,000; <=200,000>200,000; <=500,000 >500.000 <= 1,000,000>1,000,000; <= 10,000,000 >10 million baht
Source: Bank of Thailand
(millions of accounts)
Figure 3.19: Deposit by Size (Number of Accounts)
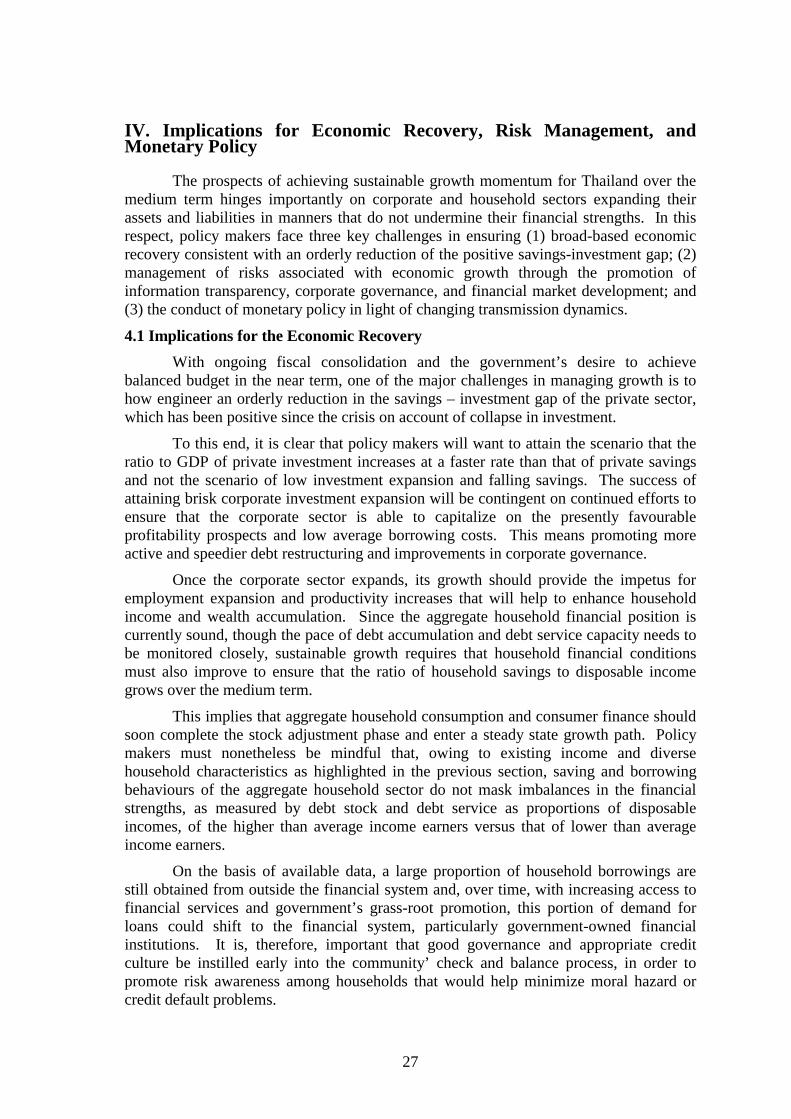
27
IV. Implications for Economic Recovery, Risk Management, and Monetary Policy
The prospects of achieving sustainable growth momentum for Thailand over the medium term hinges importantly on corporate and household sectors expanding their assets and liabilities in manners that do not undermine their financial strengths. In this respect, policy makers face three key challenges in ensuring (1) broad-based economic recovery consistent with an orderly reduction of the positive savings-investment gap; (2) management of risks associated with economic growth through the promotion of information transparency, corporate governance, and financial market development; and (3) the conduct of monetary policy in light of changing transmission dynamics. 4.1 Implications for the Economic Recovery
With ongoing fiscal consolidation and the government’s desire to achieve balanced budget in the near term, one of the major challenges in managing growth is to how engineer an orderly reduction in the savings – investment gap of the private sector, which has been positive since the crisis on account of collapse in investment.
To this end, it is clear that policy makers will want to attain the scenario that the ratio to GDP of private investment increases at a faster rate than that of private savings and not the scenario of low investment expansion and falling savings. The success of attaining brisk corporate investment expansion will be contingent on continued efforts to ensure that the corporate sector is able to capitalize on the presently favourable profitability prospects and low average borrowing costs. This means promoting more active and speedier debt restructuring and improvements in corporate governance.
Once the corporate sector expands, its growth should provide the impetus for employment expansion and productivity increases that will help to enhance household income and wealth accumulation. Since the aggregate household financial position is currently sound, though the pace of debt accumulation and debt service capacity needs to be monitored closely, sustainable growth requires that household financial conditions must also improve to ensure that the ratio of household savings to disposable income grows over the medium term.
This implies that aggregate household consumption and consumer finance should soon complete the stock adjustment phase and enter a steady state growth path. Policy makers must nonetheless be mindful that, owing to existing income and diverse household characteristics as highlighted in the previous section, saving and borrowing behaviours of the aggregate household sector do not mask imbalances in the financial strengths, as measured by debt stock and debt service as proportions of disposable incomes, of the higher than average income earners versus that of lower than average income earners.
On the basis of available data, a large proportion of household borrowings are still obtained from outside the financial system and, over time, with increasing access to financial services and government’s grass-root promotion, this portion of demand for loans could shift to the financial system, particularly government-owned financial institutions. It is, therefore, important that good governance and appropriate credit culture be instilled early into the community’ check and balance process, in order to promote risk awareness among households that would help minimize moral hazard or credit default problems.
28
4.2 Implications for Risk Management and Financial Market Development
Sectoral balance sheets provide useful information for policy makers to identify and correct weaknesses before they start to generate difficulties in the economy. However, since balance sheet information in practice is not readily available and usually has significant time lags, policymakers are bounded to an ex-post analysis and therefore need to identify gaps in these data and accordingly develop sources and accountability for providing such data.
In the near term, without such data, policymakers can assess changes in sectoral financial conditions by monitoring closely supply, demand, and price developments in domestic financial markets, particularly of debt, equity, as well as credit activities of bank and non-bank institutions, together with external capital account developments. This is to ensure that households do not over-borrow for consumption while the structure of corporate liabilities should be sufficiently diversified to cope with liquidity risks, market risks, and currency and maturity mismatches.
Even though this paper does not explicitly account for the balance sheet adjustments of the banking sector after the 1997 crisis, it recognizes the sector’s importance in terms of interrelations with the balance sheets of the household and corporate sectors, particularly its role as financial intermediary between household savings and corporate investment. Suffice it to say then that policy efforts to promote the strengths of household and corporate balance sheets will also help support the strength of the banking sector’s balance sheet, and vice versa.
As the economy’s growth momentum continues and domestic financial markets advance both in width and depth, households will interrelate with the banking sector not only as fund providers as but also as borrowers for consumption and wealth accumulation. Consequently, the linkage between the balance sheet of households and that of banks will increasingly tighten.
As savers, households will continue to depend on banks to generate return for their savings, i.e., deposit rates, such that banking profitability and efficiency will continue to have implications for households’ financial returns. On the other hand, as the banking sector lends more to households, its balance sheet will also become more exposed to the strength or weakness of the household balance sheet.
Over time, in tandem with growth of new financial instruments, households can diversify saving portfolios away from deposits and land to debt and equity investment, either directly or indirectly via investment in mutual funds. The relationship between households and banks will become more complex because not only will the banking sector be affected directly by changes in prices of debt and equity in their own balance sheets, it will affected by changes in the strength of household balance sheet following asset price changes, and vice versa.
This not to say that increasing bank lending to households is necessarily bad as greater loan portfolio diversification toward more housing mortgage with houses and land as collaterals may in fact enhance the asset quality of banks’ balance sheet. However, the changing composition of credit portfolio with higher shares of mortgage and consumer finance would require banks to adjust their risk assessment framework and means to manage and reallocate risks, particularly the ability to shift risky assets out of
29
their credit portfolios.14 In the meantime, changing interrelation between the banking sector and the corporate sector also have implications on bank’s balance sheet that, in turn, impacts the household balance sheet through changes in bank profitability and deposit rates. In particular, as financial market growth inevitably means more channels for corporate borrowers to raise funds in addition to bank credit, banks will face fiercer competition in the loan market and this can affect credit expansion and the quality of collaterals.
Financial sector development policy that promotes diversity of players in a level-playing field, which have an array of financial instruments and markets for managing and transferring risks and under the umbrella of transparent foreclosure and bankruptcy laws with effective court process, will be key for all the economic sectors in safeguarding the strengths of their own balance sheets over the medium term.
It is important to emphasize, however, that financial market policy should not attempt to pick winners, i.e., targeting development of any particular segment of financial markets. Instead, it should be a strategy that promotes breadth and depth of the market in general. In this connection, the authorities should, in close coordination with market participants, prioritize or phase in the development stages as resources for market development, financial as well as personnel, are limited and in some cases the growth of one particular segment of the market may be reliant on the existence and efficient functioning of another part of financial markets15.
While many market development initiatives require policy efforts to ensure market stability, consumer protection, tax neutrality or incentives, and orderly entry/exit, the direct participation of public agencies as suppliers of financial instruments and as demanders of funds should be systematic and not create undue distortions in the pricing, trading, and development of financial markets in general.
Currently, the public sector role in financial markets seems ambiguous because, on the supply side, the faster consolidation in the budgetary financing requirement will reduce the supply of government securities whereas the expanding extra-budgetary involvement, together with privatization initiatives, will surely raise public demand for funds from both debt and capital markets. In this regard, clear communications regarding the government’s intended participation in financial and capital markets will exemplify commitment to transparency and governance.
14 The securitization of bank credits has not been as popular in Thailand as in other countries such as Australia for a number of reasons. One of these is that the current excess liquidity situation and unresolved non-performing debt problem discourage banks from offloading performing assets from their balance sheets, which would exacerbate the excess liquidity problem. In addition, existing players in Thai financial markets are not diverse enough to generate demand for assets of differentiated risk classes. The development and open access of new players, particularly mutual funds and insurance companies with expanding liability base, will be instrumental to providing demand for securitized bank credits. 15 In Thailand, the relatively efficient functioning of the cash, swap, and government and corporate bond markets provide a fundamental support for liquidity management and hedging for financial institutions and corporations -- the activities which will be augmented by the continued growth of corporate bond markets and derivatives trading, as well as the birth of local futures market for financial products in the not-too-distant future.
30
4.3 Implications for Monetary Policy Unless there appears price pressure in the economy, the supportive monetary environment for stock market growth, debt financing, and asset price recovery, will facilitate firms’ progress in operational and financial restructuring. Meanwhile, an accommodative monetary policy would also enable households to complete the stock adjustment of wealth that was impacted by the crisis that would, in turn, help the economy to count on consumption growth until the new investment cycle picks up and solidifies.
Over the medium term, changing interrelations between the balance sheets of households, firms, and banks as well as other types of financial intermediaries, mean that the analysis and formulation of monetary policy to ensure economic stability and sustainable growth will be increasingly challenged by such complexities.
In particular, there are three noteworthy issues on the future conduct of monetary policy:
First, even though continued growth should lead to an increase in demand for investment financing over the medium term, it is not conclusive whether bank loans would be the most preferred financing source going forward. Nevertheless, with the disintermediation process being gradual because financial markets take time to develop, the bank-lending channel should continue to remain quite an important channel for monetary policy transmission. The impact of an interest rate change on the corporate cost of funds would, however, depend largely on how it works through the corporate liabilities structure and the factors driving corporate investment decisions.
Second, with increasing household financial savings, consumer loans and mortgages, monetary policy change could work through the household balance sheet more directly than in the past. Moreover, asset price changes would also have more bearing on the household balance sheet through holding of stocks and other financial assets, directly or indirectly via investment in mutual funds. In this respect, efforts to understand asset price behavior and how it responds to monetary policy will be important in assessing and formulating appropriate and timely changes in monetary policy.
Third, the disintermediation process that is expected to happen over time would likely weaken the relationship between current monetary aggregates and economic activities further. The central bank will have to develop and monitor broader monetary aggregates that cover liquid assets of more diverse financial players, including mutual funds and insurance companies. However, since the current monetary policy framework employs the interest rate as instrument and not monetary targeting, the development of such broader monetary aggregates data will serve as indicators of financial developments and not policy targets.
Going forward, it is crucial that policy makers are aware of the implications of changes in corporate and household assets and liabilities on the exposure of private sector to risks in order to promote efficient risk management, including sufficient cushion of reserves and appropriate prudential and accounting guidelines as well as information disclosure. Moreover, such analysis of sectoral financial strengths will help them evaluate trade-offs between policy objectives in case of systemic threat and assess a case for effective financial intervention or official support.
31
V. Conclusion The country’s aggregate balance sheet, consisting of households, government,
financial, corporate, and foreign sectors, reflects the overall economy’s financial resilience against shocks. Therefore, one of the major lessons learnt from the 1997 economic and financial crises is that the success of macroeconomic management to promote sustainable growth cannot neglect policies to safeguard against any potential imbalances in the balance sheets of key economic agencies. In assessing the strengths of key economic sectors in supporting economic recovery, this paper focuses on examining the financial conditions of the corporate sector and households, focusing on the stock variables, i.e., assets and liabilities, complementing the traditional approach that focuses on flow variables.
On the basis of available data, we found that both corporate and household sectors have made considerable progress in terms of asset and liability adjustments since 1997. The financial conditions of non-bank firms listed in the SET have improved with regards to profitability and solvency, but some sectors, particularly manufacturing, continue to shoulder problems of asset and debt overhang that require a more active and speedier restructuring together with improvements in governance. For households, expenditure substitution was key in smoothing consumption during income falls, which was supported by transfer from government.
From 2001-present, the pace of recovery of the corporate and household sectors has been aided by the country’s overall economic growth, which increased household income, while accelerating profitability for the corporate sector. There was evidence of firms reducing asset though the liability adjustment was primarily debt switching from bank and foreign loans to cheaper debts. As a result, a number of firms continued to be highly leveraged. We are therefore concerned on the continued unresolved problem of NPL that could hinder the prospects of corporate balance sheet expansion.
As income rises, households have re-accumulated wealth, particularly house and land. At present, this sector seems to be a position to increase debt as long as its stock of debt and interest expenses as ratios to disposable incomes do not increase too rapidly but stabilize in a medium-term steady state. Nevertheless, vigilance is required in monitoring households of different socioeconomic groups and income categories as each relies on different sources of debt that have differing implications on systemic vulnerabilities.
This paper highlighted three key policy challenges in managing the economic recovery. First is an attainment of a faster rate of increase of the ratio to GDP of private investment than that of private savings in order to close the private savings – investment gap. Second is the need to construct and disseminate data that monitor changes in assets and liabilities of key economic sectors, through the promotion of governance and financial market development. This is in order to promote risk awareness and management as balance sheet interrelations between household, corporate, and banking sectors tighten, with weakness in one balance sheet can spill over onto balance sheet of other sectors.
The last challenge relates directly to monetary policy. In the near term, accommodative policy should be helpful for the corporate sector to complete its balance sheet adjustment process while enabling households to build up the stock of assets without undermining their medium-term financial strengths. Over the medium term, the central bank needs to monitor the effectiveness of the transmission channels of monetary policy, in light of changing dynamics between monetary aggregates and economic activities and that between asset price movements and its inflation target.
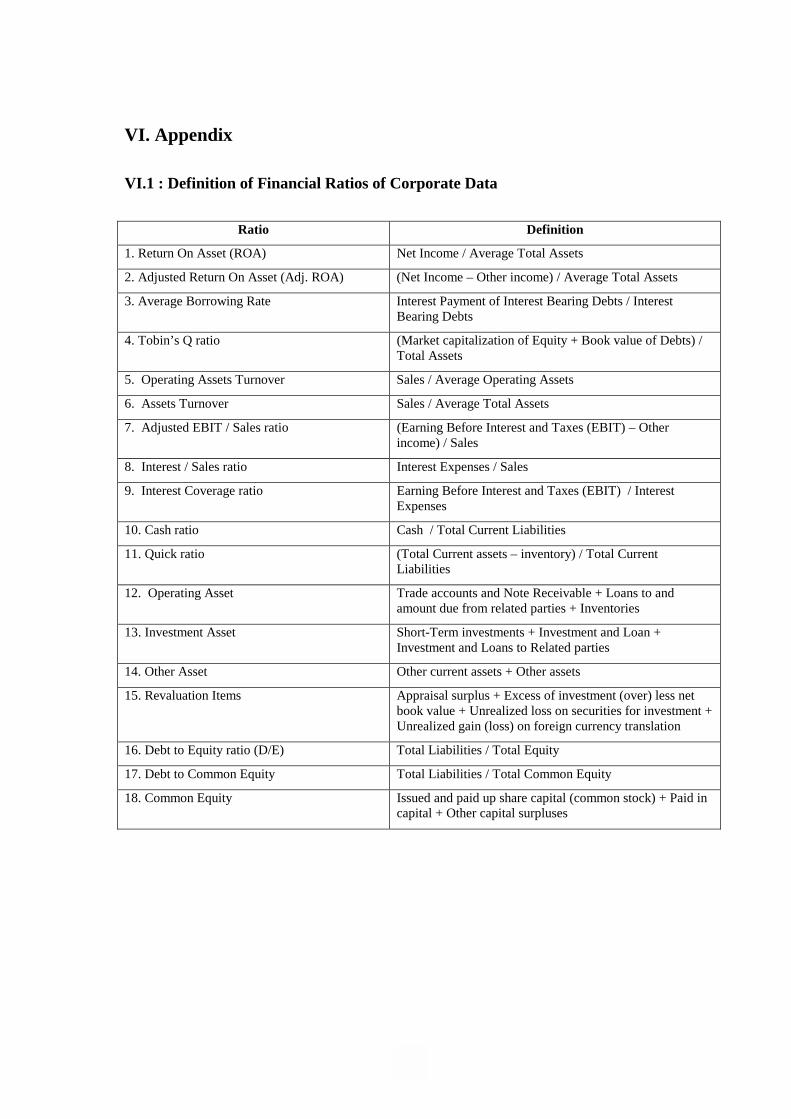
32
VI. Appendix VI.1 : Definition of Financial Ratios of Corporate Data
Ratio Definition
1. Return On Asset (ROA) Net Income / Average Total Assets
2. Adjusted Return On Asset (Adj. ROA) (Net Income – Other income) / Average Total Assets
3. Average Borrowing Rate Interest Payment of Interest Bearing Debts / Interest Bearing Debts
4. Tobin’s Q ratio (Market capitalization of Equity + Book value of Debts) / Total Assets
5. Operating Assets Turnover Sales / Average Operating Assets
6. Assets Turnover Sales / Average Total Assets
7. Adjusted EBIT / Sales ratio (Earning Before Interest and Taxes (EBIT) – Other income) / Sales
8. Interest / Sales ratio Interest Expenses / Sales
9. Interest Coverage ratio Earning Before Interest and Taxes (EBIT) / Interest Expenses
10. Cash ratio Cash / Total Current Liabilities
11. Quick ratio (Total Current assets – inventory) / Total Current Liabilities
12. Operating Asset Trade accounts and Note Receivable + Loans to and amount due from related parties + Inventories
13. Investment Asset Short-Term investments + Investment and Loan + Investment and Loans to Related parties
14. Other Asset Other current assets + Other assets
15. Revaluation Items Appraisal surplus + Excess of investment (over) less net book value + Unrealized loss on securities for investment + Unrealized gain (loss) on foreign currency translation
16. Debt to Equity ratio (D/E) Total Liabilities / Total Equity
17. Debt to Common Equity Total Liabilities / Total Common Equity
18. Common Equity Issued and paid up share capital (common stock) + Paid in capital + Other capital surpluses
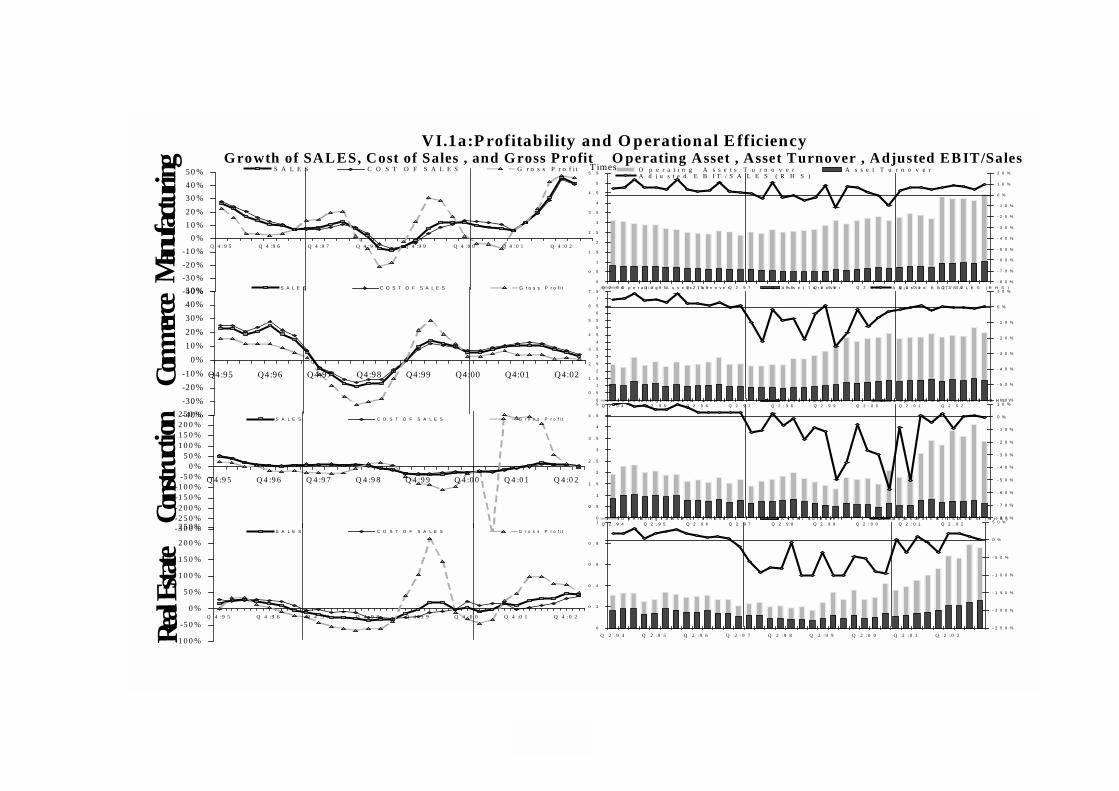
33
- 4 0 %- 3 0 %- 2 0 %- 1 0 %
0 %1 0 %2 0 %3 0 %4 0 %5 0 %
Q 4 : 9 5 Q 4 : 9 6 Q 4 : 9 7 Q 4 : 9 8 Q 4 : 9 9 Q 4 : 0 0 Q 4 : 0 1 Q 4 : 0 2
S A L E S C O S T O F S A L E S G r o s s P r o f i t
0
0 . 2
0 . 4
0 . 6
0 . 8
1
Q 2 : 9 4 Q 2 : 9 5 Q 2 : 9 6 Q 2 : 9 7 Q 2 : 9 8 Q 2 : 9 9 Q 2 : 0 0 Q 2 : 0 1 Q 2 : 0 2- 2 5 0 %
- 2 0 0 %
- 1 5 0 %
- 1 0 0 %
- 5 0 %
0 %
5 0 %O p e r a t i n g A s s e t s T u r n o v e r A s s e t T u r n o v e r A d j u s t e d E B I T / S A L E S ( R H S )0
0 . 5
1
1 . 5
2
2 . 5
3
3 . 5
4
4 . 5
5
Q 2 : 9 4 Q 2 : 9 5 Q 2 : 9 6 Q 2 : 9 7 Q 2 : 9 8 Q 2 : 9 9 Q 2 : 0 0 Q 2 : 0 1 Q 2 : 0 2- 8 0 %
- 7 0 %
- 6 0 %
- 5 0 %
- 4 0 %
- 3 0 %
- 2 0 %
- 1 0 %
0 %
1 0 %O p e r a t i n g A s s e t s T u r n o v e r A s s e t T u r n o v e r A d j u s t e d E B I T / S A L E S ( R H S )0
0 . 5
1
1 . 5
2
2 . 5
3
3 . 5
4
4 . 5
5
5 . 5
6
6 . 5
7
7 . 5
Q 2 : 9 4 Q 2 : 9 5 Q 2 : 9 6 Q 2 : 9 7 Q 2 : 9 8 Q 2 : 9 9 Q 2 : 0 0 Q 2 : 0 1 Q 2 : 0 2- 6 0 %
- 5 0 %
- 4 0 %
- 3 0 %
- 2 0 %
- 1 0 %
0 %
1 0 %O p e r a t i n g A s s e t s T u r n o v e r A s s e t T u r n o v e r A d j u s t e d E B I T / S A L E S ( R H S )
0
0 . 5
1
1 . 5
2
2 . 5
3
3 . 5
4
4 . 5
5
5 . 5
Q 2 : 9 4 Q 2 : 9 5 Q 2 : 9 6 Q 2 : 9 7 Q 2 : 9 8 Q 2 : 9 9 Q 2 : 0 0 Q 2 : 0 1 Q 2 : 0 2- 8 0 %
- 7 0 %
- 6 0 %
- 5 0 %
- 4 0 %
- 3 0 %
- 2 0 %
- 1 0 %
0 %
1 0 %
2 0 %O p e r a t i n g A s s e t s T u r n o v e r A s s e t T u r n o v e rA d j u s t e d E B I T / S A L E S ( R H S )
Man u
fa ct u r
in gCo
mmerc
e Co
nstruc
tion
Real E
state Growth of SALES, Cost of Sales , and Gross Profit O perating Asset , Asset Turnover , Adjusted EB IT/Sales
- 3 0 0 %- 2 5 0 %- 2 0 0 %- 1 5 0 %- 1 0 0 %
- 5 0 %0 %
5 0 %1 0 0 %1 5 0 %2 0 0 %2 5 0 %
Q 4 : 9 5 Q 4 : 9 6 Q 4 : 9 7 Q 4 : 9 8 Q 4 : 9 9 Q 4 : 0 0 Q 4 : 0 1 Q 4 : 0 2
S A L E S C O S T O F S A L E S G r o s s P r o f i t
- 1 0 0 %
- 5 0 %
0 %
5 0 %
1 0 0 %
1 5 0 %
2 0 0 %
2 5 0 %
Q 4 :9 5 Q 4 :9 6 Q 4 :9 7 Q 4 :9 8 Q 4 :9 9 Q 4 :0 0 Q 4 :0 1 Q 4 :0 2
S A L E S C O S T O F S A L E S G r o s s P r o f i t
- 4 0 %- 3 0 %- 2 0 %- 1 0 %
0 %1 0 %2 0 %3 0 %4 0 %5 0 %
Q 4 :9 5 Q 4 :9 6 Q 4 :9 7 Q 4 :9 8 Q 4 :9 9 Q 4 :0 0 Q 4 :0 1 Q 4 :0 2
S A L E S C O S T O F S A L E S G r o s s P r o f i t T imes
VI.1a:P rofitability and O perational E fficiency
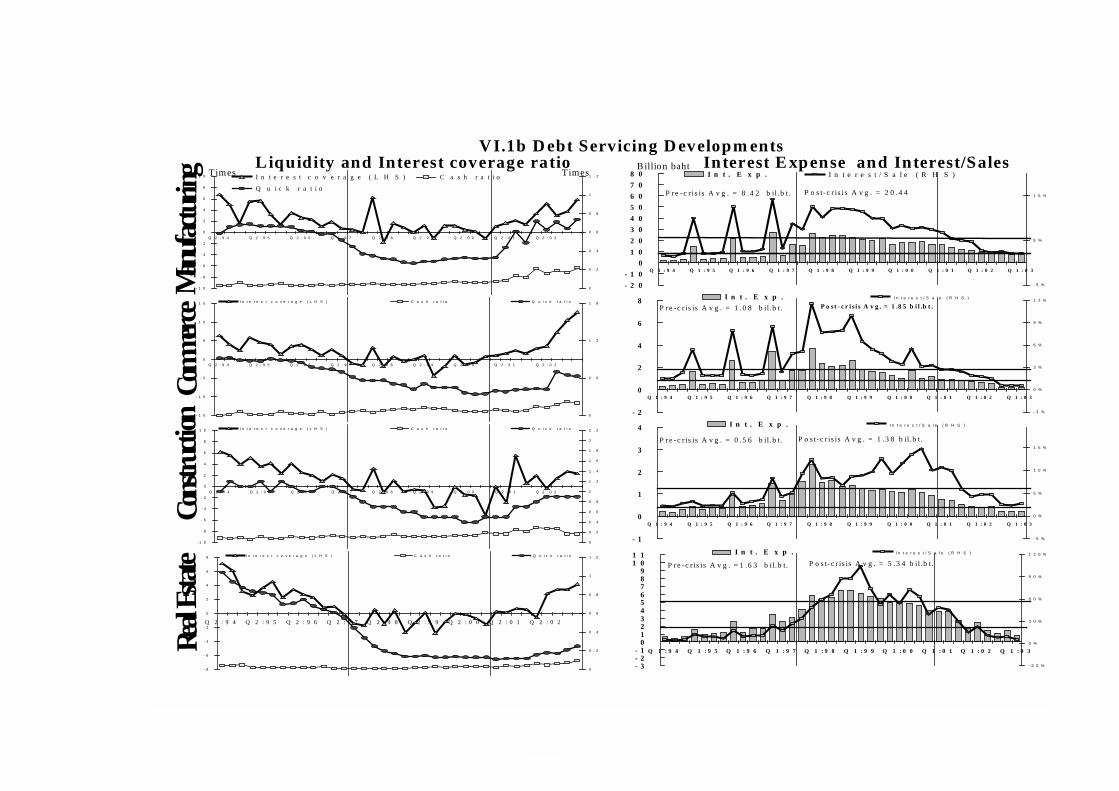
34
Man u
f actu r
in gCo
mmerc
e Co
nstruc
tion
Real E
state
Liquidity and Interest coverage ratio Interest E xpense and Interest/Sales
- 1 0
- 8
- 6
- 4
- 2
0
2
4
6
8
1 0
Q 2 : 9 4 Q 2 : 9 5 Q 2 : 9 6 Q 2 : 9 7 Q 2 : 9 8 Q 2 : 9 9 Q 2 : 0 0 Q 2 : 0 1 Q 2 : 0 2
0
0 . 2
0 . 4
0 . 6
0 . 8
1
1 . 2I n t e r e s t c o v e r a g e ( L H S ) C a s h r a t i o
Q u i c k r a t i o
- 2 0- 1 0
01 02 03 04 05 06 07 08 0
Q 1 : 9 4 Q 1 : 9 5 Q 1 : 9 6 Q 1 : 9 7 Q 1 : 9 8 Q 1 : 9 9 Q 1 : 0 0 Q 1 : 0 1 Q 1 : 0 2 Q 1 : 0 3
- 5 %
5 %
1 5 %
I n t . E x p . I n t e r e s t / S a l e ( R H S )
P r e - c r i s i s A v g . = 8 . 4 2 b i l . b t . P o s t - c r i s i s A v g . = 2 0 . 4 4
- 1 5
- 1 0
- 5
0
5
1 0
1 5
Q 2 : 9 4 Q 2 : 9 5 Q 2 : 9 6 Q 2 : 9 7 Q 2 : 9 8 Q 2 : 9 9 Q 2 : 0 0 Q 2 : 0 1 Q 2 : 0 2
0
0 . 6
1 . 2
1 . 8I n t e r e s t c o v e r a g e ( L H S ) C a s h r a t i o Q u i c k r a t i o
- 2
0
2
4
6
8
Q 1 : 9 4 Q 1 : 9 5 Q 1 : 9 6 Q 1 : 9 7 Q 1 : 9 8 Q 1 : 9 9 Q 1 : 0 0 Q 1 : 0 1 Q 1 : 0 2 Q 1 : 0 3
- 3 %
0 %
3 %
6 %
9 %
1 2 %I n t . E x p . I n t e r e s t / S a l e ( R H S )
P r e - c r i s i s A v g . = 1 . 0 8 b i l . b t . P o s t - c r i s i s A v g . = 1 . 8 5 b i l . b t .
- 1 0
- 8
- 6
- 4
- 2
0
2
4
6
8
1 0
Q 2 : 9 4 Q 2 : 9 5 Q 2 : 9 6 Q 2 : 9 7 Q 2 : 9 8 Q 2 : 9 9 Q 2 : 0 0 Q 2 : 0 1 Q 2 : 0 2
0
0 . 2
0 . 4
0 . 6
0 . 8
1
1 . 2
1 . 4
1 . 6
1 . 8
2
2 . 2I n t e r e s t c o v e r a g e ( L H S ) C a s h r a t i o Q u i c k r a t i o
- 1
0
1
2
3
4
Q 1 : 9 4 Q 1 : 9 5 Q 1 : 9 6 Q 1 : 9 7 Q 1 : 9 8 Q 1 : 9 9 Q 1 : 0 0 Q 1 : 0 1 Q 1 : 0 2 Q 1 : 0 3
- 5 %
0 %
5 %
1 0 %
1 5 %
I n t . E x p . I n t e r e s t / S a l e ( R H S )
P r e - c r i s i s A v g . = 0 . 5 6 b i l . b t . P o s t - c r i s i s A v g . = 1 . 3 8 b i l . b t .
- 8
- 6
- 4
- 2
0
2
4
6
8
Q 2 : 9 4 Q 2 : 9 5 Q 2 : 9 6 Q 2 : 9 7 Q 2 : 9 8 Q 2 : 9 9 Q 2 : 0 0 Q 2 : 0 1 Q 2 : 0 2
0
0 . 2
0 . 4
0 . 6
0 . 8
1
1 . 2I n t e r e s t c o v e r a g e ( L H S ) C a s h r a t i o Q u i c k r a t i o
- 3- 2- 1
0123456789
1 01 1
Q 1 : 9 4 Q 1 : 9 5 Q 1 : 9 6 Q 1 : 9 7 Q 1 : 9 8 Q 1 : 9 9 Q 1 : 0 0 Q 1 : 0 1 Q 1 : 0 2 Q 1 : 0 3
- 3 0 %
0 %
3 0 %
6 0 %
9 0 %
1 2 0 %I n t . E x p . I n t e r e s t / S a l e ( R H S )
P r e - c r i s i s A v g . = 1 . 6 3 b i l . b t . P o s t - c r i s i s A v g . = 5 . 3 4 b i l . b t .
Times TimesBillion baht
V I.1b D ebt Servicing D evelopm ents
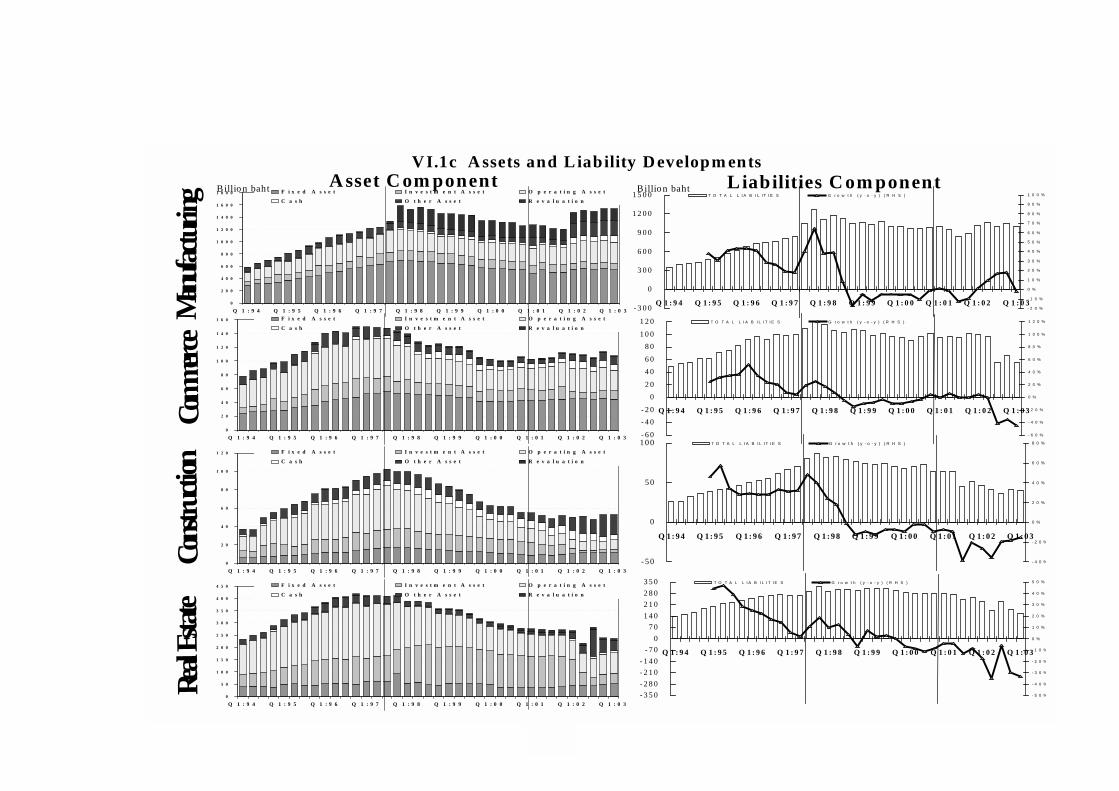
35
Manu
fa ctu r
i ngCo
mmerc
e Co
nstruc
tion
Real E
state
A sset C om ponent Liabilities C om ponent
- 3 0 0
0
3 0 0
6 0 0
9 0 0
1 2 0 0
1 5 0 0
Q 1 : 9 4 Q 1 : 9 5 Q 1 : 9 6 Q 1 : 9 7 Q 1 : 9 8 Q 1 : 9 9 Q 1 : 0 0 Q 1 : 0 1 Q 1 : 0 2 Q 1 : 0 3- 2 0 %
- 1 0 %
0 %
1 0 %
2 0 %
3 0 %
4 0 %
5 0 %
6 0 %
7 0 %
8 0 %
9 0 %
1 0 0 %T O T A L L I A B I L I T I E S G r o w t h ( y - o - y ) ( R H S )
0
2 0 0
4 0 0
6 0 0
8 0 0
1 0 0 0
1 2 0 0
1 4 0 0
1 6 0 0
1 8 0 0
Q 1 : 9 4 Q 1 : 9 5 Q 1 : 9 6 Q 1 : 9 7 Q 1 : 9 8 Q 1 : 9 9 Q 1 : 0 0 Q 1 : 0 1 Q 1 : 0 2 Q 1 : 0 3
F i x e d A s s e t I n v e s t m e n t A s s e t O p e r a t i n g A s s e t
C a s h O t h e r A s s e t R e v a l u a t i o n
- 6 0- 4 0- 2 0
02 04 06 08 0
1 0 01 2 0
Q 1 : 9 4 Q 1 : 9 5 Q 1 : 9 6 Q 1 : 9 7 Q 1 : 9 8 Q 1 : 9 9 Q 1 : 0 0 Q 1 : 0 1 Q 1 : 0 2 Q 1 : 0 3
- 6 0 %
- 4 0 %
- 2 0 %
0 %
2 0 %
4 0 %
6 0 %
8 0 %
1 0 0 %
1 2 0 %T O T A L L I A B I L I T I E S G r o w t h ( y - o - y ) ( R H S )
0
2 0
4 0
6 0
8 0
1 0 0
1 2 0
1 4 0
1 6 0
Q 1 : 9 4 Q 1 : 9 5 Q 1 : 9 6 Q 1 : 9 7 Q 1 : 9 8 Q 1 : 9 9 Q 1 : 0 0 Q 1 : 0 1 Q 1 : 0 2 Q 1 : 0 3
F i x e d A s s e t I n v e s t m e n t A s s e t O p e r a t i n g A s s e t
C a s h O t h e r A s s e t R e v a l u a t i o n
- 5 0
0
5 0
1 0 0
Q 1 : 9 4 Q 1 : 9 5 Q 1 : 9 6 Q 1 : 9 7 Q 1 : 9 8 Q 1 : 9 9 Q 1 : 0 0 Q 1 : 0 1 Q 1 : 0 2 Q 1 : 0 3
- 4 0 %
- 2 0 %
0 %
2 0 %
4 0 %
6 0 %
8 0 %T O T A L L I A B I L I T I E S G r o w t h ( y - o - y ) ( R H S )
0
2 0
4 0
6 0
8 0
1 0 0
1 2 0
Q 1 : 9 4 Q 1 : 9 5 Q 1 : 9 6 Q 1 : 9 7 Q 1 : 9 8 Q 1 : 9 9 Q 1 : 0 0 Q 1 : 0 1 Q 1 : 0 2 Q 1 : 0 3
F i x e d A s s e t I n v e s t m e n t A s s e t O p e r a t i n g A s s e t
C a s h O t h e r A s s e t R e v a l u a t i o n
- 3 5 0- 2 8 0- 2 1 0- 1 4 0
- 7 00
7 01 4 02 1 02 8 03 5 0
Q 1 : 9 4 Q 1 : 9 5 Q 1 : 9 6 Q 1 : 9 7 Q 1 : 9 8 Q 1 : 9 9 Q 1 : 0 0 Q 1 : 0 1 Q 1 : 0 2 Q 1 : 0 3
- 5 0 %
- 4 0 %
- 3 0 %
- 2 0 %
- 1 0 %
0 %
1 0 %
2 0 %
3 0 %
4 0 %
5 0 %T O T A L L I A B I L I T I E S G r o w t h ( y - o - y ) ( R H S )
0
5 0
1 0 0
1 5 0
2 0 0
2 5 0
3 0 0
3 5 0
4 0 0
4 5 0
Q 1 : 9 4 Q 1 : 9 5 Q 1 : 9 6 Q 1 : 9 7 Q 1 : 9 8 Q 1 : 9 9 Q 1 : 0 0 Q 1 : 0 1 Q 1 : 0 2 Q 1 : 0 3
F i x e d A s s e t I n v e s t m e n t A s s e t O p e r a t i n g A s s e t
C a s h O t h e r A s s e t R e v a l u a t i o n
Billion bahtB illio n baht
V I.1c A ssets and L iability D evelopm ents
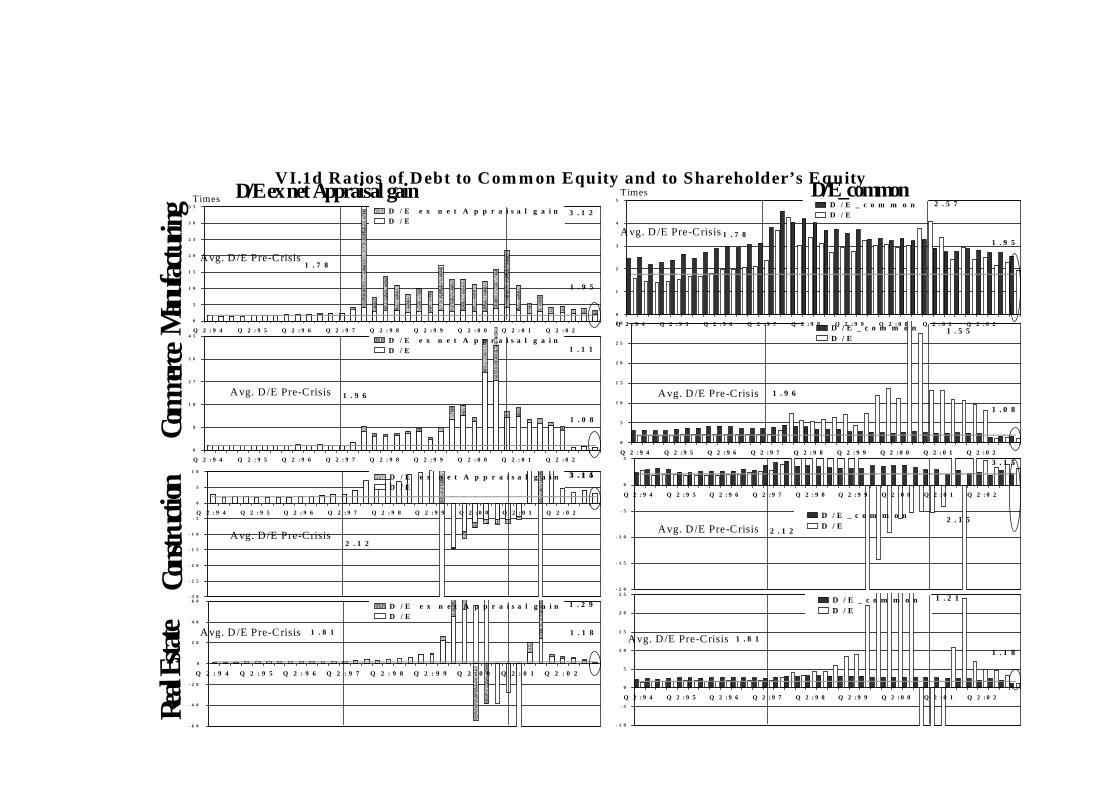
36
Man u
fa ctu r
i ngCo
mmer c
e Co
nstruc
tion
Real E
state
D /E ex net Appraisal gain D/E_com m on3 . 1 2
1 . 9 5
1 . 7 8
0
5
1 0
1 5
2 0
2 5
3 0
3 5
Q 2 : 9 4 Q 2 : 9 5 Q 2 : 9 6 Q 2 : 9 7 Q 2 : 9 8 Q 2 : 9 9 Q 2 : 0 0 Q 2 : 0 1 Q 2 : 0 2
D / E e x n e t A p p r a i s a l g a i nD / E
2 . 5 7
1 . 9 51 . 7 8
0
1
2
3
4
5
Q 2 : 9 4 Q 2 : 9 5 Q 2 : 9 6 Q 2 : 9 7 Q 2 : 9 8 Q 2 : 9 9 Q 2 : 0 0 Q 2 : 0 1 Q 2 : 0 2
D / E _ c o m m o nD / E
1 . 1 1
1 . 0 8
1 . 9 6
0
9
1 8
2 7
3 6
4 5
Q 2 : 9 4 Q 2 : 9 5 Q 2 : 9 6 Q 2 : 9 7 Q 2 : 9 8 Q 2 : 9 9 Q 2 : 0 0 Q 2 : 0 1 Q 2 : 0 2
D / E e x n e t A p p r a i s a l g a i nD / E
1 . 5 5
1 . 0 8
1 . 9 6
0
5
1 0
1 5
2 0
2 5
3 0
Q 2 : 9 4 Q 2 : 9 5 Q 2 : 9 6 Q 2 : 9 7 Q 2 : 9 8 Q 2 : 9 9 Q 2 : 0 0 Q 2 : 0 1 Q 2 : 0 2
D / E _ c o m m o nD / E
3 . 1 43 . 1 5
2 . 1 2
- 3 0
- 2 5
- 2 0
- 1 5
- 1 0
- 5
0
5
1 0
Q 2 : 9 4 Q 2 : 9 5 Q 2 : 9 6 Q 2 : 9 7 Q 2 : 9 8 Q 2 : 9 9 Q 2 : 0 0 Q 2 : 0 1 Q 2 : 0 2
D / E e x n e t A p p r a i s a l g a i nD / E
2 . 1 5
3 . 1 5
2 . 1 2
- 2 0
- 1 5
- 1 0
- 5
0
5
Q 2 : 9 4 Q 2 : 9 5 Q 2 : 9 6 Q 2 : 9 7 Q 2 : 9 8 Q 2 : 9 9 Q 2 : 0 0 Q 2 : 0 1 Q 2 : 0 2
D / E _ c o m m o nD / E
1 . 2 9
1 . 1 81 . 8 1
- 6 0
- 4 0
- 2 0
0
2 0
4 0
6 0
Q 2 : 9 4 Q 2 : 9 5 Q 2 : 9 6 Q 2 : 9 7 Q 2 : 9 8 Q 2 : 9 9 Q 2 : 0 0 Q 2 : 0 1 Q 2 : 0 2
D / E e x n e t A p p r a i s a l g a i nD / E
1 . 2 1
1 . 1 8
1 . 8 1
- 1 0
- 5
0
5
1 0
1 5
2 0
2 5
Q 2 : 9 4 Q 2 : 9 5 Q 2 : 9 6 Q 2 : 9 7 Q 2 : 9 8 Q 2 : 9 9 Q 2 : 0 0 Q 2 : 0 1 Q 2 : 0 2
D / E _ c o m m o nD / E
Avg. D /E Pre-Crisis
Avg. D/E Pre-Crisis
Avg. D /E Pre-Crisis
Avg. D /E Pre-Crisis
Avg. D/E Pre-Crisis Avg. D /E Pre-Crisis
Avg. D /E Pre-Crisis Avg. D /E Pre-Crisis
TimesTimes
VI.1d Ratios of Debt to Com m on Equity and to Shareholder’s Equity
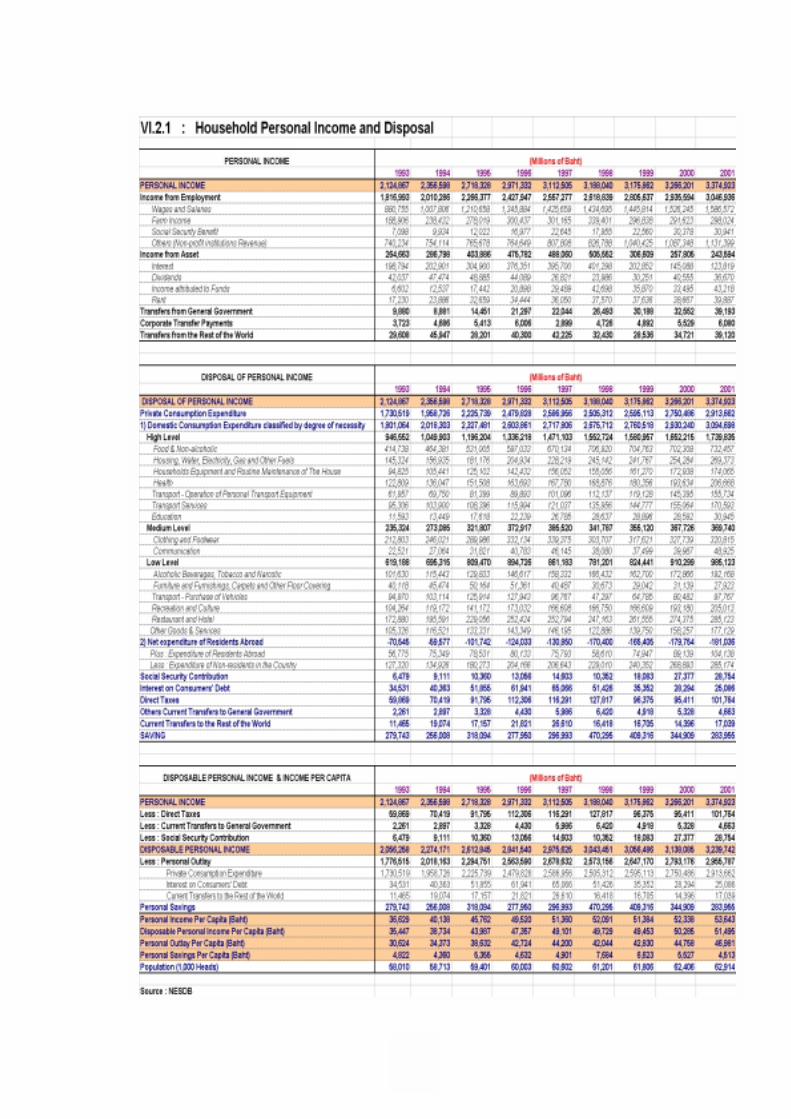
37
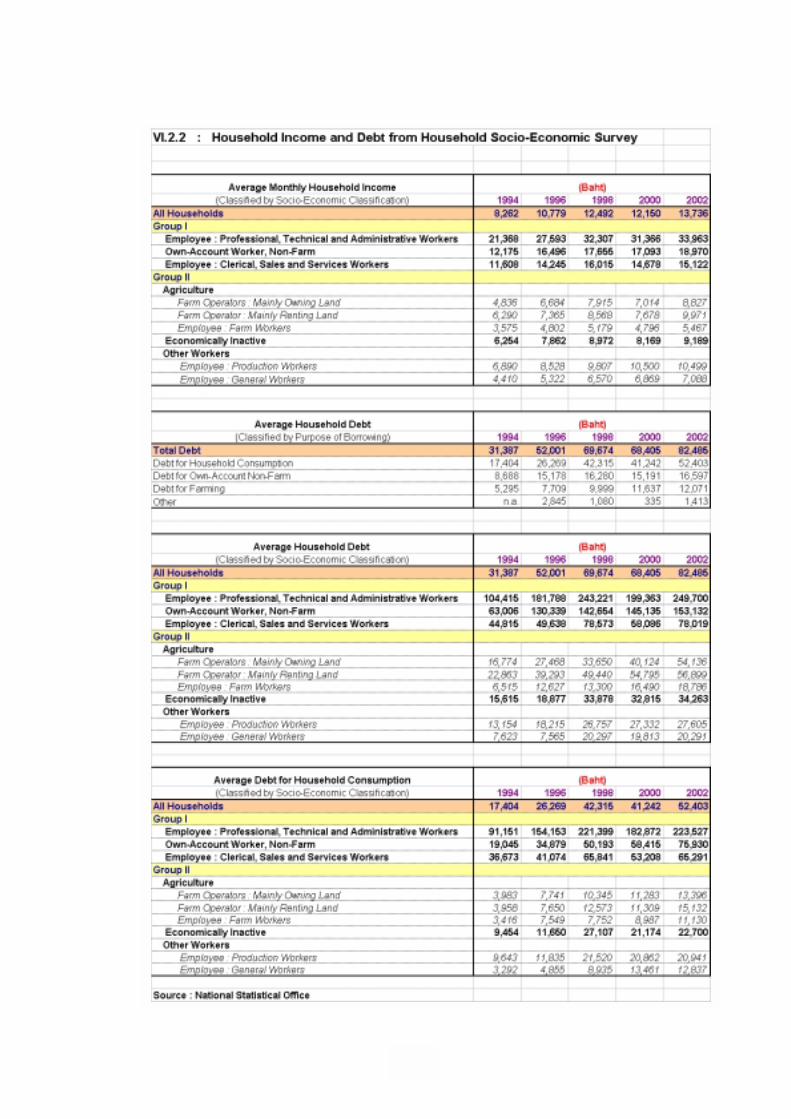
38
39
References Adams, Charles, Robert E. Litan, and Michael Pomerleano (Editors), 2000, “Managing Financial and Corporate Distress, Lessons from Asia”, Brookings Institution Press, Washington, D.C. Allen, Mark , Christoph Rosenberg, Christian Keller, Brad Setser, and Nouriel Roubini, 2002, “A Balance Sheet Approach to Financial Crisis”, IMF Working Paper WP02/210. Bernanke, Ben S., 2003, “Balance Sheets and the Recovery”, BIS Review 9/2003. Bernanke Ben S., 2003, “Will Business Investment Bounce Back”, Remarks by Governor Ben S. Bernanke, before the Forecasters Club, New York, New York, 24 April 2003. Bertaut, Carol C, 2002, “Equity Prices, Household Wealth, and Consumption Growth in Foreign Industrial Countries: Wealth Effects in the 1990’s”, International Finance Discussion Papers Number 724. Claessens, Stijn, Simeon Djankov, and Leora Klapper, “Resolution of Corporate Distress: Evidence from East Asia’s Financial Crisis”, World Bank Paper. Friedlob, George T., Lydia L. F. Schleifer, Franklin J. Plewa, Jr., 2002, “Essentials of Corporate Performance Measurement”, New York:Wiley. Gray, Dale F., and Mark R. Stone, 1999, “Corporate Balance Sheets and Macroeconomic Policy”, Finance and Development, September 1999. Haksar, Vikram, and Piyabha Kongsamut, 2003, “Dynamics of Corporate Performance in Thailand”, IMF Working Paper, July 2003. Hussain, Iftikhar, 2000, “Household Sector Saving and Wealth Accumulation – Evidence from balance sheet and flow of funds data”, FSA Occasional Paper, January 2000. International Monetary Fund, 2002, “Is Wealth Increasingly Driving Consumption?”, World Economic and Financial Surveys - World Economic Outlook : Recessions and Recoveries, April 2002. Issing, Otmar, 2003, “Monetary and Financial Stability – Is there a trade-off?”, Speech by Professor Otmar Issing, Member of the Executive Board of the European Central Bank, at the Conference on "Monetary Stability, Financial Stability and the Business Cycle", Bank for International Settlements, Basel, 28-29 March 2003. Jangsubin, Sompong, 2001, “Comparison of household saving behaviour before and during the crisis in Thailand”, Thesis as part of post graduate economic program, Department of Economic, Thammasat University. [in Thai] Krugman, Paul, 1999, “Balance Sheets, the Transfer Problem, and Financial Crises”, A preliminary draft, prepared for the festschrift volume in honor of Robert Flood, January 1999. <http://web.mit.edu/krugman/www/FLOOD.pdf> Nualtaranee, June, 1992, “Household Consumption and Saving : Random Walk Hypothesis”, Thammasat University. Pettis, Michael, 2001, “The Volatility Machine: Emerging Economies and the Threat of Financial Collapse”, Oxford University Press. Sussangkarn, Chalongphop, 1989, “Literature Review of Household Structure in Thailand”, Thailand Development Research Institute Foundation. Tengumnuay, Malinee, 1981, “Household Saving Behavior in Thailand”, Thammasat University. Thaicharoen, Yunyong, and Prapan Kiatikomol, 2002, “Corporate Balance Sheet Adjustment and Restructuring in Thailand”, Bank of Thailand Research Symposium 2002. The University of The Thai Chamber of Commerce, 2001, “Effects of interest rates on household consumption”, Full Research Report presented to the Bank of Thailand, October 2001. [in Thai]

���)�314��5�
��������������������������� !��������"#��
A)5!*;=)�1+)9:)!�9%���93!1�+6�#H�3!1:���IH� �*�=)�1+)9:)!�9%���9�J�A)��6!7=:%'+�,8/)�#K��@��A)��!#*�!@���A)�!#=�)2�A)�:)!�9%��A)�B�!:%'�021A)�&>)93!1�+6�LI,9�*);0�M90:!>9+)9=)�1:)!�9%���9A)��6!7=:%'�.2>)��H'181+����*);�@ .��>���9!1���6!7=:%'-�:)!!�9!#�3N''#�A)���:+�,;):!1+�O �� #9�#H�-�:)!3!1�;%��*);���;0�M9��90&>21A)��6!7=:%'&>�:)!8�#�8���:)!PQR�&#*��9�6!7=:%'&>�O3�'I9'/)�34�&��9*%��!)1.E:)!�32�,��0329��9=)�1+)9:)!�9%�F �-?����;�2&#*03!�9��)9�STUV�WXY�XZ[\]��?>��8%�+!#5�E021.��H8%���8!%;�5%,;')::)!*%��!)1.E���;�2+�,�:% �IH�!1.*>)93^�S_[`�WXY�XZ[\] +�,�%�;-?�-�*%B�:)!6I:7)+#,*O3
+#H9��H�-�3N''��#�+�,�6!7=:%'O+�;��*);���;0�M9;):�IH�F ��a5)1=)�1 �)�&>)93!1�+6�'): �2�#K?�� %�815# +�,�:%� �2&>���@,�9�+��8/)!�9!1.*>)93!1�+6-�!1 #�8�9�.��H&>)93!1�+6+�,2 29�&2� '�=)�1+)9:)!�2#9+�,3!#�&#* ��IH��#H��A)��6!7=:%' #9:2>)*;�8# 8>*��*);8/)�#K&>�!1���6!7=:%'O;>(I9!���21������9�6!7=:%'+#H9.; � #9�#H�����*)9�F��)��6!7=:%''I9�*!;��*);���)-'��>)9(>�90+�(I9:)!3!#�&#*��9A)��!#*�!@��021A)�B�!:%'+�,�:% �IH����@,�9')::)!�!%FA�021:)!29+��A)���:?�;�8# 8>*�!*;:#�:*>)!���21�b����9�2%&A#�$E;*2!*;-�3!1�+6�
:)!6I:7)��5@H�=)���9���;�2+�,;����>-�3N''��#��?�H-.��.M�*>)A)�B�!:%'021�!#*�!@��;��*);:�)*.��)5��*!-�:)!3!#�&#*��98%�+!#5�E021.��H8%��#�'):*%:C&�34�&��;)�F �A)5:)!PQR�&#*��9A)��6!7=:%'�.2>)��HO �!#�:)!�:@H�.����34���>)9 �')::)!��)�&#*��9�6!7=:%'&#H90&>3^� Jcc�'�(I93N''��#��LI,9�34�3N''#�:!1&���:)!�5%,;�IH���9!)�O �A)��!#*�!@���021�*);8);)!(-�:)!8!�)9�2:/)O!��9A)�B�!:%'
9)�*%'#���HO ��2@�:6I:7)�a5)1-��c�:2�>;B�!:%'-�&2) .2#:+!#5�E+�,;��*);�:�,�*F�9:#�:)!�!%FA�021:)!29+��A)���:?�F �&!9�O �0:>�5)�%?�:!!;���&8).:!!;�:>�8!�)9�021�8#9.)!%;+!#5�E�LI,95�*>)�2:/)O!�021=)�1+)9:)!�9%���9+�::2�>;O �3!#�&#*;)���>-�8A)*1+�,�>����)9 ��0&>:)!PQR�&#*-�8>*���9���(@�.����#9;��*);0&:&>)9-.��.M����>��)9�F �8# 8>*����(@�.���&>�8%�+!#5�E!*;3!#�&#* ��IH�;):-�:2�>;5)�%?�:!!;�021�!�929;)�O �0:>�:2�>;�8#9.)!%;+!#5�E���&8).:!!;�021:>�8!�)9�&);2/) #��2#:7�1:)!'# 2/) #���H�>����)9'18� �2��9:#�2#:7�1:)!PQR�&#*��9�6!7=:%'O+�+�,�/)F �:)!�!%FA��&);;) �*�:)!PQR�&#*��9A)��8#9.)!%;+!#5�E���1+�, �)�:)!�2%&�#9�9��)�&#*&,/):*>)�#&!):)!��)�&#*��9:)!�!%FA���34��2-.�:)!29+��021:)!:>�8!�)9��)�&#*��>)9�>���34��>��O3'):8A)*1:/)2#9:)!�2%&8>*��:%�+�,B�!:%'�#9�9��?%K���>
��:'):��H����;�2�#9?�H-.��.M�(I9:)!3!#�2 8%�+!#5�E��9A)�B�!:%'���1+�, �)�.��H8%�;�:)!3!#�&#*')::)!�32�,��.��H'):8%��?@,�B�)�)!5)�%?�E021�9%�:��'):&>)93!1�+6O38�>:)!:���@;-�!�3��9&!)8)!.��H3!1�A+&>)9d�+�,;�&��+��&,/):*>)��LI,9�34��2-.�B�!:%''/)�*�.�I,9�#9;�8# 8>*�.��H8%�&>�+��8�9;):���>���:'):��H�3NK.).��H+�,O;>:>�-.��:% !)�O �+�,�#93!#�F�!98!�)9O;>8/)�!M'0210e9�!�����>��@H�9.2#9=)�1+)9:)!�9%�A)�B�!:%'+�, � ��IH��LI,9�34�8%,9+�,�#9�9�>)�34�.>*9&>�A)5=)�1+)9:)!�9%�-�A)�.��)�+#H9��H��;@,�- +�,A)�B�!:%'��)�&#*�'1:>�-.��:% :)!'�)99)�+�, ��021:)!�5%,;�IH���9�2%&A)50!99)�+�, ��%,9�IH���:M'1�34��2 �&>�!)�O �021�*);;#,9�#,9��9�!#*�!@��-�!1�13)�:2)9&>�O3
8/).!#�A)��!#*�!@���#H��;�:)!3!#�&#*F �:)!�5%,;.!@�2 :)!�!%FA�8%���)021�!%:)!+�,;�!1 #��*);'/)�34�+�,&>)9:#��LI,9?>*�!#:7)!1 #�:)!�!%FA�;%-.�2 29;):-�?>*9+�,!)�O �021�*);;#,9�#,92 29'):*%:C&�6!7=:%'�5!��;:#���HA)��!#*�!@��:MO �!#�3!1F�?�E'):;)&!:)!?>*��.2@�'):!#=�)2�8!%;���);)�8/).!#�?>*9+�,�6!7=:%'�!%,;PQR�&#*��H��!#*�!@��O ��!%,;:2#�;)818;�*);;#,9�#,9:#�-.;>F ��a5)1-���)�021+�, %����@,�9'):�!)�O �+�,5I9-?�'>)�O �'!%9��)�&#*&>���@,�9�#�'):3^� Jc � �34�&��;)�5!��;:#�+�,&2) �8#9.)!%;+!#5�E�!%,;PQR�&#*'):3N''#�0* 2��; �)� �:���H�&,/)021;)&!:)!:!1&����8#9.)!%;+!#5�E��9!#=�)2�+#H9��H�!#*�!@���>)'1���>-�8()�1+�,'1�!%.)!A)!1.��H+�,�5%,;�IH�O ��F ��a5)1��>)9�%,9-�8>*���9.��H�5@,�L@H�+�,���>�)6#��&!)��+>)+�,�� �9��)9.��H021!)�'>)� �:���H��;@,��+����34�8# 8>*�:#�!)�O �02�*��!%,;���)8�>8; �2-�+�,8� ST\Xf��TXT\]�
+#H9��H�:)!+�,!)�O �')::)!'�)99)�;��*);8/)�#K;):&>��!#*�!@����F��)��6!7=:%';.A)��5@,�8�#�8���:)!'�)99)�021�2%&A)50!99)�'I9�34�8%,98/)�#K�%,9��5@,�+�,'1!#:7):)!�!%FA�021:)!��;��9�!#*�!@��O*�O ��F ��!#*�!@���34�0.2>9�9%�+��8/)�#K&>�:)!29+����93!1�+6��#�'1�/);)LI,9:)!�&%�F&��9�6!7=:%'O �O ���>)9�#,9�@�&>�O3
9)�*%'#���HO ��8���F��)�.2#:��� �)�+�,�34��*);+�)+)�&>�:)!'# :)!�:�,�*:#�:)!PQR�&#*��9�6!7=:%'�3!1:)!0!:��@��:)!+/)-.�8# 8>*�:)!29+��A)���:?�&>��2%&A#�$E;*2!*;-�3!1�+6��)�&#*8�9:*>)8# 8>*�:)!��;A)���:?���5@,�?>*�2 ?>�9*>)9:)!��;021:)!29+��A)���:?�+�,�34��*:29O3O ��3!1:)!&>�;)�#H���@���*);'/)�34���>)9�%,9+�,3!1�+6&��9;�:)!'# �:M����;�2+�,�!���2�;021�5��95�&>�:)!&% &);:)!�32�,��0329-�8%�+!#5�E021.��H8%���9A)��6!7=:%'+�,8/)�#K�F �:)!8>9�8!%;.2#:B!!;)A%�)2�021:)!5#<�)&2) :)!�9%��*���>:#�O3���5@,�8�#�8���:)!�!%.)!'# :)!�*);�8�,�9+�,�)'�:% �IH����@,�9'):-�!1�1&>�O3�#H��=)�1+)9:)!�9%���9+�:A)��6!7=:%''1;��*);�?@,�;F�9:#�0�>�0Pg��%,9�IH��LI,9;��#�*>)�.):�:% �*);�>��0��IH�-�=)�1+)9:)!�9%���9A)��6!7=:%'- �:M8);)!('105!>:!1')�O3�#9=)�1+)9:)!�9%���9A)��6!7=:%'�@,�O �;)::*>)-�� �&
3!1:)!8� +�)��34��*);+�)+)�F �&!9&>��F��)�:)!�9%��F �-�!1�18#H���H��F��)�:)!�9%�+�,��@H��/)�*��#9'18�#�8���:)!3!#�&#*��9=)�1+)9:)!�9%�A)�B�!:%'-.�;��*);8;��!�E�%,9�IH��+#H9�#9?>*�8>9�8!%;-.�A)��!#*�!@��8);)!(818;8%�+!#5�EO �&>�O3F �3!)6'):��38!!�+)9:)!�9%��021-�!1�13)�:2)9&>�O3�#H��B�)�)!:2)9'/)�34���>)9�%,9+�,'1&��9&% &);(I93!18%+B%�2��9:2O::)!8>9�>)��F��)�:)!�9%��+>);:2)98A)*152*#&!!1.*>)93!%;)��9%�:#�:%':!!;+)9�6!7=:%'�021!1.*>)9:)!��2@,��O.*��9!)�)8%�+!#5�E:#��3g).;)��9%��Pg�