Embed Size (px)
Citation preview
Paleoclimate reconstruction using compound – specific hydrogen isotope ratios of n-alkanes
Dissertation
Zur Erlangung des akademischen Grades doctor rerum naturalium
(Dr. rer. nat.)
vorgelegt dem Rat der Chemisch-Geowissenschaftlichen Fakultät der Friedrich-Schiller-Universität Jena
von Dipl.-Geographin Ines Mügler
geboren am 26. Juni 1978 in Meerane

Gutachter:
1.
2.
3.
Tag der öffentlichen Verteidigung:
I
Acknowledgement
This dissertation would not have been written without the encouragement and a tremendous amount of support of a large number of people.
First of all, I would like to thank my supervisors PD. Dr. Gerd Gleixner at Max-Planck Institute for Biogeochemistry and Prof. Dr. Roland Mäusbacher at the Friedrich-Schiller University Jena, who supported and guided me with their valuable motivation, criticism and fruitful discussions during the time of research for this dissertation.
Acknowledgements are also given to the whole “Nam Co Research Bundle” for their support throughout my thesis work. Therefore I would like to thank Prof. Antje Schwalb; Philip Steeb; Claudia Wrozyna (TU Braunschweig); Prof. Brigitta Schütt; Jonas
Berking (FU Berlin) and Dr. Gerhard Daut; Dr. Peter Frenzel (FSU-Jena) for their scientific contributions and discussions as well as for the support in the field and for the great time we spent on the Tibetan Plateau and in China.
I respectfully acknowledge Tandong Yao, Baiquing Xu and Guangjian Wu (Institute of Tibetan Plateau Research, Chinese Academy of Science) for the organization and realization of an impressive field trip and the continuous scientific support during my thesis work.
The sample material would not have been retrieved without the field work experience of Dr. Ernst Krömer and Dr. Johannes Wallner (Bayrisches Landesamt für Umwelt) and the support, physically and mentally, from Steffen Grünler and also Dirk Sachse, who moreover enriched this dissertation with fruitful discussions on drafts of the manuscripts.
I really appreciate my colleagues and friends at the MPI-BGC for their support throughout my thesis work:
Andrej Thiele and Melanie Pieles for their help with sample extraction and measurement, Steffen Rühlow for his enduring support with GC-IRMS measurements, Heike Geilmann and the IsoLab staff for the measurements of water samples and Axel
Steinhof for his efforts to promptly provide radiocarbon dating results.
Special thanks are given to Sibylle Steinbeiss for teaching me the secrets of SPSS and Cindy Tefs, Carolin Fornaçon and Antje Gude for their invaluable company and support and because they now and then made work a little less scientifically.
II
Many thanks also go to the people from the IT department, the library and the administration.
I would like to thank my parents Christa and Hans Mügler for their love, support and encouragement throughout my life and my boyfriend Jörg for helping me with editing the manuscript and much more.
This PhD study has been carried out as part of the research project “Lake System Response of Nam Co Area, Central Tibet, to Late Quaternary Monsoon Dynamics” which was funded by the German Research Association (DFG).
Jena, April 2008 Ines Mügler
III
Table of Contents
Acknowledgement ....................................................................................................... I
Table of Contents ...................................................................................................... III
List of Figures .......................................................................................................... VII
List of Tables ............................................................................................................ XI
1 Introduction ......................................................................................................... 1
1.1 Objectives ......................................................................................................................... 1
1.2 Thesis organisation .......................................................................................................... 5
2 Compound–specific hydrogen isotope ratios of biomarkers – Tracing climatic
changes in the past .............................................................................................. 8
2.1 Introduction ..................................................................................................................... 8
2.2 Importance of water and the water cycle for the climate system ............................. 8
2.3 Stable isotopes of water and their variation in the hydrological cycle ................... 10
2.4 Long-term water cycle pattern recorded by inorganic molecules .......................... 14
2.5 Long-term water cycle pattern recorded by organic molecules .............................. 16
2.6 Compound - specific isotope ratios of biomarkers record recent climate ............ 16
2.7 Compound – specific hydrogen isotope ratios in contrasting ecosystems ........... 19
2.8 The stability of compound – specific hydrogen isotope ratios over the geological past .................................................................................................................................. 21
2.9 Water isotopes in paleoclimate models ...................................................................... 21
2.10 Conclusions ................................................................................................................... 23
3 Effect of lake evaporation on δD values from lacustrine n-alkanes: A
comparison of Nam Co, Tibetan Plateau and Holzmaar, Germany ................ 24
3.1 Introduction ................................................................................................................... 25
3.2 Study sites ....................................................................................................................... 27
IV
3.3 Sampling ......................................................................................................................... 29
3.4 Methods .......................................................................................................................... 29
3.4.1 Analyses of water samples for δD and δ18O ......................................................... 29
3.4.2 Sample preparation, n-alkane extraction and quantification ............................... 29
3.4.3 Analysis of δD values of n-alkanes ......................................................................... 30
3.5 Results and Discussion ................................................................................................. 30
3.5.1 Meteorological and isotope precipitation data ...................................................... 30
3.5.2 Concentrations of n-alkanes in lake surface sediments and plant biomass ...... 32
3.5.3 δD values of n-alkanes in lake surface sediments and plant biomass ............... 35
3.5.4 The hydrogen isotope fractionation ....................................................................... 37
3.6 Paleoenvironmental implications ................................................................................ 40
3.7 Conclusions .................................................................................................................... 44
4 Comparison between leaf wax δD values and benthic ostracode δ18O values
from two European lakes during the Younger Dryas – Evidence for a time lag
between aquatic and terrestrial signal .............................................................. 46
4.1 Introduction ................................................................................................................... 47
4.2 Study area ........................................................................................................................ 49
4.3 Sediment sampling and chronology ............................................................................ 52
4.4 Methods .......................................................................................................................... 52
4.5 Results and discussion .................................................................................................. 53
4.5.1 Concentration and distribution of n-alkanes in lacustrine sediments................ 53
4.5.2 δD values of lacustrine leaf wax n-alkanes from Ammersee and Lac d’Annecy ..................................................................................................................................... 58
4.5.3 Comparison of leaf-wax n-alkane δD values and ostracode δ18O values ......... 63
4.5.4 The time shifted deuterium record – implications for paleoclimate reconstruction ............................................................................................................ 65
4.5.5 The comparison between the YD isotopic compositions of precipitation derived from the aquatic and terrestrial proxy ..................................................... 67
4.6 Conclusions .................................................................................................................... 72
V
5 A multi-proxy approach to reconstruct hydrological changes and Holocene
climate development of Nam Co, Central Tibet .............................................. 74
5.1 Introduction ................................................................................................................... 75
5.2 Description of study site .............................................................................................. 77
5.3 Material and Methods ................................................................................................... 79
5.3.1 Sampling and lithology ............................................................................................. 79
5.3.2 Sedimentological and geochemical analyses .......................................................... 79
5.3.3 Chronology ................................................................................................................ 82
5.4 Results ............................................................................................................................. 84
5.4.1 Sediment stratigraphy ............................................................................................... 84
5.4.2 Bulk geochemical parameters and stable isotopes ............................................... 84
5.4.3 Stable carbon and hydrogen isotopes .................................................................... 87
5.4.4 Mineralogical composition ...................................................................................... 90
5.4.5 Sediment geochemistry - major elements .............................................................. 92
5.4.6 Hydrological changes inferred from Nam Co lake sediments ........................... 93
5.4.7 Implications for the Tibetan Plateau paleoenvironmental history .................... 99
5.5 Conclusions .................................................................................................................. 102
6 Synthesis .......................................................................................................... 103
6.1 Use of δD values from terrestrial and aquatic lacustrine n-alkanes for paleoclimatic reconstruction ...................................................................................... 103
6.2 Isotopic relationships between source water and n-alkanes - Implications for paleoclimate reconstruction ....................................................................................... 110
7 Conclusion and future research ....................................................................... 115
7.1 Conclusion .................................................................................................................... 115
7.2 Initial approaches for future research ....................................................................... 116
7.2.1 Environmental impact on D/H fractionation between source water and n-alkanes ...................................................................................................................... 116
7.2.2 Compound-specific radiocarbon analysis to assess the time shift between terrestrial and aquatic n-alkanes in sedimentary records ................................... 118
7.2.3 Reconstruction of the Late Quaternary Nam Co lake water balance using the isotopic difference between terrestrial and aquatic n-alkanes ........................... 119

VI
7.2.4 Comparison between the Nam Co deuterium records with ice core records 121
Summary .................................................................................................................. 123
Kurzfassung ............................................................................................................. 127
References ................................................................................................................ 132
Appendix .................................................................................................................. A-1
VII
List of Figures
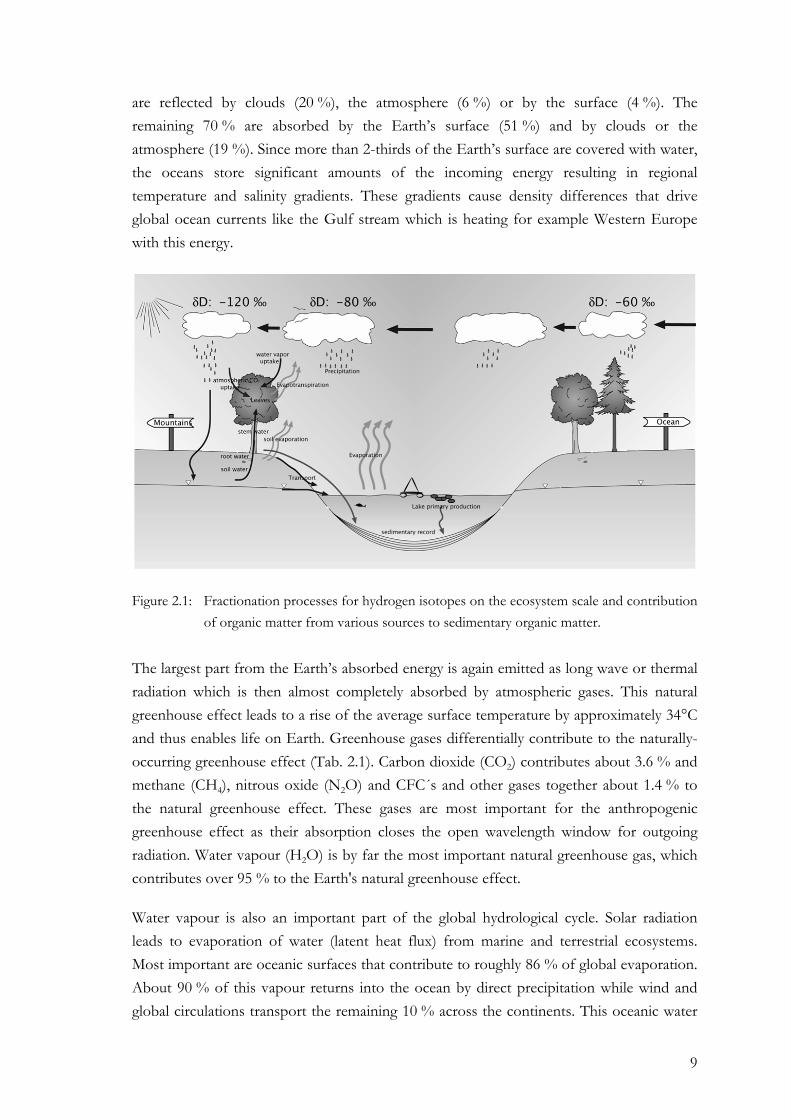
Figure 2.1: Fractionation processes for hydrogen isotopes on the ecosystem scale and contribution of organic matter from various sources to sedimentary organic matter. ............................................................................................................. 9
Figure 2.2: The relationship of δ18O and δ2H values in precipitation on a global scale. ............................................................................................................................ 11
Figure 2.3: Dependence of fractionation factor α between vapour and water on temperature. ............................................................................................................... 12
Figure 2.4: Isotopic enrichment of remaining water after evaporation of water vapour from a closed pool (temperature = 25°C; humidity 0%). ...................... 12
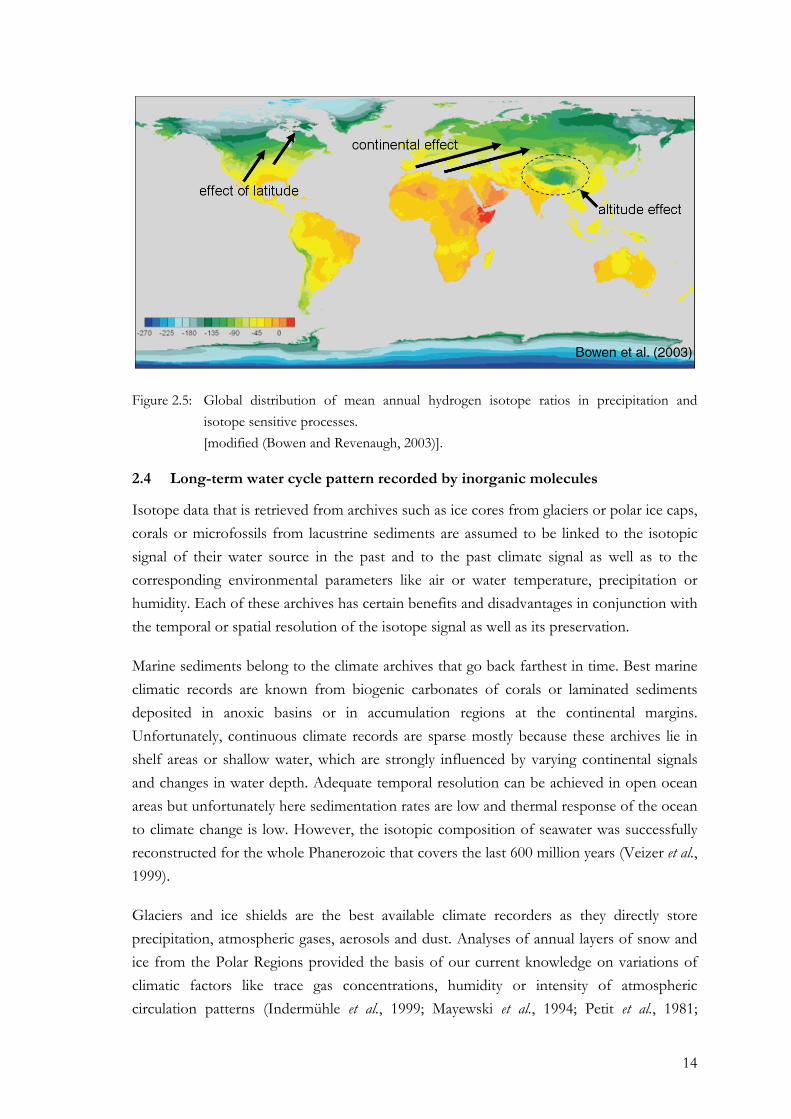
Figure 2.5: Global distribution of mean annual hydrogen isotope ratios in precipitation and isotope sensitive processes. ....................................................... 14
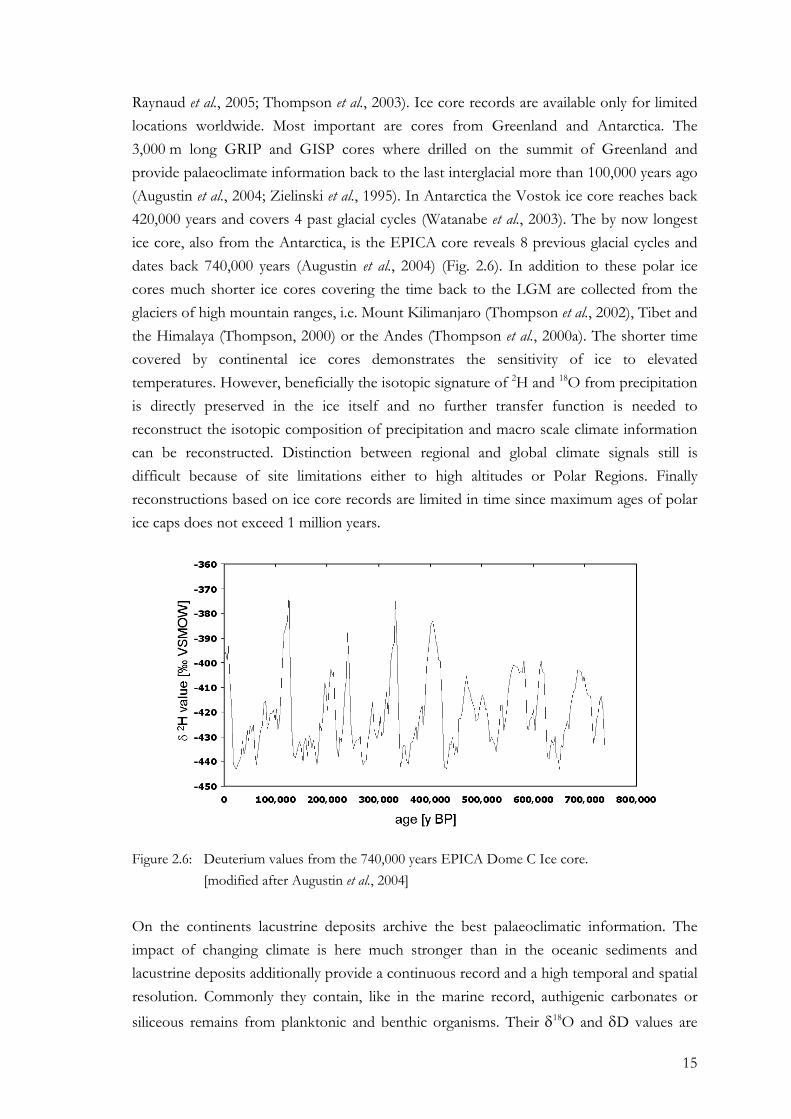
Figure 2.6: Deuterium values from the 740,000 years EPICA Dome C Ice core. .............. 15
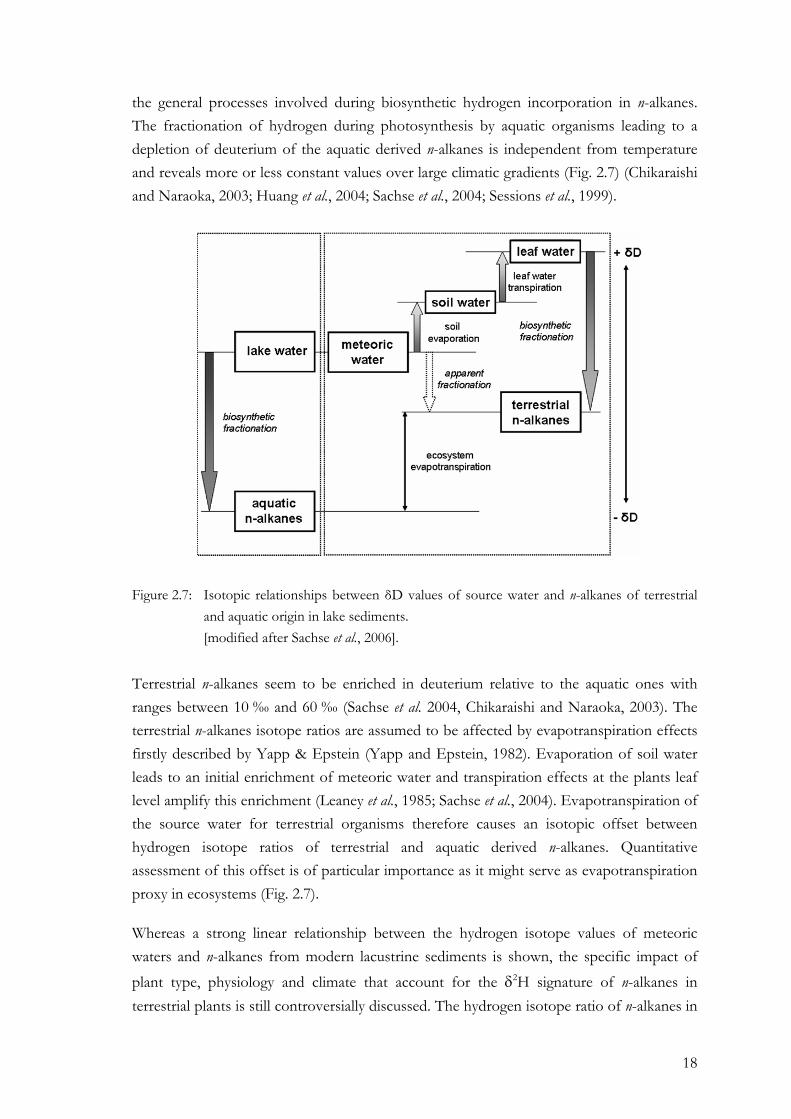
Figure 2.7: Isotopic relationships between δD values of source water and n-alkanes of terrestrial and aquatic origin in lake sediments. ............................................... 18
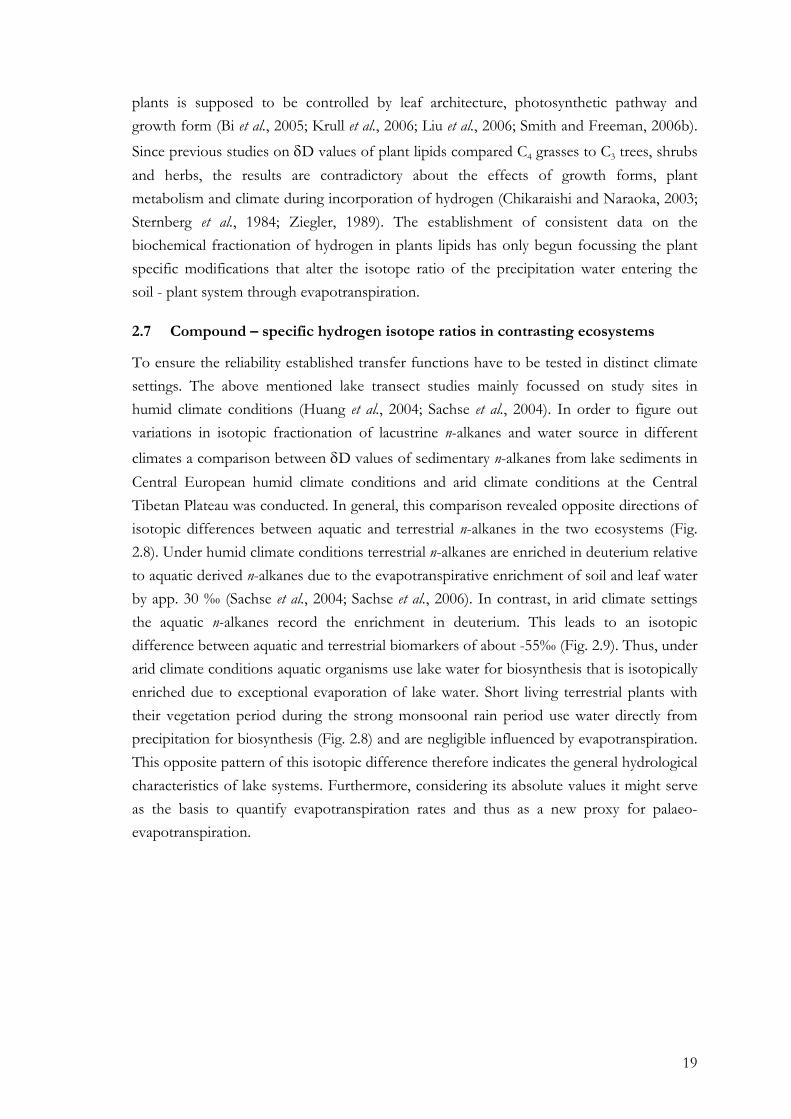
Figure 2.8: Isotopic difference of aquatic and terrestrial n-alkanes within the mid-European temperate climate Holzmaar (left) and within the highly evaporative environment of Nam Co, Tibetan Plateau (right). .......................... 20
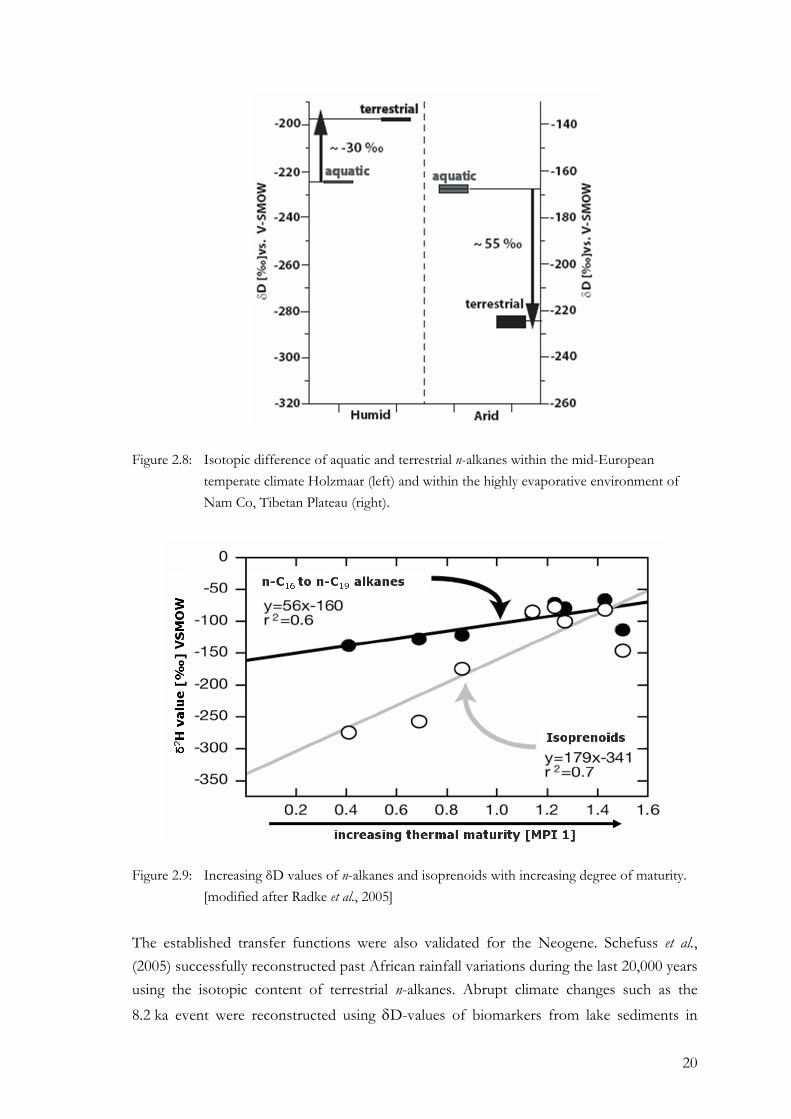
Figure 2.9: Increasing δD values of n-alkanes and isoprenoids with increasing degree of maturity. .................................................................................................... 20
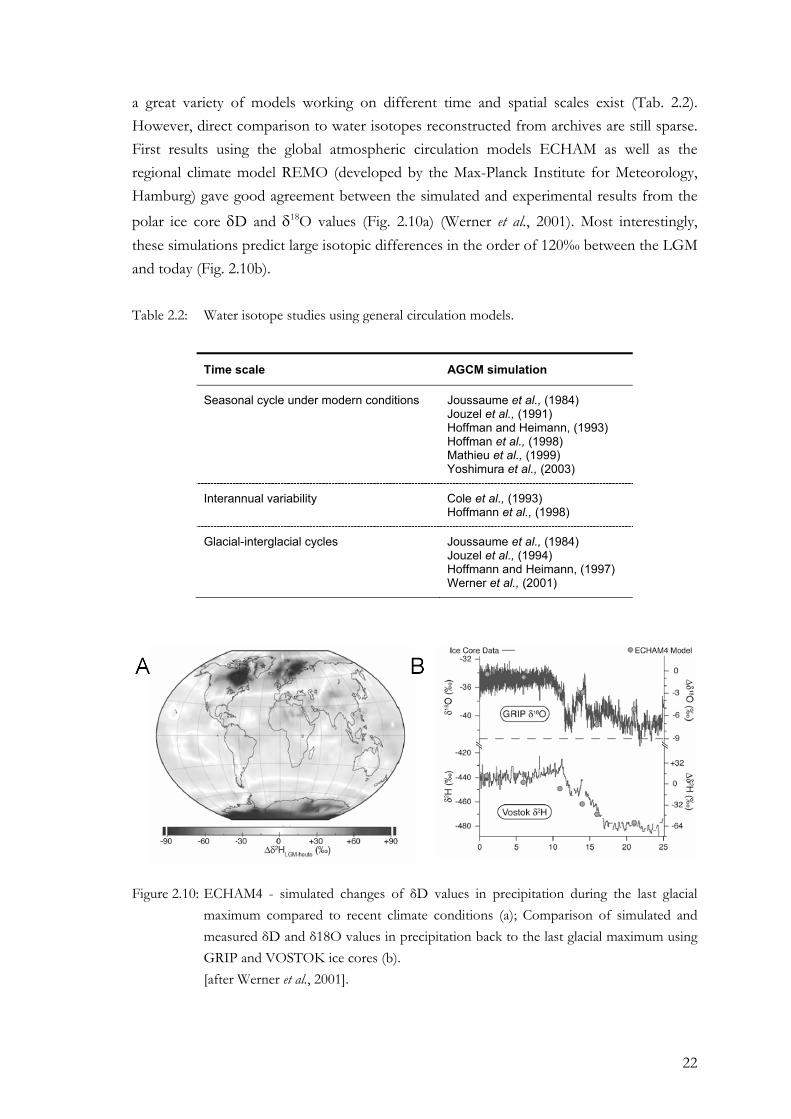
Figure 2.10: ECHAM4 - simulated changes of δD values in precipitation during the last glacial maximum compared to recent climate conditions (a); Comparison of simulated and measured δD and δ18O values in precipitation back to the last glacial maximum using GRIP and VOSTOK ice cores (b). ............. 22
Figure 3.1: Map of Nam Co and Co Jiana, Central Tibet. ...................................................... 27
Figure 3.2: Map of Holzmaar, Germany ................................................................................... 28
Figure 3.3: Daily precipitation amount between August 2005 and November 2006 and corresponding δD values at Nam Co. ............................................................ 31
Figure 3.4: Concentration and composition of n-alkanes in the lake surface sediments from Holzmaar (HZM), Nam Co (Tibet 2) and Co Jiana (Tibet 4). ................. 32
VIII
Figure 3.5: The concentration and composition of n-alkanes from terrestrial vegetation at Nam Co and Co Jiana. ......................................................................................... 34
Figure 3.6: The concentration and composition of n-alkanes from aquatic vegetation at Nam Co and Co Jiana. ......................................................................................... 34
Figure 3.7: δD values of n-alkanes from Nam Co and Co Jiana plant biomass (a). δD values of n-alkanes from Nam Co and Co Jiana lake surface sediments (b). ... 36
Figure 3.8: δD values of n-alkanes from Holzmaar vegetation and lake surface sediments. ................................................................................................................... 36
Figure 3.9: The isotopic difference between δD from aquatic n-alkanes (n-C23) and δD from terrestrial n-alkanes (n-C29). ............................................................................ 40
Figure 4.1: Location of the study areas Ammersee (Germany) and Lac d’Annecy (French Alps). ............................................................................................................ 50
Figure 4.2: Present day correlation between monthly mean air temperatures and δD values in precipitation at Ammersee (triangles) (1970 to 2001) and Lac d’Annecy (crosses) (1963 to 2001). ......................................................................... 51
Figure 4.3: Representative n-alkane distribution of Ammersee sediments at 44 cm core depth. ................................................................................................................. 54
Figure 4.4: Representative n-alkane distribution of Lac d’Annecy sediments at 116 cm core depth. ................................................................................................... 55
Figure 4.5: Weighted mean δD values from C27/29/31 n-alkanes from Ammersee and Lac d’Annecy sediments and differences between the mean δD values during the Allerød and the Younger Dryas. .......................................................... 63
Figure 4.6: The comparison between weighted mean δD values from C27/29/31 n-alkanes and the corresponding δ18O values from the Ammersee (A and B) and the Lac d’Annecy (C and D) sediments and the suggested time shift between the records. ................................................................................................. 64
Figure 4.7: The comparison between the time shifted deuterium records and the corresponding δ18O values from the Ammersee (A and B) and Lac d’ Annecy (C and D) sediments. ............................................................................. 67
Figure 4.8: The present day local meteoric water line from the Ammersee catchment ..... 69
IX
Figure 4.9: Leaf wax n-alkane δD values, precipitation δD values reconstructed from n-alkane deuterium content (A) and inferred from ostracode δ18O values (B) and d-excess in precipitation. ............................................................................ 72
Figure 5.1: Nam Co and selected lake sites across the Tibetan Plateau to be discussed in the text, the Nam Co 8 coring site is marked (asterisk). ................................. 78
Figure 5.2: Calibrated, uncorrected 14C ages of Nam Co 8 bulk sediments (dots) and macro remain (triangle). ........................................................................................... 83
Figure 5.3: Grain size distribution, magnetic susceptibility and grain size statistics. .......... 85
Figure 5.4: Major elements and stable isotopes of Nam Co 8 lacustrine record. ................ 86
Figure 5.5: Nam Co samples in a van Kreuvelen type discrimination plot after Meyers et al .(1999). ................................................................................................... 87
Figure 5.6: Elemental and carbon isotopic composition of Nam Co lacustrine organic matter plotted in a diagram modified after Meyers et al. (1999). ........................ 88
Figure 5.7: Mineralogy of Nam Co sediments within core Nam Co 8. ................................ 91
Figure 5.8: Major geochemical data of Nam Co 8 sediments. ............................................... 93
Figure 5.9: Fe, Mn and Fe:Mn ratio. .......................................................................................... 94
Figure 5.10: Comparison of wet and dry periods from lake records across the Tibetan Plateau. ........................................................................................................................ 99
Figure 6.1: The isotopic difference between δD from aquatic n-alkanes (n-C23) and δD from terrestrial n-alkanes (n-C29). ................................................................... 104
Figure 6.2: Weighted mean δD values from C27/29/31 from Ammersee and Lac d’Annecy sediments and differences between the mean δD values during the Allerød and the Younger Dryas. ......................................................................................... 106
Figure 6.3: The comparison between the time shifted deuterium records and the corresponding δ18O values from Ammersee (A and B) and Lac d’Annecy (C and D) sediments. .............................................................................................. 108
Figure 6.4: Comparison of wet and dry periods from lake records across the Tibetan Plateau. ...................................................................................................................... 110
Figure 6.5: Isotopic relationships between source water and n-alkanes in aquatic and terrestrial ecosystems. ............................................................................................. 111
X
Figure 7.1: Correlation of leaf water δD values and mean δDnC27/29/31 values from herbaceous plants along a latitudinal transect at the Tibetan Plateau. ............ 117
Figure 7.2: Mean δDnC27/29/31 values from herbaceous plants (crosses), leaf water δD values (circles) and fractionation ε between leaf water and n-alkane δD values (triangles) along a latitudinal gradient at the Tibetan Plateau. .............. 118
Figure 7.3: The Time shift between mean δD values from aquatic (grey circles) and terrestrial (black triangles) sources from Nam Co, Central Tibetan Plateau sediments. ................................................................................................................. 119
Figure 7.4: The residual water fraction f during the past 7 cal ka BP interpreted as changes in lake volume of Nam Co, Central Tibetan Plateau. ......................... 120
Figure 7.5: The residual water fraction f during the past 7 cal ka BP interpreted as changes in lake volume of Nam Co, Central Tibetan Plateau. ......................... 122
XI
List of Tables
Table 2.1: Contribution of greenhouse gases on the natural greenhouse effect. ............... 10
Table 2.2: Water isotope studies using general circulation models. ..................................... 22
Table 3.1: Isotopic characteristics of Nam Co, Co Jiana and Holzmaar catchment waters. ......................................................................................................................... 31
Table 3.2: n-alkane distribution of plant biomass and lake sediments: maximum chain length (Cmax), carbon preference indicies (CPI and CPI23-32), average chain length (ACL) and total concentration of n-alkanes (HCtot μg/g dry weight). .. 33
Table 3.3: δD values and standard deviation (sd, 2σ) of the n-alkanes n-C23 and n-C29; fractionation ε between n-alkane and source water and the isotopic difference between δDn-C23 and δDn-C29. ............................................................ 35
Table 3.4: Variation of available fractionation factors ε of different studies from terrestrial vegetation, aquatic plant biomass and lake sediments, ε values for terrestrial vegetation are relative to precipitation water, ε values for aquatic plant biomass are relative to ambient lake water. ................................................. 39
Table 3.5: Input parameter, underlying calculations and E/I for Nam Co and Holzmaar. ................................................................................................................... 42
Table 3.6: Percentage changes of E/I ratio of Nam Co for a change input parameters based on the actual dataset by ±10%. .................................................................... 44
Table 4.1: Carbon preference indices (CPI (1), CPI27-32 (2) and CPI15-25 (3)), average chain length (ACL)(4); total concentration of n-alkanes (HCtot); n-alkane accumulation rate (AR), and sedimentation rate (SR) for the Ammersee sediments. ................................................................................................................... 56
Table 4.2: Carbon preference indices (CPI (1), CPI27-32 (2) and CPI15-25 (3)), average chain length (ACL)(4); total concentration of n-alkanes (HCtot); n-alkane accumulation rate (AR), and sedimentation rate (SR) for the Lac d’Annecy sediments. ................................................................................................................... 57
Table 4.3: δD values and standard deviation (SD, 2σ) of nC27, nC29 and nC31 alkanes from Ammersee. ....................................................................................................... 60
Table 4.4: δD values and standard deviation (SD, 2σ) of nC27, nC29 and nC31 alkanes from Lac d’Annecy. .................................................................................................. 61
XII
Table 4.5: Precipitation δD values inferred from ostracode δ18O values and reconstructed from n-alkane δD values from the Ammersee sediments .......... 70
Table 5.1: General geographical, climatological and limnological data for Nam Co. ....... 78
Table 5.2: 14C ages of the sediment core Nam Co 8. ............................................................. 82
Table A.1: Major elements of Nam Co 8 sediment core. ..................................................... A-1
Table A.2: Basic geochemical parameter of Nam Co 8 sediment core. ............................. A-3
Table A.3: δ13C of bulk organic matter from Nam Co 8 sediments. .................................. A-6
Table A.4: n-alkane δD values of Nam Co 8 sediment core. ............................................... A-7
Table A.5: Results from Rock Eval Pyrolyses from Nam Co 8 sediments. ....................... A-8
Table A.6: Amount of n-alkanes from Nam Co 8 sediment core. ...................................... A-9
Table A.7: Mineralogical data of Nam Co 8 sediment core. ............................................. A-11
1
1 Introduction
Chapter 1
Introduction
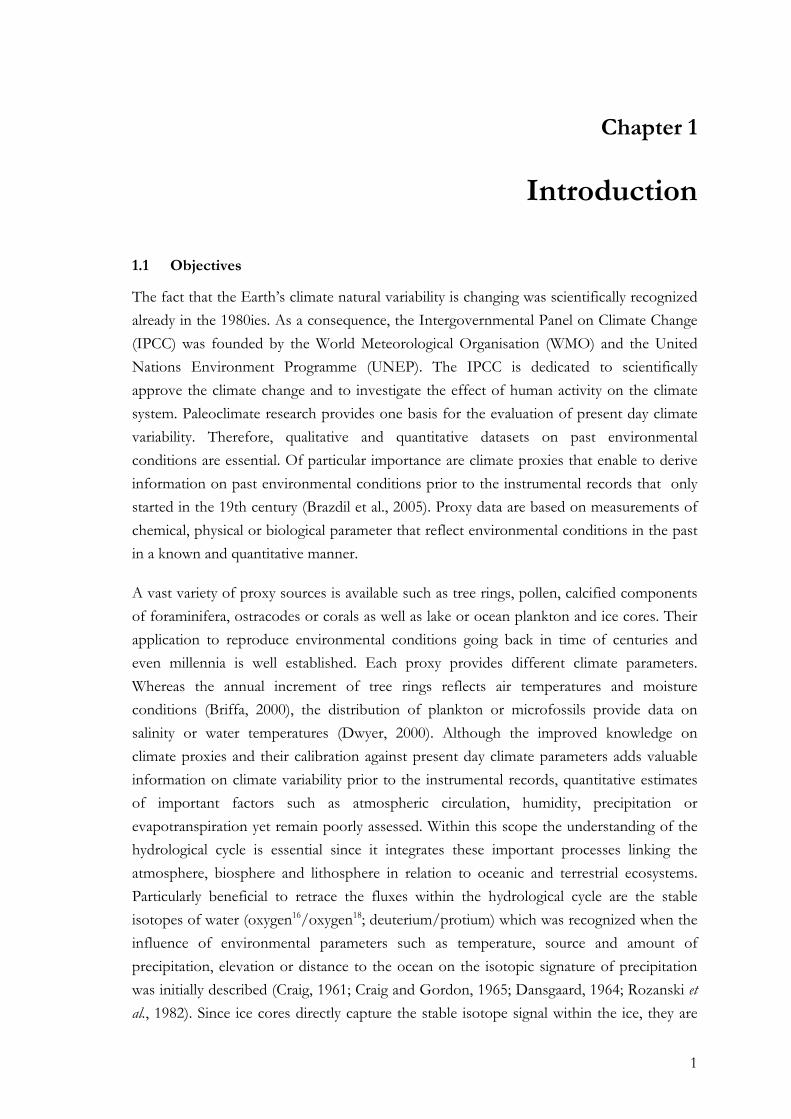
1.1 Objectives
The fact that the Earth’s climate natural variability is changing was scientifically recognized already in the 1980ies. As a consequence, the Intergovernmental Panel on Climate Change (IPCC) was founded by the World Meteorological Organisation (WMO) and the United Nations Environment Programme (UNEP). The IPCC is dedicated to scientifically approve the climate change and to investigate the effect of human activity on the climate system. Paleoclimate research provides one basis for the evaluation of present day climate variability. Therefore, qualitative and quantitative datasets on past environmental conditions are essential. Of particular importance are climate proxies that enable to derive information on past environmental conditions prior to the instrumental records that only started in the 19th century (Brazdil et al., 2005). Proxy data are based on measurements of chemical, physical or biological parameter that reflect environmental conditions in the past in a known and quantitative manner.
A vast variety of proxy sources is available such as tree rings, pollen, calcified components of foraminifera, ostracodes or corals as well as lake or ocean plankton and ice cores. Their application to reproduce environmental conditions going back in time of centuries and even millennia is well established. Each proxy provides different climate parameters. Whereas the annual increment of tree rings reflects air temperatures and moisture conditions (Briffa, 2000), the distribution of plankton or microfossils provide data on salinity or water temperatures (Dwyer, 2000). Although the improved knowledge on climate proxies and their calibration against present day climate parameters adds valuable information on climate variability prior to the instrumental records, quantitative estimates of important factors such as atmospheric circulation, humidity, precipitation or evapotranspiration yet remain poorly assessed. Within this scope the understanding of the hydrological cycle is essential since it integrates these important processes linking the atmosphere, biosphere and lithosphere in relation to oceanic and terrestrial ecosystems. Particularly beneficial to retrace the fluxes within the hydrological cycle are the stable isotopes of water (oxygen16/oxygen18; deuterium/protium) which was recognized when the influence of environmental parameters such as temperature, source and amount of precipitation, elevation or distance to the ocean on the isotopic signature of precipitation was initially described (Craig, 1961; Craig and Gordon, 1965; Dansgaard, 1964; Rozanski et al., 1982). Since ice cores directly capture the stable isotope signal within the ice, they are
2
the most suitable archive for reconstructions of the hydrological cycle in the past. Nevertheless, these continental records are limited only to glaciers in high altitude regions and to the polar ice caps and thus, provide spatially limited data. Moreover, the ice caps and high mountain glaciers experience an overall decrease as a consequence of the warming of our climate system leading to severe damages or finally the disappearance of this climate archive (Bernstein et al., 2007).
Another valuable archive for terrestrial paleoclimate reconstructions are lacustrine sediments. Of particular interest is the fact that lakes preserve both, terrestrial and aquatic records of environmental conditions within the deposited organic matter, the authigenic carbonates or silicates from planktonic and benthic organisms. Although δ18O values of carbonates were shown to record mainly the isotopic signal of lake water and temperature (v. Grafenstein et al., 1999), the relation of stable isotopes and ambient water depends also on physiological effects for each species and on salinity. Thus, additional proxies on environmental conditions are needed to ensure reliable climate reconstructions. Organic matter in lake sediments incorporates individual molecules that derive from distinct biotic sources. These molecular fossils or so called biomarkers are deposited in almost all sediments. Their abundance and composition identify past biocenosis and environmental parameters of their formation (Meyers, 2003; Meyers and Lallier-Verges, 1999). Most of these biomarkers belong to the biochemical group of lipids which are rich in carbon-bound hydrogen. Comparing molecules with carbon-bound hydrogen atoms to heteroatoms like oxygen, nitrogen or sulphur, carbon-bound hydrogen is non-exchangeable at temperatures up to 150°C (Schimmelmann et al., 1999). Hence, these biomarkers are stable even over geological time scales (Radke et al., 2005). Of particular interest amongst all biomarkers are n-alkanes since different classes of these aliphatic hydrocarbons serve to distinguish between terrestrial and aquatic sources (e.g. Meyers, 2003). Moreover, because organisms and plants which synthesize n-alkanes use their ambient water as their primary source of hydrogen, their stable isotopic composition can be used to retrace the isotope signal of their source water. Thus, aquatic organisms that use the lake water to produce n-alkanes preserve the autochthonous environmental conditions that prevailed within the lake. In turn, terrestrial plants preserve the stable isotopic composition of meteoric water modified by soil and leaf water evapotranspiration.
The application of the above mentioned findings was pioneered by analytical improvements in isotope ratio mass spectrometry in the late 1990ies that enabled rapid measurements of hydrogen isotope ratios (expressed as δD value with δD = (D/Hsample/ D/Hstandard) x 1000) in small quantities on individual biochemicals of specific biological origin (Burgoyne and Hayes, 1998). Compound-specific determination of δD values on these biomarkers largely contributed to the understanding of biosynthesis of lipids in various sources such as higher terrestrial plants (Chikaraishi and Naraoka, 2003; Sessions,
3
2006; Sessions et al., 1999), algae (Schouten et al., 2006; Zhang and Sachs, 2007) or bacteria (Sessions et al., 2002). From these efforts it was shown that the lipid δD values track the hydrogen isotope composition of their water source. Various surface sediment studies from lake transects along climatic gradients in Europe and Northern America (Huang et al., 2004; Sachse et al., 2004), analyses of lacustrine sedimentary n-alkanes in different climates (Chikaraishi and Naraoka, 2003; Hou et al., 2006; Sauer et al., 2001), comparisons of reconstructed isotope data with existing climate records (Andersen et al., 2001; Huang et al., 2002; Pagani et al., 2006; Schefuss et al., 2005; Shuman et al., 2004) and vegetation specific biomarker studies (Bi et al., 2005; Chikaraishi and Naraoka, 2003; Ficken et al., 2000; Sachse et al., 2006; Sessions et al., 1999; Smith and Freeman, 2006b) further contributed to the establishment of δD values of n-alkanes as one of the leading proxies to reconstruct the isotopic content of the source water.
It is well known that the isotopic composition of the particular n-alkane reveals an isotopic difference relative to the source water (e. g. Sachse et al., 2004). Although it is postulated that this fractionation [ε n-alkane/water = 1000 x (δD n-alkane + 1000)/(δD water + 1000)-1] is basically a function of the biosynthetic pathway, large ranges in fractionation factors suggest an additionally yet unquantified modification by environmental factors (Sessions et al., 1999). For example, compound-specific determination of δD values from terrestrial vascular plants n-alkanes exposed the influence of evaporation of leaf water which in turn was shown to be controlled by relative humidity and plant physiology (Sachse et al., 2006; Smith and Freeman, 2006). The establishment of a new climate proxy is thus based on extensive present day calibration studies that successively elaborate the controlling parameter and mechanisms necessary to relate the proxy characteristics to the actual climate signal. Against this background this thesis intends to improve the understanding of the environmental influences on the magnitude of the hydrogen isotope fractionation in order to strengthen the application of hydrogen isotope ratios of biomarkers to retrace changes in the hydrological cycle in the past.
This thesis is part of a joint research initiative on the “Lake System Response of Nam Co Area, Central Tibet, to late Quaternary Monsoon Dynamics”. Overall, it seeks to investigate the spatio-temporal variations of the Nam Co hydrological cycle in order to reconstruct the past Asian Monsoon variability and its influence on lake sediment dynamics. The Asian monsoon system is of particular importance in the atmospheric circulation. It affects the global hydrological cycle and energy fluxes. About 60% of the world’s population is directly influenced by the Asian monsoons through the availability of water resources for agriculture and industry and through the impact of devastating floods or droughts. The interplay of four air masses controls the pluviometric regime over the Asian continent. The contribution to the total precipitation from the Winter Monsoon and the Westerlies is of minor importance when compared to that from the South Asian and
4
East Asian Monsoons (Araguas - Araguas et al., 1998). Variations in the extent and intensity of the monsoonal system over time consequently have major impacts on Tibetan Plateau ecosystems and on the global climate system.
Studies of stable water isotopes in present day meteoric water largely contributed to the knowledge on the extent of monsoon systems in terms of moisture sources of the corresponding air masses as well as their evaporation and condensation history (Araguas-Araguas et al., 1998; Tian et al., 2007; Tian et al., 2001). A unique tool to extend the knowledge on monsoonal circulation pattern throughout various timescales in the past is potentially provided by the stable isotope compositions from sedimentary n-alkanes. They are assumed to preserve the isotopic variations of their source water that in turn is controlled by changes in the amount of rainfall, the atmospheric moisture source and air temperatures all being indicative for changes in the spatial extent of monsoonal influence as well as its intensity.
With additional respect to the aforementioned research deficits concerning the environmental influence on n-alkane δD values this thesis intended to accomplish the following objectives:
(1) To improve the general understanding of the environmental influence on the
stable hydrogen isotope signal of aquatic and terrestrial derived n-alkanes in
order to strengthen their paleoclimatic interpretation.
(2) To specify climatic relevant parameters that are integrated and reflected by
the sedimentary n-alkane δD values.
(3) To reconstruct the climate induced changes of the hydrological cycle of the
Nam Co, Central Tibet using compound-specific hydrogen isotope ratios of
lacustrine terrestrial and aquatic n-alkanes.
Consequently, the thesis addresses the following issues:
• A calibration study assesses the influence of relative humidity and evapotranspiration on the hydrogen isotope fractionation. Therefore, the deuterium content of surface sedimentary n-alkanes and plant biomass from the arid Nam Co catchment, Central Tibet and the humid Holzmaar, Germany were investigated. In association, the stable water isotopes (δD, δ18O) from the major fluxes of the Nam Co hydrological cycle (inflow streams, precipitation, lake water) serve to understand the present day environmental influence on the n-alkane δD values.
• The influence of temperature induced changes of the isotopic composition of the water source on lacustrine n-alkane δD values is evaluated through the analyses of
5
sediments from the period of the last deglaciation during the Allerød and the Younger Dryas. Therefore, lacustrine n-alkane deuterium records were compared with δ18O values inferred from deep lake ostracods from Ammersee, Germany and Lac d’Annecy, France. The comparison between those two different climate proxy signals moreover specifies the climatic information that is integrated by the sedimentary n-alkane δD values.
• Through the application of a multi-proxy approach the paleoclimate information from the sedimentary n-alkane δD values are correlated with paleoenvironmental signals from other independent proxies to enhance the interpretative strength of the deuterium record.
• The findings are implemented into the current knowledge on the isotopic relationships between source water and n-alkanes in aquatic and terrestrial ecosystems in order provide a reliable interpretation of n-alkane deuterium records in paleoclimate studies.
1.2 Thesis organisation
The theoretical framework for the application of hydrogen isotope ratios in paleoclimate studies is provided in Chapter 2. Starting with an overview about the fundamentals on the influence of the climate system on the hydrological cycle in association to the stable isotope composition of water, Chapter 2 highlights the benefit of hydrogen to track the hydrological cycle. Further, the basic principles of the incorporation of the hydrogen isotope signal during the lipid biosynthesis are provided. It is summarized that the influences of environmental factors on the hydrogen isotope fractionation remain yet unquantified whereas evapotranspiration and relative humidity are shown to be the leading factors controlling the magnitude of D/H fractionation.
Based on this theoretical framework Chapter 3 and 4 intend to provide novel insights into the processes involved during hydrogen isotope fractionation to strengthen the interpretation of biomarker δD values in order to record the isotopic composition of the source water. Chapter 3 presents an investigation of the deuterium content of surface sedimentary n-alkanes and plant biomass from the arid Nam Co catchment, Central Tibet and the humid Holzmaar, Germany. Both systems reflect contrasts in relative humidity and evapotranspiration and consequently allow investigating their influence on D/H fractionation. It was shown that under humid climate conditions the terrestrial n-alkanes are enriched in deuterium relative to the aquatic ones due to evapotranspiration of soil and leaf water (Sachse et al., 2006). Hence, aquatic and terrestrial-derived n-alkane δD values from Nam Co sediments were determined in order to evaluate their isotopic relationship under arid climate conditions. Here the isotopic enrichment of lake water was reflected in
6
the aquatic biomarkers and the isotopic difference between terrestrial and aquatic n-alkane δD values was opposite to that found in humid climates. Based on these results, it is
indicated that δD values of lacustrine n-alkanes can be used to estimate the proportion of lake water undergoing evaporation relative to the inflow that enables to reconstruct the lake water balance in the past.
Paleoclimatic records of stable water isotopic data inferred from proxy sources other than organic matter compounds such as 18O from carbonates provide an independent climate induced stable isotope signal. This offers the possibility to enhance the understanding of the climate signal that is provided by the n-alkane δD values. Against this background
Chapter 4 emphasizes the ability of terrestrial-derived n-alkane δD values to record changes in mean air temperatures associated to the rapid climate shifts at the end of the last deglaciation during the Allerød and the Younger Dryas. Lacustrine leaf wax n-alkane δD
values from the Ammersee, Germany and Lac d’Annecy, France were compared with δ18O
values inferred from deep lake ostracodes. As the ostracode δ18O values are known to represent mainly the temperature induced changes of the stable isotope signal of the local precipitation (v. Grafenstein et al., 1999), the comparison with the n-alkane deuterium record showed that the δD values of n-alkanes preserve a mixed climate signal integrating changes in temperatures, relative humidity and vegetation composition. Moreover, it is indicated that terrestrial n-alkane δD values reveal a higher sensitivity to climate induced changes in their source water isotopic composition when compared to the amplitudes of the climate signal provided by the δ18O values. Most interestingly, the comparison between the aquatic and the terrestrial-derived climate proxies revealed a time shift indicating that the terrestrial climate signal lags behind the aquatic. Being recognized for lacustrine systems for the first time, these results provide novel insights into the delivery processes from the biosynthesis of a molecule to its ultimate deposition within the sediment record. Clearly these findings are essential for paleoclimate reconstructions that are based on the evaluation of proxy material from different sources.
The δD values of lacustrine n-alkanes were shown to track climate induced changes of their source water allowing estimates on the catchments water availability in terms of humid and arid climate conditions as well as on changes in mean air temperatures [Chapter 3, 4]. With the assumption that spatio-temporal variations of the monsoonal circulation are reflected by lacustrine n-alkane δD values as an integral of temperature and precipitation, n-alkane
δD values are applied to reconstruct the climate induced changes of the hydrological cycle of the Nam Co, Central Tibet in association to monsoon circulation changes during the Late Quaternary. Thus, Chapter 5 presents the results from a multi-proxy approach where findings from sedimentological, geomorphological and mineralogical studies are combined with compound-specific stable isotope data (δD, δ13C). The variations of all environmental
7
proxies suggested a climate evolution in at least five depositional units and subunits during the last 7.2 cal ka years. During that time the lake system underwent changes between pronounced humid and arid climate conditions that were shown to be basically controlled by monsoonal moisture availability.
Chapter 6 presents a synthesis of the studies on δD values from terrestrial and aquatic n-alkanes emphasizing the climate information that is provided by the n-alkane deuterium records. With the implementation of the findings of this thesis into the current knowledge on the isotopic relationships between source water and n-alkanes in aquatic and terrestrial ecosystems, implications towards the interpretation of n-alkane δD values within a paleoclimate record are elaborated.
In Chapter 7 the conclusion on the main results is drawn and finally, preliminary results towards the implementation of the novel findings into the paleoclimate record from Nam Co, Central Tibet emphasize further research perspectives.
8
2 Compound–specific hydrogen isotope ratios of biomarkers – Tracing climatic changes in the past
Chapter 2
Compound–specific hydrogen isotope ratios of biomarkers –
Tracing climatic changes in the past
Chapter source: Gleixner and Mügler, 2007. Compound–specific Hydrogen isotope ratios of biomarkers – Tracing climatic changes in the past. In: Dawson, T. E. and Siegwolf, R. T. W. (eds.), Stable Isotopes as Indicators of Ecological Change, 1. Academic Press.
2.1 Introduction
Climatic factors like temperature or water availability are major drivers of terrestrial ecosystems. Their interactions are strongly controlling the opening of stomata and consequently net ecosystem productivity and water use efficiency. These climatic effects can be well observed in the 13C content of biomass. Additionally to carbon isotope discrimination evapotranspiration enriches water isotopes in leaf water or in lake water (Fig. 2.1) which is also recorded in the deuterium content of biomass or sedimentary organic matter. In this chapter it is demonstrated how the climate system is controlling the isotopic content of surface waters and why hydrogen isotopes are more suitable to monitor climatic changes than carbon isotopes. The current knowledge about the transfer of these isotopic signals into biomass and the benefit of organic biomarkers to reconstruct past changes in ecosystems will be summarized. Finally, it will be evaluated if corresponding signals are preserved over geological timescales and if climate models are suitable to predict the isotopic content of past precipitation.
2.2 Importance of water and the water cycle for the climate system
For all known life forms on Earth water is of essential importance. Living cells contain over 80% of water and water covers over 70 % of Earth’s surface. The estimated volume of 1.4 billion m3 (UNEP, 2002) is distributed in various forms and reservoirs. Due to its high effective heat capacity and mobility water fundamentally influences the Earth’s climate. In general, the Earth’s climate system is driven by energy delivered from the sun, which equals to the solar constant of 1.367 W m-2. About 30 % of this incoming radiation
9
are reflected by clouds (20 %), the atmosphere (6 %) or by the surface (4 %). The remaining 70 % are absorbed by the Earth’s surface (51 %) and by clouds or the atmosphere (19 %). Since more than 2-thirds of the Earth’s surface are covered with water, the oceans store significant amounts of the incoming energy resulting in regional temperature and salinity gradients. These gradients cause density differences that drive global ocean currents like the Gulf stream which is heating for example Western Europe with this energy.
Figure 2.1: Fractionation processes for hydrogen isotopes on the ecosystem scale and contribution of organic matter from various sources to sedimentary organic matter.
The largest part from the Earth’s absorbed energy is again emitted as long wave or thermal radiation which is then almost completely absorbed by atmospheric gases. This natural greenhouse effect leads to a rise of the average surface temperature by approximately 34°C and thus enables life on Earth. Greenhouse gases differentially contribute to the naturally-occurring greenhouse effect (Tab. 2.1). Carbon dioxide (CO2) contributes about 3.6 % and methane (CH4), nitrous oxide (N2O) and CFC´s and other gases together about 1.4 % to the natural greenhouse effect. These gases are most important for the anthropogenic greenhouse effect as their absorption closes the open wavelength window for outgoing radiation. Water vapour (H2O) is by far the most important natural greenhouse gas, which contributes over 95 % to the Earth's natural greenhouse effect.
Water vapour is also an important part of the global hydrological cycle. Solar radiation leads to evaporation of water (latent heat flux) from marine and terrestrial ecosystems. Most important are oceanic surfaces that contribute to roughly 86 % of global evaporation. About 90 % of this vapour returns into the ocean by direct precipitation while wind and global circulations transport the remaining 10 % across the continents. This oceanic water
10
vapour contributes ca. 30 % to the continental water flux (Gat, 1996). The remaining 70 % result from evaporation of terrestrial ecosystems. While travelling over the continents atmospheric vapour condensates and precipitates as rainfall, hail or snow. The runoff returns directly via streams and rivers or delayed by reservoirs like glaciers, lakes or ground water flow down the slope back to the ocean.
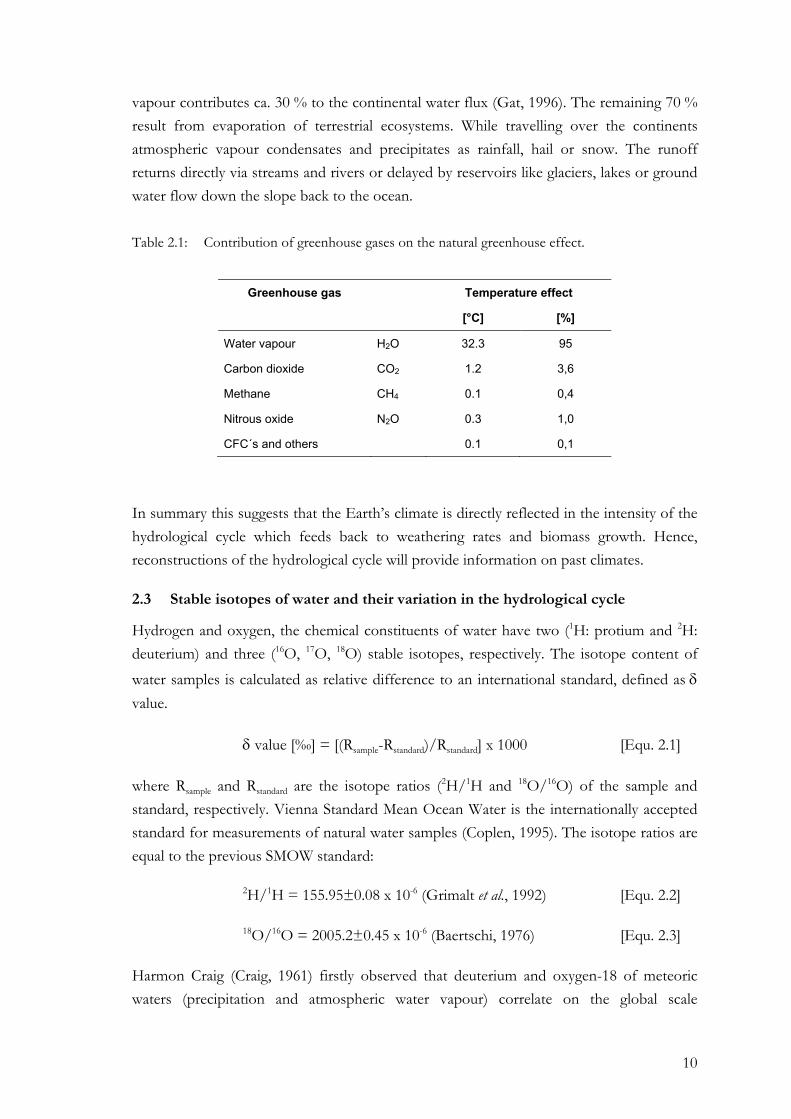
Table 2.1: Contribution of greenhouse gases on the natural greenhouse effect.
Greenhouse gas Temperature effect
[°C] [%]
Water vapour H2O 32.3 95
Carbon dioxide CO2 1.2 3,6
Methane CH4 0.1 0,4
Nitrous oxide N2O 0.3 1,0
CFC´s and others 0.1 0,1
In summary this suggests that the Earth’s climate is directly reflected in the intensity of the hydrological cycle which feeds back to weathering rates and biomass growth. Hence, reconstructions of the hydrological cycle will provide information on past climates.
2.3 Stable isotopes of water and their variation in the hydrological cycle
Hydrogen and oxygen, the chemical constituents of water have two (1H: protium and 2H: deuterium) and three (16O, 17O, 18O) stable isotopes, respectively. The isotope content of water samples is calculated as relative difference to an international standard, defined as δ value.
δ value [‰] = [(Rsample-Rstandard)/Rstandard] x 1000 [Equ. 2.1]
where Rsample and Rstandard are the isotope ratios (2H/1H and 18O/16O) of the sample and standard, respectively. Vienna Standard Mean Ocean Water is the internationally accepted standard for measurements of natural water samples (Coplen, 1995). The isotope ratios are equal to the previous SMOW standard:
2H/1H = 155.95±0.08 x 10⁻⁶ (Grimalt et al., 1992) [Equ. 2.2]
18O/16O = 2005.2±0.45 x 10⁻⁶ (Baertschi, 1976) [Equ. 2.3]
Harmon Craig (Craig, 1961) firstly observed that deuterium and oxygen-18 of meteoric waters (precipitation and atmospheric water vapour) correlate on the global scale
11
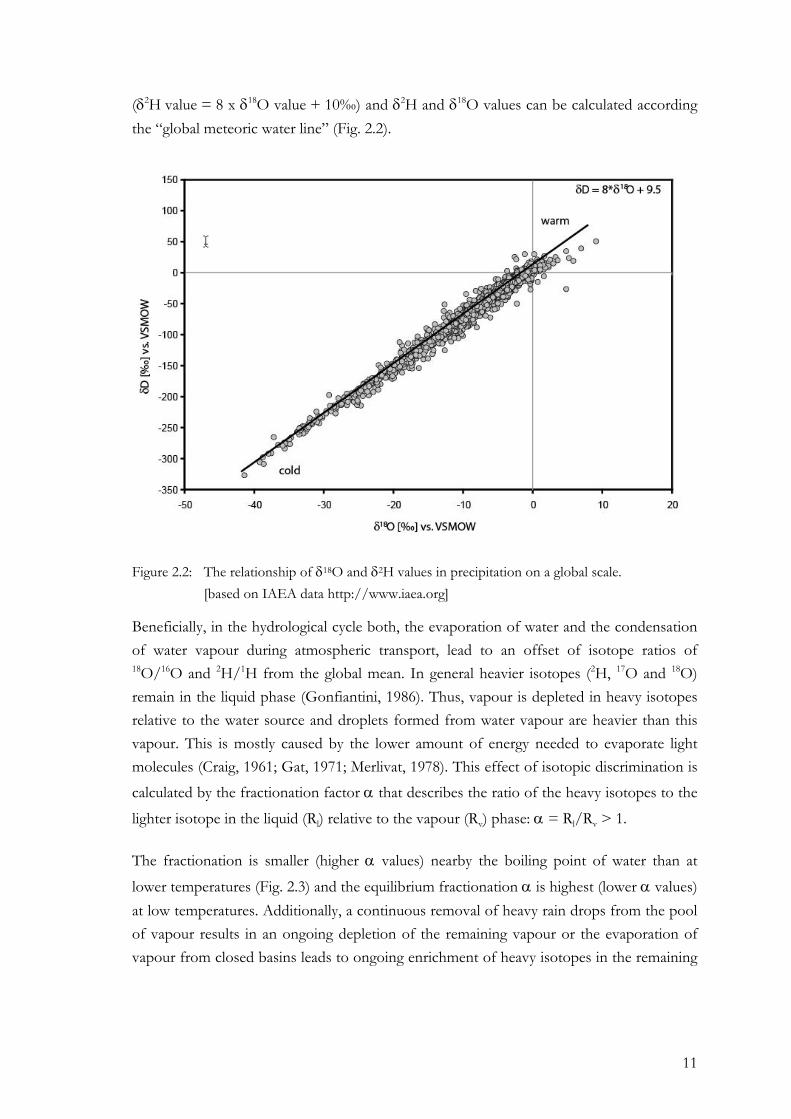
(δ2H value = 8 x δ18O value + 10‰) and δ2H and δ18O values can be calculated according the “global meteoric water line” (Fig. 2.2).
Figure 2.2: The relationship of δ18O and δ2H values in precipitation on a global scale. [based on IAEA data http://www.iaea.org]
Beneficially, in the hydrological cycle both, the evaporation of water and the condensation of water vapour during atmospheric transport, lead to an offset of isotope ratios of 18O/16O and 2H/1H from the global mean. In general heavier isotopes (2H, 17O and 18O) remain in the liquid phase (Gonfiantini, 1986). Thus, vapour is depleted in heavy isotopes relative to the water source and droplets formed from water vapour are heavier than this vapour. This is mostly caused by the lower amount of energy needed to evaporate light molecules (Craig, 1961; Gat, 1971; Merlivat, 1978). This effect of isotopic discrimination is calculated by the fractionation factor α that describes the ratio of the heavy isotopes to the
lighter isotope in the liquid (Rl) relative to the vapour (Rv) phase: α = Rl/Rv > 1.
The fractionation is smaller (higher α values) nearby the boiling point of water than at
lower temperatures (Fig. 2.3) and the equilibrium fractionation α is highest (lower α values) at low temperatures. Additionally, a continuous removal of heavy rain drops from the pool of vapour results in an ongoing depletion of the remaining vapour or the evaporation of vapour from closed basins leads to ongoing enrichment of heavy isotopes in the remaining
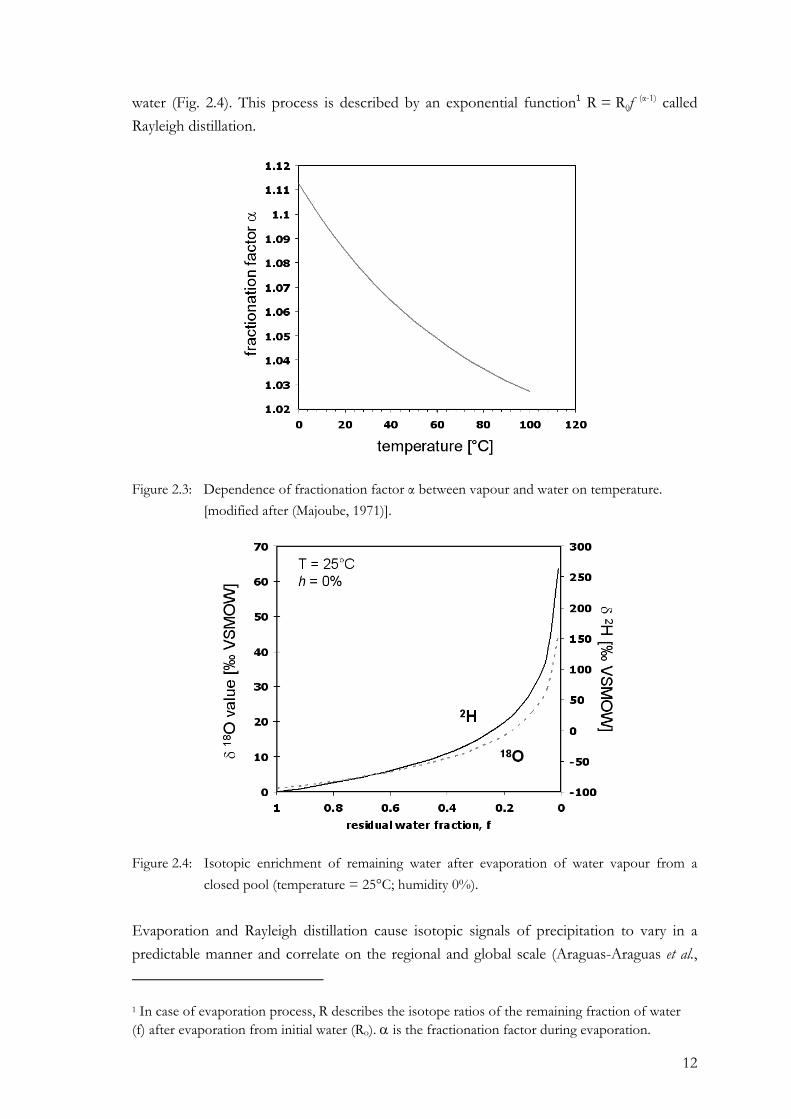
12
water (Fig. 2.4). This process is described by an exponential function1 R = R0f (α-1) called Rayleigh distillation.
Figure 2.3: Dependence of fractionation factor α between vapour and water on temperature. [modified after (Majoube, 1971)].
Figure 2.4: Isotopic enrichment of remaining water after evaporation of water vapour from a closed pool (temperature = 25°C; humidity 0%).
Evaporation and Rayleigh distillation cause isotopic signals of precipitation to vary in a predictable manner and correlate on the regional and global scale (Araguas-Araguas et al.,
1 In case of evaporation process, R describes the isotope ratios of the remaining fraction of water (f) after evaporation from initial water (Ro). α is the fractionation factor during evaporation.
13
2000; Rozanski et al., 1992). Ongoing initiatives to characterize the isotopic variability in precipitation are taken by the Global Network for Isotopes in Precipitation (Araguas-Araguas et al., 2000) in cooperation with the International Atomic Agency (IAEA) and the World Meteorological Organization (WMO) that launched a global isotope in precipitation monitoring network in 1962.
A first systematic analysis of these network data revealed additional relationships between the isotopic signature of precipitation on the one hand and air temperature, precipitation amount, latitude, altitude, and distance to the coast on the other hand (Dansgaard, 1964). Further studies confirmed these effects (Araguas-Araguas et al., 2000; Gonfiantini, 1986; Rozanski et al., 1982) leading to an isotopically ordered world of precipitation (Fig. 2.5). The isotopic content of precipitation nearby the coast or at low elevated continental areas is close to the δD and δ18O values of the ocean. The progressive transport of moisture from intertropical regions towards the pole leads to a gradual depletion in deuterium and oxygen-18 of precipitation which is called the “latitude effect” (Fig. 2.5). Additionally, progressive depletion in heavy isotopes occurs with increasing elevation. Decreasing temperatures force enhanced condensation. This “altitude effect” accounts for -0.15 to -0.50 ‰ per 100 m height for oxygen-18 and -1 to -4 ‰ per 100 m for deuterium (Holdsworth et al., 1991), respectively. Predominantly in mid-latitudes, an increasing distance from the coast to the inner continents leads to the gradual rainout of air masses corresponding with its depletion of heavy isotopes. In mid-latitude Europe the “continental effect” contributes to the depletion of heavy isotopes of around -2 ‰ per 1000 km for oxygen-18 (Rozanski et al., 1982). An apparent correlation between isotope content of precipitation and amount of rainfall is observed in regions with neglecting seasonal temperature variations. The “amount effect” is described as the impact of a rainout event generated by deep convective clouds. Thus, high precipitation amounts lead to the depletion of heavier isotopes overprinting the impact of temperature on the isotope signature of precipitation.
In conclusion, the major fluxes and reservoirs in the water cycle and the accompanying isotope effects are well known (Craig, 1961; Dansgaard, 1964; Huntington, 2006). The isotopic signature of precipitation at a given location represents the history of its corresponding air mass and reflects the regional climate characteristics of the water source area. Thus, the use of stable isotopes as tracers to characterize the actual hydrological system (Craig, 1961; Dansgaard, 1964; Epstein and Mayeda, 1953; Gonfiantini, 1986) is well established and numerous basic empirical studies during the past decades lead to a solid understanding of processes affecting the isotopic signature of meteoric water at different spatial scales (Dansgaard, 1964; Gat, 1996; Rozanski et al., 1992). Using long-term climatic archives this information can be transferred to the temporal scale.
14
Figure 2.5: Global distribution of mean annual hydrogen isotope ratios in precipitation and isotope sensitive processes. [modified (Bowen and Revenaugh, 2003)].
2.4 Long-term water cycle pattern recorded by inorganic molecules
Isotope data that is retrieved from archives such as ice cores from glaciers or polar ice caps, corals or microfossils from lacustrine sediments are assumed to be linked to the isotopic signal of their water source in the past and to the past climate signal as well as to the corresponding environmental parameters like air or water temperature, precipitation or humidity. Each of these archives has certain benefits and disadvantages in conjunction with the temporal or spatial resolution of the isotope signal as well as its preservation.
Marine sediments belong to the climate archives that go back farthest in time. Best marine climatic records are known from biogenic carbonates of corals or laminated sediments deposited in anoxic basins or in accumulation regions at the continental margins. Unfortunately, continuous climate records are sparse mostly because these archives lie in shelf areas or shallow water, which are strongly influenced by varying continental signals and changes in water depth. Adequate temporal resolution can be achieved in open ocean areas but unfortunately here sedimentation rates are low and thermal response of the ocean to climate change is low. However, the isotopic composition of seawater was successfully reconstructed for the whole Phanerozoic that covers the last 600 million years (Veizer et al., 1999).
Glaciers and ice shields are the best available climate recorders as they directly store precipitation, atmospheric gases, aerosols and dust. Analyses of annual layers of snow and ice from the Polar Regions provided the basis of our current knowledge on variations of climatic factors like trace gas concentrations, humidity or intensity of atmospheric circulation patterns (Indermühle et al., 1999; Mayewski et al., 1994; Petit et al., 1981;
15
Raynaud et al., 2005; Thompson et al., 2003). Ice core records are available only for limited locations worldwide. Most important are cores from Greenland and Antarctica. The 3,000 m long GRIP and GISP cores where drilled on the summit of Greenland and provide palaeoclimate information back to the last interglacial more than 100,000 years ago (Augustin et al., 2004; Zielinski et al., 1995). In Antarctica the Vostok ice core reaches back 420,000 years and covers 4 past glacial cycles (Watanabe et al., 2003). The by now longest ice core, also from the Antarctica, is the EPICA core reveals 8 previous glacial cycles and dates back 740,000 years (Augustin et al., 2004) (Fig. 2.6). In addition to these polar ice cores much shorter ice cores covering the time back to the LGM are collected from the glaciers of high mountain ranges, i.e. Mount Kilimanjaro (Thompson et al., 2002), Tibet and the Himalaya (Thompson, 2000) or the Andes (Thompson et al., 2000a). The shorter time covered by continental ice cores demonstrates the sensitivity of ice to elevated temperatures. However, beneficially the isotopic signature of 2H and 18O from precipitation is directly preserved in the ice itself and no further transfer function is needed to reconstruct the isotopic composition of precipitation and macro scale climate information can be reconstructed. Distinction between regional and global climate signals still is difficult because of site limitations either to high altitudes or Polar Regions. Finally reconstructions based on ice core records are limited in time since maximum ages of polar ice caps does not exceed 1 million years.
Figure 2.6: Deuterium values from the 740,000 years EPICA Dome C Ice core. [modified after Augustin et al., 2004]
On the continents lacustrine deposits archive the best palaeoclimatic information. The impact of changing climate is here much stronger than in the oceanic sediments and lacustrine deposits additionally provide a continuous record and a high temporal and spatial resolution. Commonly they contain, like in the marine record, authigenic carbonates or siliceous remains from planktonic and benthic organisms. Their δ18O and δD values are
16
mainly controlled by the isotopic signal of lake water and temperature which can be successfully reconstructed (v. Grafenstein et al., 1999). Unfortunately the relation of stable isotopes and ambient water for this well established method is also dependant on further environmental factors. The transfer functions of water isotopes into the minerals depend on physiological effects for each species and on the salt content. Therefore, other proxies on environmental conditions are necessary to increase data liability for reconstructions. In addition primary mineral remains that have not undergone secondary exchange reactions are not available in all lake sediments.
2.5 Long-term water cycle pattern recorded by organic molecules
Beside mineral remains, organic molecules record palaeoclimatic information. Most well known are annually grown tree rings. Primarily analyses focussed on the annual tree ring growth reconstructing temperature and precipitation amount. Floating chronologies are available for the whole Holocene. Additionally, the non-exchangeable hydrogen and oxygen isotopes of tree ring cellulose with well established transfer functions record the isotope content of leaf water (Dawson, 1993; Sternberg and Deniro, 1983; White et al., 1994; Yakir and Deniro, 1990). The isotopic composition of leaf water is mainly controlled by the isotopic composition of groundwater and the transpiration rate (Fig. 2.1). The latter is mostly influenced by the relative humidity (Roden et al., 2000).
Organic remains are also found in the sedimentary record of marine and lacustrine deposits. Most interestingly for palaeoclimate reconstructions, however, are lacustrine sediments, as climate shifts on the continents are larger and in lakes both, terrestrial and aquatic organic matter is deposited (Fig. 2.1). Continuous sedimentation and age control in laminated sediments enable detailed environmental records. Organic matter in lake sediments incorporates individual molecules that derive from distinct biotic sources. These molecular fossils or so called biomarkers are deposited in almost all sediments. Their abundance and composition identify past biocenosis and environmental parameters of their formation (Meyers, 2003; Meyers and Lallier-Verges, 1999). Most of these biomarkers belong to the biochemical group of lipids which are rich in carbon-bound hydrogen. Comparing molecules with carbon-bound hydrogen atoms to heteroatoms like oxygen, nitrogen or sulfur, carbon-bound hydrogen is non-exchangeable at temperatures up to 150°C (Schimmelmann et al., 1999). Consequently, biomarkers belonging to that group might be suitable indicator for the primary signature of the water source during biosynthesis, since they are stable even over geological time scales.
2.6 Compound - specific isotope ratios of biomarkers record recent climate
The variety of biomarker substances emerging as promising proxies in palaeoclimate studies is constantly increasing over the last decades. Moreover, progress in analytical methods to measure isotope ratios on individual organic compounds for carbon (Hayes et
17
al., 1990) and hydrogen (Burgoyne and Hayes, 1998; Hilkert et al., 1999) improved the characterization of the carbon and hydrogen source of individual biomarker compounds offering several benefits over measuring bulk organic fractions. Thus, since the specific compounds are measured in the archive material in different horizons identically, different biochemical pathways of lipid biosynthesis that leads to distinct isotopic fractionations can be excluded. The measurement of hydrogen isotopes is done specifically on the carbon bound hydrogen which is non-exchangeable for temperatures up to 150 °C (Schimmelmann et al., 1999) and therefore preserves the biological source information.
Of particular interest amongst all biomarkers are n-alkanes. They are recalcitrant and can be isolated even from 600 million year old Phanerozoic sediments. Three major sources for n-alkanes in lake sediments are known: (Fig. 2.1) aquatic organisms, like algae, submerged or floating vascular plants and terrestrial vascular plants (Meyers, 2003). Each of theses organisms synthesize n-alkanes that differ in their molecular structures. Short chain n-alkanes with 17 and 19 carbon atoms are derived from algae; submerged aquatic plants and Sphagnum species synthesize n-alkanes with 23 to 25 carbon atoms (Baas et al., 2000; Ficken et al., 2000). The leaf waxes of terrestrial higher plants contain large proportions of n-alkanes with 25 to 31 carbon atoms, broad leaf trees have high amounts of n-C27 and n-C29 (Eglinton and Hamilton, 1967) and grasses contain mainly n-C31 (Maffei, 1996).
Organisms and plants that synthesize organic compounds such as lipids use their ambient water as their primary source of hydrogen. Thus, aquatic organisms use the lake water to produce n-alkanes and the meteoric water serves as hydrogen source for terrestrial plants n-alkanes. The isotope composition of the particular n-alkanes reveals an isotopic difference relative to the source water. This fractionation was shown to be independent from temperature (Deniro and Epstein, 1981; Estep and Hoering, 1980) but controlled by the isotope signature of their biosynthetic precursor and fractionation and hydrogenation during biosynthesis (Sessions et al., 1999). Furthermore, Sessions et al. (1999) demonstrated that the hydrogen isotopic composition of source water is recorded in biomarkers like n-alkanes. Nevertheless, transfer functions for each biomarker are needed to quantitatively relate the isotopic composition of source water with the isotope signatures that is preserved in the particular biomarker. Various surface sediment studies covering lake transects along climatic gradients in Europe and Northern America (Huang et al., 2004; Sachse et al., 2004), analyses of lacustrine sedimentary n-alkanes in different climates (Chikaraishi and Naraoka, 2003; Sauer et al., 2001) and vegetation specific biomarker studies (Chikaraishi and Naraoka, 2003; Ficken et al., 2000; Liu and Huang, 2005; Sachse et al., 2006; Sessions et al., 1999; Smith and Freeman, 2006b) contributed to the understanding of the processes through the incorporation of hydrogen during biosynthesis.
Although the widespread data regarding fractionation factors are still controversial and lacks of accurate quantitative information, consistent knowledge is established concerning
18
the general processes involved during biosynthetic hydrogen incorporation in n-alkanes. The fractionation of hydrogen during photosynthesis by aquatic organisms leading to a depletion of deuterium of the aquatic derived n-alkanes is independent from temperature and reveals more or less constant values over large climatic gradients (Fig. 2.7) (Chikaraishi and Naraoka, 2003; Huang et al., 2004; Sachse et al., 2004; Sessions et al., 1999).
Figure 2.7: Isotopic relationships between δD values of source water and n-alkanes of terrestrial and aquatic origin in lake sediments. [modified after Sachse et al., 2006].
Terrestrial n-alkanes seem to be enriched in deuterium relative to the aquatic ones with ranges between 10 ‰ and 60 ‰ (Sachse et al. 2004, Chikaraishi and Naraoka, 2003). The terrestrial n-alkanes isotope ratios are assumed to be affected by evapotranspiration effects firstly described by Yapp & Epstein (Yapp and Epstein, 1982). Evaporation of soil water leads to an initial enrichment of meteoric water and transpiration effects at the plants leaf level amplify this enrichment (Leaney et al., 1985; Sachse et al., 2004). Evapotranspiration of the source water for terrestrial organisms therefore causes an isotopic offset between hydrogen isotope ratios of terrestrial and aquatic derived n-alkanes. Quantitative assessment of this offset is of particular importance as it might serve as evapotranspiration proxy in ecosystems (Fig. 2.7).
Whereas a strong linear relationship between the hydrogen isotope values of meteoric waters and n-alkanes from modern lacustrine sediments is shown, the specific impact of plant type, physiology and climate that account for the δ2H signature of n-alkanes in terrestrial plants is still controversially discussed. The hydrogen isotope ratio of n-alkanes in
19
plants is supposed to be controlled by leaf architecture, photosynthetic pathway and growth form (Bi et al., 2005; Krull et al., 2006; Liu et al., 2006; Smith and Freeman, 2006b). Since previous studies on δD values of plant lipids compared C4 grasses to C3 trees, shrubs and herbs, the results are contradictory about the effects of growth forms, plant metabolism and climate during incorporation of hydrogen (Chikaraishi and Naraoka, 2003; Sternberg et al., 1984; Ziegler, 1989). The establishment of consistent data on the biochemical fractionation of hydrogen in plants lipids has only begun focussing the plant specific modifications that alter the isotope ratio of the precipitation water entering the soil - plant system through evapotranspiration.
2.7 Compound – specific hydrogen isotope ratios in contrasting ecosystems
To ensure the reliability established transfer functions have to be tested in distinct climate settings. The above mentioned lake transect studies mainly focussed on study sites in humid climate conditions (Huang et al., 2004; Sachse et al., 2004). In order to figure out variations in isotopic fractionation of lacustrine n-alkanes and water source in different climates a comparison between δD values of sedimentary n-alkanes from lake sediments in Central European humid climate conditions and arid climate conditions at the Central Tibetan Plateau was conducted. In general, this comparison revealed opposite directions of isotopic differences between aquatic and terrestrial n-alkanes in the two ecosystems (Fig. 2.8). Under humid climate conditions terrestrial n-alkanes are enriched in deuterium relative to aquatic derived n-alkanes due to the evapotranspirative enrichment of soil and leaf water by app. 30 ‰ (Sachse et al., 2004; Sachse et al., 2006). In contrast, in arid climate settings the aquatic n-alkanes record the enrichment in deuterium. This leads to an isotopic difference between aquatic and terrestrial biomarkers of about -55‰ (Fig. 2.9). Thus, under arid climate conditions aquatic organisms use lake water for biosynthesis that is isotopically enriched due to exceptional evaporation of lake water. Short living terrestrial plants with their vegetation period during the strong monsoonal rain period use water directly from precipitation for biosynthesis (Fig. 2.8) and are negligible influenced by evapotranspiration. This opposite pattern of this isotopic difference therefore indicates the general hydrological characteristics of lake systems. Furthermore, considering its absolute values it might serve as the basis to quantify evapotranspiration rates and thus as a new proxy for palaeo-evapotranspiration.
20
Figure 2.8: Isotopic difference of aquatic and terrestrial n-alkanes within the mid-European temperate climate Holzmaar (left) and within the highly evaporative environment of Nam Co, Tibetan Plateau (right).
Figure 2.9: Increasing δD values of n-alkanes and isoprenoids with increasing degree of maturity. [modified after Radke et al., 2005]
The established transfer functions were also validated for the Neogene. Schefuss et al., (2005) successfully reconstructed past African rainfall variations during the last 20,000 years using the isotopic content of terrestrial n-alkanes. Abrupt climate changes such as the 8.2 ka event were reconstructed using δD-values of biomarkers from lake sediments in
21
New England and Massachusetts (Hou et al., 2006; Shuman et al., 2006). In general δD values of individual compounds were successfully applied to reconstruct hydrologic conditions in the Miocene (Andersen et al., 2001), the late Quaternary (Huang et al., 2002; Liu and Huang, 2005; Schefuss et al., 2005) or the Holocene (Xie et al., 2000). Consequently, early post sedimentary processes are not changing the hydrogen isotopic composition of sediments.
2.8 The stability of compound – specific hydrogen isotope ratios over the
geological past
For geologic older sediments further analyses are required to test the reliability of compound – specific – hydrogen isotope ratios since thermal maturity of bulk sediments is known to effect strongly the isotopic composition of organic matter (Schimmelmann et al., 1999). Radke et al. (2005) used δD values of n-alkanes extracted from different sections of the Copper shale with increasing thermal maturity to investigate the effect of thermal maturity. The Copper shale sediment was deposited due to an anoxic event in a short time period 258 million years ago. Different burial depth caused increasing thermal maturity of this relative homogeneous deposit. The deuterium content of n-alkanes and isoprenoids linearly increased with increasing thermal maturity (Fig. 2.9). With increasing maturity the biosynthesis-based isotopic difference between n-alkanes and isoprenoids was lost. Several studies confirmed this lack of hydrogen isotopic difference between n-alkanes and isoprenoids in late mature sediments (Dawson et al., 2005; Pedentchouk et al., 2006; Schimmelmann et al., 2004; Schimmelmann et al., 2006; Sessions et al., 2004) and therefore suggest that climatic information in the δD signature is significantly altered in mature sediments. However, both, the linear relationship of isotopic change with thermal maturity as well as the isotopic offset between isoprenoids and n-alkanes can be used to correct for the influence of thermal maturity (Radke et al., 2005). This suggests that hydrogen isotope ratios of n-alkanes can be applied for palaeoclimate reconstructions in the whole Phanerozoic.
2.9 Water isotopes in paleoclimate models
Quantitative understanding of water isotope signatures in the water cycle is continuously growing with the development of isotope hydrology and paleoclimatology. First very simplified models based only on Rayleigh distillation and modelled the distribution of water isotopes in precipitation (Dansgaard, 1964). These models were continuously improved implementing processes like evaporative fractionation (Merlivat and Jouzel, 1979) or re-evaporation of precipitation from the terrestrial surface (Rozanski et al, 1982). The full three dimensional complexity of the fractionation processes in the hydrological cycle was started to be represented in atmospheric general circulation models (AGCM) (i.e. the model of the Laboratoire de Meteorologie Dynamique (LDM) (Joussaume et al., 1984); the European Center Model Hamburg (ECHAM) (Hoffmann and Heimann, 1993). Until now
22
a great variety of models working on different time and spatial scales exist (Tab. 2.2). However, direct comparison to water isotopes reconstructed from archives are still sparse. First results using the global atmospheric circulation models ECHAM as well as the regional climate model REMO (developed by the Max-Planck Institute for Meteorology, Hamburg) gave good agreement between the simulated and experimental results from the polar ice core δD and δ18O values (Fig. 2.10a) (Werner et al., 2001). Most interestingly, these simulations predict large isotopic differences in the order of 120‰ between the LGM and today (Fig. 2.10b).
Table 2.2: Water isotope studies using general circulation models.
Time scale AGCM simulation
Seasonal cycle under modern conditions Joussaume et al., (1984) Jouzel et al., (1991) Hoffman and Heimann, (1993) Hoffman et al., (1998) Mathieu et al., (1999) Yoshimura et al., (2003)
Interannual variability Cole et al., (1993) Hoffmann et al., (1998)
Glacial-interglacial cycles Joussaume et al., (1984) Jouzel et al., (1994) Hoffmann and Heimann, (1997) Werner et al., (2001)
Figure 2.10: ECHAM4 - simulated changes of δD values in precipitation during the last glacial maximum compared to recent climate conditions (a); Comparison of simulated and measured δD and δ18O values in precipitation back to the last glacial maximum using GRIP and VOSTOK ice cores (b). [after Werner et al., 2001].
23
Unfortunately, a direct comparison to compound – specific isotope ratios measured on biomarkers is still not possible, as biological based modules incorporated in climate models need to be further developed. To extend the simulation of climate conditions in longer geological time scales additional changes in the distribution of continents and the ocean currents will be necessary.
2.10 Conclusions
This chapter suggests that compound – specific isotopes ratios of biomarkers are most suitable to reconstruct past climate and environmental conditions. Further research will be needed to derive improved transfer functions for the isotopic signal of source water into biomarkers. The combination of experimental studies using lake sediments and modelling studies will help to evaluate the quality of climate predictions made by current circulation models.
24
3 Effect of lake evaporation on �δD values from lacustrine n-alkanes: A comparison of Nam Co, Tibetan Plateau and Holzmaar, Germany
Chapter 3
Effect of lake evaporation on δD values from lacustrine n-alkanes:
A comparison of Nam Co, Tibetan Plateau and Holzmaar, Germany
Chapter source: Mügler et al., 2008. Effect of lake evaporation on δD values from lacustrine n-alkanes: A comparison of Nam Co, Tibetan Plateau and Holzmaar, Germany. Organic Geochemistry. in print.
Abstract
Compound-specific hydrogen isotope ratios of lacustrine n-alkanes from two contrasting ecosystems, the semi-arid to arid Nam Co, Central Tibet and the humid Holzmaar, Germany, were compared in order to assess whether or not these environmental conditions are recorded in the isotopic signatures of biomarkers. Increased evaporation of lake water at Nam Co is recorded by the n-alkanes of aquatic origin. Hence, isotopic enrichment results in a difference between terrestrial and aquatic n-alkanes in the opposite direction (~ - 68‰) from that known for humid climate conditions (~ + 30‰) predominating at Holzmaar. Based on this isotopic difference between terrestrial and aquatic n-alkanes evaporation to inflow ratios (E/I) were estimated and suggest that this isotopic difference is indicative for the general hydroclimatic characteristics of a lake system. Moreover, the comparison with E/I ratios calculated with actual stable water isotope data showed that the δD values of aquatic and terrestrial lacustrine n-alkanes serve as a proxy for the relative isotopic differences between lake and inflow waters and can be used to assess the proportion of water undergoing evaporation relative to the inflow and thus to reconstruct the lake water balance in the past.
Keywords: Compound-specific isotope ratios; Tibetan Plateau; isotope fractionation,
paleoclimate, water isotope, evaporation to inflow ratio, lake water balance
25
3.1 Introduction
The importance of the stable isotopes of water (δD and δ18O) for paleoclimate studies was recognized early on (Gonfiantini, 1986; Rozanski et al., 1992; Rozanski et al., 1997; Rozanski et al., 1982). Environmental parameters such as temperature, source and amount of precipitation, elevation or distance to the ocean generally influence the isotopic signature of precipitation (Craig, 1961; Craig and Gordon, 1965; Dansgaard, 1964; Rozanski et al., 1982). Consequently, terrestrial or aquatic remains that preserve the isotope signal of paleoprecipitation such as tree rings, organic matter in lacustrine sediments, ice cores, loess sequences or microfossils can potentially be used to infer past temperatures or hydrological oscillations. Taking into account the benefits and disadvantages of each archive material, this study uses lacustrine sediments to reconstruct regional climatic information. Lake sediments, for instance, can preserve both the primary isotopic composition of precipitation and secondary modifications of the lake water isotope signal through the lake hydrology, i.e. evaporation, inflow and outflow.
In order to study the imprint of lake hydrology and environmental parameters on lacustrine sedimentary material, three closed lake systems in humid and semi-arid to arid climates were investigated. The water balance of closed basin lakes is controlled mainly by the input through precipitation in the catchment and the amount of evaporation from the lake surface. The interplay of both processes affects the stable isotope composition of the lake water, as summarized by (Craig and Gordon, 1965; Dansgaard, 1964; Gat, 1996; Gibson et al., 2005; Gibson et al., 1998; Gonfiantini, 1986). The isotope signal of the lake water itself can be preserved in various constituents of the lake deposits, such as carbonates (Kelts and Talbot, 1990; Morinaga et al., 1993; Schwalb, 2003), fossil shells or sedimentary cellulose from algae (Danis et al., 2006; Deniro and Epstein, 1977; Pendall et al., 1999). There are, however, difficulties in obtaining a pristine autochthonous isotope signal (e.g. Huang et al., 2004). In this study, we use compound-specific hydrogen isotope ratios of sedimentary biomarkers to distinguish between autochthonous and allochthonous material. In general, the abundance and composition of biomarkers can serve to identify past ecosystems and environmental parameters during their formation (Meyers, 2003; Meyers and Lallier-Verges, 1999). Amongst biomarkers, n-alkanes are stable towards secondary structural and isotopic modification and so are well suited for palaeoclimatic reconstructions (Huang et al., 1996; Huang et al., 2002; Ohkouchi et al., 1997; Pagani et al., 2006; Sachse et al., 2004; Schefuss et al., 2005; Schmidt et al., 2004; Shuman et al., 2006; Yang and Huang, 2003). Major sources of n-alkanes in lacustrine sediments are aquatic organisms, i.e. photosynthetic bacteria or algae, for molecules with 15 to 19 carbons (Cranwell et al., 1987; Grimalt and Albaiges, 1987; Han and Calvin, 1969; Meyers, 2003), submerged or floating plants for n-C21 to n-C25 compounds (Baas et al., 2000; Ficken et al., 2000) and terrestrial vascular plants for n-C27 to n-C31 alkanes (Eglinton and Hamilton, 1967; Meyers, 2003). Since photosynthetic organisms and plants that produce n-alkanes use the ambient water as
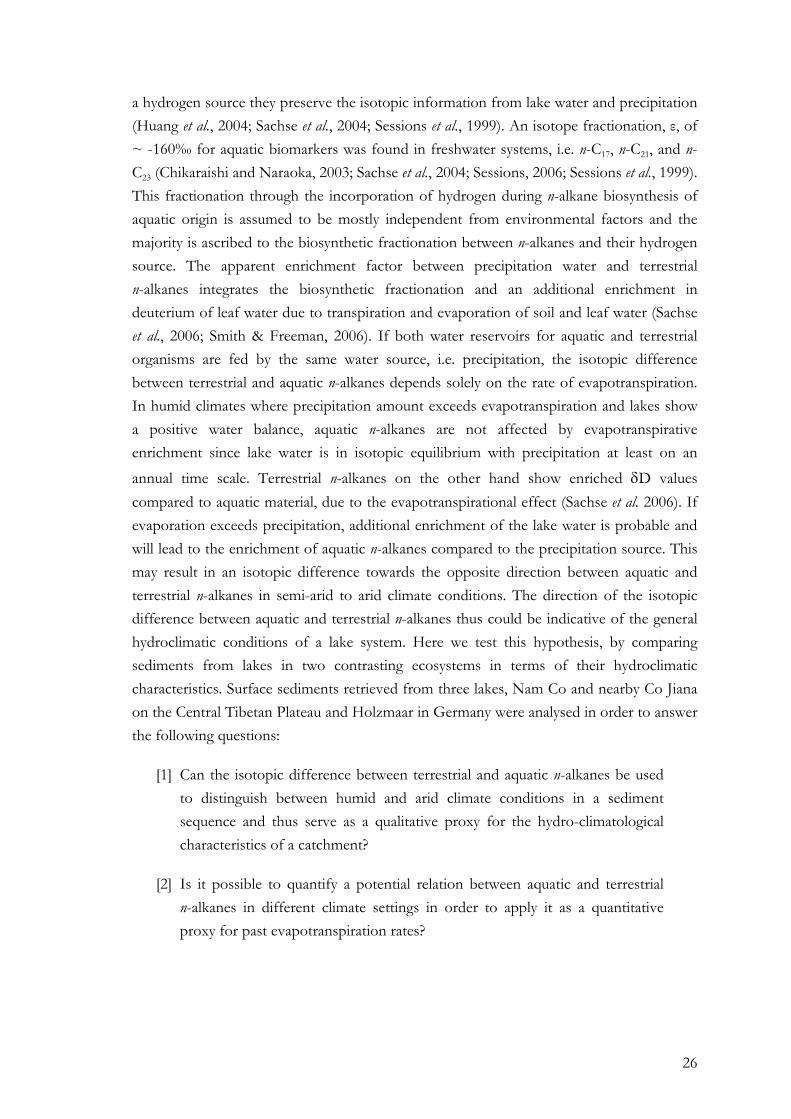
26
a hydrogen source they preserve the isotopic information from lake water and precipitation (Huang et al., 2004; Sachse et al., 2004; Sessions et al., 1999). An isotope fractionation, ε, of ~ -160‰ for aquatic biomarkers was found in freshwater systems, i.e. n-C17, n-C21, and n-C23 (Chikaraishi and Naraoka, 2003; Sachse et al., 2004; Sessions, 2006; Sessions et al., 1999). This fractionation through the incorporation of hydrogen during n-alkane biosynthesis of aquatic origin is assumed to be mostly independent from environmental factors and the majority is ascribed to the biosynthetic fractionation between n-alkanes and their hydrogen source. The apparent enrichment factor between precipitation water and terrestrial n-alkanes integrates the biosynthetic fractionation and an additional enrichment in deuterium of leaf water due to transpiration and evaporation of soil and leaf water (Sachse et al., 2006; Smith & Freeman, 2006). If both water reservoirs for aquatic and terrestrial organisms are fed by the same water source, i.e. precipitation, the isotopic difference between terrestrial and aquatic n-alkanes depends solely on the rate of evapotranspiration. In humid climates where precipitation amount exceeds evapotranspiration and lakes show a positive water balance, aquatic n-alkanes are not affected by evapotranspirative enrichment since lake water is in isotopic equilibrium with precipitation at least on an annual time scale. Terrestrial n-alkanes on the other hand show enriched δD values compared to aquatic material, due to the evapotranspirational effect (Sachse et al. 2006). If evaporation exceeds precipitation, additional enrichment of the lake water is probable and will lead to the enrichment of aquatic n-alkanes compared to the precipitation source. This may result in an isotopic difference towards the opposite direction between aquatic and terrestrial n-alkanes in semi-arid to arid climate conditions. The direction of the isotopic difference between aquatic and terrestrial n-alkanes thus could be indicative of the general hydroclimatic conditions of a lake system. Here we test this hypothesis, by comparing sediments from lakes in two contrasting ecosystems in terms of their hydroclimatic characteristics. Surface sediments retrieved from three lakes, Nam Co and nearby Co Jiana on the Central Tibetan Plateau and Holzmaar in Germany were analysed in order to answer the following questions:
[1] Can the isotopic difference between terrestrial and aquatic n-alkanes be used to distinguish between humid and arid climate conditions in a sediment sequence and thus serve as a qualitative proxy for the hydro-climatological characteristics of a catchment?
[2] Is it possible to quantify a potential relation between aquatic and terrestrial n-alkanes in different climate settings in order to apply it as a quantitative proxy for past evapotranspiration rates?
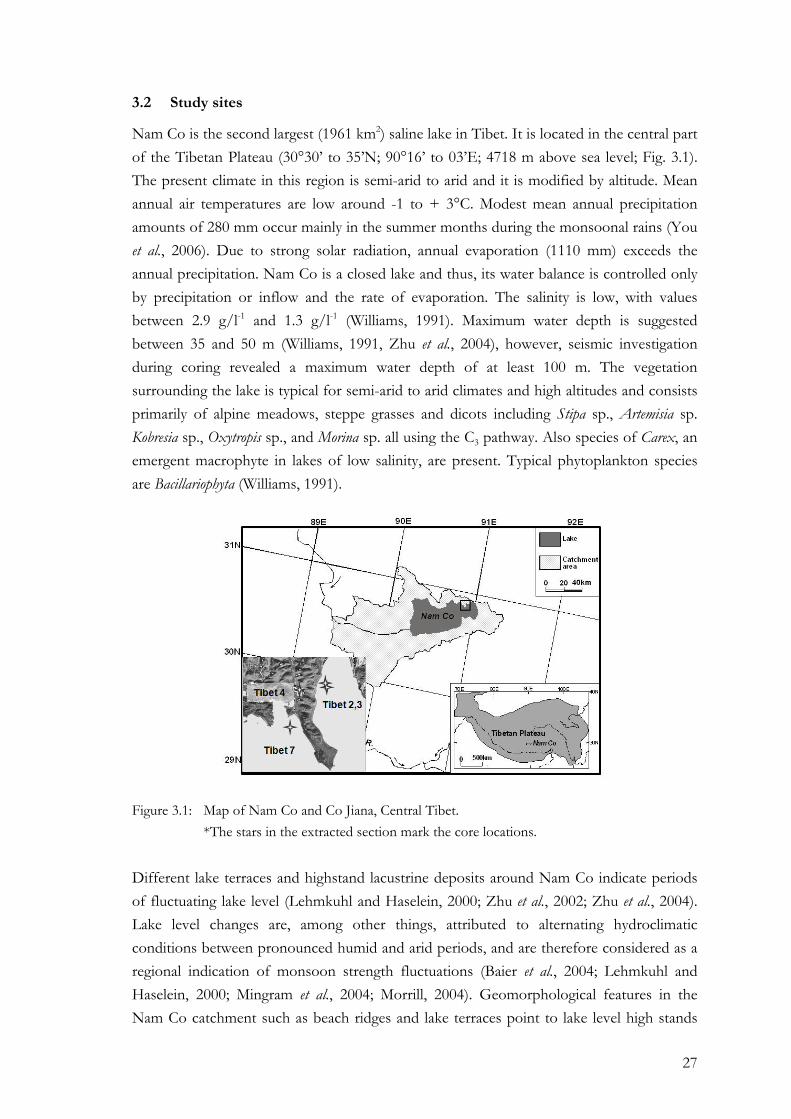
27
3.2 Study sites
Nam Co is the second largest (1961 km2) saline lake in Tibet. It is located in the central part of the Tibetan Plateau (30°30’ to 35’N; 90°16’ to 03’E; 4718 m above sea level; Fig. 3.1). The present climate in this region is semi-arid to arid and it is modified by altitude. Mean annual air temperatures are low around -1 to + 3°C. Modest mean annual precipitation amounts of 280 mm occur mainly in the summer months during the monsoonal rains (You et al., 2006). Due to strong solar radiation, annual evaporation (1110 mm) exceeds the annual precipitation. Nam Co is a closed lake and thus, its water balance is controlled only by precipitation or inflow and the rate of evaporation. The salinity is low, with values between 2.9 g/l-1 and 1.3 g/l-1 (Williams, 1991). Maximum water depth is suggested between 35 and 50 m (Williams, 1991, Zhu et al., 2004), however, seismic investigation during coring revealed a maximum water depth of at least 100 m. The vegetation surrounding the lake is typical for semi-arid to arid climates and high altitudes and consists primarily of alpine meadows, steppe grasses and dicots including Stipa sp., Artemisia sp. Kobresia sp., Oxytropis sp., and Morina sp. all using the C3 pathway. Also species of Carex, an emergent macrophyte in lakes of low salinity, are present. Typical phytoplankton species are Bacillariophyta (Williams, 1991).
Figure 3.1: Map of Nam Co and Co Jiana, Central Tibet. *The stars in the extracted section mark the core locations.
Different lake terraces and highstand lacustrine deposits around Nam Co indicate periods of fluctuating lake level (Lehmkuhl and Haselein, 2000; Zhu et al., 2002; Zhu et al., 2004). Lake level changes are, among other things, attributed to alternating hydroclimatic conditions between pronounced humid and arid periods, and are therefore considered as a regional indication of monsoon strength fluctuations (Baier et al., 2004; Lehmkuhl and Haselein, 2000; Mingram et al., 2004; Morrill, 2004). Geomorphological features in the Nam Co catchment such as beach ridges and lake terraces point to lake level high stands
28
during the Late Glacial Maximum. Thereafter the Nam Co lake level and volume gradually decreased. Recent observations indicate a stable and periodically increasing lake level during the last two years. Lakeshore deposits present in valley bottoms between several small lakes surrounding Nam Co confirm the former connection of these lakes with Nam Co. One of them is Co Jiana, located at the north-eastern bank (see section in Fig. 3.1). Co Jiana, which also has no outflow, stretches 0.6 km from North to South and about 1 km from West to East, and is separated from Nam Co by a 200 m wide ridge.
Holzmaar is located in a humid climate setting in western Germany (50°7’N; 6°53’E; 425 m above sea level; Fig. 3.2). The small, nearly circular lake is a meso to eutrophic maar lake with a diameter of approximately 325 m. Holzmaar has only one inflow stream, the Sammetbach. Typical for lakes of phreatomagmatic origin, it has steep slopes and a flat profundal region, with a maximum water depth of 20 m (Baier et al., 2004), a dimictic thermal pattern and a water residence time of about 7 months (Oehms, 1995). The climate in the region is defined as moist-temperate, with cool winters and wet summers (Closs, 1979). Mean annual temperature is around 7.5°C (Deutscher Wetter Dienst, http://www.dwd.de). The annual precipitation shows maxima during the summer and winter months and minima in March/April and September/October, with an annual mean of about 796 mm. Precipitation exceeds the amount of evaporation (482 mm) within the annual mean indicating humid climate conditions (Krause, 1980). The vegetation is dominated by beech (Fagus sylvatica) and spruce (Picea abies), as well as isolated oak (Quercus petrea), willow (Salix sp.) and birch (Betula pendula). Also, agronomically used grassland and pasture border the south-western lake bank.
Figure 3.2: Map of Holzmaar, Germany [modified after Moschen et al., 2006]
29
3.3 Sampling
During the field campaign in August 2004 three short cores were retrieved from Nam Co and one short core from Co Jiana (Fig. 3.1) using a gravity corer (HTH-Teknik, Luleå, Sweden). The Co Jiana core (Tibet 4) was collected from the deepest part of the lake, determined from echo sounding, in water depths of up to 7 m. The Nam Co cores (Tibet 2, 3, 7) were obtained near the shore in shallow water. The short cores are between 15 cm and 25 cm long. The sedimentary data to be discussed in the following is determined from the short cores surface sediments (0-1.5 cm). Based on the sedimentation rate of ~1mm/year the surface sediments integrate the environmental signal of 15 years. Water samples of both lakes were collected in 2004 and 2005 with a water sampler (Hydro-Bios Apparatebau GmbH, Kiel, Germany). Additionally, about 40 inflow streams around both lakes including water from wetlands draining into Nam Co and Co Jiana were sampled in both years as well as pooled vegetation samples from the dominant species around the lake including Kobresia schoenoides, Morina cryptothladia, Oxytropis sp., Stipa sp. and submerged aquatic macrophytes from both lakes and one unidentified algae from Nam Co.
Sediment coring at Holzmaar was performed in the frame of the European lake transect study in August and September 2002 (Sachse et al., 2004). The surface sediments (0-1 cm) are assumed to represent the deposition of material from the last year (Sachse et al., 2004). In addition to the short sediment cores, sampling included water from the lake and the inflow stream as well as the dominant surrounding vegetation (Betula pendula and Fagus sylvatica; data published in Sachse et al., 2004, 2006).
Precipitation was measured and continuously sampled at Nam Co climate station since 2005 (You et al., 2006). Precipitation data for the Holzmaar catchment have been recorded at Manderscheid station (50.1°N; 6.8°E; DWD) since 1961 and the isotope data is provided by the IAEA GNIP database from the IAEA GNIP station in Trier that is located about 50 km to the SW of the lake (http://isohis.iaea.org).
3.4 Methods
3.4.1 Analyses of water samples for δD and δ18O
Water isotope ratios were measured by on-line high-temperature reduction in a modified carbon reactor of a high temperature elemental analyser (TC/EA) coupled with an IRMS (DeltaplusXL, Finnigan MAT Bremen, Germany) (Gehre et al., 2004). The average standard deviation was 0.5‰ for δD and below 0.1‰ for δ18O.
3.4.2 Sample preparation, n-alkane extraction and quantification
The sediment samples and plant material were freeze dried and ground. Between 3 to 6 g of sediments and approximately 1 g of plant biomass were used for lipid extraction with an accelerated solvent extractor (ASE-200, DIONEX Corp., Sunnydale, USA) operated with
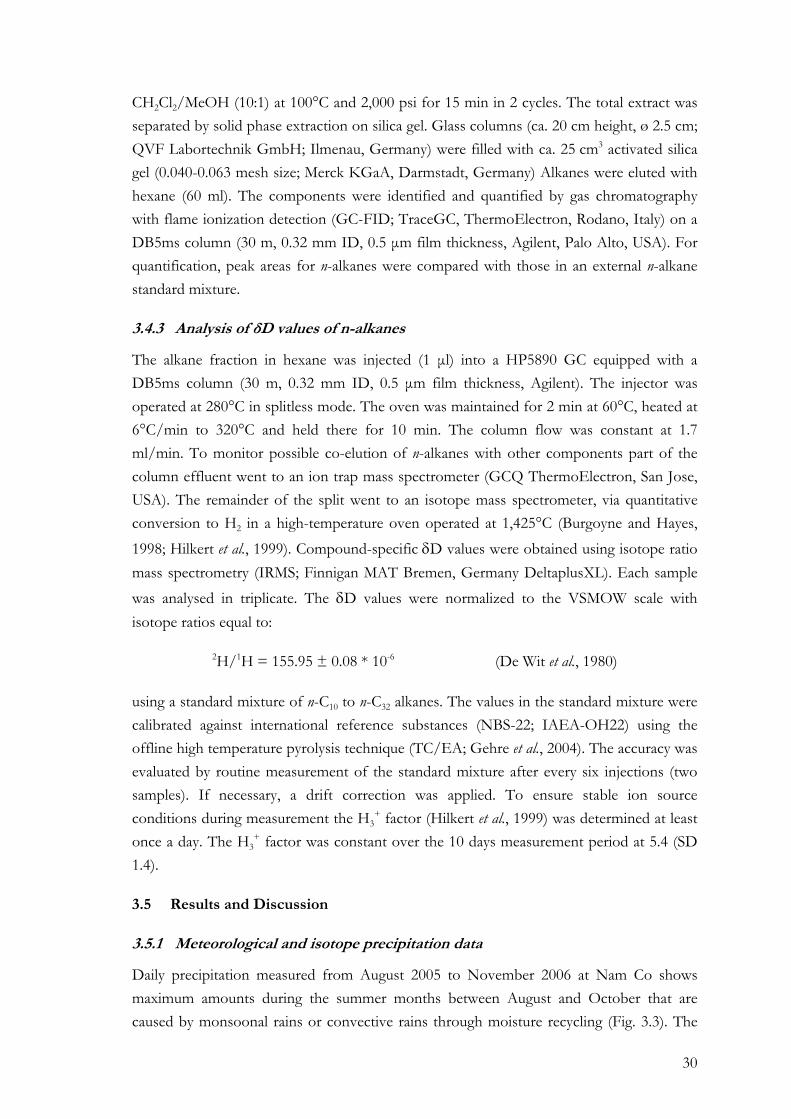
30
CH2Cl2/MeOH (10:1) at 100°C and 2,000 psi for 15 min in 2 cycles. The total extract was separated by solid phase extraction on silica gel. Glass columns (ca. 20 cm height, ø 2.5 cm; QVF Labortechnik GmbH; Ilmenau, Germany) were filled with ca. 25 cm3 activated silica gel (0.040-0.063 mesh size; Merck KGaA, Darmstadt, Germany) Alkanes were eluted with hexane (60 ml). The components were identified and quantified by gas chromatography with flame ionization detection (GC-FID; TraceGC, ThermoElectron, Rodano, Italy) on a DB5ms column (30 m, 0.32 mm ID, 0.5 μm film thickness, Agilent, Palo Alto, USA). For quantification, peak areas for n-alkanes were compared with those in an external n-alkane standard mixture.
3.4.3 Analysis of δD values of n-alkanes
The alkane fraction in hexane was injected (1 μl) into a HP5890 GC equipped with a DB5ms column (30 m, 0.32 mm ID, 0.5 μm film thickness, Agilent). The injector was operated at 280°C in splitless mode. The oven was maintained for 2 min at 60°C, heated at 6°C/min to 320°C and held there for 10 min. The column flow was constant at 1.7 ml/min. To monitor possible co-elution of n-alkanes with other components part of the column effluent went to an ion trap mass spectrometer (GCQ ThermoElectron, San Jose, USA). The remainder of the split went to an isotope mass spectrometer, via quantitative conversion to H2 in a high-temperature oven operated at 1,425°C (Burgoyne and Hayes, 1998; Hilkert et al., 1999). Compound-specific δD values were obtained using isotope ratio mass spectrometry (IRMS; Finnigan MAT Bremen, Germany DeltaplusXL). Each sample was analysed in triplicate. The δD values were normalized to the VSMOW scale with isotope ratios equal to:
2H/1H = 155.95 ± 0.08 * 10-6 (De Wit et al., 1980)
using a standard mixture of n-C10 to n-C32 alkanes. The values in the standard mixture were calibrated against international reference substances (NBS-22; IAEA-OH22) using the offline high temperature pyrolysis technique (TC/EA; Gehre et al., 2004). The accuracy was evaluated by routine measurement of the standard mixture after every six injections (two samples). If necessary, a drift correction was applied. To ensure stable ion source conditions during measurement the H3
+ factor (Hilkert et al., 1999) was determined at least once a day. The H3
+ factor was constant over the 10 days measurement period at 5.4 (SD 1.4).
3.5 Results and Discussion
3.5.1 Meteorological and isotope precipitation data
Daily precipitation measured from August 2005 to November 2006 at Nam Co shows maximum amounts during the summer months between August and October that are caused by monsoonal rains or convective rains through moisture recycling (Fig. 3.3). The
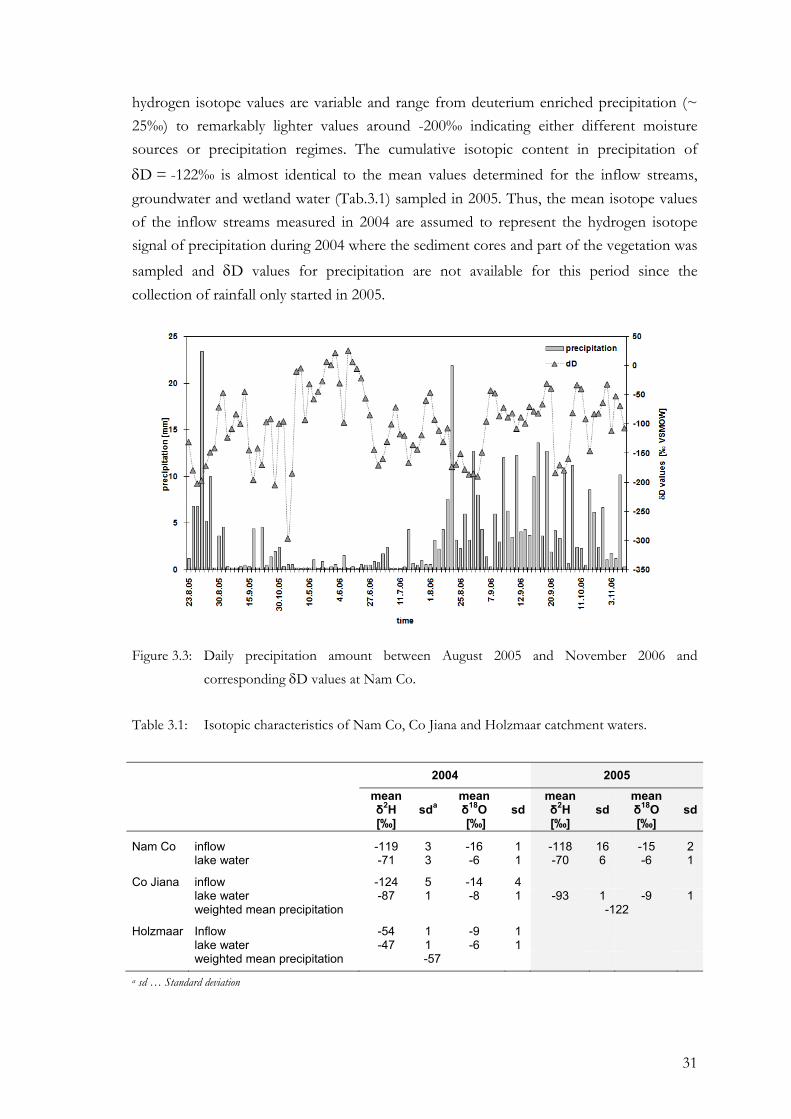
31
hydrogen isotope values are variable and range from deuterium enriched precipitation (~ 25‰) to remarkably lighter values around -200‰ indicating either different moisture sources or precipitation regimes. The cumulative isotopic content in precipitation of δD = -122‰ is almost identical to the mean values determined for the inflow streams, groundwater and wetland water (Tab.3.1) sampled in 2005. Thus, the mean isotope values of the inflow streams measured in 2004 are assumed to represent the hydrogen isotope signal of precipitation during 2004 where the sediment cores and part of the vegetation was sampled and δD values for precipitation are not available for this period since the collection of rainfall only started in 2005.
Figure 3.3: Daily precipitation amount between August 2005 and November 2006 and corresponding δD values at Nam Co.
Table 3.1: Isotopic characteristics of Nam Co, Co Jiana and Holzmaar catchment waters.
2004 2005
mean δ2H [‰]
sda mean δ18O [‰]
sdmean δ2H [‰]
sd mean δ18O [‰]
sd
Nam Co inflow -119 3 -16 1 -118 16 -15 2 lake water -71 3 -6 1 -70 6 -6 1
Co Jiana inflow -124 5 -14 4 lake water -87 1 -8 1 -93 1 -9 1 weighted mean precipitation -122
Holzmaar Inflow -54 1 -9 1 lake water -47 1 -6 1 weighted mean precipitation -57
a sd … Standard deviation
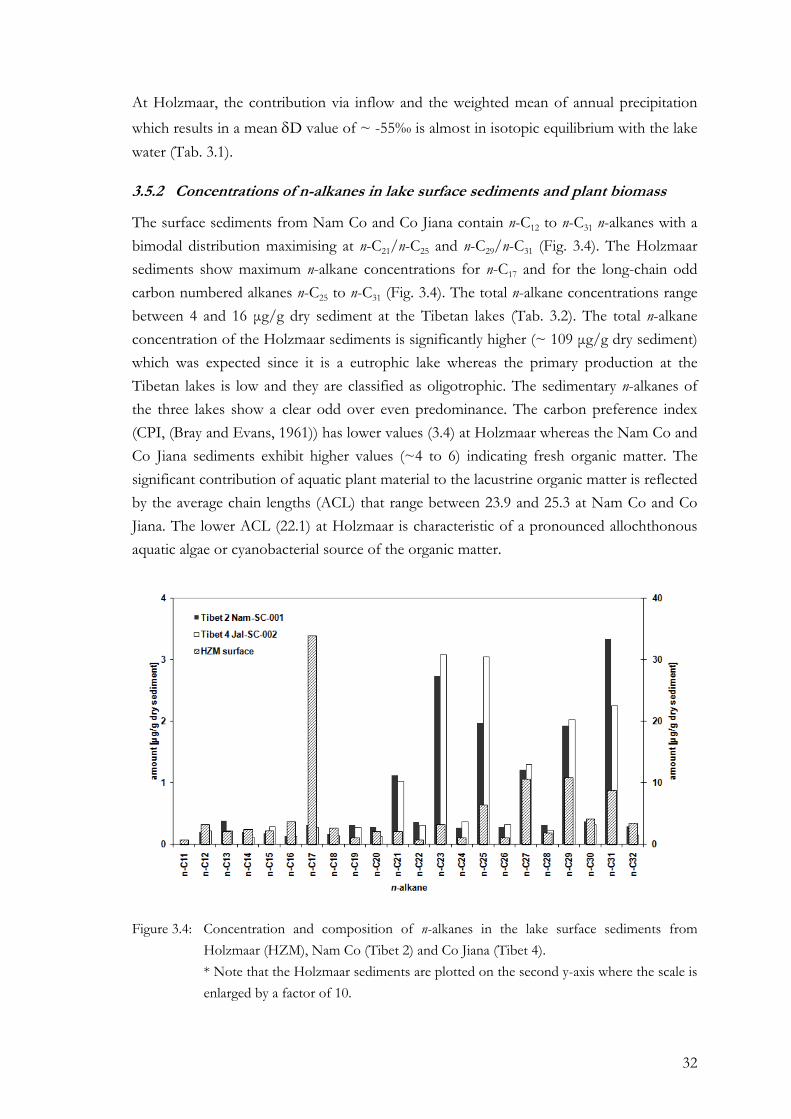
32
At Holzmaar, the contribution via inflow and the weighted mean of annual precipitation which results in a mean δD value of ~ -55‰ is almost in isotopic equilibrium with the lake water (Tab. 3.1).
3.5.2 Concentrations of n-alkanes in lake surface sediments and plant biomass
The surface sediments from Nam Co and Co Jiana contain n-C12 to n-C31 n-alkanes with a bimodal distribution maximising at n-C21/n-C25 and n-C29/n-C31 (Fig. 3.4). The Holzmaar sediments show maximum n-alkane concentrations for n-C17 and for the long-chain odd carbon numbered alkanes n-C25 to n-C31 (Fig. 3.4). The total n-alkane concentrations range between 4 and 16 μg/g dry sediment at the Tibetan lakes (Tab. 3.2). The total n-alkane concentration of the Holzmaar sediments is significantly higher (~ 109 μg/g dry sediment) which was expected since it is a eutrophic lake whereas the primary production at the Tibetan lakes is low and they are classified as oligotrophic. The sedimentary n-alkanes of the three lakes show a clear odd over even predominance. The carbon preference index (CPI, (Bray and Evans, 1961)) has lower values (3.4) at Holzmaar whereas the Nam Co and Co Jiana sediments exhibit higher values (~4 to 6) indicating fresh organic matter. The significant contribution of aquatic plant material to the lacustrine organic matter is reflected by the average chain lengths (ACL) that range between 23.9 and 25.3 at Nam Co and Co Jiana. The lower ACL (22.1) at Holzmaar is characteristic of a pronounced allochthonous aquatic algae or cyanobacterial source of the organic matter.
Figure 3.4: Concentration and composition of n-alkanes in the lake surface sediments from Holzmaar (HZM), Nam Co (Tibet 2) and Co Jiana (Tibet 4). * Note that the Holzmaar sediments are plotted on the second y-axis where the scale is enlarged by a factor of 10.
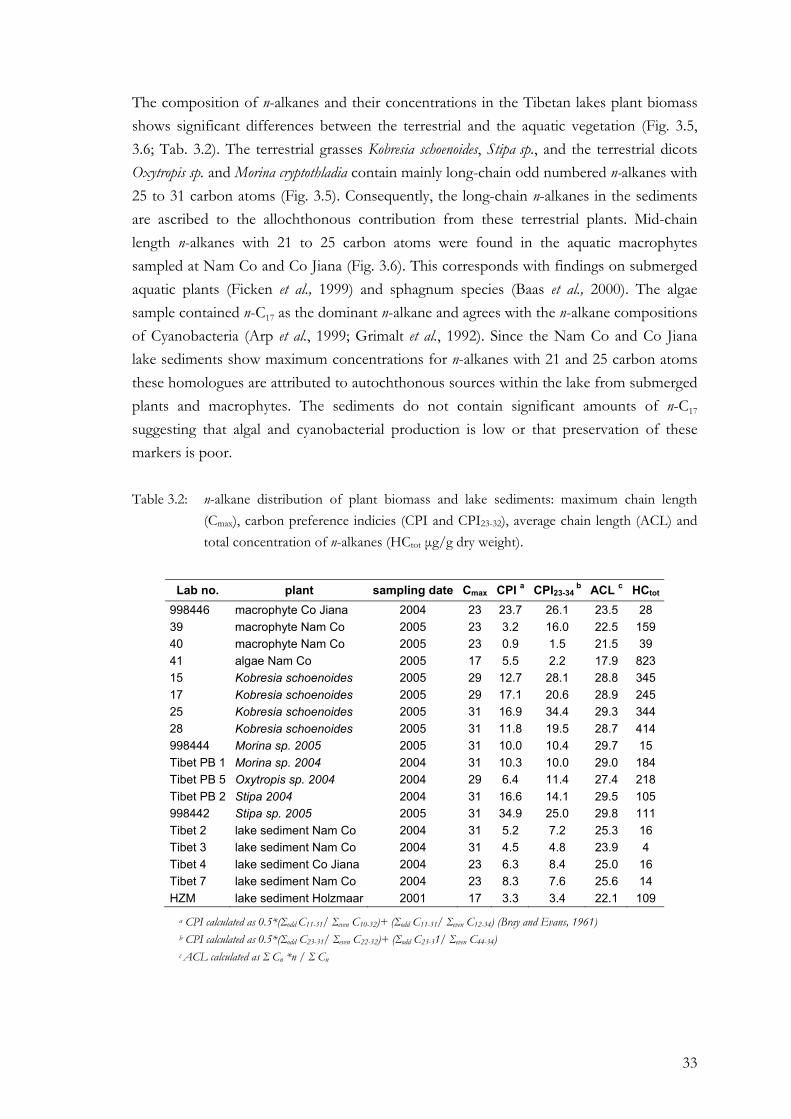
33
The composition of n-alkanes and their concentrations in the Tibetan lakes plant biomass shows significant differences between the terrestrial and the aquatic vegetation (Fig. 3.5, 3.6; Tab. 3.2). The terrestrial grasses Kobresia schoenoides, Stipa sp., and the terrestrial dicots Oxytropis sp. and Morina cryptothladia contain mainly long-chain odd numbered n-alkanes with 25 to 31 carbon atoms (Fig. 3.5). Consequently, the long-chain n-alkanes in the sediments are ascribed to the allochthonous contribution from these terrestrial plants. Mid-chain length n-alkanes with 21 to 25 carbon atoms were found in the aquatic macrophytes sampled at Nam Co and Co Jiana (Fig. 3.6). This corresponds with findings on submerged aquatic plants (Ficken et al., 1999) and sphagnum species (Baas et al., 2000). The algae sample contained n-C17 as the dominant n-alkane and agrees with the n-alkane compositions of Cyanobacteria (Arp et al., 1999; Grimalt et al., 1992). Since the Nam Co and Co Jiana lake sediments show maximum concentrations for n-alkanes with 21 and 25 carbon atoms these homologues are attributed to autochthonous sources within the lake from submerged plants and macrophytes. The sediments do not contain significant amounts of n-C17 suggesting that algal and cyanobacterial production is low or that preservation of these markers is poor.
Table 3.2: n-alkane distribution of plant biomass and lake sediments: maximum chain length (Cmax), carbon preference indicies (CPI and CPI23-32), average chain length (ACL) and total concentration of n-alkanes (HCtot μg/g dry weight).
Lab no. plant sampling date Cmax CPI a CPI23-34 b ACL c HCtot
998446 macrophyte Co Jiana 2004 23 23.7 26.1 23.5 28 39 macrophyte Nam Co 2005 23 3.2 16.0 22.5 159 40 macrophyte Nam Co 2005 23 0.9 1.5 21.5 39 41 algae Nam Co 2005 17 5.5 2.2 17.9 823 15 Kobresia schoenoides 2005 29 12.7 28.1 28.8 345 17 Kobresia schoenoides 2005 29 17.1 20.6 28.9 245 25 Kobresia schoenoides 2005 31 16.9 34.4 29.3 344 28 Kobresia schoenoides 2005 31 11.8 19.5 28.7 414 998444 Morina sp. 2005 2005 31 10.0 10.4 29.7 15 Tibet PB 1 Morina sp. 2004 2004 31 10.3 10.0 29.0 184 Tibet PB 5 Oxytropis sp. 2004 2004 29 6.4 11.4 27.4 218 Tibet PB 2 Stipa 2004 2004 31 16.6 14.1 29.5 105 998442 Stipa sp. 2005 2005 31 34.9 25.0 29.8 111 Tibet 2 lake sediment Nam Co 2004 31 5.2 7.2 25.3 16 Tibet 3 lake sediment Nam Co 2004 31 4.5 4.8 23.9 4 Tibet 4 lake sediment Co Jiana 2004 23 6.3 8.4 25.0 16 Tibet 7 lake sediment Nam Co 2004 23 8.3 7.6 25.6 14 HZM lake sediment Holzmaar 2001 17 3.3 3.4 22.1 109
a CPI calculated as 0.5*(Σodd C11-31/ Σeven C10-32)+ (Σodd C11-31/ Σeven C12-34) (Bray and Evans, 1961) b CPI calculated as 0.5*(Σodd C23-31/ Σeven C22-32)+ (Σodd C23-31/ Σeven C44-34) c ACL calculated as Σ Cn *n / Σ Cn
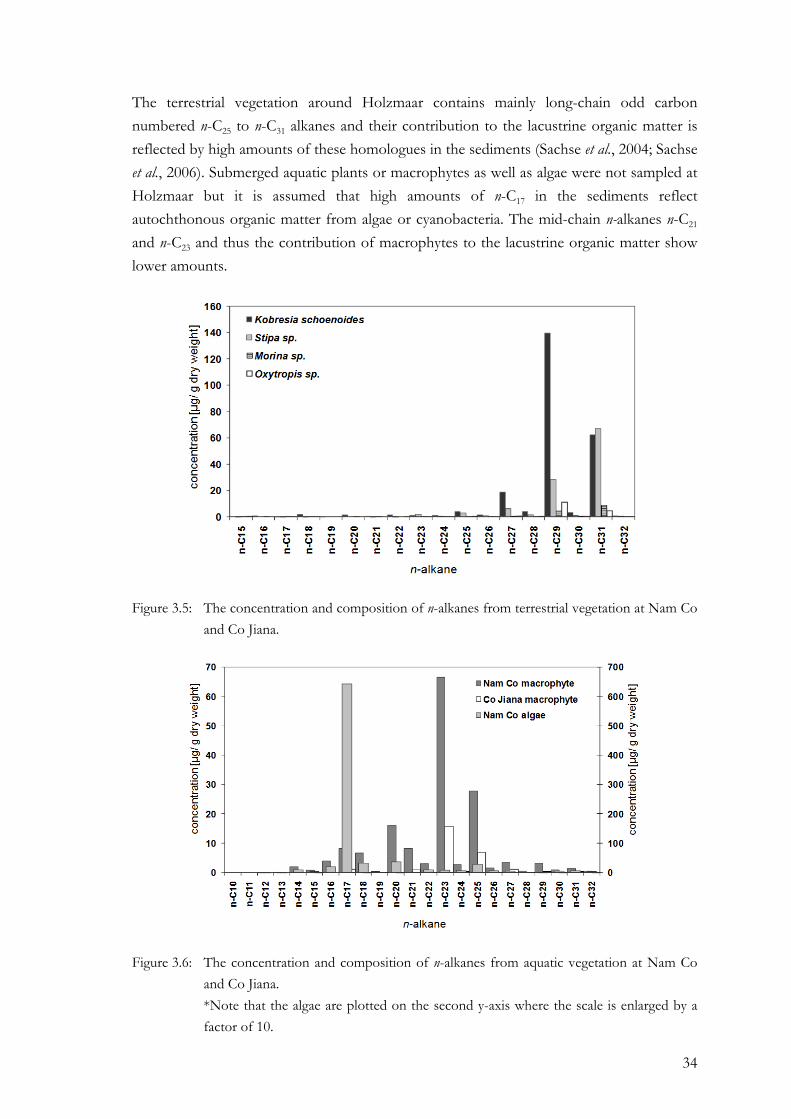
34
The terrestrial vegetation around Holzmaar contains mainly long-chain odd carbon numbered n-C25 to n-C31 alkanes and their contribution to the lacustrine organic matter is reflected by high amounts of these homologues in the sediments (Sachse et al., 2004; Sachse et al., 2006). Submerged aquatic plants or macrophytes as well as algae were not sampled at Holzmaar but it is assumed that high amounts of n-C17 in the sediments reflect autochthonous organic matter from algae or cyanobacteria. The mid-chain n-alkanes n-C21 and n-C23 and thus the contribution of macrophytes to the lacustrine organic matter show lower amounts.
Figure 3.5: The concentration and composition of n-alkanes from terrestrial vegetation at Nam Co and Co Jiana.
Figure 3.6: The concentration and composition of n-alkanes from aquatic vegetation at Nam Co and Co Jiana. *Note that the algae are plotted on the second y-axis where the scale is enlarged by a factor of 10.
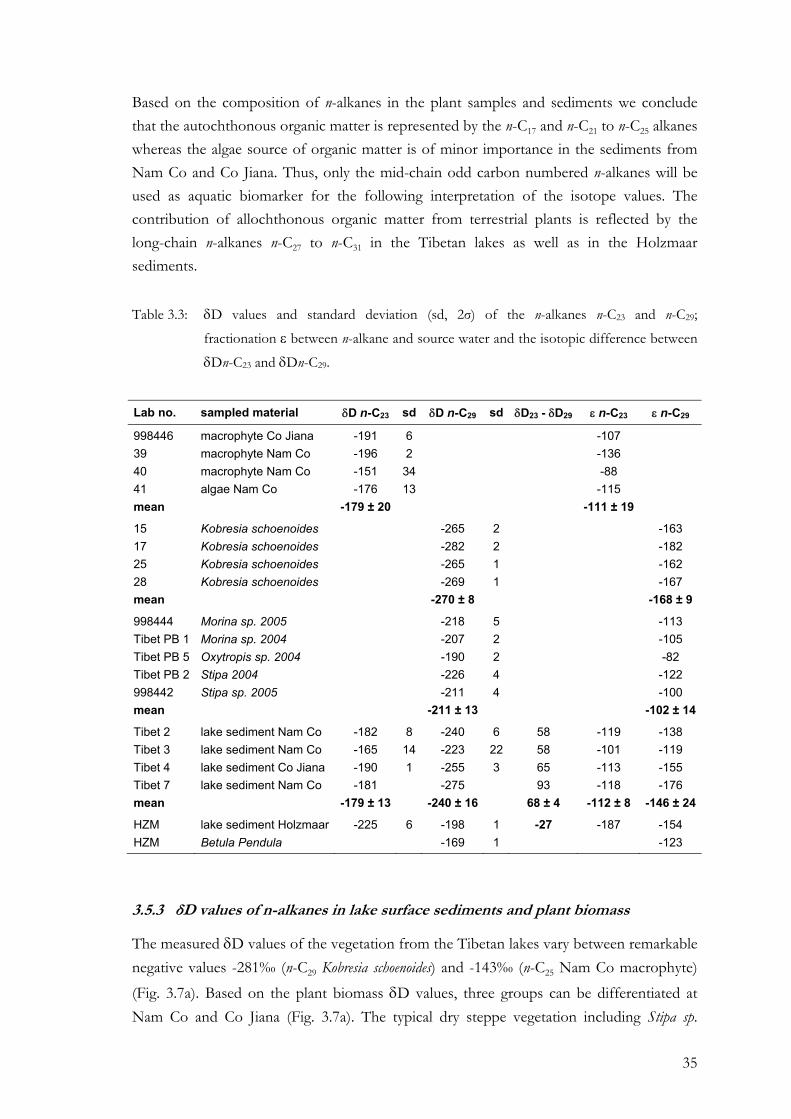
35
Based on the composition of n-alkanes in the plant samples and sediments we conclude that the autochthonous organic matter is represented by the n-C17 and n-C21 to n-C25 alkanes whereas the algae source of organic matter is of minor importance in the sediments from Nam Co and Co Jiana. Thus, only the mid-chain odd carbon numbered n-alkanes will be used as aquatic biomarker for the following interpretation of the isotope values. The contribution of allochthonous organic matter from terrestrial plants is reflected by the long-chain n-alkanes n-C27 to n-C31 in the Tibetan lakes as well as in the Holzmaar sediments.
Table 3.3: δD values and standard deviation (sd, 2σ) of the n-alkanes n-C23 and n-C29;
fractionation ε between n-alkane and source water and the isotopic difference between
δDn-C23 and δDn-C29.
Lab no. sampled material δD n-C23 sd δD n-C29 sd δD23 - δD29 ε n-C23 ε n-C29
998446 macrophyte Co Jiana -191 6 -107 39 macrophyte Nam Co -196 2 -136 40 macrophyte Nam Co -151 34 -88 41 algae Nam Co -176 13 -115 mean -179 ± 20 -111 ± 19
15 Kobresia schoenoides -265 2 -163 17 Kobresia schoenoides -282 2 -182 25 Kobresia schoenoides -265 1 -162 28 Kobresia schoenoides -269 1 -167 mean -270 ± 8 -168 ± 9
998444 Morina sp. 2005 -218 5 -113 Tibet PB 1 Morina sp. 2004 -207 2 -105 Tibet PB 5 Oxytropis sp. 2004 -190 2 -82 Tibet PB 2 Stipa 2004 -226 4 -122 998442 Stipa sp. 2005 -211 4 -100 mean -211 ± 13 -102 ± 14
Tibet 2 lake sediment Nam Co -182 8 -240 6 58 -119 -138 Tibet 3 lake sediment Nam Co -165 14 -223 22 58 -101 -119 Tibet 4 lake sediment Co Jiana -190 1 -255 3 65 -113 -155 Tibet 7 lake sediment Nam Co -181 -275 93 -118 -176 mean -179 ± 13 -240 ± 16 68 ± 4 -112 ± 8 -146 ± 24
HZM lake sediment Holzmaar -225 6 -198 1 -27 -187 -154 HZM Betula Pendula -169 1 -123
3.5.3 δD values of n-alkanes in lake surface sediments and plant biomass
The measured δD values of the vegetation from the Tibetan lakes vary between remarkable negative values -281‰ (n-C29 Kobresia schoenoides) and -143‰ (n-C25 Nam Co macrophyte) (Fig. 3.7a). Based on the plant biomass δD values, three groups can be differentiated at Nam Co and Co Jiana (Fig. 3.7a). The typical dry steppe vegetation including Stipa sp.
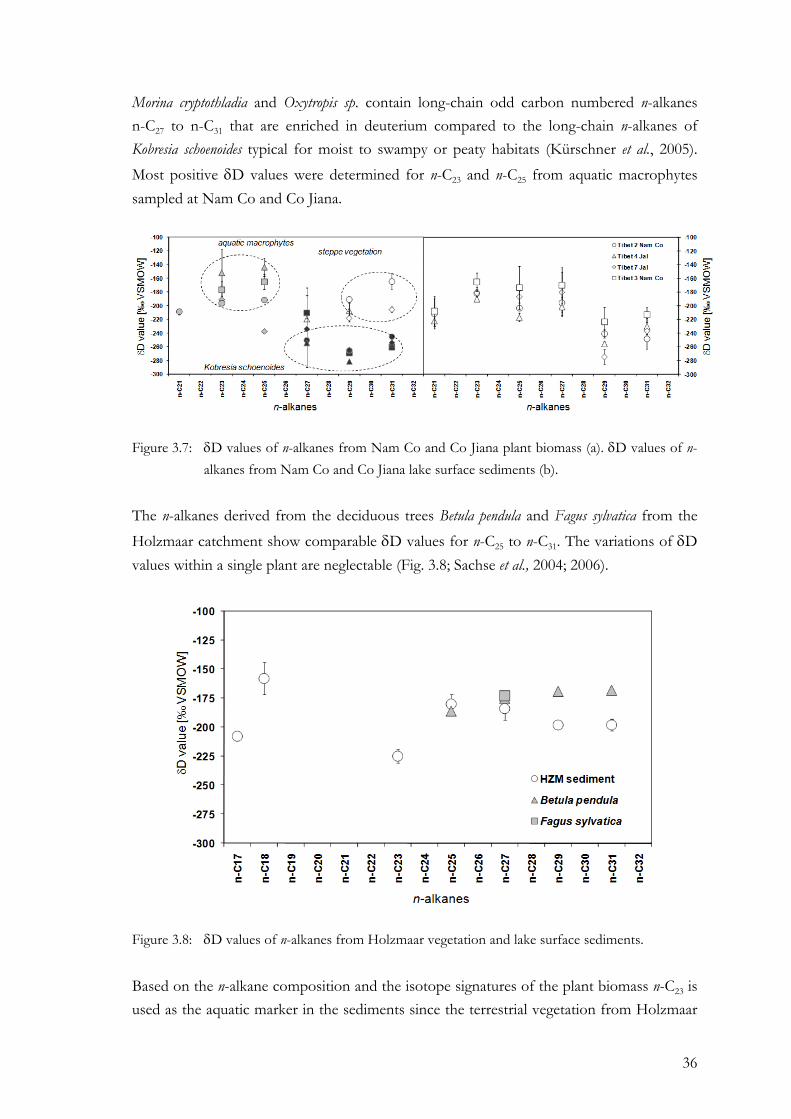
36
Morina cryptothladia and Oxytropis sp. contain long-chain odd carbon numbered n-alkanes n-C27 to n-C31 that are enriched in deuterium compared to the long-chain n-alkanes of Kobresia schoenoides typical for moist to swampy or peaty habitats (Kürschner et al., 2005). Most positive δD values were determined for n-C23 and n-C25 from aquatic macrophytes sampled at Nam Co and Co Jiana.
Figure 3.7: δD values of n-alkanes from Nam Co and Co Jiana plant biomass (a). δD values of n-alkanes from Nam Co and Co Jiana lake surface sediments (b).
The n-alkanes derived from the deciduous trees Betula pendula and Fagus sylvatica from the Holzmaar catchment show comparable δD values for n-C25 to n-C31. The variations of δD values within a single plant are neglectable (Fig. 3.8; Sachse et al., 2004; 2006).
Figure 3.8: δD values of n-alkanes from Holzmaar vegetation and lake surface sediments.
Based on the n-alkane composition and the isotope signatures of the plant biomass n-C23 is used as the aquatic marker in the sediments since the terrestrial vegetation from Holzmaar
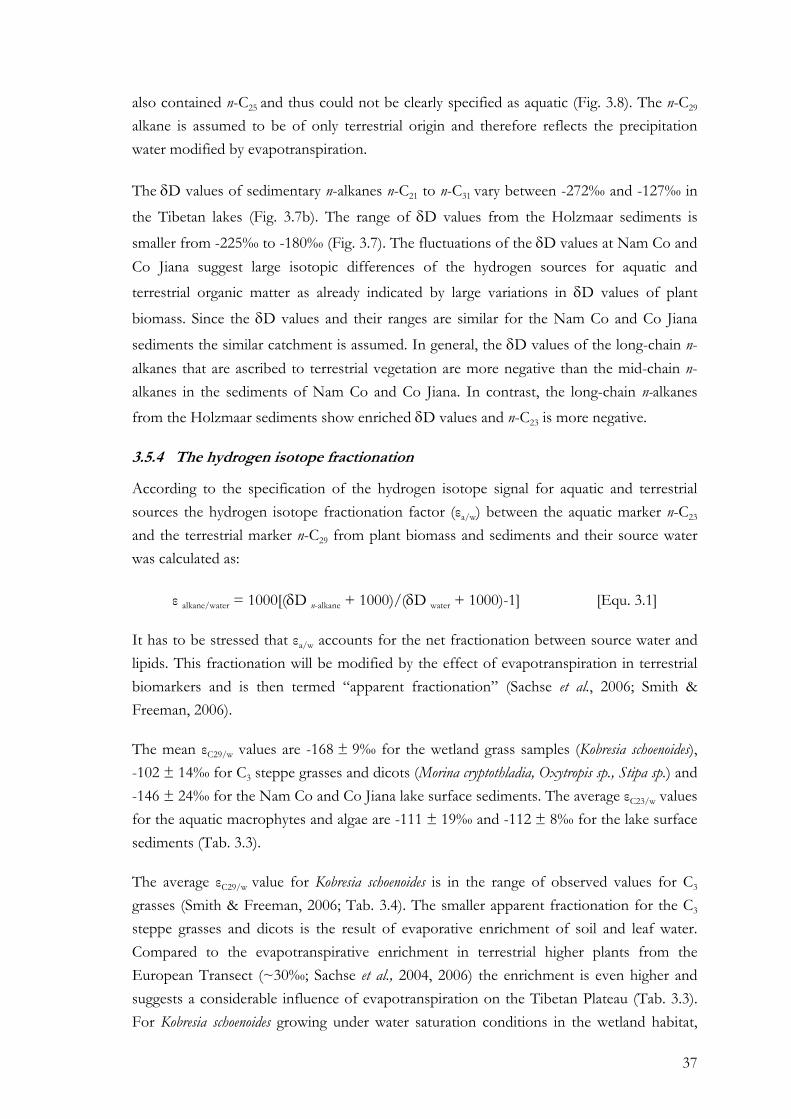
37
also contained n-C25 and thus could not be clearly specified as aquatic (Fig. 3.8). The n-C29 alkane is assumed to be of only terrestrial origin and therefore reflects the precipitation water modified by evapotranspiration.
The δD values of sedimentary n-alkanes n-C21 to n-C31 vary between -272‰ and -127‰ in
the Tibetan lakes (Fig. 3.7b). The range of δD values from the Holzmaar sediments is
smaller from -225‰ to -180‰ (Fig. 3.7). The fluctuations of the δD values at Nam Co and Co Jiana suggest large isotopic differences of the hydrogen sources for aquatic and terrestrial organic matter as already indicated by large variations in δD values of plant
biomass. Since the δD values and their ranges are similar for the Nam Co and Co Jiana
sediments the similar catchment is assumed. In general, the δD values of the long-chain n-alkanes that are ascribed to terrestrial vegetation are more negative than the mid-chain n-alkanes in the sediments of Nam Co and Co Jiana. In contrast, the long-chain n-alkanes from the Holzmaar sediments show enriched δD values and n-C23 is more negative.
3.5.4 The hydrogen isotope fractionation
According to the specification of the hydrogen isotope signal for aquatic and terrestrial sources the hydrogen isotope fractionation factor (εa/w) between the aquatic marker n-C23 and the terrestrial marker n-C29 from plant biomass and sediments and their source water was calculated as:
ε alkane/water = 1000[(δD n-alkane + 1000)/(δD water + 1000)-1] [Equ. 3.1]
It has to be stressed that εa/w accounts for the net fractionation between source water and lipids. This fractionation will be modified by the effect of evapotranspiration in terrestrial biomarkers and is then termed “apparent fractionation” (Sachse et al., 2006; Smith & Freeman, 2006).
The mean εC29/w values are -168 ± 9‰ for the wetland grass samples (Kobresia schoenoides), -102 ± 14‰ for C3 steppe grasses and dicots (Morina cryptothladia, Oxytropis sp., Stipa sp.) and -146 ± 24‰ for the Nam Co and Co Jiana lake surface sediments. The average εC23/w values for the aquatic macrophytes and algae are -111 ± 19‰ and -112 ± 8‰ for the lake surface sediments (Tab. 3.3).
The average εC29/w value for Kobresia schoenoides is in the range of observed values for C3 grasses (Smith & Freeman, 2006; Tab. 3.4). The smaller apparent fractionation for the C3 steppe grasses and dicots is the result of evaporative enrichment of soil and leaf water. Compared to the evapotranspirative enrichment in terrestrial higher plants from the European Transect (~30‰; Sachse et al., 2004, 2006) the enrichment is even higher and suggests a considerable influence of evapotranspiration on the Tibetan Plateau (Tab. 3.3). For Kobresia schoenoides growing under water saturation conditions in the wetland habitat,
38
evapotranspiration is assumed to be neglectable. Thus, εC29/w values potentially represent the biosynthetic fractionation which is in the range of observed values (-160‰) for grasses (Spartina alterniflora) growing submerged under unlimited supply of water (Sessions, 2006). The intermediate εC29/w values determined for the sedimentary n-alkanes indicate that their δD values represent the mixed isotope signal from both sources of terrestrial vegetation. The similarity of εC23/w values for the surface sediments and the aquatic macrophytes at both lakes, Nam Co and Co Jiana suggests that the n-C23 alkane in the sediments reflect the hydrogen isotope signal of these aquatic plants. In contrast to the εC23/w and εC29/w values from the Holzmaar sediments, the fractionation between lacustrine aquatic n-alkanes and lake water is smaller than the εC29/w values at Nam Co and Co Jiana. At the Holzmaar site the apparent isotope fractionation for deciduous tree biomarkers relative to precipitation shows the expected enriched values compared to the biosynthetic fractionation for aquatic organisms due to evapotranspirative enrichment of soil and leaf water. At Nam Co and Co Jiana the sedimentary εC23/w values as well as εC23/w for the aquatic macrophytes are smaller compared to εC29/w between terrestrial vegetation and source water.
Yet, the understanding of the physiological and biosynthetic mechanisms through the incorporation of hydrogen during n-alkane biosynthesis is incomplete and large variations in fractionation factors are observed for a variety of plant material in different environmental settings indicating that there is no fixed isotopic fractionation between terrestrial or aquatic plants and their source water (Tab. 3.4). Nevertheless, there is agreement that the vegetation type or leaf morphology as well as biological variables such as the photosynthetic pathway or changes in the isotopic composition of biosynthetic feedstocks play an important role in determining the degree of enrichment besides environmental parameter such as evaporation in association to relative humidity (Chikaraishi and Naraoka, 2003; Hayes, 2001; Hou et al., 2007b; Sachse et al., 2006; Sessions, 2006; Smith and Freeman, 2006a). We therefore suggest that the observed εC23/w and εC29/w values at the Tibetan lake sites can be considered as fixed for the corresponding vegetation group in this particular ecosystem although the similarity of εC23/w and εC29/w for the dry steppe vegetation is yet not entirely understood.
In addition to the variations in εC23/w and εC29/w values, we observed a clear isotopic difference between the δD values of terrestrial (n-C29) and aquatic (n-C23) lacustrine n-alkanes at both lake sites Holzmaar and the Tibetan lakes strengthening our argument of different biological sources for these components (Fig. 3.9). Similar to the isotope fractionation factors the isotopic difference between those classes of compounds shows opposite directions at both lake systems. Whereas the δD values from terrestrial n-alkanes
are enriched in deuterium by about 30‰ in the Holzmaar sediments compared to δD values from aquatic sources, n-C29 is depleted in deuterium in the Tibetan lake sediments and a deuterium enrichment of about 60‰ is observed for n-C23. Taking into account the
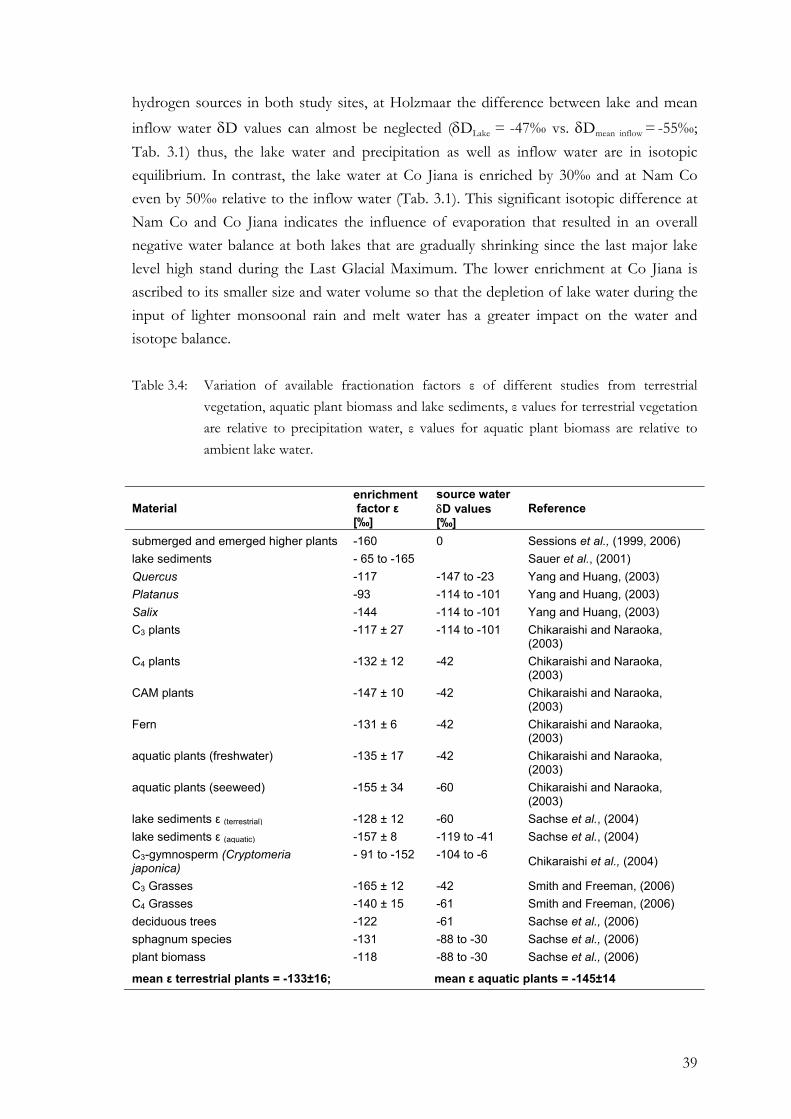
39
hydrogen sources in both study sites, at Holzmaar the difference between lake and mean inflow water δD values can almost be neglected (δDLake = -47‰ vs. δDmean inflow = -55‰; Tab. 3.1) thus, the lake water and precipitation as well as inflow water are in isotopic equilibrium. In contrast, the lake water at Co Jiana is enriched by 30‰ and at Nam Co even by 50‰ relative to the inflow water (Tab. 3.1). This significant isotopic difference at Nam Co and Co Jiana indicates the influence of evaporation that resulted in an overall negative water balance at both lakes that are gradually shrinking since the last major lake level high stand during the Last Glacial Maximum. The lower enrichment at Co Jiana is ascribed to its smaller size and water volume so that the depletion of lake water during the input of lighter monsoonal rain and melt water has a greater impact on the water and isotope balance.
Table 3.4: Variation of available fractionation factors ε of different studies from terrestrial vegetation, aquatic plant biomass and lake sediments, ε values for terrestrial vegetation are relative to precipitation water, ε values for aquatic plant biomass are relative to ambient lake water.
Material enrichment factor ε [‰]
source water δD values [‰]
Reference
submerged and emerged higher plants -160 0 Sessions et al., (1999, 2006) lake sediments - 65 to -165 Sauer et al., (2001) Quercus -117 -147 to -23 Yang and Huang, (2003) Platanus -93 -114 to -101 Yang and Huang, (2003) Salix -144 -114 to -101 Yang and Huang, (2003) C3 plants -117 ± 27 -114 to -101 Chikaraishi and Naraoka,
(2003) C4 plants -132 ± 12 -42 Chikaraishi and Naraoka,
(2003) CAM plants -147 ± 10 -42 Chikaraishi and Naraoka,
(2003) Fern -131 ± 6 -42 Chikaraishi and Naraoka,
(2003) aquatic plants (freshwater) -135 ± 17 -42 Chikaraishi and Naraoka,
(2003) aquatic plants (seeweed) -155 ± 34 -60 Chikaraishi and Naraoka,
(2003) lake sediments ε (terrestrial) -128 ± 12 -60 Sachse et al., (2004) lake sediments ε (aquatic) -157 ± 8 -119 to -41 Sachse et al., (2004) C3-gymnosperm (Cryptomeria japonica)
- 91 to -152 -104 to -6 Chikaraishi et al., (2004)
C3 Grasses -165 ± 12 -42 Smith and Freeman, (2006) Smith and Freeman, (2006) C4 Grasses -140 ± 15 -61
deciduous trees -122 -61 Sachse et al., (2006) sphagnum species -131 -88 to -30 Sachse et al., (2006) plant biomass -118 -88 to -30 Sachse et al., (2006)
mean ε terrestrial plants = -133±16; mean ε aquatic plants = -145±14
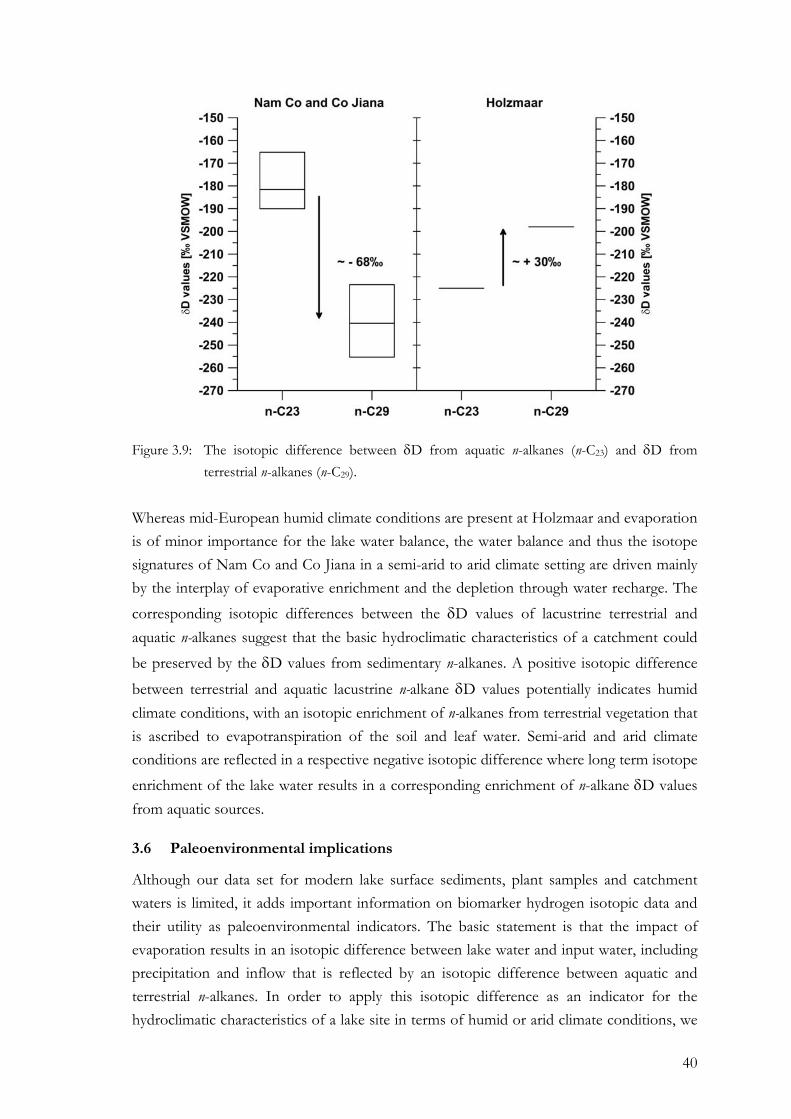
40
Figure 3.9: The isotopic difference between δD from aquatic n-alkanes (n-C23) and δD from terrestrial n-alkanes (n-C29).
Whereas mid-European humid climate conditions are present at Holzmaar and evaporation is of minor importance for the lake water balance, the water balance and thus the isotope signatures of Nam Co and Co Jiana in a semi-arid to arid climate setting are driven mainly by the interplay of evaporative enrichment and the depletion through water recharge. The corresponding isotopic differences between the δD values of lacustrine terrestrial and aquatic n-alkanes suggest that the basic hydroclimatic characteristics of a catchment could be preserved by the δD values from sedimentary n-alkanes. A positive isotopic difference
between terrestrial and aquatic lacustrine n-alkane δD values potentially indicates humid climate conditions, with an isotopic enrichment of n-alkanes from terrestrial vegetation that is ascribed to evapotranspiration of the soil and leaf water. Semi-arid and arid climate conditions are reflected in a respective negative isotopic difference where long term isotope enrichment of the lake water results in a corresponding enrichment of n-alkane δD values from aquatic sources.
3.6 Paleoenvironmental implications
Although our data set for modern lake surface sediments, plant samples and catchment waters is limited, it adds important information on biomarker hydrogen isotopic data and their utility as paleoenvironmental indicators. The basic statement is that the impact of evaporation results in an isotopic difference between lake water and input water, including precipitation and inflow that is reflected by an isotopic difference between aquatic and terrestrial n-alkanes. In order to apply this isotopic difference as an indicator for the hydroclimatic characteristics of a lake site in terms of humid or arid climate conditions, we
41
used a primary model to estimate evaporation to inflow ratios (E/I). It is assumed that semi-arid or arid climate conditions are characterized by evaporation amounts that exceed the amount of input including inflow streams and precipitation potentially leading to a negative lake water balance (E/I > 1) and thus to a long term deuterium enrichment of the lake water relative to the input water. Under humid climate conditions the input exceeds evaporation and results in a positive lake water balance (E/I < 1). In order to estimate evaporation to inflow ratios we used a stable isotope approach as given:
E/I = (1-h)/h * δDl – δDi/δD° - δDl (Gat and Levy, 1978) [Equ. 3.2]
with h as relative humidity, δD as the isotope values for the lake (l) and inflow water (i),
respectively and δD° as the limiting isotopic composition for a desiccating water body without inflow (Craig and Gordon, 1965). Applied equations and the input parameter that were inserted into equation 3.2 are given in Table 3.5.
Initially, the dataset of the measured isotopic signatures of the catchment waters were used to assess the actual evaporation to inflow ratio for Nam Co and Holzmaar (Tab. 3.5). Mean annual lake surface temperatures are ~8°C at Nam Co (Xu et al., 2006b) and ~12°C at Holzmaar (Moschen et al., 2006). Since data on the isotopic composition of the free atmosphere water vapour over the lakes surfaces (δDA) were not available, δDA was
estimated based on the mean isotopic composition of local precipitation and εV/L as the equilibrium fractionation factor between water vapour (v) and liquid (l) (Craig and Gordon, 1965; Tab. 3.5).
The E/I ratio of 0.07 at Holzmaar suggests that only about 7% of the water flowing into the lake undergoes evaporation approving the positive water balance at Holzmaar and the minor impact of evaporation on the lake water. At Nam Co about 75% of the water flowing into the lake undergoes evaporation. This implies that although evaporation has a significant influence leading to the enrichment of the lake water relative to the inflow, the water balance is positive at present which is consistent with observations at the Nam Co meteorological station during the last two years (You et al., 2006).
Since the systematics during the incorporation of the hydrogen isotope signal during n-alkane biosynthesis are yet not entirely understood and fractionation factors are rather site and species specific than constant we intended to apply the isotopic difference between terrestrial and aquatic n-alkane δD values as well as the sedimentary δD values from Nam Co and Holzmaar as input data. Given that the E/I ratio is based on relative isotope differences and assuming an ecosystem specific apparent fractionation for each lake site that was constant during the past, the sedimentary δD values are supposed to represent the relative changes of their corresponding hydrogen sources.
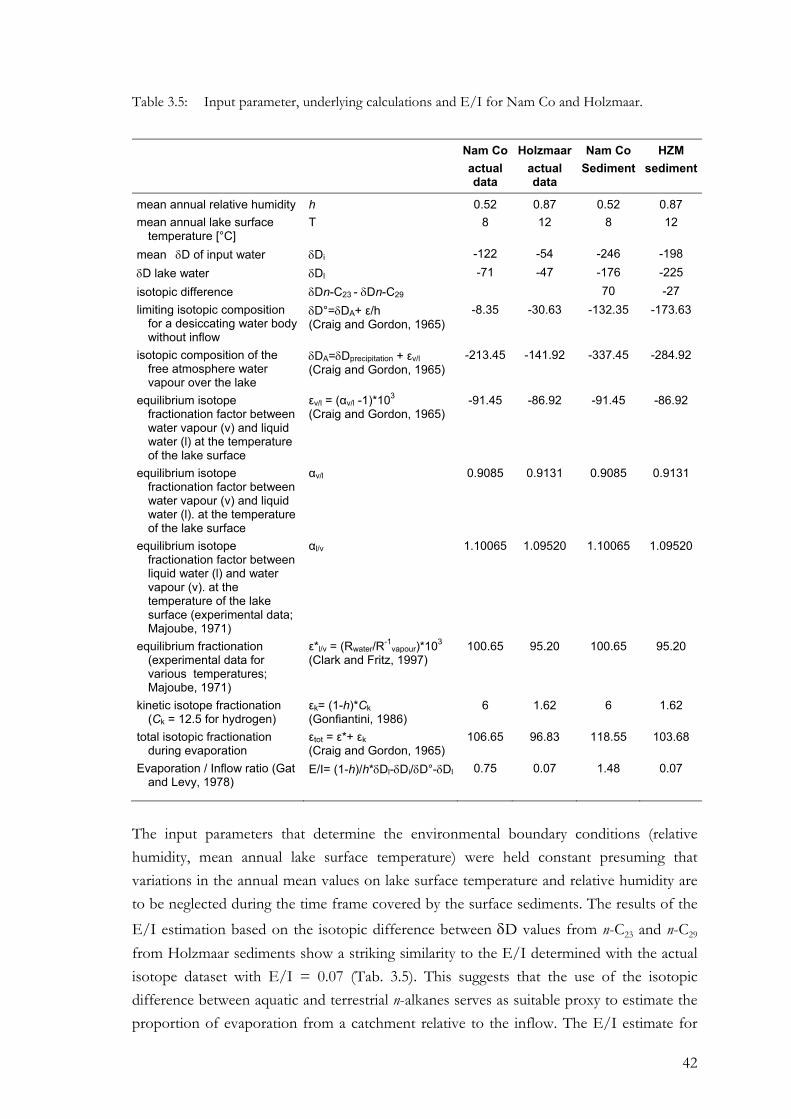
42
Table 3.5: Input parameter, underlying calculations and E/I for Nam Co and Holzmaar.
Nam Coactual data
Holzmaar actual data
Nam Co Sediment
HZM sediment
mean annual relative humidity h 0.52 0.87 0.52 0.87 mean annual lake surface
temperature [°C] T 8 12 8 12
mean�δD of input water δDi -122 -54 -246 -198 δD lake water δDl -71 -47 -176 -225 isotopic difference δDn-C23 - δDn-C29 70 -27 limiting isotopic composition
for a desiccating water body without inflow
δD°=δDA+ ε/h (Craig and Gordon, 1965)
-8.35 -30.63 -132.35 -173.63
isotopic composition of the free atmosphere water vapour over the lake
δDA=δDprecipitation + εv/l (Craig and Gordon, 1965)
-213.45 -141.92 -337.45 -284.92
equilibrium isotope fractionation factor between water vapour (v) and liquid water (l) at the temperature of the lake surface
εv/l = (αv/l -1)*103
(Craig and Gordon, 1965) -91.45 -86.92 -91.45 -86.92
equilibrium isotope fractionation factor between water vapour (v) and liquid water (l). at the temperature of the lake surface
αv/l 0.9085 0.9131 0.9085 0.9131
equilibrium isotope fractionation factor between liquid water (l) and water vapour (v). at the temperature of the lake surface (experimental data; Majoube, 1971)
αl/v 1.10065 1.09520 1.10065 1.09520
equilibrium fractionation (experimental data for various temperatures; Majoube, 1971)
ε*l/v = (Rwater/R-1vapour)*103
(Clark and Fritz, 1997) 100.65 95.20 100.65 95.20
kinetic isotope fractionation (Ck = 12.5 for hydrogen)
εk= (1-h)*Ck (Gonfiantini, 1986)
6 1.62 6 1.62
total isotopic fractionation during evaporation
εtot = ε*+ εk (Craig and Gordon, 1965)
106.65 96.83 118.55 103.68
Evaporation / Inflow ratio (Gat and Levy, 1978)
E/I= (1-h)/h*δDl-δDi/δD°-δDl 0.75 0.07 1.48 0.07
The input parameters that determine the environmental boundary conditions (relative humidity, mean annual lake surface temperature) were held constant presuming that variations in the annual mean values on lake surface temperature and relative humidity are to be neglected during the time frame covered by the surface sediments. The results of the E/I estimation based on the isotopic difference between δD values from n-C23 and n-C29 from Holzmaar sediments show a striking similarity to the E/I determined with the actual isotope dataset with E/I = 0.07 (Tab. 3.5). This suggests that the use of the isotopic difference between aquatic and terrestrial n-alkanes serves as suitable proxy to estimate the proportion of evaporation from a catchment relative to the inflow. The E/I estimate for
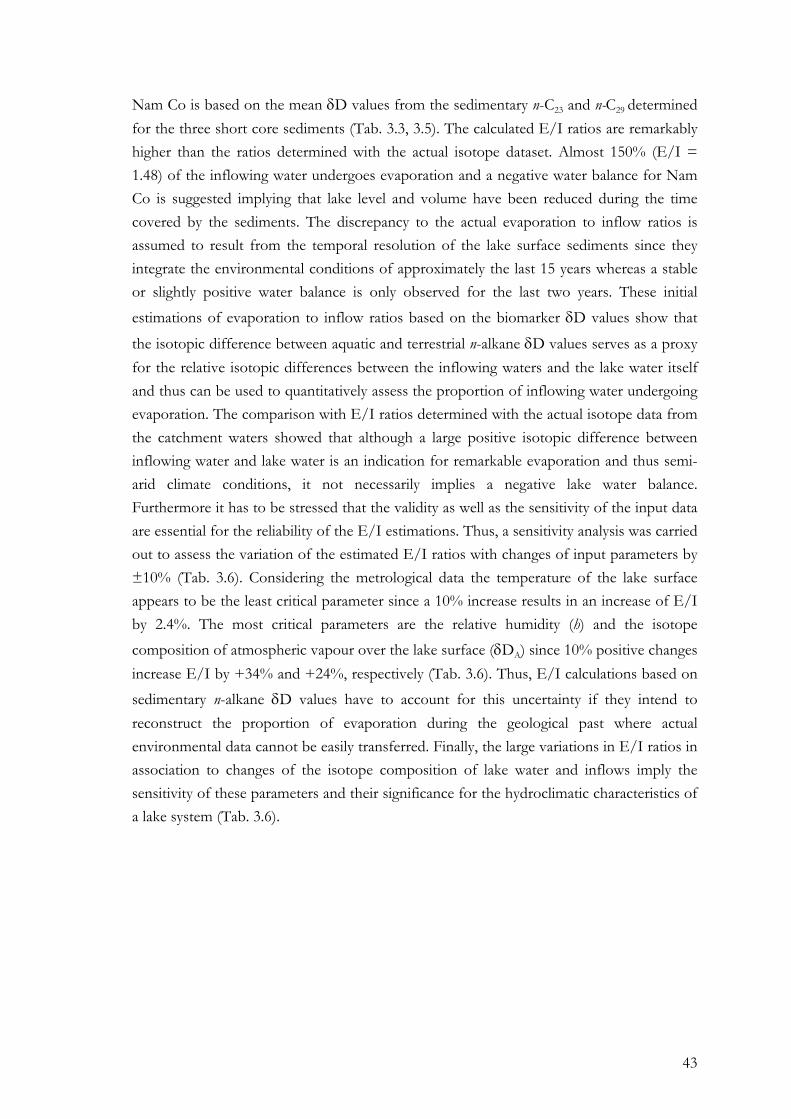
43
Nam Co is based on the mean δD values from the sedimentary n-C23 and n-C29 determined for the three short core sediments (Tab. 3.3, 3.5). The calculated E/I ratios are remarkably higher than the ratios determined with the actual isotope dataset. Almost 150% (E/I = 1.48) of the inflowing water undergoes evaporation and a negative water balance for Nam Co is suggested implying that lake level and volume have been reduced during the time covered by the sediments. The discrepancy to the actual evaporation to inflow ratios is assumed to result from the temporal resolution of the lake surface sediments since they integrate the environmental conditions of approximately the last 15 years whereas a stable or slightly positive water balance is only observed for the last two years. These initial estimations of evaporation to inflow ratios based on the biomarker δD values show that
the isotopic difference between aquatic and terrestrial n-alkane δD values serves as a proxy for the relative isotopic differences between the inflowing waters and the lake water itself and thus can be used to quantitatively assess the proportion of inflowing water undergoing evaporation. The comparison with E/I ratios determined with the actual isotope data from the catchment waters showed that although a large positive isotopic difference between inflowing water and lake water is an indication for remarkable evaporation and thus semi-arid climate conditions, it not necessarily implies a negative lake water balance. Furthermore it has to be stressed that the validity as well as the sensitivity of the input data are essential for the reliability of the E/I estimations. Thus, a sensitivity analysis was carried out to assess the variation of the estimated E/I ratios with changes of input parameters by ±10% (Tab. 3.6). Considering the metrological data the temperature of the lake surface appears to be the least critical parameter since a 10% increase results in an increase of E/I by 2.4%. The most critical parameters are the relative humidity (h) and the isotope composition of atmospheric vapour over the lake surface (δDA) since 10% positive changes increase E/I by +34% and +24%, respectively (Tab. 3.6). Thus, E/I calculations based on sedimentary n-alkane δD values have to account for this uncertainty if they intend to reconstruct the proportion of evaporation during the geological past where actual environmental data cannot be easily transferred. Finally, the large variations in E/I ratios in association to changes of the isotope composition of lake water and inflows imply the sensitivity of these parameters and their significance for the hydroclimatic characteristics of a lake system (Tab. 3.6).
44
Table 3.6: Percentage changes of E/I ratio of Nam Co for a change input parameters based on the actual dataset by ±10%.
Parameter Percentage change
h +34/-15 T +2.5/-2.4
δDA +24/-16 δDi +50/37 δDl +28/-22
3.7 Conclusions
This investigation of the deuterium content of sedimentary n-alkanes and plant biomass from two contrasting ecosystems, the arid Nam Co catchment and the humid Holzmaar provides novel insights into the general understanding of the ability of biomarker δD
values to record source water δD values.
The explanation of the different fractionation factors in the two different study areas is yet unclear. In order to use n-alkane hydrogen isotopes from plant biomass as a paleoclimate proxy, further information are needed as the apparent fractionation between terrestrial plants and precipitation is controlled by several plant specific parameters like growth form, photosynthetic pathway and water use strategy, as well as localised site-specific physical conditions such as precipitation, soil moisture or relative humidity.
Here, we suggest using the isotopic difference between n-alkanes from terrestrial and aquatic plants as an indicator for humid and arid climate conditions. After Sachse et al. (2006), an identical water source for terrestrial plants surrounding a lake and aquatic organisms allows the use of the isotopic difference between both as a proxy for terrestrial leaf water deuterium enrichment. This relationship was established for mid-European humid climate conditions where the evaporation of lake water is less important, because the precipitation amount exceeds the amount of evaporation. Consistent with other lake systems along the European Transect, this enrichment between terrestrial and aquatic n-alkanes is approximately 30‰ on average. Considering the Tibetan lakes, the isotope signals of water sources for terrestrial and aquatic plant biomass are significantly different. The lake water is strongly enriched in deuterium relative to the input water pointing to exceptional evaporation rates. They are also responsible for a 30‰ higher evapotranspirative enrichment of deuterium in the steppe vegetation relative to the plants from the European Transect. Since the lake surrounding vegetation consists of steppe grasses and dicots that are highly influenced by evapotranspiration as well as wetland vegetation that grows under water saturation conditions and thus is assumed not to be influenced by evapotranspiration the sedimentary terrestrial n-alkanes integrates both
45
isotope signals. Consequently, the long term evaporative enrichment of the lake water is recorded mainly by the aquatic n-alkanes whereas the isotopic composition of precipitation is reflected by the terrestrial n-alkanes. This results in an isotopic difference between both and indicates the general hydroclimatic characteristics of a lake system. Evaporation to inflow ratio estimations based on the isotopic difference between aquatic and terrestrial n-alkanes showed that
[1] this isotopic difference serves to identify the influence of evaporation and thus to differentiate qualitatively between humid and arid climate conditions.
In addition, the comparison of these E/I estimations with E/I ratios calculated with actual catchment water isotope data gives indication that
[2] the proportion of water that undergoes evaporation relative to the inflowing water can be quantitatively assessed giving the possibility to reconstruct lake water balances in the past.
46
4 Comparison between leaf wax δD values and benthic ostracode δ18O values from two European lakes during the Younger Dryas – Evidence for a time lag between aquatic and terrestrial signal
Chapter 4
Comparison between leaf wax δD values
and benthic ostracode δ18O values from two European lakes
during the Younger Dryas – Evidence for a time lag between
aquatic and terrestrial signal
Chapter source: Mügler et al., 2008. Comparison between leaf wax δD values and benthic
ostracode δ18O values from two European lakes during the Younger Dryas – Evidence for a time lag between aquatic and terrestrial signal. Geochimica et Cosmochimica Acta. (submitted)
Abstract
We present records of n-alkane δD values (nC27 - nC31) from two lakes, Ammersee in southern Germany and Lac d’Annecy in the French Alps, spanning the time period from the Allerød to the Preboreal (~13.5 ka to ~11 ka BP). We compare the biomarker hydrogen isotope signatures with previously published oxygen-isotope ratios of precipitation inferred from deep-lake ostracods at both lake sites. A prerequisite for the comparison of these paleoclimate records from different proxy sources is an equal timing of their production and deposition within the lacustrine record. Our results show, that the isotope signal of precipitation preserved by the lacustrine n-alkanes lags behind the ostracode oxygen18 isotope record by between ~ 200 and ~ 100 years at both studied sites. We hypothesize that this temporal offset is due to different transport mechanisms of the terrestrial material into the lake rather than a longer response time of terrestrial vegetation. Clearly, these findings need to be considered for the interpretation of paleoclimate records from terrestrial biomarker profiles, especially those from depositional regimes where the catchment was likely large. Taking into consideration the delayed terrestrial climate signal, the n-alkane δD values contemporaneously record the remarkable climate shift at the onset
47
of the Younger Dryas (YD) where δD values decreased by ~ 30‰ and 20‰ at Ammersee and Lac d’Annecy, respectively. The known decrease in mean air temperatures of about 5-6°C explains only about 50% of the variation in the deuterium content. The residual signal combines the influence of evapotranspiration and changes in vegetation composition. In addition, the so-called mid-Younger Dryas event that is recorded as a short term positive excursion of oxygen isotopes at Ammersee as well as in the Greenland ice cores is reflected in our deuterium records at both study sites and hence, is recognized at Lac d’Annecy for the first time. The second order climate parameter d-excess indicates substantial changes in moisture source areas during the YD alternating between moisture from the Atlantic in contrast to that from the European continent. High d-excess for the mid-YD event points to continental moisture. This calls into question the mechanisms that caused this event since previously changes in North Atlantic circulation are presumed. In addition, the absence of a clear signal of the mid-YD event from the d-excess implies the amplification of the response in n-alkane δD values due to additional processes acting locally on the site of atmospheric moisture condensation.
Keywords: terrestrial residence time, deuterium, paleoclimate, fractionation, biomarker
4.1 Introduction
Lacustrine sediments are promising climatic archives, capable of recording continuous documentation of environmental change. Organic compounds of a known biological origin preserved in lake deposits, so-called biomarkers, can provide information on regional and local climate and vegetation change. Long-chain n-alkanes with an odd carbon number predominance (nC25 - nC33) are abundant components of vascular plant epicuticular waxes preventing physical damage and water loss (Eglinton and Hamilton, 1967). Terrestrial photosynthetic plants use meteoric water as their unique hydrogen source to synthesize n-alkanes, and it has been shown that the isotopic composition of precipitation is preserved in those biomarkers (Sachse et al., 2004). Consequently, parameters driving the isotopic composition of precipitation, such as water vapour source area, the amount of precipitation, air temperature and relative humidity can be reconstructed from biomarker δD values (Craig, 1961; Dansgaard, 1964; Gat, 1996). The hydrogen isotope composition
of leaf wax n-alkanes parallels the meteoric water δD values with an observed isotopic difference that is caused by a biosynthetic fractionation during n-alkane biosynthesis and an additional enrichment in deuterium of leaf water due to transpiration and evaporation of soil and leaf water (Sachse et al., 2006; Smith & Freeman, 2006). The resulting net difference between n-alkane and source water δD values has been termed ‘apparent fractionation’, as it integrates these processes. Furthermore, amongst biomarkers, n-alkanes are stable towards secondary structural and isotopic modification since all hydrogen is carbon-bound and non-exchangeable at temperatures up to 150°C (Schimmelmann et al.,
48
1999) and so are well suited and applied for palaeoclimatic reconstructions (Pagani et al., 2006; Sachse et al., 2004; Schefuss et al., 2005; Shuman et al., 2006).
Calcareous shells of benthic organisms that represent exclusively autochthonous carbonate are also preserved in lacustrine sediments and are well known to record the isotopic composition of the lake water (Danis et al., 2003; Filippi et al., 1999; Schwalb, 2003; v. Grafenstein et al., 1994). The oxygen isotopic composition of lake water is controlled mainly by the precipitation signal and is additionally influenced by evaporation, runoff and residence times (Leng and Marshall, 2004; Schwalb, 2003). Benthic ostracods are widely used to reconstruct paleotemperatures since the mean annual isotope composition of precipitation and local mean annual air temperatures are positively correlated (Dansgaard, 1964; Rozanski et al., 1982).
Both proxy materials, n-alkanes and benthic ostracodes, potentially provide information on the stable isotope signature of precipitation in the past and hence, a comparison of their climate signals is expected to add complementary paleoclimate information such as on relative humidity or evapotranspiration. Moreover, the availability of d18O and dD of precipitation enables to infer second order climate parameter such as the deuterium excess in precipitation. The deuterium excess (d-excess = δD – 8* δ18O; Dansgaard, 1964) may
provide complementary information to δ18O and δD in precipitation since it is mainly controlled by temperature and relative humidity of the area where the moisture originates from (Merlivat and Jouzel, 1979). Low d-excess in precipitation indicates that the moisture originates from sea surface evaporation at low latitudes. Atmospheric moisture from dry areas leads to high d-excess in precipitation (Merlivat and Jouzel, 1979).
Precondition for comparisons between paleoclimate information from different sources is a virtually equal timing for terrestrial biomarker production and deposition within the lacustrine record implying fast transport and short terrestrial mean residence times. The terrestrial residence time that characterizes the time between the biosynthesis of a molecule and its final deposition within the sedimentary record is controlled by the molecules physiochemical properties such as size, structure, polarity or mineral association and a variety of environmental parameters and catchment characteristics like topography, size, soil type, humidity or temperature (Rapalee et al., 1998; Trumbore, 1993; Trumbore and Harden, 1997). Molecular radiocarbon studies seek to specify the path from the terrestrial biomarker source to its depositional site mainly in marine sediments (Eglinton et al., 1997; Ohkouchi et al., 2003; Ohkouchi et al., 2002). Yet, paleoclimate reconstructions based on lacustrine leaf wax isotopic compositions are based on the assumption of short terrestrial residence times being additionally in the range of temporal resolution of the sample material and further integrating the variations due to seasonal cycles in leaf wax chemical and isotope composition (Huang et al., 2004; Krishnamurthy et al., 1995; Meyers and Lallier-Verges, 1999; Sachse et al., 2006; Shuman et al., 2006).
49
In this study the climate signals from proxy material of different sources, aquatic and terrestrial are evaluated. Hence, we compare oxygen isotope ratios of precipitation that are inferred from deep lake ostracodes from Ammersee, Southern Germany and Lac d’Annecy, French Alps, with hydrogen isotope ratios of lacustrine terrestrial leaf wax n-alkanes in order to assess the extent and the relative timing of paleoclimate information recorded by the different proxies. Both materials are assumed to represent mainly changes in mean annual air temperatures in the study areas since temperature is the main driver of seasonal variations in the stable isotope signature of precipitation which is in turn simply linked to the isotope signature of the lake water (v. Grafenstein et al., 1999). We hypothesize that the terrestrially derived climate signal similarly indicates the temperature-induced changes of stable isotope ratios in precipitation at the end of the last deglaciation at the transition from the Allerød warm period to the Younger Dryas (YD) cooling and the Preboreal warming at the two lake sites (v. Grafenstein et al., 1999). The (YD) is known as the longest and severest cooling event since the last deglaciation most likely to be caused by the shut-down of the Atlantic Conveyor or Merdional Overturning Circulation (AMOC) possibly as response to catastrophic meltwater influx from the Laurentide ice sheet into the North Atlantic Ocean (Broecker et al., 1989; Carlson et al., 2007; Fanning and Weaver, 1997; Manabe and Stouffer, 1997).
4.2 Study area
Lac d’Annecy (45°48’N; 6°8’-14’E) is located in the western part of the French Pre-Alps at an altitude of 446.5 m (Fig. 4.1). It is one of the largest natural lakes in France with a surface area of 25.6 km2. The Lake is oriented north-south, 15 km long, 2-3 km wide and consists of two sub-basins that are separated by a submerged bar: the northern Grand Lac with a maximum water depth of 65 m and the southern Petit Lac with water depths up to 55 m. Water residence times were calculated with approximately 3.8 years (Benedetti-Crouzet, 1972). At present the lake has three main tributaries: the “Eau Morte” in the south and the “Ire” and the “Laudon” to the southwest. The lake has one outflow via the “Thiou” in the northwest corner of Grand Lac. The catchment covers an area of 280 km2 at a mean altitude of about 900 m asl. from 446.5 m up to 2,245 m. Lac d’Annecy was formed during the last deglaciation when it still had a considerably larger drainage basin and surface area. Its present size was the result of major hydroclimatic changes associated with the Late Glacial warming and corresponding glacier retreat in the Annecy basin when melt water flows from the Rhone glacier changed their direction and passed the basin. Further lowering of the lake level is recorded for the Younger Dryas climatic deterioration by ceasing deposition of laminated sediments (Brauer and Casanova, 2001).
The Ammersee (48°N; 11°10’E, 533 m a.s.l.) is located about 50 km southwest of Munich (Fig. 4.1) and is significantly larger and deeper than Lac d’Annecy with a surface area of 46.5 km2 and a water depth of 81 m. The catchment covers an area of 993 km2. The
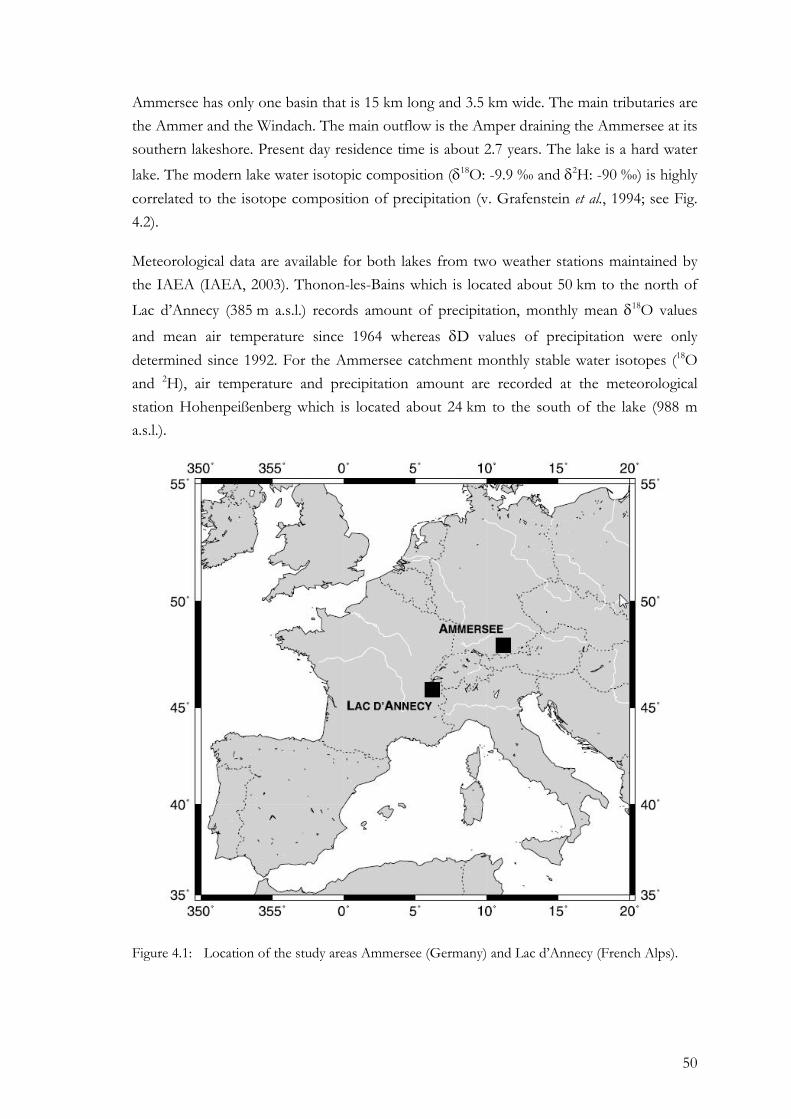
50
Ammersee has only one basin that is 15 km long and 3.5 km wide. The main tributaries are the Ammer and the Windach. The main outflow is the Amper draining the Ammersee at its southern lakeshore. Present day residence time is about 2.7 years. The lake is a hard water lake. The modern lake water isotopic composition (δ18O: -9.9 ‰ and δ2H: -90 ‰) is highly correlated to the isotope composition of precipitation (v. Grafenstein et al., 1994; see Fig. 4.2).
Meteorological data are available for both lakes from two weather stations maintained by the IAEA (IAEA, 2003). Thonon-les-Bains which is located about 50 km to the north of Lac d’Annecy (385 m a.s.l.) records amount of precipitation, monthly mean δ18O values
and mean air temperature since 1964 whereas δD values of precipitation were only determined since 1992. For the Ammersee catchment monthly stable water isotopes (18O and 2H), air temperature and precipitation amount are recorded at the meteorological station Hohenpeißenberg which is located about 24 km to the south of the lake (988 m a.s.l.).
Figure 4.1: Location of the study areas Ammersee (Germany) and Lac d’Annecy (French Alps).
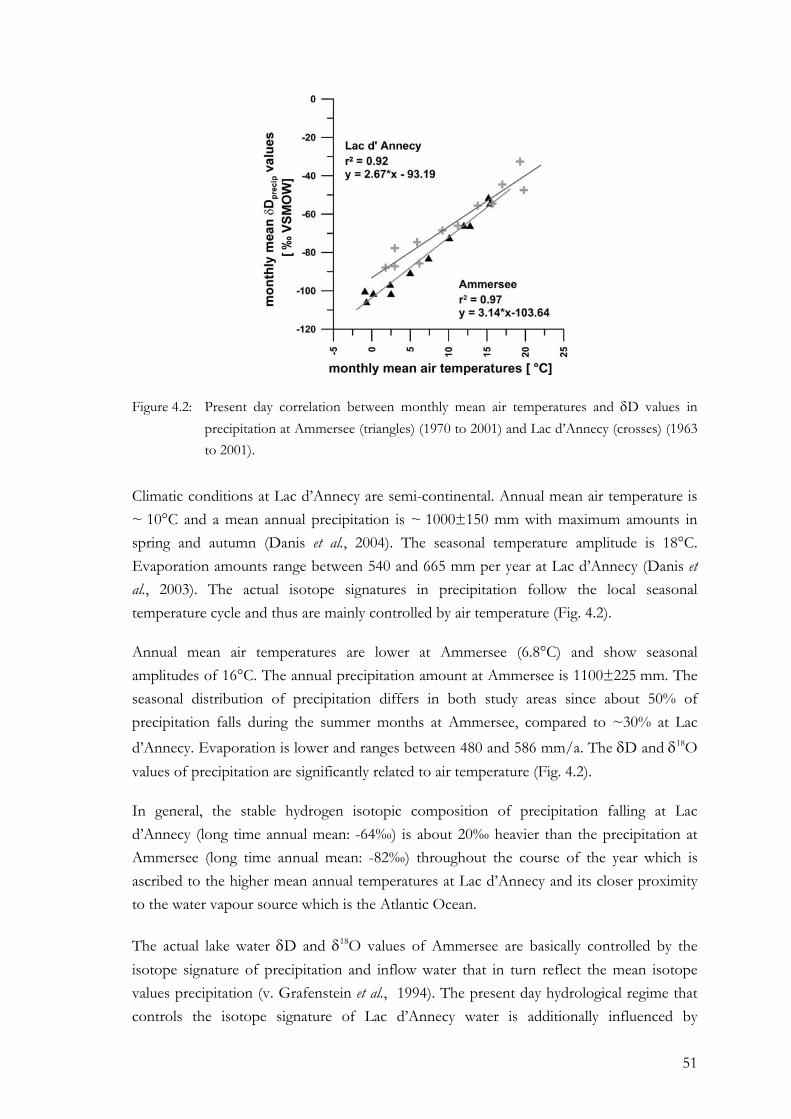
51
Figure 4.2: Present day correlation between monthly mean air temperatures and δD values in precipitation at Ammersee (triangles) (1970 to 2001) and Lac d’Annecy (crosses) (1963 to 2001).
Climatic conditions at Lac d’Annecy are semi-continental. Annual mean air temperature is ~ 10°C and a mean annual precipitation is ~ 1000±150 mm with maximum amounts in spring and autumn (Danis et al., 2004). The seasonal temperature amplitude is 18°C. Evaporation amounts range between 540 and 665 mm per year at Lac d’Annecy (Danis et al., 2003). The actual isotope signatures in precipitation follow the local seasonal temperature cycle and thus are mainly controlled by air temperature (Fig. 4.2).
Annual mean air temperatures are lower at Ammersee (6.8°C) and show seasonal amplitudes of 16°C. The annual precipitation amount at Ammersee is 1100±225 mm. The seasonal distribution of precipitation differs in both study areas since about 50% of precipitation falls during the summer months at Ammersee, compared to ~30% at Lac d’Annecy. Evaporation is lower and ranges between 480 and 586 mm/a. The δD and δ18O values of precipitation are significantly related to air temperature (Fig. 4.2).
In general, the stable hydrogen isotopic composition of precipitation falling at Lac d’Annecy (long time annual mean: -64‰) is about 20‰ heavier than the precipitation at Ammersee (long time annual mean: -82‰) throughout the course of the year which is ascribed to the higher mean annual temperatures at Lac d’Annecy and its closer proximity to the water vapour source which is the Atlantic Ocean.
The actual lake water δD and δ18O values of Ammersee are basically controlled by the isotope signature of precipitation and inflow water that in turn reflect the mean isotope values precipitation (v. Grafenstein et al., 1994). The present day hydrological regime that controls the isotope signature of Lac d’Annecy water is additionally influenced by
52
evaporation and insufficient inflow leading to the enrichment of lake water relative to the precipitation and inflow. Nevertheless, both lake systems are characterized by a comparable isotope hydrology during the considered period between Allerød and Preboreal since the major tributary of Lac d’Annecy, the Fier, was still connected to the lake leading to an isotopic equilibrium between input and lake water (Nomade, 2005).
4.3 Sediment sampling and chronology
The 15.86 long Ammersee sediment core (AS96-1E) was collected in 1996 at a water depth of 70 m (47° 59.87’ N; 11° 6.906’ E) (von Grafenstein et al., 1999). At Lac d’Annecy coring was performed in 2000, the 14.22 m long sediment core (LDA00-1aE) was retrieved at 65 m water depth (45° 52.2’ N; 6° 9.55’ E). After drilling, both cores where stored immediately as archive material at 8°C. In 2005, selected core sections covering the Allerød, the Younger Dryas and the Preboreal were sampled continuously with 2 cm slices from both cores. The analysed Ammersee core sequence comprises 80 cm from 1084 cm mean composite depth top (MCD) to 1178 cm MCD top (~13,400 to ~ 11,400 cal years BP). The analysed core section from Lac d’Annecy is 118 cm long from 837 to 955 cm MCD top (~ 13000 to ~ 11350 cal years BP). The AS96-1E core material is connected to an existing chronology of AS96-1 and AS93-1 based on magnetic susceptibility and correlation of significant varves. For detailed information on the Ammersee sediments age model see von Grafenstein et al., (1999). The Lac d’Annecy core section was radiocarbon dated, additionally varve counted and correlated to Laacher Sea Tephra (LST) (Nomade, 2005).
4.4 Methods
4.4.1 Sample preparation, n-alkane extraction and quantification
The sediment samples were freeze dried and ground. Between 5 and 8 g of dry sediment were used for lipid extraction. Lipid extraction was performed with an accelerated solvent extractor (ASE-200, DIONEX Corp., Sunnydale, USA) with CHCl2/MeOH (10:1) at 100°C and 2,000 psi for 15 min in 2 cycles. The total extract was separated on silica gel columns. Glass columns (ca. 20 cm height, ø 2.5 cm; QVF Labortechnik GmbH; Ilmenau, Germany) were filled with ca. 25 cm3 activated silica gel (0.040-0.063 mesh size; Merck KGaA, Darmstadt, Germany). Alkanes were eluted with hexane (60 ml). The components were identified and quantified using gas chromatography with flame ionization detection (GC-FID; TraceGC, ThermoElectron, Rodano, Italy) on a DB5ms column (30 m, 0.32 mm ID, 0.5 µm film thickness, Agilent, Palo Alto, USA). For quantification, peak areas for n-alkanes were referenced to those in an external n-alkane standard mixture.
53
4.4.2 Analysis of δD values of n-alkanes
The alkane fraction in hexane was injected (1 μl) into a HP5890 GC, equipped with a DB5ms column (30 m, 0.32 mm ID, 0.5 μm film thickness, Agilent). The injector was operated at 280°C in the splitless mode. The oven was maintained for 2 min at 60°C, heated with 6°C/min to 320°C and held there for 10 min. The column flow was constant at 1.7 ml/min. To monitor possible co-elution of n-alkanes with other components part of the column effluent was transferred to an ion trap mass spectrometer (GCQ ThermoElectron, San Jose, USA). The remainder of the split went to an isotope mass spectrometer, via quantitative conversion to H2 in a high-temperature oven operated at 1,425°C (Burgoyne and Hayes, 1998; Hilkert et al., 1999). Compound-specific δD values were obtained using isotope ratio mass spectrometry (IRMS; Finnigan MAT Bremen, Germany DeltaplusXL). Each sample was analysed in triplicate. The δD values were normalized to the VSMOW scale with isotope ratios equal to:
2H/1H = 155.95 ± 0.08 x 10⁻⁶ (De Wit et al., 1980) [Equ. 4.1]
The samples were calibrated against an external standard using a standard mixture of n-C10 to n-C32 alkanes. The values in the standard mixture were calibrated against international reference substances (NBS-22; IAEA-OH22) using the offline high temperature pyrolysis technique (TC/EA) (Gehre et al., 2004). The accuracy was evaluated using routine measurement of the standard mixture after every six injections (two samples). If necessary, a drift correction was applied (Werner and Brand, 2001). The average standard deviation (σ) of all measured samples was 7.4‰. To ensure stable ion source conditions during measurement the H3
+ factor (Hilkert et al., 1999) was determined at least once a day; it was constant during the 6-week measurement period at 7.9 (SD 1.6).
4.5 Results and discussion
4.5.1 Concentration and distribution of n-alkanes in lacustrine sediments
The sediments from Ammersee (Fig. 4.3) and Lac d’Annecy (Fig. 4.4) contain short-chain n-alkanes (nC13 to nC20) that represent a mixture of aquatic sources mainly ascribed to the contribution of algae or bacteria to the organic matter (Arp et al., 1999; Grimalt and Albaiges, 1987; Grimalt et al., 1992; Han and Calvin, 1969). In addition, the occurrence of mid-chain n-alkanes (nC21 to nC25) is assumed to point to an input of submerged or floating freshwater aquatic macrophytes (Ficken et al, 2000; Baas et al., 2000). The predominance of nC27 to nC31 n-alkanes reflects the contribution of terrestrial-derived plant material to the lacustrine organic matter (Eglington & Hamilton, 1967). The Ammersee lake sediments show a bimodal distribution that maximises at nC16 or nC18 and nC29 or nC31 for the first and second mode respectively (Fig. 4.3). A predominance of odd-carbon numbered compounds is exhibited clearly only for the second mode (nC27 to nC31) as illustrated by the
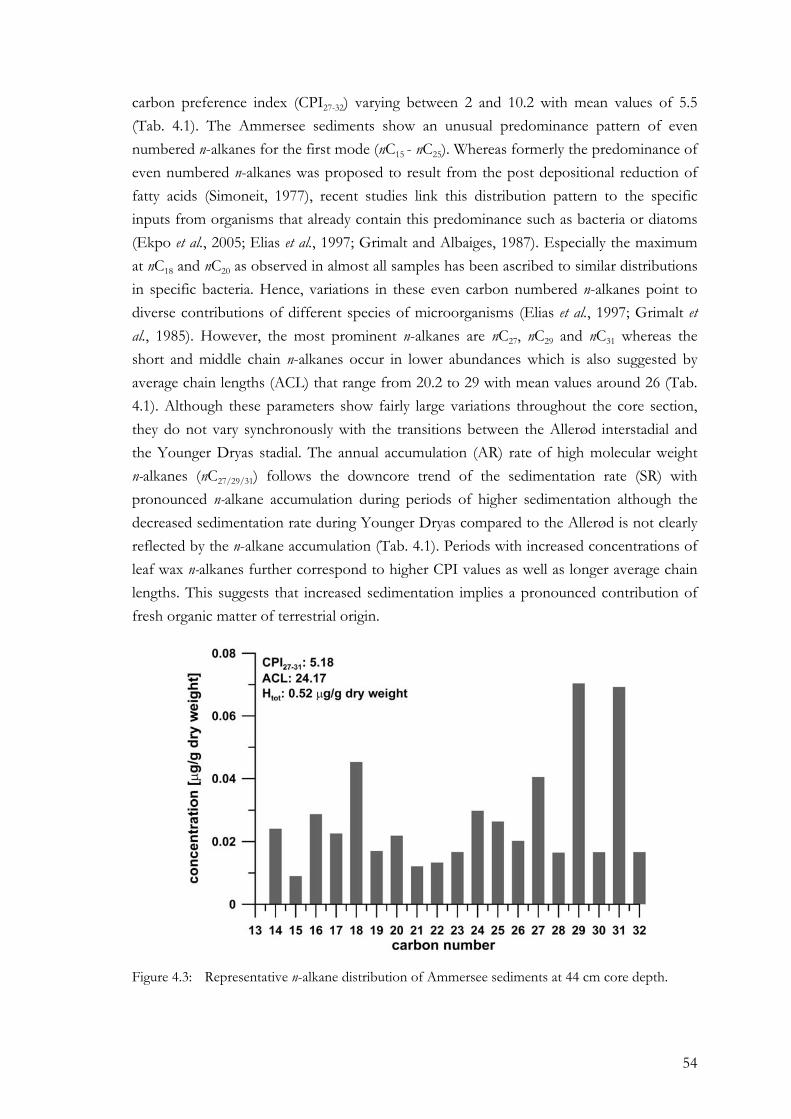
54
carbon preference index (CPI27-32) varying between 2 and 10.2 with mean values of 5.5 (Tab. 4.1). The Ammersee sediments show an unusual predominance pattern of even numbered n-alkanes for the first mode (nC15 - nC25). Whereas formerly the predominance of even numbered n-alkanes was proposed to result from the post depositional reduction of fatty acids (Simoneit, 1977), recent studies link this distribution pattern to the specific inputs from organisms that already contain this predominance such as bacteria or diatoms (Ekpo et al., 2005; Elias et al., 1997; Grimalt and Albaiges, 1987). Especially the maximum at nC18 and nC20 as observed in almost all samples has been ascribed to similar distributions in specific bacteria. Hence, variations in these even carbon numbered n-alkanes point to diverse contributions of different species of microorganisms (Elias et al., 1997; Grimalt et al., 1985). However, the most prominent n-alkanes are nC27, nC29 and nC31 whereas the short and middle chain n-alkanes occur in lower abundances which is also suggested by average chain lengths (ACL) that range from 20.2 to 29 with mean values around 26 (Tab. 4.1). Although these parameters show fairly large variations throughout the core section, they do not vary synchronously with the transitions between the Allerød interstadial and the Younger Dryas stadial. The annual accumulation (AR) rate of high molecular weight n-alkanes (nC27/29/31) follows the downcore trend of the sedimentation rate (SR) with pronounced n-alkane accumulation during periods of higher sedimentation although the decreased sedimentation rate during Younger Dryas compared to the Allerød is not clearly reflected by the n-alkane accumulation (Tab. 4.1). Periods with increased concentrations of leaf wax n-alkanes further correspond to higher CPI values as well as longer average chain lengths. This suggests that increased sedimentation implies a pronounced contribution of fresh organic matter of terrestrial origin.
Figure 4.3: Representative n-alkane distribution of Ammersee sediments at 44 cm core depth.
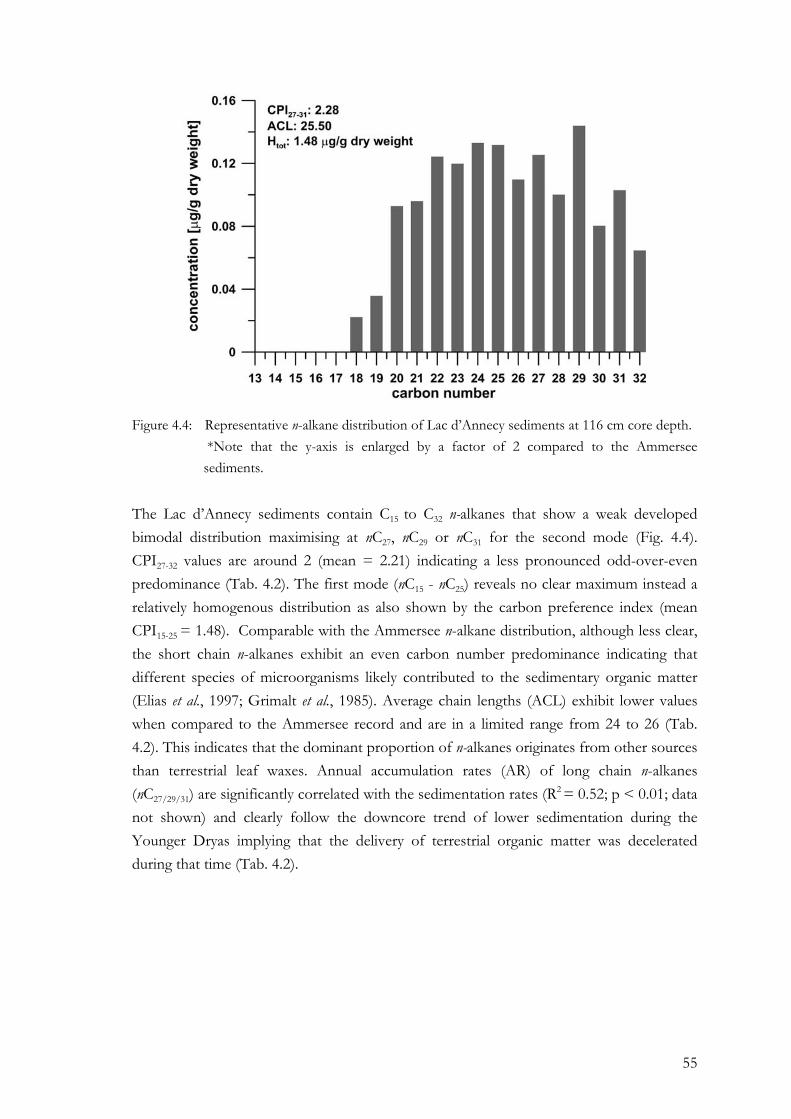
55
Figure 4.4: Representative n-alkane distribution of Lac d’Annecy sediments at 116 cm core depth. *Note that the y-axis is enlarged by a factor of 2 compared to the Ammersee sediments.
The Lac d’Annecy sediments contain C15 to C32 n-alkanes that show a weak developed bimodal distribution maximising at nC27, nC29 or nC31 for the second mode (Fig. 4.4). CPI27-32 values are around 2 (mean = 2.21) indicating a less pronounced odd-over-even predominance (Tab. 4.2). The first mode (nC15 - nC25) reveals no clear maximum instead a relatively homogenous distribution as also shown by the carbon preference index (mean CPI15-25 = 1.48). Comparable with the Ammersee n-alkane distribution, although less clear, the short chain n-alkanes exhibit an even carbon number predominance indicating that different species of microorganisms likely contributed to the sedimentary organic matter (Elias et al., 1997; Grimalt et al., 1985). Average chain lengths (ACL) exhibit lower values when compared to the Ammersee record and are in a limited range from 24 to 26 (Tab. 4.2). This indicates that the dominant proportion of n-alkanes originates from other sources than terrestrial leaf waxes. Annual accumulation rates (AR) of long chain n-alkanes (nC27/29/31) are significantly correlated with the sedimentation rates (R2 = 0.52; p < 0.01; data not shown) and clearly follow the downcore trend of lower sedimentation during the Younger Dryas implying that the delivery of terrestrial organic matter was decelerated during that time (Tab. 4.2).
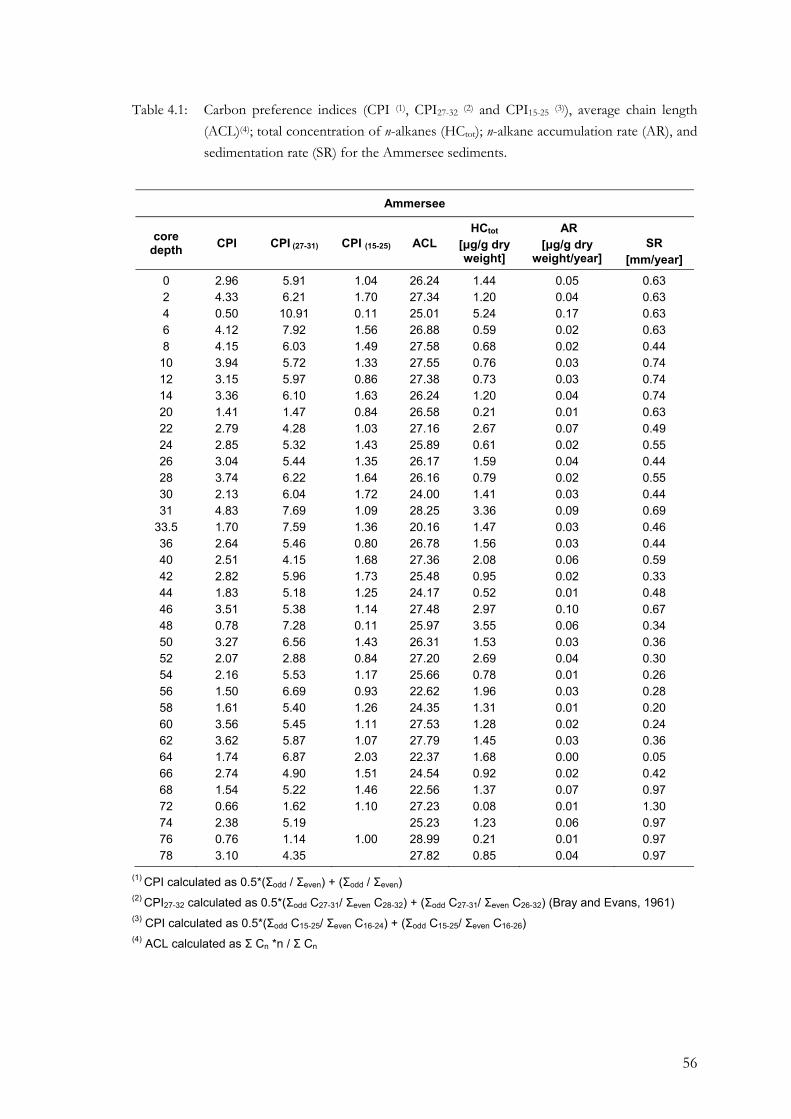
56
Table 4.1: Carbon preference indices (CPI (1), CPI27-32 (2) and CPI15-25 (3)), average chain length (ACL)(4); total concentration of n-alkanes (HCtot); n-alkane accumulation rate (AR), and sedimentation rate (SR) for the Ammersee sediments.
Ammersee
core depth CPI CPI (27-31) CPI (15-25) ACL
HCtot [μg/g dry weight]
AR [μg/g dry
weight/year]
SR
[mm/year]
0 2.96 5.91 1.04 26.24 1.44 0.05 0.63 2 4.33 6.21 1.70 27.34 1.20 0.04 0.63 4 0.50 10.91 0.11 25.01 5.24 0.17 0.63 6 4.12 7.92 1.56 26.88 0.59 0.02 0.63 8 4.15 6.03 1.49 27.58 0.68 0.02 0.44
10 3.94 5.72 1.33 27.55 0.76 0.03 0.74 12 3.15 5.97 0.86 27.38 0.73 0.03 0.74 14 3.36 6.10 1.63 26.24 1.20 0.04 0.74 20 1.41 1.47 0.84 26.58 0.21 0.01 0.63 22 2.79 4.28 1.03 27.16 2.67 0.07 0.49 24 2.85 5.32 1.43 25.89 0.61 0.02 0.55 26 3.04 5.44 1.35 26.17 1.59 0.04 0.44 28 3.74 6.22 1.64 26.16 0.79 0.02 0.55 30 2.13 6.04 1.72 24.00 1.41 0.03 0.44 31 4.83 7.69 1.09 28.25 3.36 0.09 0.69
33.5 1.70 7.59 1.36 20.16 1.47 0.03 0.46 36 2.64 5.46 0.80 26.78 1.56 0.03 0.44 40 2.51 4.15 1.68 27.36 2.08 0.06 0.59 42 2.82 5.96 1.73 25.48 0.95 0.02 0.33 44 1.83 5.18 1.25 24.17 0.52 0.01 0.48 46 3.51 5.38 1.14 27.48 2.97 0.10 0.67 48 0.78 7.28 0.11 25.97 3.55 0.06 0.34 50 3.27 6.56 1.43 26.31 1.53 0.03 0.36 52 2.07 2.88 0.84 27.20 2.69 0.04 0.30 54 2.16 5.53 1.17 25.66 0.78 0.01 0.26 56 1.50 6.69 0.93 22.62 1.96 0.03 0.28 58 1.61 5.40 1.26 24.35 1.31 0.01 0.20 60 3.56 5.45 1.11 27.53 1.28 0.02 0.24 62 3.62 5.87 1.07 27.79 1.45 0.03 0.36 64 1.74 6.87 2.03 22.37 1.68 0.00 0.05 66 2.74 4.90 1.51 24.54 0.92 0.02 0.42 68 1.54 5.22 1.46 22.56 1.37 0.07 0.97 72 0.66 1.62 1.10 27.23 0.08 0.01 1.30 74 2.38 5.19 25.23 1.23 0.06 0.97 76 0.76 1.14 1.00 28.99 0.21 0.01 0.97 78 3.10 4.35 27.82 0.85 0.04 0.97
(1) CPI calculated as 0.5*(Σodd / Σeven) + (Σodd / Σeven)
(2) CPI27-32 calculated as 0.5*(Σodd C27-31/ Σeven C28-32) + (Σodd C27-31/ Σeven C26-32) (Bray and Evans, 1961) (3) CPI calculated as 0.5*(Σodd C15-25/ Σeven C16-24) + (Σodd C15-25/ Σeven C16-26) (4) ACL calculated as Σ Cn *n / Σ Cn
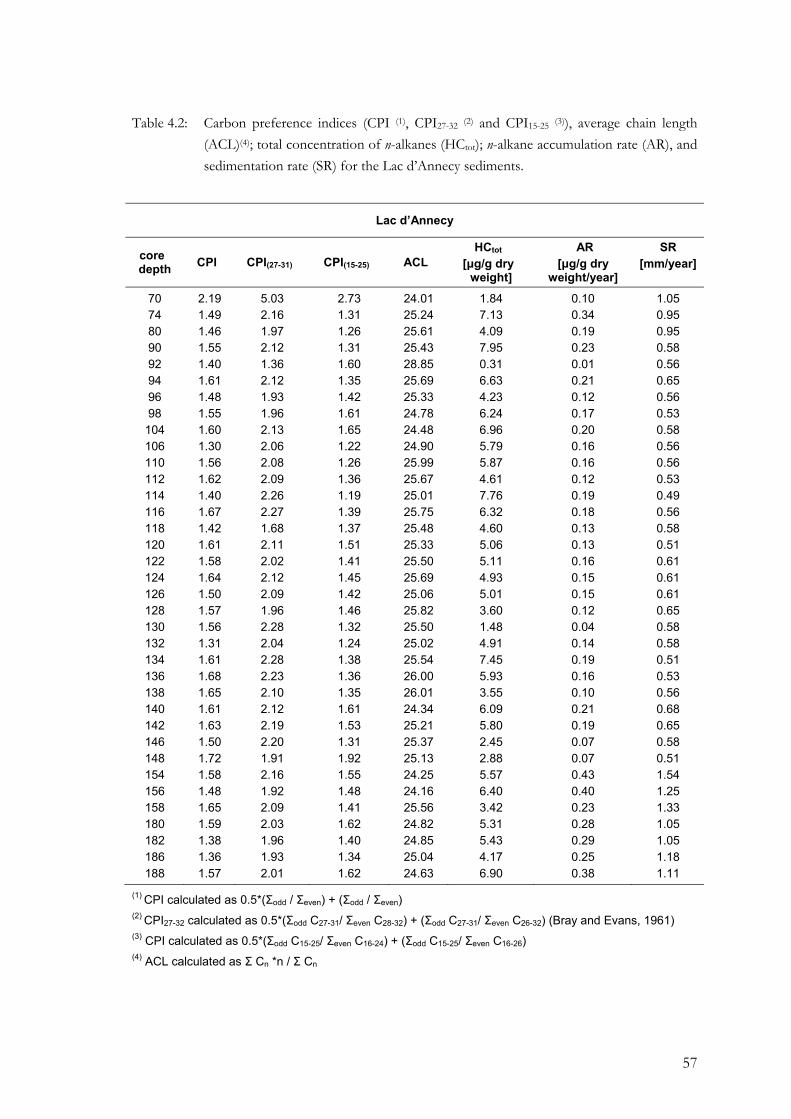
57
Table 4.2: Carbon preference indices (CPI (1), CPI27-32 (2) and CPI15-25 (3)), average chain length (ACL)(4); total concentration of n-alkanes (HCtot); n-alkane accumulation rate (AR), and sedimentation rate (SR) for the Lac d’Annecy sediments.
Lac d’Annecy
core depth CPI CPI(27-31) CPI(15-25) ACL
HCtot [μg/g dry
weight]
AR [μg/g dry
weight/year]
SR [mm/year]
70 2.19 5.03 2.73 24.01 1.84 0.10 1.05 74 1.49 2.16 1.31 25.24 7.13 0.34 0.95 80 1.46 1.97 1.26 25.61 4.09 0.19 0.95 90 1.55 2.12 1.31 25.43 7.95 0.23 0.58 92 1.40 1.36 1.60 28.85 0.31 0.01 0.56 94 1.61 2.12 1.35 25.69 6.63 0.21 0.65 96 1.48 1.93 1.42 25.33 4.23 0.12 0.56 98 1.55 1.96 1.61 24.78 6.24 0.17 0.53
104 1.60 2.13 1.65 24.48 6.96 0.20 0.58 106 1.30 2.06 1.22 24.90 5.79 0.16 0.56 110 1.56 2.08 1.26 25.99 5.87 0.16 0.56 112 1.62 2.09 1.36 25.67 4.61 0.12 0.53 114 1.40 2.26 1.19 25.01 7.76 0.19 0.49 116 1.67 2.27 1.39 25.75 6.32 0.18 0.56 118 1.42 1.68 1.37 25.48 4.60 0.13 0.58 120 1.61 2.11 1.51 25.33 5.06 0.13 0.51 122 1.58 2.02 1.41 25.50 5.11 0.16 0.61 124 1.64 2.12 1.45 25.69 4.93 0.15 0.61 126 1.50 2.09 1.42 25.06 5.01 0.15 0.61 128 1.57 1.96 1.46 25.82 3.60 0.12 0.65 130 1.56 2.28 1.32 25.50 1.48 0.04 0.58 132 1.31 2.04 1.24 25.02 4.91 0.14 0.58 134 1.61 2.28 1.38 25.54 7.45 0.19 0.51 136 1.68 2.23 1.36 26.00 5.93 0.16 0.53 138 1.65 2.10 1.35 26.01 3.55 0.10 0.56 140 1.61 2.12 1.61 24.34 6.09 0.21 0.68 142 1.63 2.19 1.53 25.21 5.80 0.19 0.65 146 1.50 2.20 1.31 25.37 2.45 0.07 0.58 148 1.72 1.91 1.92 25.13 2.88 0.07 0.51 154 1.58 2.16 1.55 24.25 5.57 0.43 1.54 156 1.48 1.92 1.48 24.16 6.40 0.40 1.25 158 1.65 2.09 1.41 25.56 3.42 0.23 1.33 180 1.59 2.03 1.62 24.82 5.31 0.28 1.05 182 1.38 1.96 1.40 24.85 5.43 0.29 1.05 186 1.36 1.93 1.34 25.04 4.17 0.25 1.18 188 1.57 2.01 1.62 24.63 6.90 0.38 1.11
(1) CPI calculated as 0.5*(Σodd / Σeven) + (Σodd / Σeven)
(2) CPI27-32 calculated as 0.5*(Σodd C27-31/ Σeven C28-32) + (Σodd C27-31/ Σeven C26-32) (Bray and Evans, 1961) (3) CPI calculated as 0.5*(Σodd C15-25/ Σeven C16-24) + (Σodd C15-25/ Σeven C16-26) (4) ACL calculated as Σ Cn *n / Σ Cn
58
Although it has been shown that leaf waxes can be transported through the atmosphere over long distances (Ohkouchi et al., 1997), the lacustrine terrestrial organic matter preserved at Ammersee and Lac d’Annecy is expected to originate from local sources from the topsoil or litter within the lakes catchments. This is suggested because enhanced long range atmospheric transport during cold and dry stages is presumed to result in high accumulation rates of terrestrial biomarkers (Huang et al., 2000; Yokoyama et al., 2006) whereas accumulation rates of leaf wax n-alkanes (nC27,29,31) in the Ammersee and Lac d’Annecy sediments do not show an increase with the onset of the Younger Dryas cooling (Tab. 4.1, 4.2). Fluctuations of accumulation rates are thus assumed to represent intensity changes in transport via rivers or through soil erosion.
The n-alkane distribution in the sediments from both lake sites exhibits a clear and most likely unaltered terrestrial component of the sedimentary organic matter derived from the leaf waxes of higher plants (nC27/29/31). The short and mid-chain n-alkanes (nC15-25) are presumed to represent a mixture of aquatic and terrestrial sources derived from algae and microorganisms. Consequently, we use the long chain n-alkane δD values as indicators of
precipitation for the following comparison with the aquatic-derived δ18O values.
4.5.2 δD values of lacustrine leaf wax n-alkanes from Ammersee and Lac d’Annecy
Compound-specific δD values were determined for the leaf wax n-alkanes (nC27-31) from the lacustrine sediments from Ammersee and Lac d’Annecy (Tab. 4.3, 4.4). The standard deviations (σ) of triplicate analyses ranged from 1‰ to 15‰. Based on the assumption that nC27, nC29 and nC31 originate from terrestrial vegetation and since they exhibit isotope signatures in comparable ranges we suggest a common source. In addition, it is assumed that the mean δD values of the leaf wax n-alkanes (nC27/29/31) integrate possible species-specific apparent fractionations due to different degrees of isotope leaf water enrichment (Hou et al., 2007b). Consequently, in the following interpretation we propose the weighted mean δD values from the leaf wax n-alkanes (nC27/29/31) to represent the mean isotope signal of local precipitation, being modified by leaf water evapotranspiration (Fig. 4.5, Tab. 4.3, 4.4).
Both records show large ranges in hydrogen isotope signatures from around -200‰ to ~ -140‰ at Ammersee and from ~ -120‰ to ~ -70‰ at Lac d’Annecy that imply a great sensitivity of n-alkane δD values to extensive climate driven precipitation changes.
Considering the weighted mean δD values of the leaf wax n-alkanes (nC27/29/31) throughout
both records, the δD values at Lac d’Annecy (overall mean δD: ~ 102‰) are strongly
enriched in deuterium when compared to the Ammersee δD values (overall mean δD: ~ 167‰). A mean enrichment by about 20‰ is seen in the present day isotopic composition of precipitation at Lac d’Annecy related to Ammersee (Fig. 4.2). Higher mean
59
air temperatures at Lac d’Annecy as well as the shorter proximity to the Atlantic Ocean are responsible for this higher deuterium content. However, this effect can only partly explain the observed isotopic difference and other factors need to be considered. We can rule out differences in the vegetation cover which can cause up to 70‰ variation in δD values (e.g. Hou et al., 2007b) as palynological studies suggest a common mid-European vegetation composition that was dominated by Pinus and Betula pendula during the Allerød and by herbaceous taxa in the YD (Peyron et al., 2005). Instead we suggest that differences in the catchment and sedimentation rates are responsible for the observed differences. On the one hand the Ammersee has a higher catchment altitude that delivers depleted n-alkanes from the headwaters due to the altitude effect that accounts for -1 to -4‰ in deuterium per 100 m (Holdsworth et al., 1991). On the other hand the sedimentation rate in Lac d‘Annecy is twice as high as in the Ammersee and consequently the contribution of soil derived n-alkanes to the sediment is much higher. Soil derived n-alkanes are enriched in deuterium relative to the n-alkanes from the vegetation (Krull et al., 2006) and therefore might have contributed to isotopically heavier n-alkanes in the Lac d’Annecy.
Both records clearly exhibit the transition between the Allerød interstadial and the YD cooling (Fig. 4.5). The weighted mean δD values during the Allerød are significantly
different from the weighted mean δD values during the YD at both lake sites statistically
tested at the 95% level (t-test, p value <0.0001; α = 0.05). The difference between the
overall mean Allerød n-alkane δD value and the overall mean YD n-alkane δD value is ~ - 30‰ at the Ammersee (from -145‰ during the Allerød to -175‰ during the YD). Deuterium depletion during the YD is less pronounced at Lac d’Annecy (~20‰) where mean δD values shift from -89‰ to -109‰ (Fig. 4.5). This could be explained by the significantly larger catchment area of the Ammersee where higher amounts of snow and ice potentially led to periodically increased contribution of deuterium depleted meltwater that potentially modulated the precipitation driven deuterium content of the n-alkanes.
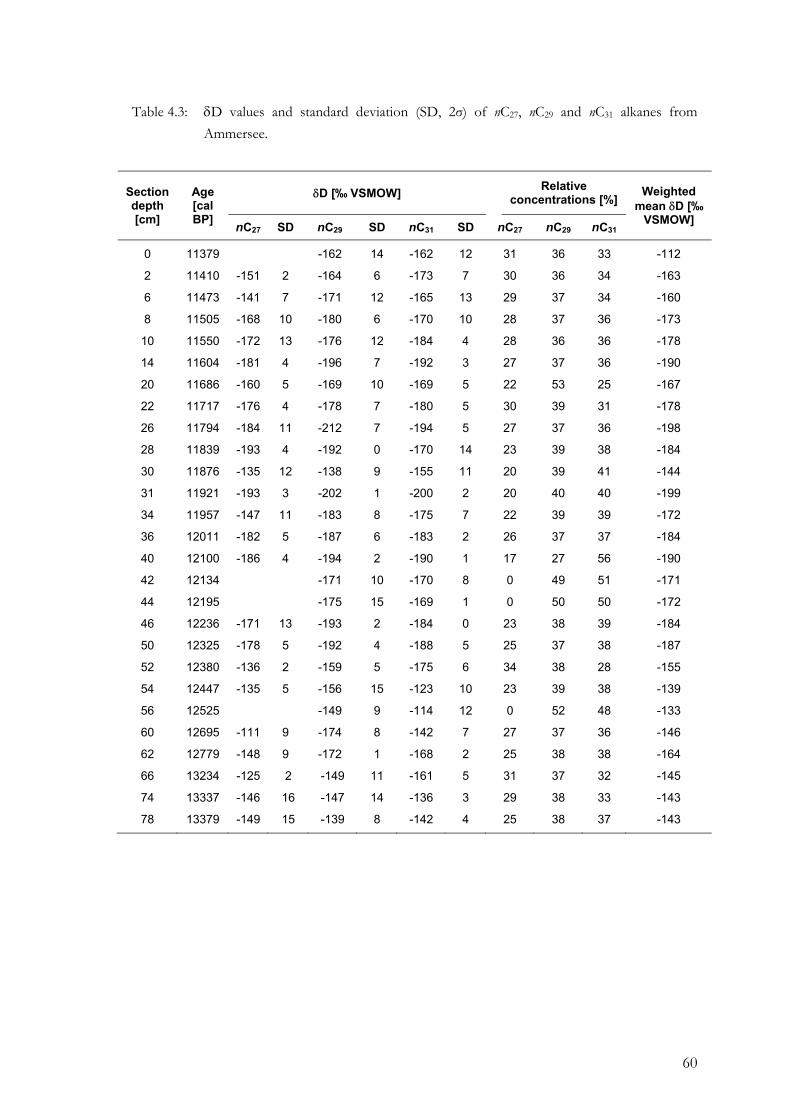
60
Table 4.3: δD values and standard deviation (SD, 2σ) of nC27, nC29 and nC31 alkanes from Ammersee.
Section depth [cm]
Age [cal BP]
δD [‰ VSMOW] Relative concentrations [%]
Weighted mean δD [‰
VSMOW] nC27 SD nC29 SD nC31 SD nC27 nC29 nC31
0 11379 -162 14 -162 12 31 36 33 -112
2 11410 -151 2 -164 6 -173 7 30 36 34 -163
6 11473 -141 7 -171 12 -165 13 29 37 34 -160
8 11505 -168 10 -180 6 -170 10 28 37 36 -173
10 11550 -172 13 -176 12 -184 4 28 36 36 -178
14 11604 -181 4 -196 7 -192 3 27 37 36 -190
20 11686 -160 5 -169 10 -169 5 22 53 25 -167
22 11717 -176 4 -178 7 -180 5 30 39 31 -178
26 11794 -184 11 -212 7 -194 5 27 37 36 -198
28 11839 -193 4 -192 0 -170 14 23 39 38 -184
30 11876 -135 12 -138 9 -155 11 20 39 41 -144
31 11921 -193 3 -202 1 -200 2 20 40 40 -199
34 11957 -147 11 -183 8 -175 7 22 39 39 -172
36 12011 -182 5 -187 6 -183 2 26 37 37 -184
40 12100 -186 4 -194 2 -190 1 17 27 56 -190
42 12134 -171 10 -170 8 0 49 51 -171
44 12195 -175 15 -169 1 0 50 50 -172
46 12236 -171 13 -193 2 -184 0 23 38 39 -184
50 12325 -178 5 -192 4 -188 5 25 37 38 -187
52 12380 -136 2 -159 5 -175 6 34 38 28 -155
54 12447 -135 5 -156 15 -123 10 23 39 38 -139
56 12525 -149 9 -114 12 0 52 48 -133
60 12695 -111 9 -174 8 -142 7 27 37 36 -146
62 12779 -148 9 -172 1 -168 2 25 38 38 -164
66 13234 -125 2 -149 11 -161 5 31 37 32 -145
74 13337 -146 16 -147 14 -136 3 29 38 33 -143
78 13379 -149 15 -139 8 -142 4 25 38 37 -143
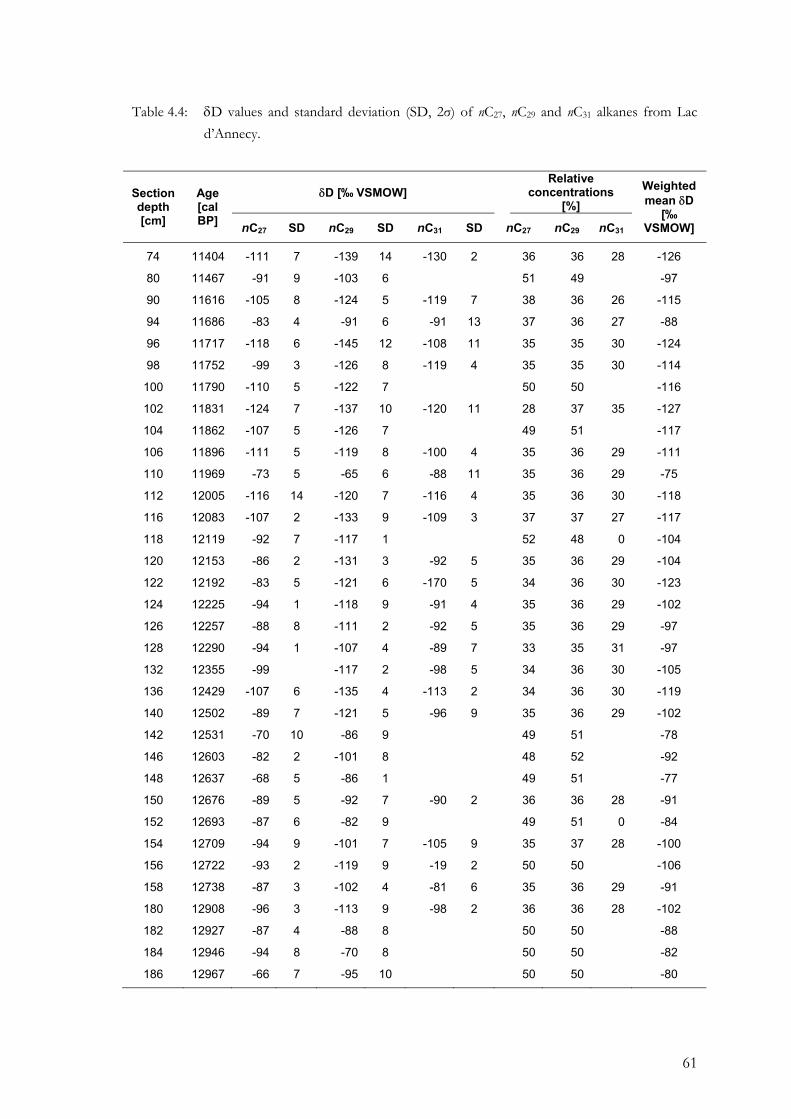
61
Table 4.4: δD values and standard deviation (SD, 2σ) of nC27, nC29 and nC31 alkanes from Lac d’Annecy.
Section depth [cm]
Age [cal BP]
δD [‰ VSMOW] Relative
concentrations [%]
Weighted mean δD
[‰ VSMOW] nC27 SD nC29 SD nC31 SD nC27 nC29 nC31
74 11404 -111 7 -139 14 -130 2 36 36 28 -126
80 11467 -91 9 -103 6 51 49 -97
90 11616 -105 8 -124 5 -119 7 38 36 26 -115
94 11686 -83 4 -91 6 -91 13 37 36 27 -88
96 11717 -118 6 -145 12 -108 11 35 35 30 -124
98 11752 -99 3 -126 8 -119 4 35 35 30 -114
100 11790 -110 5 -122 7 50 50 -116
102 11831 -124 7 -137 10 -120 11 28 37 35 -127
104 11862 -107 5 -126 7 49 51 -117
106 11896 -111 5 -119 8 -100 4 35 36 29 -111
110 11969 -73 5 -65 6 -88 11 35 36 29 -75
112 12005 -116 14 -120 7 -116 4 35 36 30 -118
116 12083 -107 2 -133 9 -109 3 37 37 27 -117
118 12119 -92 7 -117 1 52 48 0 -104
120 12153 -86 2 -131 3 -92 5 35 36 29 -104
122 12192 -83 5 -121 6 -170 5 34 36 30 -123
124 12225 -94 1 -118 9 -91 4 35 36 29 -102
126 12257 -88 8 -111 2 -92 5 35 36 29 -97
128 12290 -94 1 -107 4 -89 7 33 35 31 -97
132 12355 -99 -117 2 -98 5 34 36 30 -105
136 12429 -107 6 -135 4 -113 2 34 36 30 -119
140 12502 -89 7 -121 5 -96 9 35 36 29 -102
142 12531 -70 10 -86 9 49 51 -78
146 12603 -82 2 -101 8 48 52 -92
148 12637 -68 5 -86 1 49 51 -77
150 12676 -89 5 -92 7 -90 2 36 36 28 -91
152 12693 -87 6 -82 9 49 51 0 -84
154 12709 -94 9 -101 7 -105 9 35 37 28 -100
156 12722 -93 2 -119 9 -19 2 50 50 -106
158 12738 -87 3 -102 4 -81 6 35 36 29 -91
180 12908 -96 3 -113 9 -98 2 36 36 28 -102
182 12927 -87 4 -88 8 50 50 -88
184 12946 -94 8 -70 8 50 50 -82
186 12967 -66 7 -95 10 50 50 -80
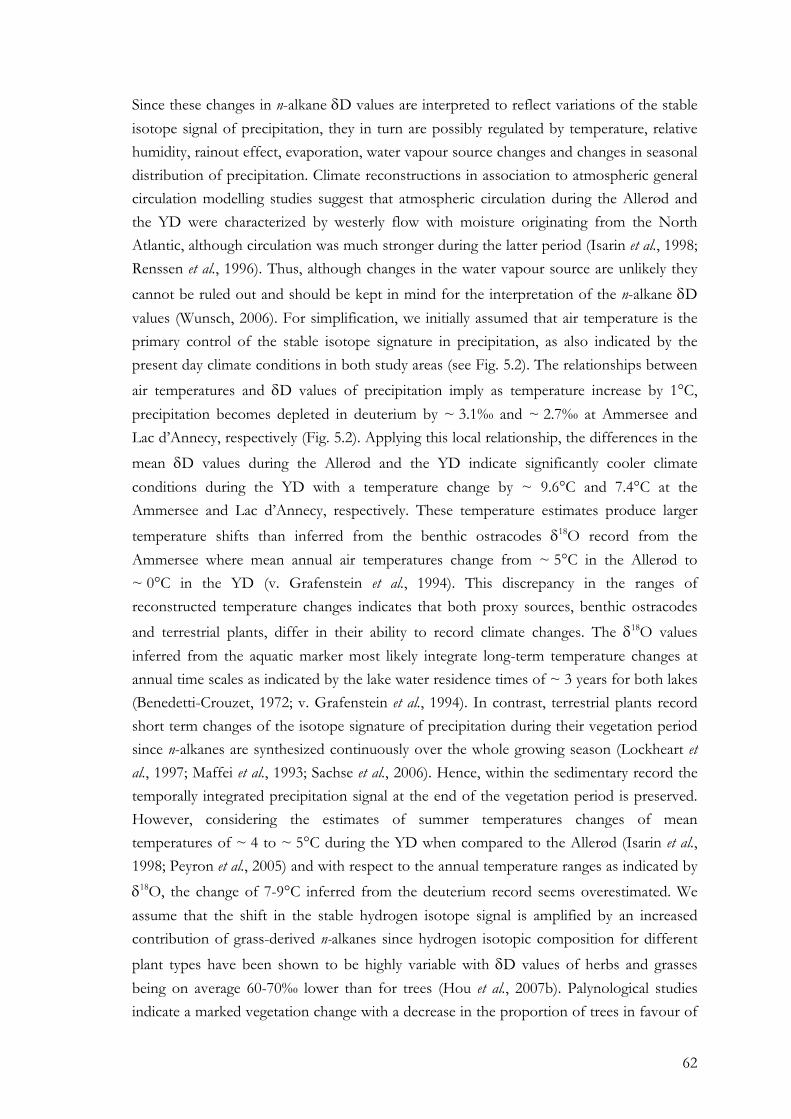
62
Since these changes in n-alkane δD values are interpreted to reflect variations of the stable isotope signal of precipitation, they in turn are possibly regulated by temperature, relative humidity, rainout effect, evaporation, water vapour source changes and changes in seasonal distribution of precipitation. Climate reconstructions in association to atmospheric general circulation modelling studies suggest that atmospheric circulation during the Allerød and the YD were characterized by westerly flow with moisture originating from the North Atlantic, although circulation was much stronger during the latter period (Isarin et al., 1998; Renssen et al., 1996). Thus, although changes in the water vapour source are unlikely they cannot be ruled out and should be kept in mind for the interpretation of the n-alkane δD values (Wunsch, 2006). For simplification, we initially assumed that air temperature is the primary control of the stable isotope signature in precipitation, as also indicated by the present day climate conditions in both study areas (see Fig. 5.2). The relationships between air temperatures and δD values of precipitation imply as temperature increase by 1°C, precipitation becomes depleted in deuterium by ~ 3.1‰ and ~ 2.7‰ at Ammersee and Lac d’Annecy, respectively (Fig. 5.2). Applying this local relationship, the differences in the mean δD values during the Allerød and the YD indicate significantly cooler climate conditions during the YD with a temperature change by ~ 9.6°C and 7.4°C at the Ammersee and Lac d’Annecy, respectively. These temperature estimates produce larger temperature shifts than inferred from the benthic ostracodes δ18O record from the Ammersee where mean annual air temperatures change from ~ 5°C in the Allerød to ~ 0°C in the YD (v. Grafenstein et al., 1994). This discrepancy in the ranges of reconstructed temperature changes indicates that both proxy sources, benthic ostracodes and terrestrial plants, differ in their ability to record climate changes. The δ18O values inferred from the aquatic marker most likely integrate long-term temperature changes at annual time scales as indicated by the lake water residence times of ~ 3 years for both lakes (Benedetti-Crouzet, 1972; v. Grafenstein et al., 1994). In contrast, terrestrial plants record short term changes of the isotope signature of precipitation during their vegetation period since n-alkanes are synthesized continuously over the whole growing season (Lockheart et al., 1997; Maffei et al., 1993; Sachse et al., 2006). Hence, within the sedimentary record the temporally integrated precipitation signal at the end of the vegetation period is preserved. However, considering the estimates of summer temperatures changes of mean temperatures of ~ 4 to ~ 5°C during the YD when compared to the Allerød (Isarin et al., 1998; Peyron et al., 2005) and with respect to the annual temperature ranges as indicated by δ18O, the change of 7-9°C inferred from the deuterium record seems overestimated. We assume that the shift in the stable hydrogen isotope signal is amplified by an increased contribution of grass-derived n-alkanes since hydrogen isotopic composition for different plant types have been shown to be highly variable with δD values of herbs and grasses being on average 60-70‰ lower than for trees (Hou et al., 2007b). Palynological studies indicate a marked vegetation change with a decrease in the proportion of trees in favour of
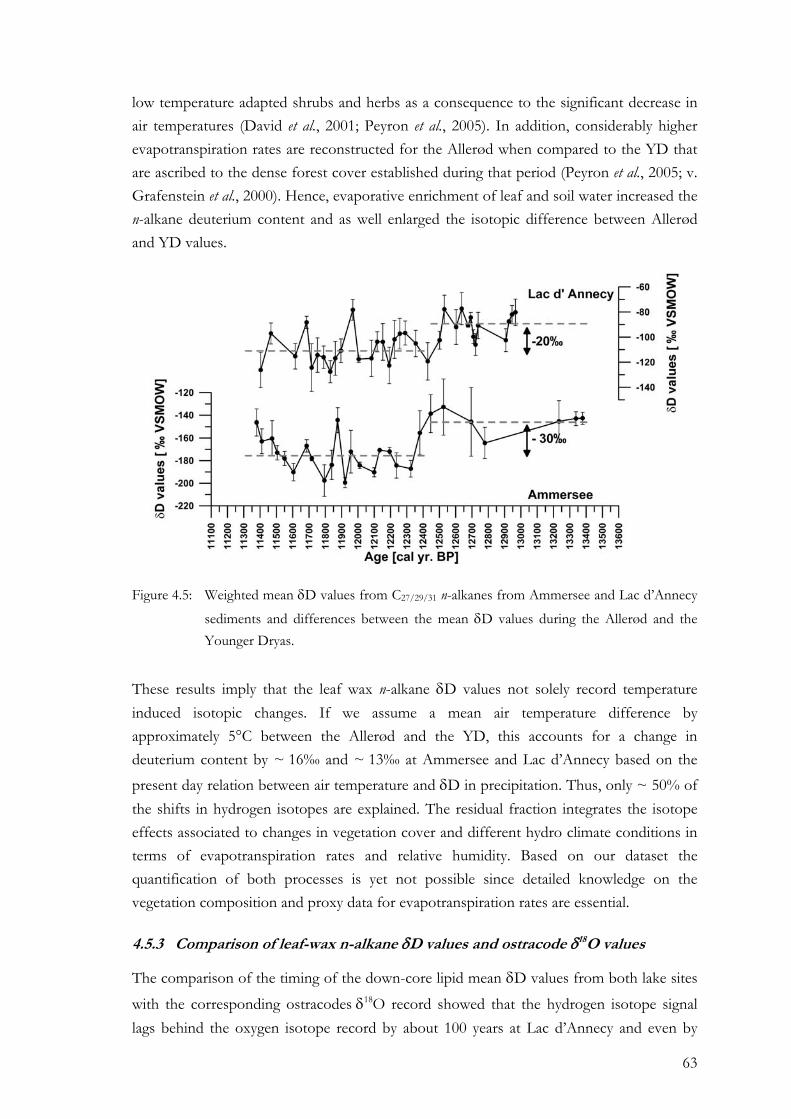
63
low temperature adapted shrubs and herbs as a consequence to the significant decrease in air temperatures (David et al., 2001; Peyron et al., 2005). In addition, considerably higher evapotranspiration rates are reconstructed for the Allerød when compared to the YD that are ascribed to the dense forest cover established during that period (Peyron et al., 2005; v. Grafenstein et al., 2000). Hence, evaporative enrichment of leaf and soil water increased the n-alkane deuterium content and as well enlarged the isotopic difference between Allerød and YD values.
Figure 4.5: Weighted mean δD values from C27/29/31 n-alkanes from Ammersee and Lac d’Annecy
sediments and differences between the mean δD values during the Allerød and the Younger Dryas.
These results imply that the leaf wax n-alkane δD values not solely record temperature induced isotopic changes. If we assume a mean air temperature difference by approximately 5°C between the Allerød and the YD, this accounts for a change in deuterium content by ~ 16‰ and ~ 13‰ at Ammersee and Lac d’Annecy based on the present day relation between air temperature and δD in precipitation. Thus, only ~ 50% of the shifts in hydrogen isotopes are explained. The residual fraction integrates the isotope effects associated to changes in vegetation cover and different hydro climate conditions in terms of evapotranspiration rates and relative humidity. Based on our dataset the quantification of both processes is yet not possible since detailed knowledge on the vegetation composition and proxy data for evapotranspiration rates are essential.
4.5.3 Comparison of leaf-wax n-alkane δD values and ostracode δ18O values
The comparison of the timing of the down-core lipid mean δD values from both lake sites
with the corresponding ostracodes δ18O record showed that the hydrogen isotope signal lags behind the oxygen isotope record by about 100 years at Lac d’Annecy and even by
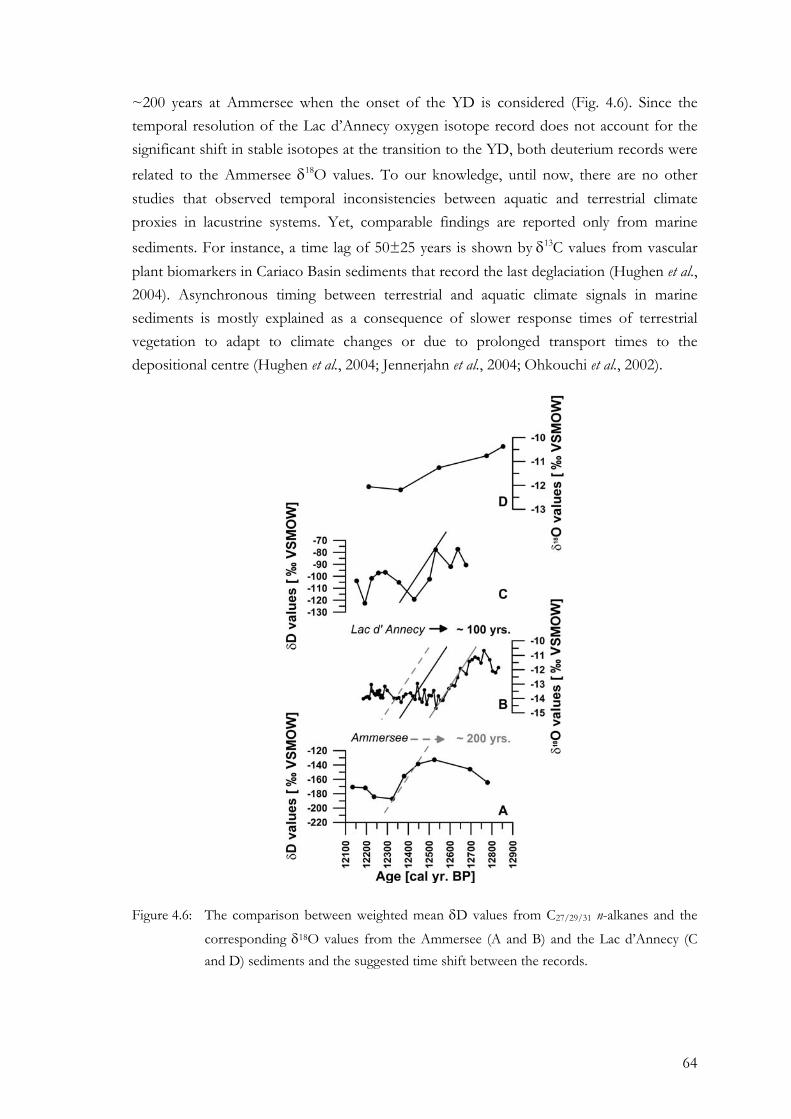
64
~200 years at Ammersee when the onset of the YD is considered (Fig. 4.6). Since the temporal resolution of the Lac d’Annecy oxygen isotope record does not account for the significant shift in stable isotopes at the transition to the YD, both deuterium records were related to the Ammersee δ18O values. To our knowledge, until now, there are no other studies that observed temporal inconsistencies between aquatic and terrestrial climate proxies in lacustrine systems. Yet, comparable findings are reported only from marine sediments. For instance, a time lag of 50±25 years is shown by δ13C values from vascular plant biomarkers in Cariaco Basin sediments that record the last deglaciation (Hughen et al., 2004). Asynchronous timing between terrestrial and aquatic climate signals in marine sediments is mostly explained as a consequence of slower response times of terrestrial vegetation to adapt to climate changes or due to prolonged transport times to the depositional centre (Hughen et al., 2004; Jennerjahn et al., 2004; Ohkouchi et al., 2002).
Figure 4.6: The comparison between weighted mean δD values from C27/29/31 n-alkanes and the
corresponding δ18O values from the Ammersee (A and B) and the Lac d’Annecy (C and D) sediments and the suggested time shift between the records.
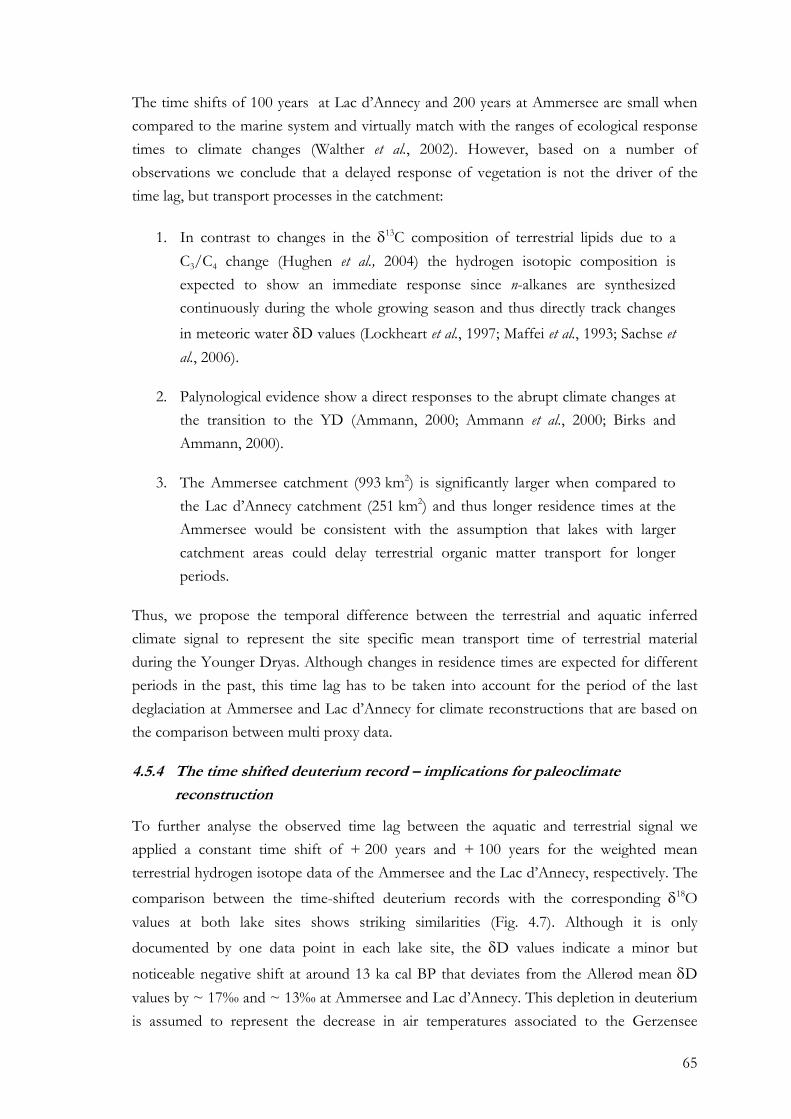
65
The time shifts of 100 years at Lac d’Annecy and 200 years at Ammersee are small when compared to the marine system and virtually match with the ranges of ecological response times to climate changes (Walther et al., 2002). However, based on a number of observations we conclude that a delayed response of vegetation is not the driver of the time lag, but transport processes in the catchment:
1. In contrast to changes in the δ13C composition of terrestrial lipids due to a C3/C4 change (Hughen et al., 2004) the hydrogen isotopic composition is expected to show an immediate response since n-alkanes are synthesized continuously during the whole growing season and thus directly track changes in meteoric water δD values (Lockheart et al., 1997; Maffei et al., 1993; Sachse et al., 2006).
2. Palynological evidence show a direct responses to the abrupt climate changes at the transition to the YD (Ammann, 2000; Ammann et al., 2000; Birks and Ammann, 2000).
3. The Ammersee catchment (993 km2) is significantly larger when compared to the Lac d’Annecy catchment (251 km2) and thus longer residence times at the Ammersee would be consistent with the assumption that lakes with larger catchment areas could delay terrestrial organic matter transport for longer periods.
Thus, we propose the temporal difference between the terrestrial and aquatic inferred climate signal to represent the site specific mean transport time of terrestrial material during the Younger Dryas. Although changes in residence times are expected for different periods in the past, this time lag has to be taken into account for the period of the last deglaciation at Ammersee and Lac d’Annecy for climate reconstructions that are based on the comparison between multi proxy data.
4.5.4 The time shifted deuterium record – implications for paleoclimate
reconstruction
To further analyse the observed time lag between the aquatic and terrestrial signal we applied a constant time shift of + 200 years and + 100 years for the weighted mean terrestrial hydrogen isotope data of the Ammersee and the Lac d’Annecy, respectively. The comparison between the time-shifted deuterium records with the corresponding δ18O values at both lake sites shows striking similarities (Fig. 4.7). Although it is only documented by one data point in each lake site, the δD values indicate a minor but
noticeable negative shift at around 13 ka cal BP that deviates from the Allerød mean δD values by ~ 17‰ and ~ 13‰ at Ammersee and Lac d’Annecy. This depletion in deuterium is assumed to represent the decrease in air temperatures associated to the Gerzensee
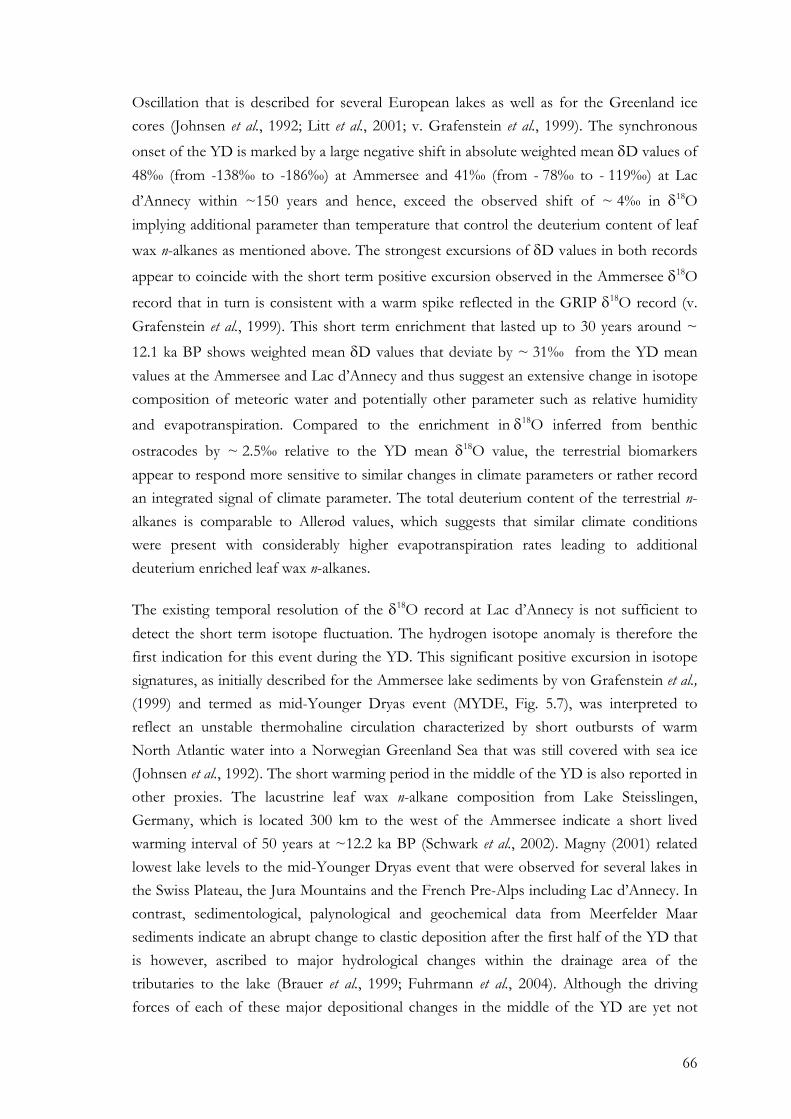
66
Oscillation that is described for several European lakes as well as for the Greenland ice cores (Johnsen et al., 1992; Litt et al., 2001; v. Grafenstein et al., 1999). The synchronous onset of the YD is marked by a large negative shift in absolute weighted mean δD values of 48‰ (from -138‰ to -186‰) at Ammersee and 41‰ (from - 78‰ to - 119‰) at Lac d’Annecy within ~150 years and hence, exceed the observed shift of ~ 4‰ in δ18O implying additional parameter than temperature that control the deuterium content of leaf wax n-alkanes as mentioned above. The strongest excursions of δD values in both records
appear to coincide with the short term positive excursion observed in the Ammersee δ18O
record that in turn is consistent with a warm spike reflected in the GRIP δ18O record (v. Grafenstein et al., 1999). This short term enrichment that lasted up to 30 years around ~ 12.1 ka BP shows weighted mean δD values that deviate by ~ 31‰ from the YD mean values at the Ammersee and Lac d’Annecy and thus suggest an extensive change in isotope composition of meteoric water and potentially other parameter such as relative humidity and evapotranspiration. Compared to the enrichment in δ18O inferred from benthic
ostracodes by ~ 2.5‰ relative to the YD mean δ18O value, the terrestrial biomarkers appear to respond more sensitive to similar changes in climate parameters or rather record an integrated signal of climate parameter. The total deuterium content of the terrestrial n-alkanes is comparable to Allerød values, which suggests that similar climate conditions were present with considerably higher evapotranspiration rates leading to additional deuterium enriched leaf wax n-alkanes.
The existing temporal resolution of the δ18O record at Lac d’Annecy is not sufficient to detect the short term isotope fluctuation. The hydrogen isotope anomaly is therefore the first indication for this event during the YD. This significant positive excursion in isotope signatures, as initially described for the Ammersee lake sediments by von Grafenstein et al., (1999) and termed as mid-Younger Dryas event (MYDE, Fig. 5.7), was interpreted to reflect an unstable thermohaline circulation characterized by short outbursts of warm North Atlantic water into a Norwegian Greenland Sea that was still covered with sea ice (Johnsen et al., 1992). The short warming period in the middle of the YD is also reported in other proxies. The lacustrine leaf wax n-alkane composition from Lake Steisslingen, Germany, which is located 300 km to the west of the Ammersee indicate a short lived warming interval of 50 years at ~12.2 ka BP (Schwark et al., 2002). Magny (2001) related lowest lake levels to the mid-Younger Dryas event that were observed for several lakes in the Swiss Plateau, the Jura Mountains and the French Pre-Alps including Lac d’Annecy. In contrast, sedimentological, palynological and geochemical data from Meerfelder Maar sediments indicate an abrupt change to clastic deposition after the first half of the YD that is however, ascribed to major hydrological changes within the drainage area of the tributaries to the lake (Brauer et al., 1999; Fuhrmann et al., 2004). Although the driving forces of each of these major depositional changes in the middle of the YD are yet not
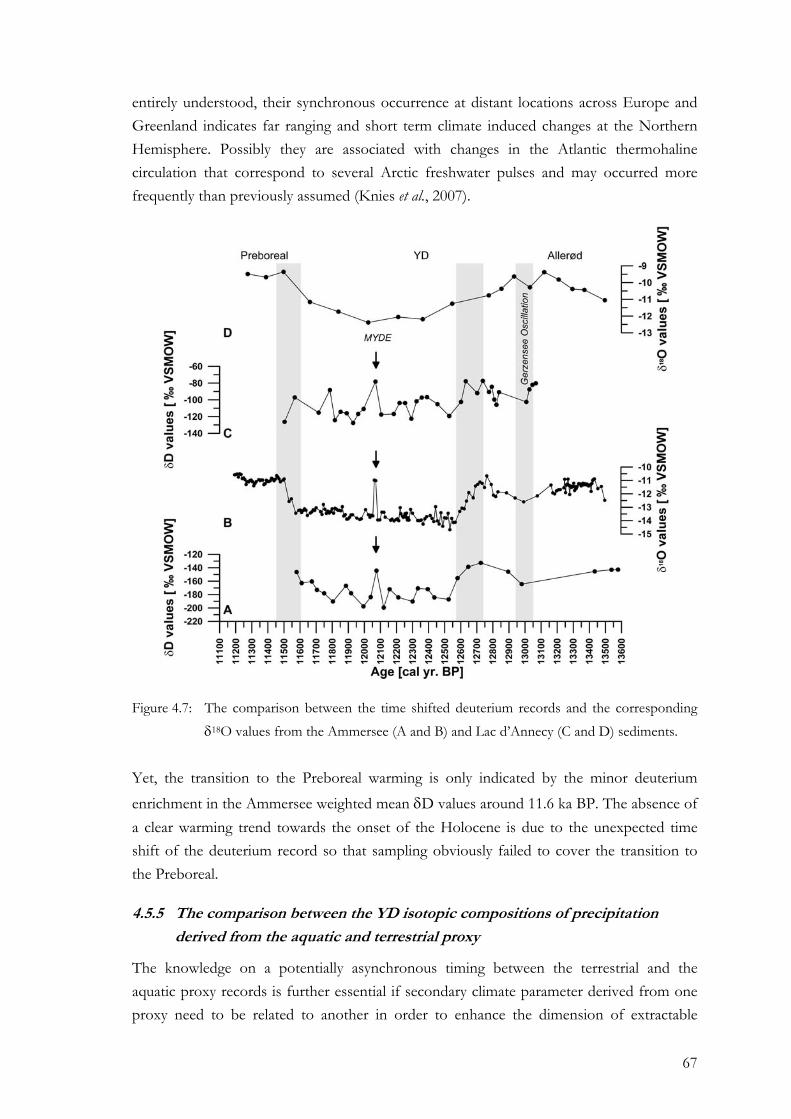
67
entirely understood, their synchronous occurrence at distant locations across Europe and Greenland indicates far ranging and short term climate induced changes at the Northern Hemisphere. Possibly they are associated with changes in the Atlantic thermohaline circulation that correspond to several Arctic freshwater pulses and may occurred more frequently than previously assumed (Knies et al., 2007).
Figure 4.7: The comparison between the time shifted deuterium records and the corresponding δ18O values from the Ammersee (A and B) and Lac d’Annecy (C and D) sediments.
Yet, the transition to the Preboreal warming is only indicated by the minor deuterium enrichment in the Ammersee weighted mean δD values around 11.6 ka BP. The absence of a clear warming trend towards the onset of the Holocene is due to the unexpected time shift of the deuterium record so that sampling obviously failed to cover the transition to the Preboreal.
4.5.5 The comparison between the YD isotopic compositions of precipitation
derived from the aquatic and terrestrial proxy
The knowledge on a potentially asynchronous timing between the terrestrial and the aquatic proxy records is further essential if secondary climate parameter derived from one proxy need to be related to another in order to enhance the dimension of extractable
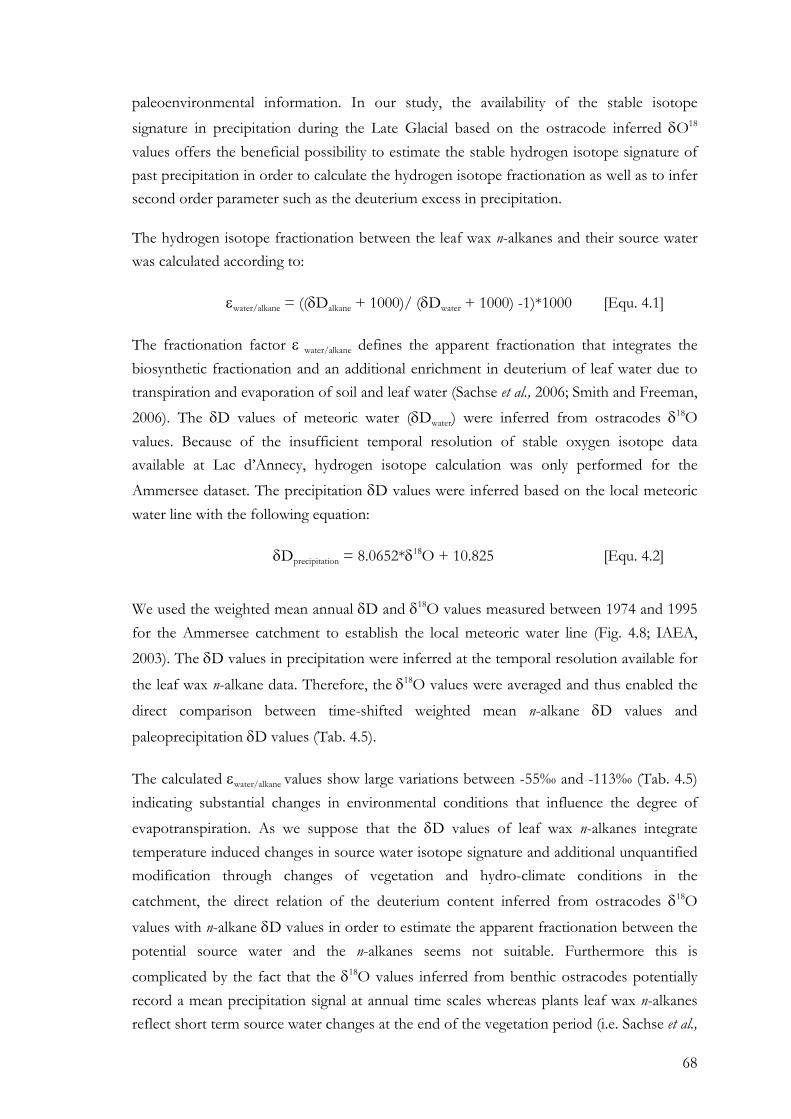
68
paleoenvironmental information. In our study, the availability of the stable isotope signature in precipitation during the Late Glacial based on the ostracode inferred δO18 values offers the beneficial possibility to estimate the stable hydrogen isotope signature of past precipitation in order to calculate the hydrogen isotope fractionation as well as to infer second order parameter such as the deuterium excess in precipitation.
The hydrogen isotope fractionation between the leaf wax n-alkanes and their source water was calculated according to:
εwater/alkane = ((δDalkane + 1000)/ (δDwater + 1000) -1)*1000 [Equ. 4.1]
The fractionation factor ε water/alkane defines the apparent fractionation that integrates the biosynthetic fractionation and an additional enrichment in deuterium of leaf water due to transpiration and evaporation of soil and leaf water (Sachse et al., 2006; Smith and Freeman, 2006). The δD values of meteoric water (δDwater) were inferred from ostracodes δ18O values. Because of the insufficient temporal resolution of stable oxygen isotope data available at Lac d’Annecy, hydrogen isotope calculation was only performed for the Ammersee dataset. The precipitation δD values were inferred based on the local meteoric water line with the following equation:
δDprecipitation = 8.0652*δ18O + 10.825 [Equ. 4.2]
We used the weighted mean annual δD and δ18O values measured between 1974 and 1995 for the Ammersee catchment to establish the local meteoric water line (Fig. 4.8; IAEA, 2003). The δD values in precipitation were inferred at the temporal resolution available for
the leaf wax n-alkane data. Therefore, the δ18O values were averaged and thus enabled the
direct comparison between time-shifted weighted mean n-alkane δD values and
paleoprecipitation δD values (Tab. 4.5).
The calculated εwater/alkane values show large variations between -55‰ and -113‰ (Tab. 4.5) indicating substantial changes in environmental conditions that influence the degree of evapotranspiration. As we suppose that the δD values of leaf wax n-alkanes integrate temperature induced changes in source water isotope signature and additional unquantified modification through changes of vegetation and hydro-climate conditions in the catchment, the direct relation of the deuterium content inferred from ostracodes δ18O
values with n-alkane δD values in order to estimate the apparent fractionation between the potential source water and the n-alkanes seems not suitable. Furthermore this is complicated by the fact that the δ18O values inferred from benthic ostracodes potentially record a mean precipitation signal at annual time scales whereas plants leaf wax n-alkanes reflect short term source water changes at the end of the vegetation period (i.e. Sachse et al.,
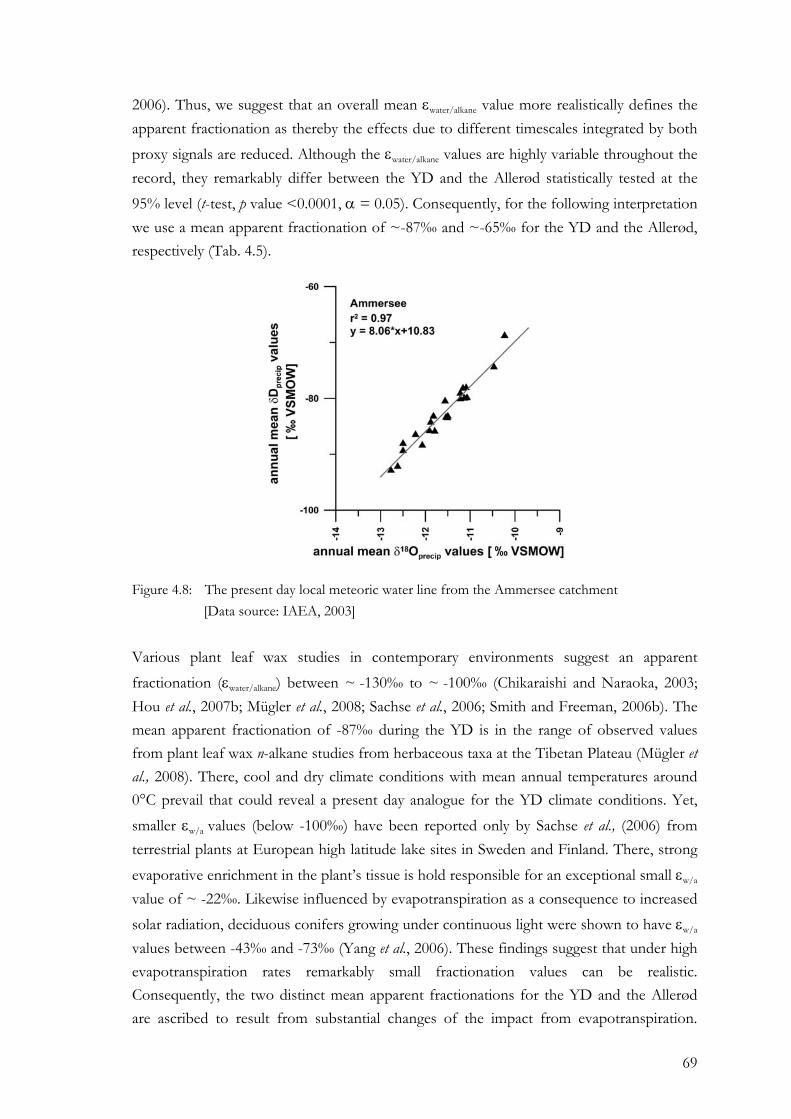
69
2006). Thus, we suggest that an overall mean εwater/alkane value more realistically defines the apparent fractionation as thereby the effects due to different timescales integrated by both proxy signals are reduced. Although the εwater/alkane values are highly variable throughout the record, they remarkably differ between the YD and the Allerød statistically tested at the 95% level (t-test, p value <0.0001, α = 0.05). Consequently, for the following interpretation we use a mean apparent fractionation of ~-87‰ and ~-65‰ for the YD and the Allerød, respectively (Tab. 4.5).
Figure 4.8: The present day local meteoric water line from the Ammersee catchment [Data source: IAEA, 2003]
Various plant leaf wax studies in contemporary environments suggest an apparent fractionation (εwater/alkane) between ~ -130‰ to ~ -100‰ (Chikaraishi and Naraoka, 2003; Hou et al., 2007b; Mügler et al., 2008; Sachse et al., 2006; Smith and Freeman, 2006b). The mean apparent fractionation of -87‰ during the YD is in the range of observed values from plant leaf wax n-alkane studies from herbaceous taxa at the Tibetan Plateau (Mügler et al., 2008). There, cool and dry climate conditions with mean annual temperatures around 0°C prevail that could reveal a present day analogue for the YD climate conditions. Yet, smaller εw/a values (below -100‰) have been reported only by Sachse et al., (2006) from terrestrial plants at European high latitude lake sites in Sweden and Finland. There, strong evaporative enrichment in the plant’s tissue is hold responsible for an exceptional small εw/a value of ~ -22‰. Likewise influenced by evapotranspiration as a consequence to increased solar radiation, deciduous conifers growing under continuous light were shown to have εw/a
values between -43‰ and -73‰ (Yang et al., 2006). These findings suggest that under high evapotranspiration rates remarkably small fractionation values can be realistic. Consequently, the two distinct mean apparent fractionations for the YD and the Allerød are ascribed to result from substantial changes of the impact from evapotranspiration.
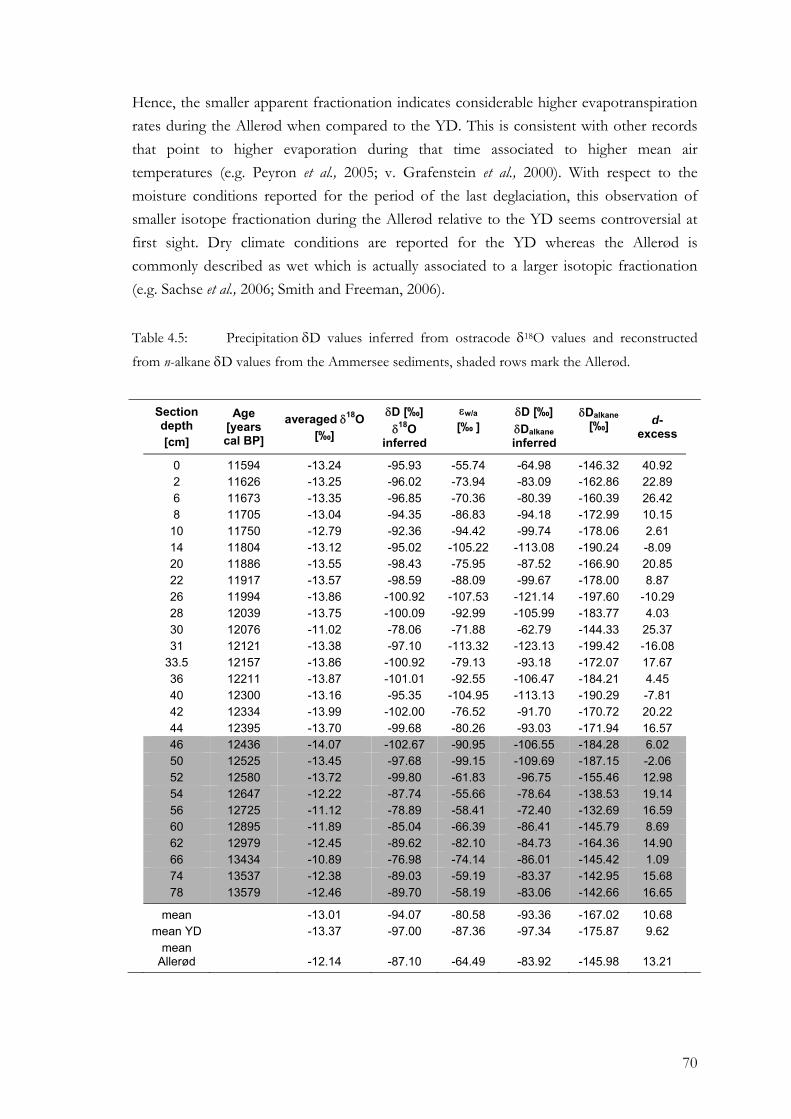
70
Hence, the smaller apparent fractionation indicates considerable higher evapotranspiration rates during the Allerød when compared to the YD. This is consistent with other records that point to higher evaporation during that time associated to higher mean air temperatures (e.g. Peyron et al., 2005; v. Grafenstein et al., 2000). With respect to the moisture conditions reported for the period of the last deglaciation, this observation of smaller isotope fractionation during the Allerød relative to the YD seems controversial at first sight. Dry climate conditions are reported for the YD whereas the Allerød is commonly described as wet which is actually associated to a larger isotopic fractionation (e.g. Sachse et al., 2006; Smith and Freeman, 2006).
Table 4.5: Precipitation δD values inferred from ostracode δ18O values and reconstructed
from n-alkane δD values from the Ammersee sediments, shaded rows mark the Allerød.
Section depth [cm]
Age [years cal BP]
averaged δ18O [‰]
δD [‰] δ18O
inferred
εw/a
[‰ ]
δD [‰] δDalkane inferred
δDalkane [‰]
d-excess
0 11594 -13.24 -95.93 -55.74 -64.98 -146.32 40.92 2 11626 -13.25 -96.02 -73.94 -83.09 -162.86 22.89 6 11673 -13.35 -96.85 -70.36 -80.39 -160.39 26.42 8 11705 -13.04 -94.35 -86.83 -94.18 -172.99 10.15 10 11750 -12.79 -92.36 -94.42 -99.74 -178.06 2.61 14 11804 -13.12 -95.02 -105.22 -113.08 -190.24 -8.09 20 11886 -13.55 -98.43 -75.95 -87.52 -166.90 20.85 22 11917 -13.57 -98.59 -88.09 -99.67 -178.00 8.87 26 11994 -13.86 -100.92 -107.53 -121.14 -197.60 -10.29 28 12039 -13.75 -100.09 -92.99 -105.99 -183.77 4.03 30 12076 -11.02 -78.06 -71.88 -62.79 -144.33 25.37 31 12121 -13.38 -97.10 -113.32 -123.13 -199.42 -16.08 33.5 12157 -13.86 -100.92 -79.13 -93.18 -172.07 17.67 36 12211 -13.87 -101.01 -92.55 -106.47 -184.21 4.45 40 12300 -13.16 -95.35 -104.95 -113.13 -190.29 -7.81 42 12334 -13.99 -102.00 -76.52 -91.70 -170.72 20.22 44 12395 -13.70 -99.68 -80.26 -93.03 -171.94 16.57 46 12436 -14.07 -102.67 -90.95 -106.55 -184.28 6.02 50 12525 -13.45 -97.68 -99.15 -109.69 -187.15 -2.06 52 12580 -13.72 -99.80 -61.83 -96.75 -155.46 12.98 54 12647 -12.22 -87.74 -55.66 -78.64 -138.53 19.14 56 12725 -11.12 -78.89 -58.41 -72.40 -132.69 16.59 60 12895 -11.89 -85.04 -66.39 -86.41 -145.79 8.69 62 12979 -12.45 -89.62 -82.10 -84.73 -164.36 14.90 66 13434 -10.89 -76.98 -74.14 -86.01 -145.42 1.09 74 13537 -12.38 -89.03 -59.19 -83.37 -142.95 15.68 78 13579 -12.46 -89.70 -58.19 -83.06 -142.66 16.65
mean -13.01 -94.07 -80.58 -93.36 -167.02 10.68 mean YD -13.37 -97.00 -87.36 -97.34 -175.87 9.62
mean Allerød -12.14 -87.10 -64.49 -83.92 -145.98 13.21
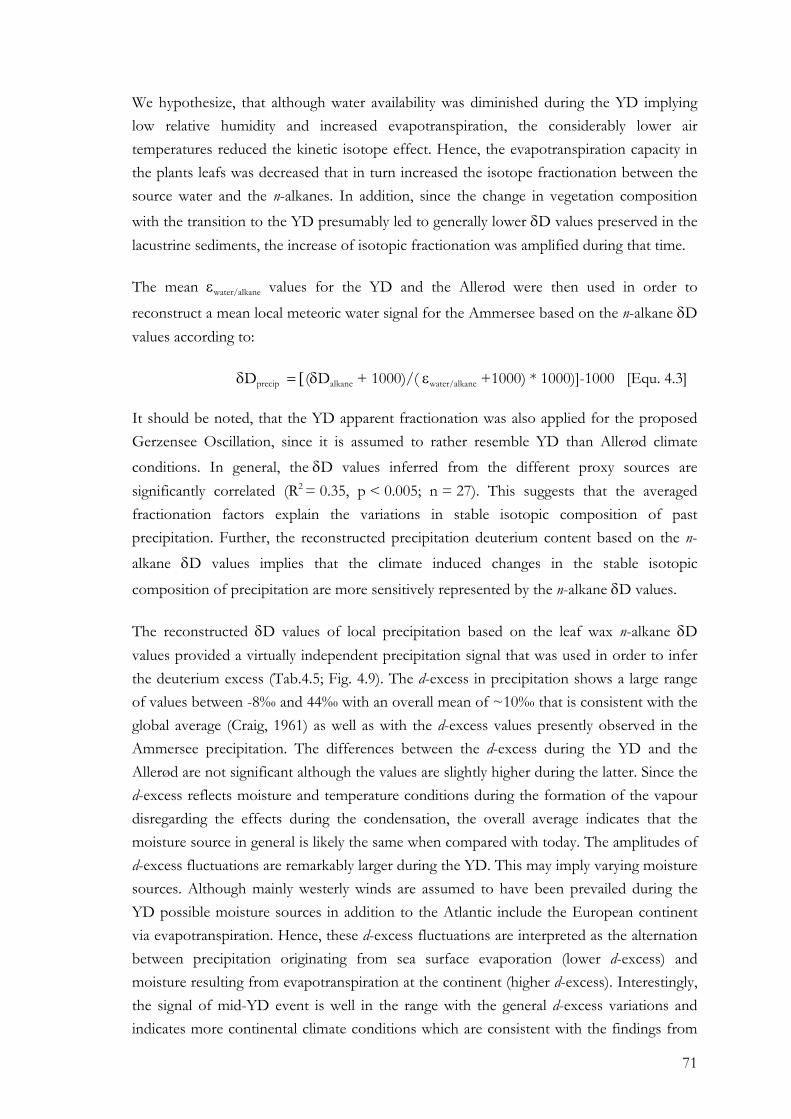
71
We hypothesize, that although water availability was diminished during the YD implying low relative humidity and increased evapotranspiration, the considerably lower air temperatures reduced the kinetic isotope effect. Hence, the evapotranspiration capacity in the plants leafs was decreased that in turn increased the isotope fractionation between the source water and the n-alkanes. In addition, since the change in vegetation composition with the transition to the YD presumably led to generally lower δD values preserved in the lacustrine sediments, the increase of isotopic fractionation was amplified during that time.
The mean εwater/alkane values for the YD and the Allerød were then used in order to
reconstruct a mean local meteoric water signal for the Ammersee based on the n-alkane δD values according to:
δDprecip = [(δDalkane + 1000)/( εwater/alkane +1000) * 1000)]-1000 [Equ. 4.3]
It should be noted, that the YD apparent fractionation was also applied for the proposed Gerzensee Oscillation, since it is assumed to rather resemble YD than Allerød climate conditions. In general, the δD values inferred from the different proxy sources are significantly correlated (R2 = 0.35, p < 0.005; n = 27). This suggests that the averaged fractionation factors explain the variations in stable isotopic composition of past precipitation. Further, the reconstructed precipitation deuterium content based on the n-alkane δD values implies that the climate induced changes in the stable isotopic
composition of precipitation are more sensitively represented by the n-alkane δD values.
The reconstructed δD values of local precipitation based on the leaf wax n-alkane δD values provided a virtually independent precipitation signal that was used in order to infer the deuterium excess (Tab.4.5; Fig. 4.9). The d-excess in precipitation shows a large range of values between -8‰ and 44‰ with an overall mean of ~10‰ that is consistent with the global average (Craig, 1961) as well as with the d-excess values presently observed in the Ammersee precipitation. The differences between the d-excess during the YD and the Allerød are not significant although the values are slightly higher during the latter. Since the d-excess reflects moisture and temperature conditions during the formation of the vapour disregarding the effects during the condensation, the overall average indicates that the moisture source in general is likely the same when compared with today. The amplitudes of d-excess fluctuations are remarkably larger during the YD. This may imply varying moisture sources. Although mainly westerly winds are assumed to have been prevailed during the YD possible moisture sources in addition to the Atlantic include the European continent via evapotranspiration. Hence, these d-excess fluctuations are interpreted as the alternation between precipitation originating from sea surface evaporation (lower d-excess) and moisture resulting from evapotranspiration at the continent (higher d-excess). Interestingly, the signal of mid-YD event is well in the range with the general d-excess variations and indicates more continental climate conditions which are consistent with the findings from
72
Lake Steisslingen (Schwark et al., 2002). If this holds true the processes that caused these far ranging and short term climate induced changes at the Northern Hemisphere are called into question as the mid-YD event is presumed to result from changes in North Atlantic circulation (e.g. v. Grafenstein et al., 1999). Thus, further research is needed to clarify the mechanisms responsible for the mid-YD event. In addition, recalling the leaf wax n-alkane δD values, they show a significantly higher response to this specific climate induced change in local precipitation isotopic composition. Therefore, this may suggest additional mechanisms at the site of moisture condensation that may have amplified their signal.
Figure 4.9: Leaf wax n-alkane δD values, precipitation δD values reconstructed from n-alkane
deuterium content (A) and inferred from ostracode δ18O values (B) and d-excess in precipitation.
4.6 Conclusions
The first records of stable hydrogen isotopes from lacustrine leaf wax n-alkanes at Ammersee and Lac d’Annecy provided knowledge on the timing of delivery processes of terrestrial biomarkers to their depositional site within the sedimentary record that is essential for paleoclimate studies based on organic matter of multiple sources. The comparison between δ18O values inferred from deep lake ostracods and terrestrial derived
n-alkane δD values revealed a time shift of 200 at Ammersee and 100 years at Lac d’Annecy. This time lag is interpreted as the site specific terrestrial residence time characterized as the period between the biosynthesis of a certain compound until its deposition within the sedimentary record. The comparison of the time shifted deuterium records with the corresponding δ18O values, spanning the time period from the Allerød to the Preboreal (13.6 ka to 11.1 ka BP), showed striking similarities between both proxy signals and suggests that δD values of leaf wax n-alkanes are suitable to reconstruct climate
73
induced changes of isotope composition in precipitation in the past. Furthermore, terrestrial leaf wax n-alkanes seem to respond even more sensitive to climate changes indicating their vast benefit for paleoclimate studies. Moreover, the mid-Younger Dryas event that is reflected as a short term positive excursion in the δ18O values at the Ammersee as well as in the Greenland ice cores is reflected in the deuterium records and thus, is described at Lac d’Annecy for the first time.
Finally, the comparison between the climate signals derived from two different proxy sources further improved the understanding of the paleoenvironmental information that is provided by n-alkane δD values. While the aquatic proxy only preserves the temperature
induced isotope changes in precipitation, the n-alkane δD values further integrate changes in vegetation composition and hydro-climate conditions. Based on the Ammersee and the Lac d’Annecy dataset, the temperature induced changes explain only about 50% of the variation in the deuterium content while the residual variation combines the influence of evapotranspiration and vegetation. The availability of precipitation δ18O values enabled to derive the d-excess in precipitation as second order climate parameter. This revealed substantial changes in moisture source areas during the YD alternating between moisture from the Atlantic in contrast to that from the European continent. The higher d-excess for mid-YD event points to moisture from the continent and thus calls into question the causes of the mid-YD event as a consequence of changes in North Atlantic circulation. The absence of a significant d-excess for mid-YD event implies the amplification of the response in n-alkane δD values due to processes acting locally on the site of atmospheric moisture condensation.
74
5 A multi-proxy approach to reconstruct hydrological changes and Holocene climate development of Nam Co, Central Tibet
Chapter 5
A multi-proxy approach to reconstruct hydrological changes and Holocene
climate development of Nam Co, Central Tibet
Chapter source: Mügler et al., 2008. A multi-proxy approach to reconstruct hydrological changes and Holocene climate development of Nam Co, Central Tibet. Journal of Paleolimnology. (submitted)
Abstract
Holocene lake level fluctuations were reconstructed from a 2.7 m long lacustrine sequence of a sediment core from Nam Co, Central Tibet, China dating back more than 7.2 cal. ka BP. The results were compared to existing lake records from the Tibetan Plateau in order to infer variations in the strength of the Asian Monsoon system.
Geomorphological features in the Nam Co catchment such as beach ridges and lake terraces point to lake level high stands in the Late Glacial. A major lake level low stand is suggested for the Last Glacial Maximum (LGM). Sands and sandy silts at the base of the core are the transgressive facies with material transported by melt water deposited during a rising lake level that followed this lake level low stand. The variations of environmental proxies including grain size, major elements, biomarker stable isotopes and minerals in the core suggest a climate evolution in at least five depositional units and subunits. Sediments in Unit I (~7.2 to ~5.8 cal ka BP) are assumed to be deposited at highest lake levels with regards to the analyzed sediment sequence. Increased amount of allogenic minerals and allochthonous organic matter suggest high precipitation and melt water input and imply a positive water balance. Continuous increasing aquatic productivity points to favorable environmental conditions. Unit II (~5.8 to ~4.2 cal ka BP) is the transition between these favorable and stable hydrological conditions and the onset of lake level decrease. Within this unit two remarkably drier periods with increased evaporation occurred around 5.75 cal ka BP and around 4.75 cal ka BP that lead to significant enrichment of lake water δD values. Significant lower lake levels as a consequence of a dryer climate with less monsoonal precipitation, higher evaporation rates and increased moisture recycling in the
75
catchment are reflected in the sediments of Unit III (~4.2 to ~1.75 cal ka BP). Most pronounced dry periods are recorded around 3.75 cal ka BP and 2 cal ka BP again leading to deuterium enrichment of aquatic n-alkanes. The proceeding lake shrinkage and salinisation was interrupted in the first section of Unit IV (~1.75 to ~750 cal years BP to ~400 cal years BP) where a continuous increase in precipitation and runoff led to an at least stable but still low lake level. The most recent Unit V (since 400 cal years BP) is characterized by progressing lake shrinkage due to intensive evaporation. Intermittent monsoonal precipitation events are reflected by large fluctuations in the geochemical parameters referring to alternating humid and arid periods at Nam Co. Actual hydrological parameter indicate that lake level is rising most recently.
Correlation with other lake records from the Tibetan Plateau suggests an overall agreement with the broader picture of Holocene environmental evolution. In addition, the timing of dry and wet climate conditions at various lakes across Tibet including the Nam Co record indicates the gradual decreasing influence of the southern monsoons during the Holocene along a NW to SE transect. Inconsistencies still exist concerning reliable chronologies. Thus, further research is needed to improve the spatiotemporal interpretation of hydrological variations in association with alternating monsoonal circulation across the Asian continent.
Keywords: paleolimnology, paleoclimatology, sedimentology, biomarker, deuterium, stable isotopes, n-alkane, monsoon, carbon, calcite
5.1 Introduction
Numerous studies on hydrological and climatological changes inferred from lake sediments on the entire Tibetan Plateau aimed to disentangle the spatial and temporal changes of monsoonal variations that are characterized by fluctuations in precipitation intensity and expansion of monsoonal air masses across the Plateau. Investigations focused mainly on the analysis of sedimentary facies (Morrill et al., 2006; Wu et al., 2006a; Wu et al., 2006b; Wünnemann et al., 2003; Zhai et al., 2006; Zhangdong Jin, 2001), their biological proxies (Gajurel et al., 2006; Herzschuh et al., 2006; Wu et al., 2007; Xie et al., 2003), palynology (Chen et al., 2006a; Chen et al., 2006b; Herzschuh et al., 2006; Jiang et al., 2006; Kaiser et al., 2007; Miehe et al., 2006; Xie et al., 2003; Zhangdong Jin, 2001; Zhou et al., 2005), geochemistry (Schettler et al., 2006; Wu et al., 2006b; Zhang et al., 2006), stable isotopes (Fan et al., 2007; Fleitmann et al., 2007; Garzione et al., 2004; Johnson and Ingram, 2004; Tian et al., 2007; Wu et al., 2006b; Xie et al., 2003; Xu et al., 2006a; Yamanaka et al., 2004) and paleoshoreline features (Chen et al., 2006a; Harris, 2006; Lehmkuhl et al., 2000; Meyers and Ishiwatari, 1993; Wu et al., 2006a). The broad picture of Holocene climate evolution is consistent and demonstrates that several warm, dry, wet or cold oscillations occurred but that their timing, duration as well as their amplitudes differed across the Tibetan Plateau. In
76
general, during the Late Glacial dry and cold conditions dominated with weak monsoonal circulation. With the onset of the Holocene environmental parameter changed and warmer and wetter climates prevailed. The monsoonal circulation strengthened in association with increasing precipitation, relative humidity and temperature. The early Holocene is consequently a period with lake level high stands and is often referred to as Holocene Climate Optimum. Thereafter, climate progressively changed towards drier conditions with shrinking lake levels. This is assumed to be a result of a decreasing intensity of monsoonal circulation implying decreased precipitation, relative humidity and temperature. The establishment of modern climate conditions is discussed controversial. While the general trend to aridity after 4.5 cal ka BP (Gasse et al., 1991) can be deduced from several records (Chen et al., 2006b; Morrill et al., 2006; Rhodes et al., 1996; Wu et al., 2006b; Wünnemann et al., 2003; Yancheva et al., 2007) other lakes such as Boston Lake in the NW part (Herzschuh, 2006; Wünnemann et al., 2006), do not display clear aridity trends in their hydrological balance. Also, stable isotopes records from Dunde and Guliya ice cores indicate a gradual warming but suggest wet conditions for the late Holocene (Thompson et al., 2006; Thompson et al., 2000b; Yao et al., 1997).
The establishment of a consistent picture of Holocene environmental and climate evolution on the Tibetan Plateau, so far, particularly lacks comparable climate records. All studies used various archives and are based on different temporal and spatial resolutions or age models as well as vary in their locations i.e. altitude, climate conditions and precipitation regimes, or (An et al., 2000; Morrill et al., 2003; Street-Perrott et al., 2004), (Morrill et al., 2003; Sun et al., 2006; Wu et al., 2006b; Xu and Zheng, 2003). Lake sediments are an excellent climate archive including different geochemical tracers from various sources within the whole catchment that potentially record environmental and hydrological changes controlled by climate variations (Anderson and Leng, 2004; Fuhrmann et al., 2003; Hassan et al., 1997; Leng and Marshall, 2004; Meyers and Lallier-Verges, 1999; Morrill et al., 2006; Routh et al., 2004; Talbot et al., 2006; Young and Harvey, 1992). Lacustrine deposits thus preserve both autochthonous organic matter and authigenic carbonates that reflect in-situ lake environmental conditions as well as allochthonous material that originates from terrestrial plants or authigenic minerals that are transported into the lake via the drainage system and indicate the broader regional perspective of climate evolution within the lake catchment.
In this study, lacustrine sediments were analysed based on a multi-proxy approach in order to assess the lake level changes at Nam Co, Central Tibetan Plateau. Lake level changes are amongst others attributed to alternating hydro-climatic conditions between pronounced humid and arid phases, respectively and are therefore considered as a regional indication of monsoon strength fluctuations (Lehmkuhl and Haselein, 2000; Mingram et al., 2004; Morrill, 2004; Zhai et al., 2006). First results deduced from the lacustrine record based on grain size distribution, major elements, stable isotopes and minerals are presented.
77
Furthermore, compound-specific hydrogen isotope ratios (expressed as δD values) on lacustrine n-alkanes were determined being a potentially promising means to reconstruct variations in the isotopic composition of continental precipitation and lake water both being influenced by atmospheric moisture source and evaporation. In contrast to numerous records of lake level change on the Tibetan Plateau, the Nam Co sediment core displays a continuous record with the focus on the dryer period during the Late Holocene which is often lacking due to disturbed deposition of lacustrine sediments (Morrill et al., 2006; Wu et al., 2006a). Thus, the short term hydrological changes during the last 7 ka that are especially controversially discussed are reflected with a comparable high temporal resolution providing new information on precipitation and evaporation history controlled by the strength of the Monsoon system.
In addition, the Nam Co lake level record was compared to existing lake records across the Tibetan Plateau to identify the spatiotemporal pattern of monsoonal circulation development during the Holocene.
5.2 Description of study site
Nam Co, the second largest, highest saline lake in China, is located in the central part (30°30’-35’N, 90°16’-91°03’E; 4722 m a.s.l.) of the Tibetan Plateau about 120 km north of the city of Lhasa (Fig. 5.1). The climate in this region is semi-arid to semi-humid continental and modified by altitude. The general geographical, climatological and limnological setting based on own investigations and (Wang and Zhu, 2006) is summarised in Tab. 5.1.
The superficially closed drainage basin is bordered by the Grandise Range in the South, the Nyainqentanglha Range in the Southeast and the Northern Tibetan Plateau hills in the North. Because Nam Co has no outflow its water balance is largely controlled by precipitation and inflow opposed to evaporation. Several streams mainly at the southeastern and southwestern lake margin drain into Nam Co and are associated to wetlands. Geologically, the Nam Co basin is located in the Lhasa block that was accreted during the Late Jurassic-Early Cretaceous (Kapp et al., 2005). Cretaceous-Tertiary granitoids and orthogneisses are exposed in the southern and southeastern part of the catchment together with Paleozoic to Cretaceous (Dykoski et al., 2005) metasediments of slate, phyllite, limestone and schists, red sandstone, mudstone and conglomerate. The Quaternary sediments consist of glacial, fluvial and lacustrine deposits (Zhang et al., 2006). The extent of the glaciers during the Quaternary is still under debate.
Major soil types of Nam Co basin are alpine steppe and desert soils dominating the northern lake side while more humid conditions due to the presence of several rivers lead to the formation of alpine and subalpine meadow soil and marshland soil on the southern bank of the lake (Gao, 1985).
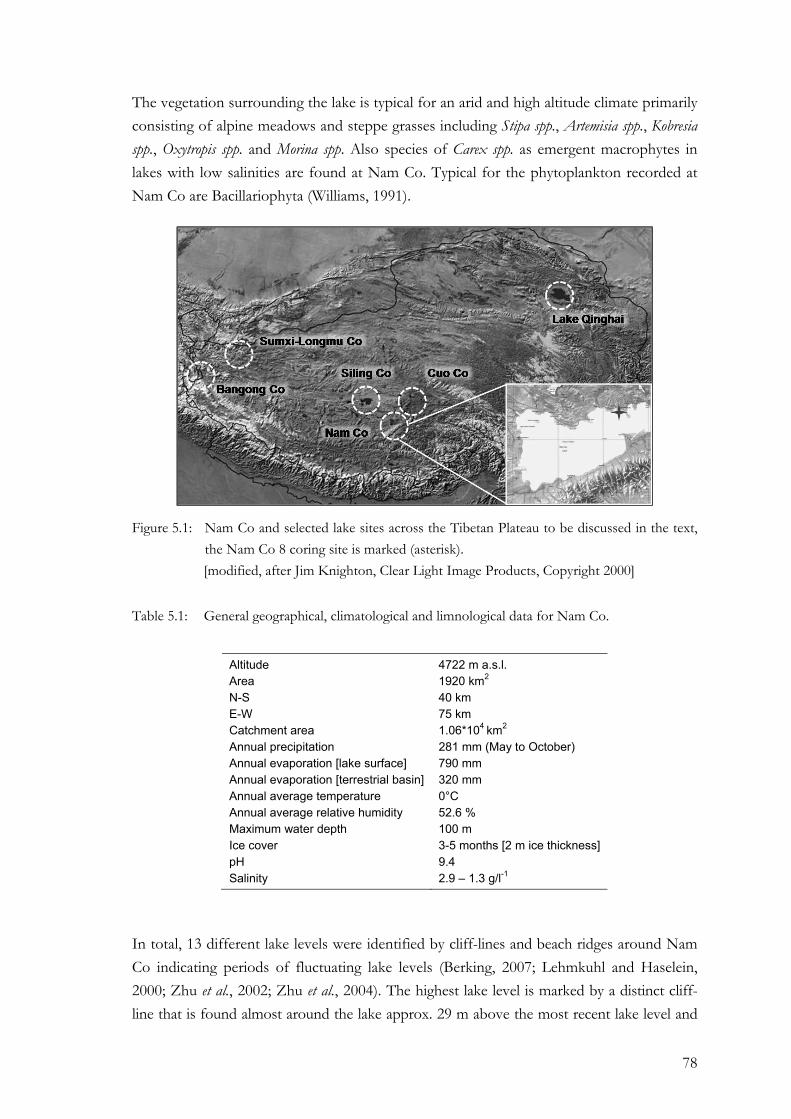
78
The vegetation surrounding the lake is typical for an arid and high altitude climate primarily consisting of alpine meadows and steppe grasses including Stipa spp., Artemisia spp., Kobresia spp., Oxytropis spp. and Morina spp. Also species of Carex spp. as emergent macrophytes in lakes with low salinities are found at Nam Co. Typical for the phytoplankton recorded at Nam Co are Bacillariophyta (Williams, 1991).
Figure 5.1: Nam Co and selected lake sites across the Tibetan Plateau to be discussed in the text, the Nam Co 8 coring site is marked (asterisk). [modified, after Jim Knighton, Clear Light Image Products, Copyright 2000]
Table 5.1: General geographical, climatological and limnological data for Nam Co.
Altitude 4722 m a.s.l. Area 1920 km2 N-S 40 km E-W 75 km Catchment area 1.06*104 km2 Annual precipitation 281 mm (May to October) Annual evaporation [lake surface] 790 mm Annual evaporation [terrestrial basin] 320 mm Annual average temperature 0°C Annual average relative humidity 52.6 % Maximum water depth 100 m Ice cover 3-5 months [2 m ice thickness] pH 9.4 Salinity 2.9 – 1.3 g/l-1
In total, 13 different lake levels were identified by cliff-lines and beach ridges around Nam Co indicating periods of fluctuating lake levels (Berking, 2007; Lehmkuhl and Haselein, 2000; Zhu et al., 2002; Zhu et al., 2004). The highest lake level is marked by a distinct cliff-line that is found almost around the lake approx. 29 m above the most recent lake level and
79
dated as Late Glacial. The Late Glacial and Holocene beach ridges are deposited on top of glacial till or older alluvial fans. Reactivation of channels after lake retreat resulted in the dissection of beach ridges and older fluvial deposits (Berking, 2007).
5.3 Material and Methods
5.3.1 Sampling and lithology
The sediment core Nam Co 8 was drilled from the north-eastern basin of Nam Co at 31 m water depth. The core was retrieved using a piston corer (UWITEC, Mondsee, Austria) and the upper 270 cm were analysed. After splitting, the core was photo-documented and immediately measured for magnetic susceptibility with a high resolution (1 mm steps) using a Bartington MS2E surface scanning sensor (Bartington, Oxford, England) at the geoecological-sedimentological laboratory of the University of Jena, Germany. The core shows a lithology with coarse sandy material at the base (yet not analysed) followed by a 100 cm thick dark-greyish layered sequence of silty clay or silt that indicates partly anoxic conditions due to insufficient mixing of the water body. These layered sediments gradually change in colour from dark grey in the lower to light grey in the upper part. A dark grey 20 cm thick layer with coarse material terminates this sequence at a core depth of about 80 cm. The dark colour is ascribed to a high amount of clastic material derived from the direct surrounding of the lake. The uppermost part of the core consists again of dark and light grey layered clays or silty clays indicating reductive conditions during their deposition.
5.3.2 Sedimentological and geochemical analyses
One half of the core was completely sampled with 1 cm slices. Subsequent analyses were applied to samples every five and every two centimeters, respectively, resulting in 135 samples in total. All samples were freeze dried and ground for geochemical and biochemical analyses. The samples for grain-size analyses were treated with HCL (15%) and H2O2 (15%, 30%) to remove carbonates and the organic matter, respectively (according to DIN 19683). The grain size was determined with a Beckmann Coulter Laser Diffraction Particle Size Analyser (LS 13320).
The total contents of major elements (Na, K, Mg, Fe, Mn, Ca, CaCO3, Sr, Al, P) as well as major elements within the carbonates (Ca, Mg, Sr) mainly incorporated in ostracode valves in the sediments were analysed after microwave extraction by a modified aqua regia digestion and by digestion with HCl for the carbonate fraction. Both digestions were measured with an atomic absorption spectrometer (Shimadzu AA 6800). Because of the limited available material each sample was digested only once. Thus, regular measurements against laboratory standards ensured the instruments accuracy. Relative analytical errors range between 2 to 10% depending on the element. Total carbon (TC), total organic carbon (TOC), total nitrogen (TN) and total sulphur (TS) were determined with an elemental analyser (Vario EL) (Utermann et al., 2000). The detection limit for CNS analyses
80
is depending on the element between 0.02 and 0.05%. CaCO3 content was calculated from the measured TC and TOC assuming that all carbonates are formed of calcite.
The mineralogical composition was specified for powder samples by X-Ray-Diffraction (PW1710, Philipps,) using a copper kα-tube from 2-52 °2θ with steps of 0.01 °2θ and each step measured for two seconds at the Physical Geography laboratory, Department of Earth Sciences, FU-Berlin. Contents of mineral components are quantitatively derived from diffraction-intensity and the area framed by the peak using the software Philipps X’Pert HighScore. Accuracy of measurement and detection limits are specific to minerals. Accuaracy of measurement averages 0.05°2θ for quartz. Detection limit depends next to instrument setting on location of the major diffraction peak d100, sample preparation and quality of grinding stock (particle size). For gypsum with the location of the major diffraction peak d100 at 11,6 °2θ detection limit totals 5 volume-%, for pyrite with the
location of the major diffraction peak d100 at 33,10 and 56,40 °2θ detection limit totals 1 volume % (Jenkins and Snyder, 1996; Klug and Alexander, 1974).
Stable hydrogen and carbon isotope analyses were performed for Nam Co 8 at 10 cm intervals. Initially, δ13C was determined at the bulk organic matter using an isotope ratio mass spectrometer (IRMS, Deltaplus, Finnigan MAT, Bremen, Germany). The sediment was freeze dried and ground. Between 1 to 2 g dry sediment was used for lipid extraction that was performed with an accelerated solvent extractor (ASE-200, DIONEX Corp., Sunnydale, USA). The ASE was operated with a CHCl2/MeOH (10:1) mixture at 100°C and 2,000 psi for 15 min in 2 cycles. Activated copper granules were added to the total lipids in order to quantitatively remove elemental sulphur. The separation of carboxylic acids and the high polarity fraction was carried out by column chromatography with KOH-silica gel according to (McCarthy and Duthie, 1962). The low polarity fraction was further separated using a Medium Pressure Liquid Chromatography (MPLC) with hexane as the only eluent (Radke et al., 1980). A pre-column was filled with deactivated silica gel where the neutral fraction was injected on. Aliphatic hydrocarbons were collected after they passed through a main column at a constant flow rate of 8 ml/min. Elution of aromatic hydrocarbons was carried out by back flushing the main column. The alcohol fraction that remained on the pre-column was eluted with DCM/MeOH (93/7). Volume reduction was performed with a turbo vaporizer (Zymark).
Identification and quantification of the n-alkanes was performed using a GC-FID (TraceGC, ThermoElectron, Rodano, Italy) by comparison to an external n-alkane standard mixture (nC10 to nC31). The GC was equipped with aDB5 column (30 m, 0.32 mm ID, 0.5 μm film thickness, Agilent, Palo Alto, USA). The injector (PTV) was operated at 280 °C at a constant temperature mode and a split ratio of 1:10. Temperature was held at 80°C for 2 minutes, and then ramped to 320°C at 8°C minute-1. The oven was held at final
81
temperatures for 5 minutes. The column flow was constant throughout the whole run at 1.8 ml minute-1.
Stable isotopes (δD and δ13C) were determined at terrestrially and aquatically derived sedimentary n-alkanes using a coupled GC-IRMS system (HP5890 GC, Agilent Technologies, Palo Alto USA; IRMS: Deltaplus XL, Finnigan MAT, Bremen, Germany). The alkane fraction dissolved in hexane was injected (1 μl) into a HP5890 GC, equipped with a DB1m column (50 m, 0.32 mm ID, 0.52 μm film thickness, Agilent). The injector was operated at 280°C in the splitless mode. The oven was maintained for 1 minute at 50°C, heated with 9°C minute-1 to 308°C and held there for 2 minutes and finally ramped to 320°C at 20° minute-1 and held at its final temperature for 3 minutes. The column flow was constant at 1.7 ml/min. To monitor possible co-elution of n-alkanes with other components part of the column effluent went to an ion trap mass spectrometer (GCQ ThermoElectron, San Jose, USA). The remainder of the split went to an isotope mass spectrometer, via quantitative conversion to H2 in a high-temperature oven operated at 1,425°C (Burgoyne and Hayes, 1998; Hilkert et al., 1999). Compound-specific δD values were obtained using isotope ratio mass spectrometry (IRMS; Finnigan MAT Bremen, Germany DeltaplusXL). Each sample was analysed in triplicate. The isotopic composition of the samples is reported in the conventional δ-notation in per mil relative to the VSMOW and VPDB standard for hydrogen and carbon:
1000]/)[()‰()( tantan132 ×−= dardsdardssamplesample RRRCH δδ [Equ. 5.1]
where R is the 2H/1H and 13C/12C ratio of the sample and the standard, respectively. The values in the standard mixture were calibrated against international reference substances (NBS-22; IAEA-OH22) using the offline high temperature pyrolysis technique (TC/EA) (Gehre et al., 2004). The accuracy was evaluated using routine measurement of the standard mixture after every six injections (two samples). If necessary, a drift correction was applied. To ensure stable ion source conditions during measurement the H3+ factor (Hilkert et al., 1999) was determined at least once a day; it was constant over the 10 days measurement period at 5.4 (SD 1.4).
Rock Eval analysis of the powdered sediment (1 mg) was carried out on a VINCI Rock Eval II instrument applying standard methods at the organic geochemical laboratory in the Institute for Geology and Mineralogy, Cologne University (Espitalie et al., 1985). Results are expressed as the conventional Hydrogen Index (HI – mg hydrocarbons per g TOC) and Oxygen Index (OI – mg Carbon dioxide per g TOC).
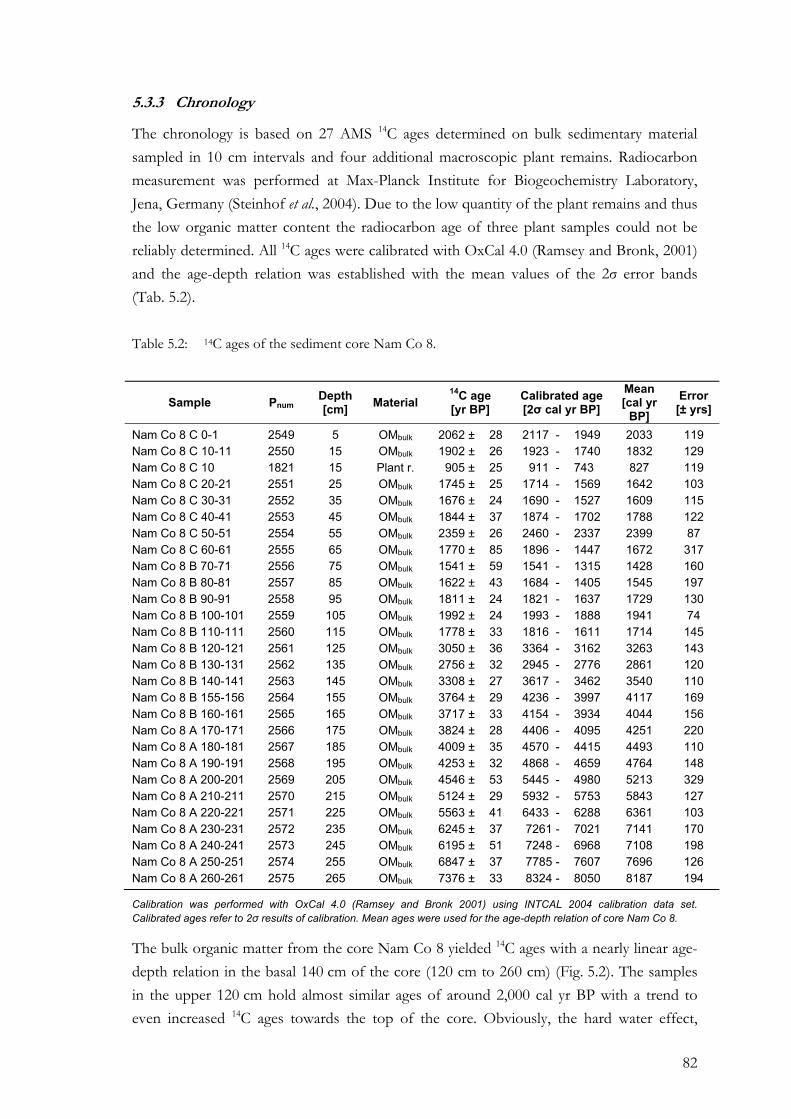
82
5.3.3 Chronology
The chronology is based on 27 AMS 14C ages determined on bulk sedimentary material sampled in 10 cm intervals and four additional macroscopic plant remains. Radiocarbon measurement was performed at Max-Planck Institute for Biogeochemistry Laboratory, Jena, Germany (Steinhof et al., 2004). Due to the low quantity of the plant remains and thus the low organic matter content the radiocarbon age of three plant samples could not be reliably determined. All 14C ages were calibrated with OxCal 4.0 (Ramsey and Bronk, 2001) and the age-depth relation was established with the mean values of the 2σ error bands (Tab. 5.2).
Table 5.2: 14C ages of the sediment core Nam Co 8.
Sample Pnum Depth [cm] Material
14C age [yr BP]
Calibrated age [2σ cal yr BP]
Mean [cal yr
BP] Error [± yrs]
Nam Co 8 C 0-1 2549 5 OMbulk 2062 ± 28 2117 - 1949 2033 119 Nam Co 8 C 10-11 2550 15 OMbulk 1902 ± 26 1923 - 1740 1832 129 Nam Co 8 C 10 1821 15 Plant r. 905 ± 25 911 - 743 827 119 Nam Co 8 C 20-21 2551 25 OMbulk 1745 ± 25 1714 - 1569 1642 103 Nam Co 8 C 30-31 2552 35 OMbulk 1676 ± 24 1690 - 1527 1609 115 Nam Co 8 C 40-41 2553 45 OMbulk 1844 ± 37 1874 - 1702 1788 122 Nam Co 8 C 50-51 2554 55 OMbulk 2359 ± 26 2460 - 2337 2399 87 Nam Co 8 C 60-61 2555 65 OMbulk 1770 ± 85 1896 - 1447 1672 317 Nam Co 8 B 70-71 2556 75 OMbulk 1541 ± 59 1541 - 1315 1428 160 Nam Co 8 B 80-81 2557 85 OMbulk 1622 ± 43 1684 - 1405 1545 197 Nam Co 8 B 90-91 2558 95 OMbulk 1811 ± 24 1821 - 1637 1729 130 Nam Co 8 B 100-101 2559 105 OMbulk 1992 ± 24 1993 - 1888 1941 74 Nam Co 8 B 110-111 2560 115 OMbulk 1778 ± 33 1816 - 1611 1714 145 Nam Co 8 B 120-121 2561 125 OMbulk 3050 ± 36 3364 - 3162 3263 143 Nam Co 8 B 130-131 2562 135 OMbulk 2756 ± 32 2945 - 2776 2861 120 Nam Co 8 B 140-141 2563 145 OMbulk 3308 ± 27 3617 - 3462 3540 110 Nam Co 8 B 155-156 2564 155 OMbulk 3764 ± 29 4236 - 3997 4117 169 Nam Co 8 B 160-161 2565 165 OMbulk 3717 ± 33 4154 - 3934 4044 156 Nam Co 8 A 170-171 2566 175 OMbulk 3824 ± 28 4406 - 4095 4251 220 Nam Co 8 A 180-181 2567 185 OMbulk 4009 ± 35 4570 - 4415 4493 110 Nam Co 8 A 190-191 2568 195 OMbulk 4253 ± 32 4868 - 4659 4764 148 Nam Co 8 A 200-201 2569 205 OMbulk 4546 ± 53 5445 - 4980 5213 329 Nam Co 8 A 210-211 2570 215 OMbulk 5124 ± 29 5932 - 5753 5843 127 Nam Co 8 A 220-221 2571 225 OMbulk 5563 ± 41 6433 - 6288 6361 103 Nam Co 8 A 230-231 2572 235 OMbulk 6245 ± 37 7261 - 7021 7141 170 Nam Co 8 A 240-241 2573 245 OMbulk 6195 ± 51 7248 - 6968 7108 198 Nam Co 8 A 250-251 2574 255 OMbulk 6847 ± 37 7785 - 7607 7696 126 Nam Co 8 A 260-261 2575 265 OMbulk 7376 ± 33 8324 - 8050 8187 194
Calibration was performed with OxCal 4.0 (Ramsey and Bronk 2001) using INTCAL 2004 calibration data set. Calibrated ages refer to 2σ results of calibration. Mean ages were used for the age-depth relation of core Nam Co 8.
The bulk organic matter from the core Nam Co 8 yielded 14C ages with a nearly linear age-depth relation in the basal 140 cm of the core (120 cm to 260 cm) (Fig. 5.2). The samples in the upper 120 cm hold almost similar ages of around 2,000 cal yr BP with a trend to even increased 14C ages towards the top of the core. Obviously, the hard water effect,
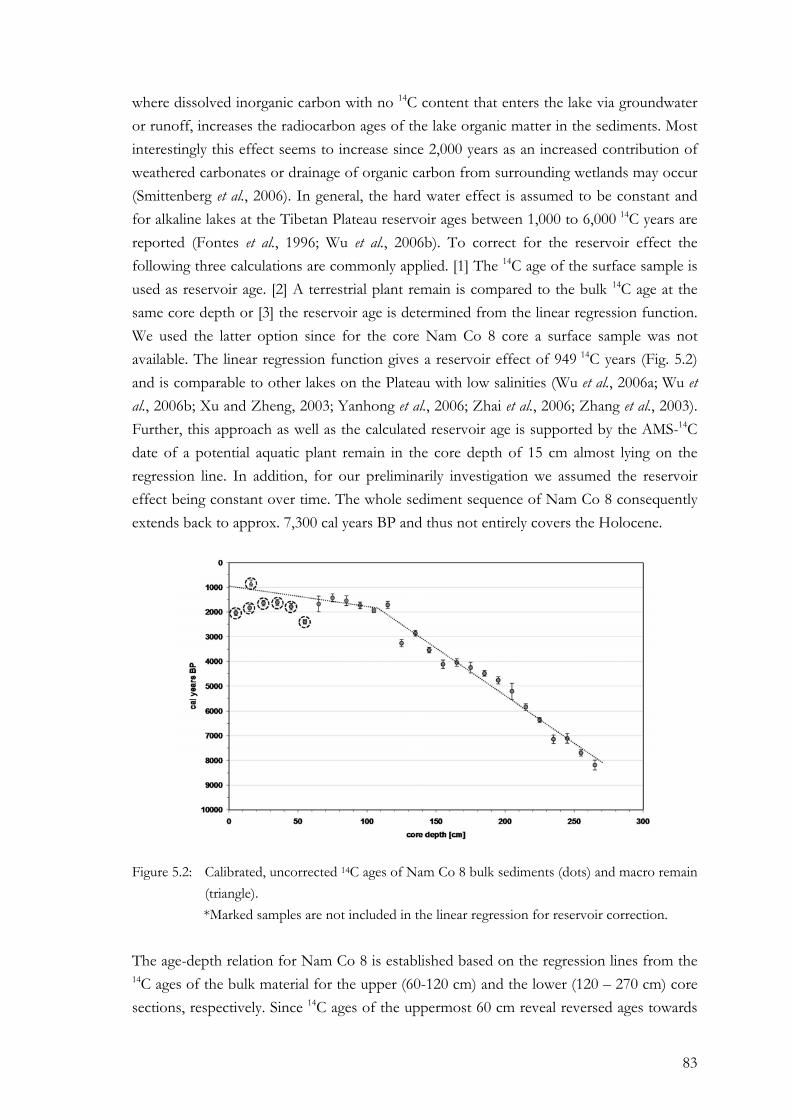
83
where dissolved inorganic carbon with no 14C content that enters the lake via groundwater or runoff, increases the radiocarbon ages of the lake organic matter in the sediments. Most interestingly this effect seems to increase since 2,000 years as an increased contribution of weathered carbonates or drainage of organic carbon from surrounding wetlands may occur (Smittenberg et al., 2006). In general, the hard water effect is assumed to be constant and for alkaline lakes at the Tibetan Plateau reservoir ages between 1,000 to 6,000 14C years are reported (Fontes et al., 1996; Wu et al., 2006b). To correct for the reservoir effect the following three calculations are commonly applied. [1] The 14C age of the surface sample is used as reservoir age. [2] A terrestrial plant remain is compared to the bulk 14C age at the same core depth or [3] the reservoir age is determined from the linear regression function. We used the latter option since for the core Nam Co 8 core a surface sample was not available. The linear regression function gives a reservoir effect of 949 14C years (Fig. 5.2) and is comparable to other lakes on the Plateau with low salinities (Wu et al., 2006a; Wu et al., 2006b; Xu and Zheng, 2003; Yanhong et al., 2006; Zhai et al., 2006; Zhang et al., 2003). Further, this approach as well as the calculated reservoir age is supported by the AMS-14C date of a potential aquatic plant remain in the core depth of 15 cm almost lying on the regression line. In addition, for our preliminarily investigation we assumed the reservoir effect being constant over time. The whole sediment sequence of Nam Co 8 consequently extends back to approx. 7,300 cal years BP and thus not entirely covers the Holocene.
Figure 5.2: Calibrated, uncorrected 14C ages of Nam Co 8 bulk sediments (dots) and macro remain (triangle). *Marked samples are not included in the linear regression for reservoir correction.
The age-depth relation for Nam Co 8 is established based on the regression lines from the 14C ages of the bulk material for the upper (60-120 cm) and the lower (120 – 270 cm) core sections, respectively. Since 14C ages of the uppermost 60 cm reveal reversed ages towards
84
the top of the core they are assumed to be affected by changes in the reservoir effect and thus are omitted for the calculation of the age model of the Nam Co sediments. A second sediment core retrieved at a water depth of 60 m also showed reversed ages towards the top of the core and thus supports our assumption of a changing reservoir effect that will need further investigation (Zhu et al., 2007).
Sedimentation rates for the basal part is lower with values of 0.26 mm/a compared to the last 1,000 cal years BP with 1.19 mm/a. Consequently, 1 cm samples integrate 8.4 and 38.4 years, respectively.
5.4 Results
5.4.1 Sediment stratigraphy
In general, the grain sizes are uniformly distributed in the analysed lacustrine sequence of core Nam Co 8 with greyish silty deposits dominating the whole sequence (Fig. 5.3). However, two major units can be roughly distinguished based on the grain size distribution. The lower core section where clayey material makes up to 25 % of the sediments and the upper core section starting from 2.5 cal ka BP with decreasing clay content consisting of mainly silty material. Sand occasionally increases but never makes up more than 15 % of the grain sizes. Magnetic susceptibility increases where the sand content is higher. The notable peaks at around 1.5 cal ka BP and 4 cal ka BP are not reflected in the grain sizes distribution or do not appear contemporaneously since they are determined with significantly lower resolution. At the bottom of the core a basal sandy part characterized as melt water sediments is associated. Within this study only the upper clayey-silt dominated sequence was considered. However, correlations with other core material as well as seismic investigation suggest that this basal sandy part was deposited under significantly different conditions. The coarse grained part of the sequence can be traced within the whole Nam Co and is interpreted as a Late Glacial “transgressive” facies deposited during the lake level rise following the major lake level low stand during the Last Glacial Maximum (LGM). The lake level high stand is further documented by the highest beach ridges in the surrounding of Nam Co. Thus, the analysed core section of Nam Co 8 represents the onset and following evolution of a lacustrine period of Nam Co possibly after a desiccation of the lake at this specific locality.
5.4.2 Bulk geochemical parameters and stable isotopes (TC, TOC, TN, HI, OI)
Bulk geochemical parameters are used for the qualitative understanding of hydrological conditions of lake systems as well as variation of primary production that are finally associated to climatic changes in the catchment (Fig. 5.4). The Nam Co sediments reveal total carbon (TC) contents between 5 and 9 %. Total organic carbon (TOC) is significantly lower with values ranging between 1 and 3 %. Both parameters do not show a parallel trend with depth indicating that variations in TC are mainly due to major changes in
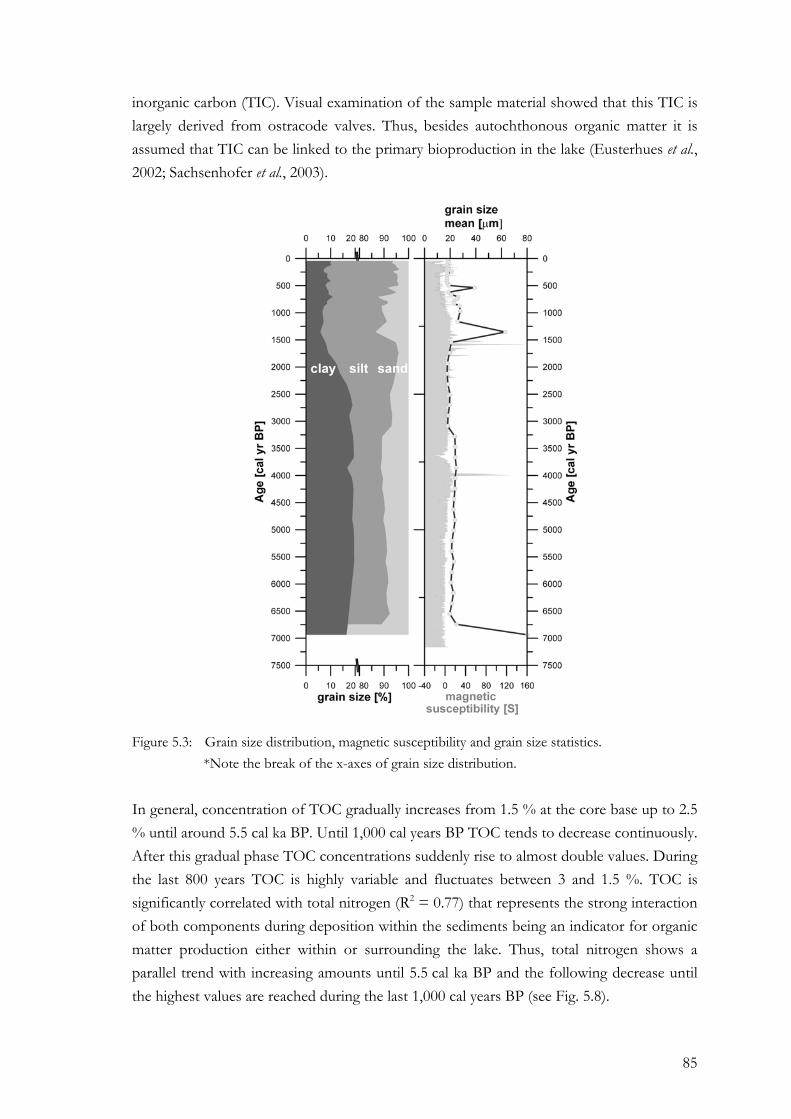
85
inorganic carbon (TIC). Visual examination of the sample material showed that this TIC is largely derived from ostracode valves. Thus, besides autochthonous organic matter it is assumed that TIC can be linked to the primary bioproduction in the lake (Eusterhues et al., 2002; Sachsenhofer et al., 2003).
Figure 5.3: Grain size distribution, magnetic susceptibility and grain size statistics. *Note the break of the x-axes of grain size distribution.
In general, concentration of TOC gradually increases from 1.5 % at the core base up to 2.5 % until around 5.5 cal ka BP. Until 1,000 cal years BP TOC tends to decrease continuously. After this gradual phase TOC concentrations suddenly rise to almost double values. During the last 800 years TOC is highly variable and fluctuates between 3 and 1.5 %. TOC is significantly correlated with total nitrogen (R2 = 0.77) that represents the strong interaction of both components during deposition within the sediments being an indicator for organic matter production either within or surrounding the lake. Thus, total nitrogen shows a parallel trend with increasing amounts until 5.5 cal ka BP and the following decrease until the highest values are reached during the last 1,000 cal years BP (see Fig. 5.8).
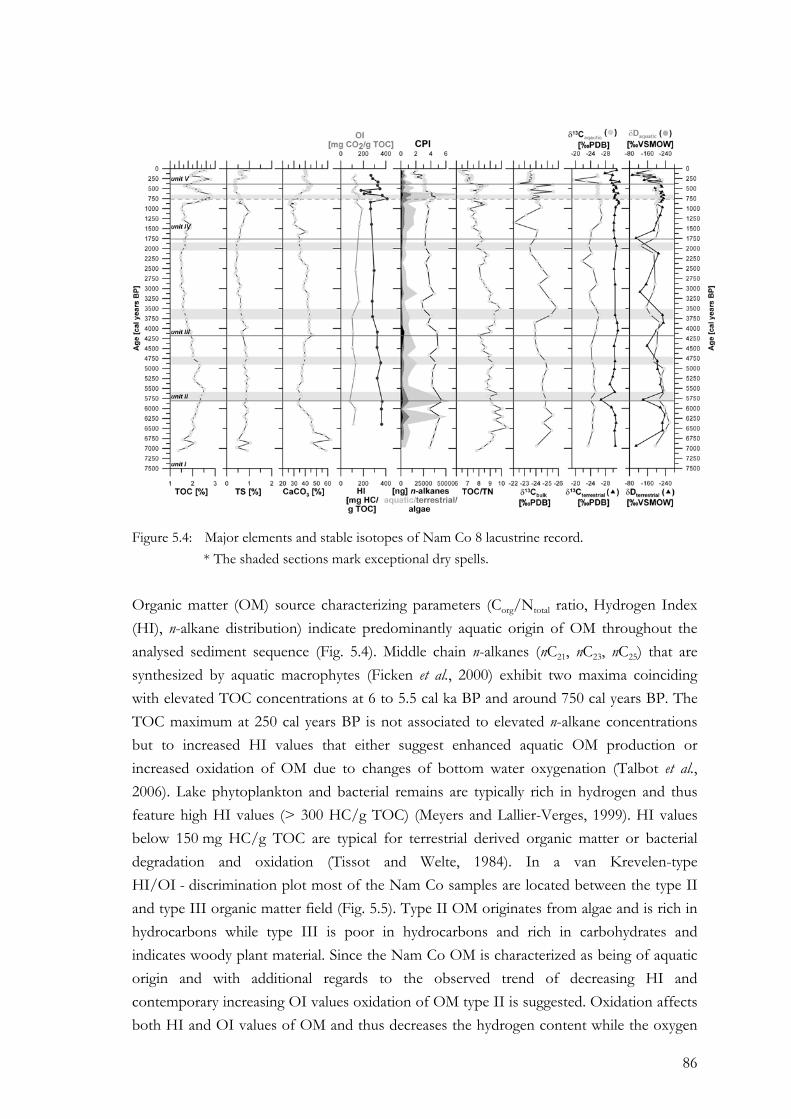
86
Figure 5.4: Major elements and stable isotopes of Nam Co 8 lacustrine record. * The shaded sections mark exceptional dry spells.
Organic matter (OM) source characterizing parameters (Corg/Ntotal ratio, Hydrogen Index (HI), n-alkane distribution) indicate predominantly aquatic origin of OM throughout the analysed sediment sequence (Fig. 5.4). Middle chain n-alkanes (nC21, nC23, nC25) that are synthesized by aquatic macrophytes (Ficken et al., 2000) exhibit two maxima coinciding with elevated TOC concentrations at 6 to 5.5 cal ka BP and around 750 cal years BP. The TOC maximum at 250 cal years BP is not associated to elevated n-alkane concentrations but to increased HI values that either suggest enhanced aquatic OM production or increased oxidation of OM due to changes of bottom water oxygenation (Talbot et al., 2006). Lake phytoplankton and bacterial remains are typically rich in hydrogen and thus feature high HI values (> 300 HC/g TOC) (Meyers and Lallier-Verges, 1999). HI values below 150 mg HC/g TOC are typical for terrestrial derived organic matter or bacterial degradation and oxidation (Tissot and Welte, 1984). In a van Krevelen-type HI/OI - discrimination plot most of the Nam Co samples are located between the type II and type III organic matter field (Fig. 5.5). Type II OM originates from algae and is rich in hydrocarbons while type III is poor in hydrocarbons and rich in carbohydrates and indicates woody plant material. Since the Nam Co OM is characterized as being of aquatic origin and with additional regards to the observed trend of decreasing HI and contemporary increasing OI values oxidation of OM type II is suggested. Oxidation affects both HI and OI values of OM and thus decreases the hydrogen content while the oxygen
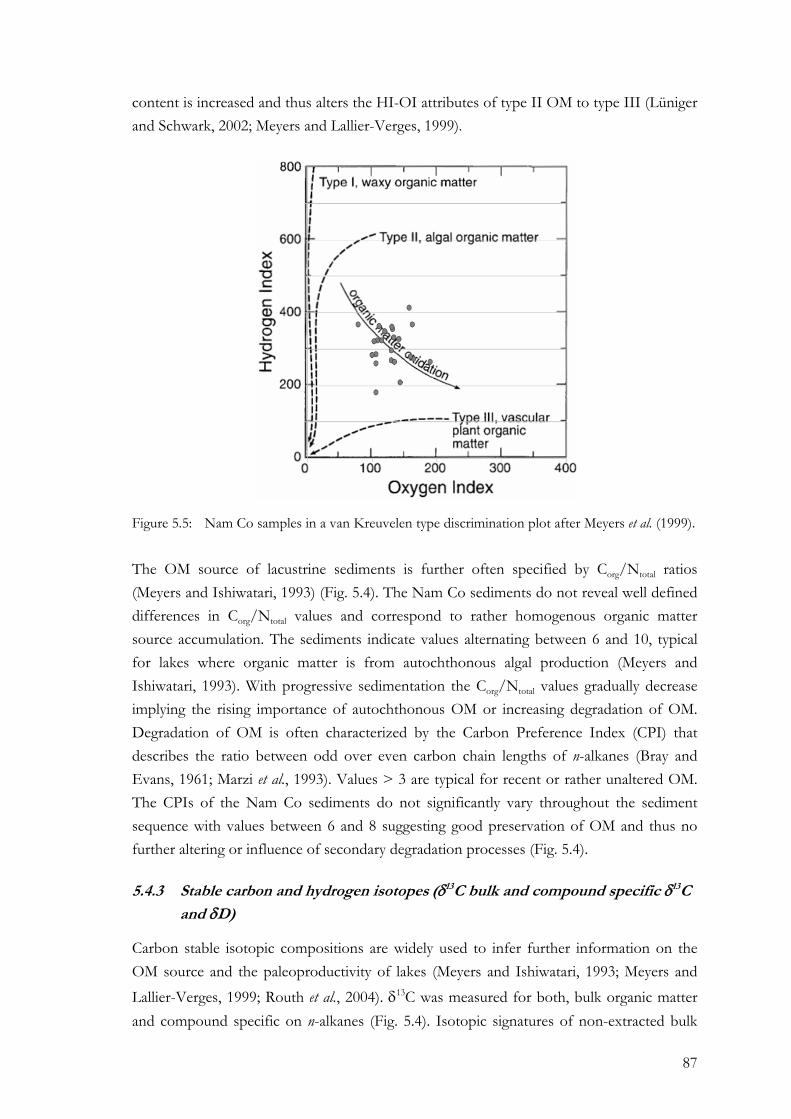
87
content is increased and thus alters the HI-OI attributes of type II OM to type III (Lüniger and Schwark, 2002; Meyers and Lallier-Verges, 1999).
Figure 5.5: Nam Co samples in a van Kreuvelen type discrimination plot after Meyers et al. (1999).
The OM source of lacustrine sediments is further often specified by Corg/Ntotal ratios (Meyers and Ishiwatari, 1993) (Fig. 5.4). The Nam Co sediments do not reveal well defined differences in Corg/Ntotal values and correspond to rather homogenous organic matter source accumulation. The sediments indicate values alternating between 6 and 10, typical for lakes where organic matter is from autochthonous algal production (Meyers and Ishiwatari, 1993). With progressive sedimentation the Corg/Ntotal values gradually decrease implying the rising importance of autochthonous OM or increasing degradation of OM. Degradation of OM is often characterized by the Carbon Preference Index (CPI) that describes the ratio between odd over even carbon chain lengths of n-alkanes (Bray and Evans, 1961; Marzi et al., 1993). Values > 3 are typical for recent or rather unaltered OM. The CPIs of the Nam Co sediments do not significantly vary throughout the sediment sequence with values between 6 and 8 suggesting good preservation of OM and thus no further altering or influence of secondary degradation processes (Fig. 5.4).
5.4.3 Stable carbon and hydrogen isotopes (δ13C bulk and compound specific δ13C
and δD)
Carbon stable isotopic compositions are widely used to infer further information on the OM source and the paleoproductivity of lakes (Meyers and Ishiwatari, 1993; Meyers and Lallier-Verges, 1999; Routh et al., 2004). δ13C was measured for both, bulk organic matter and compound specific on n-alkanes (Fig. 5.4). Isotopic signatures of non-extracted bulk
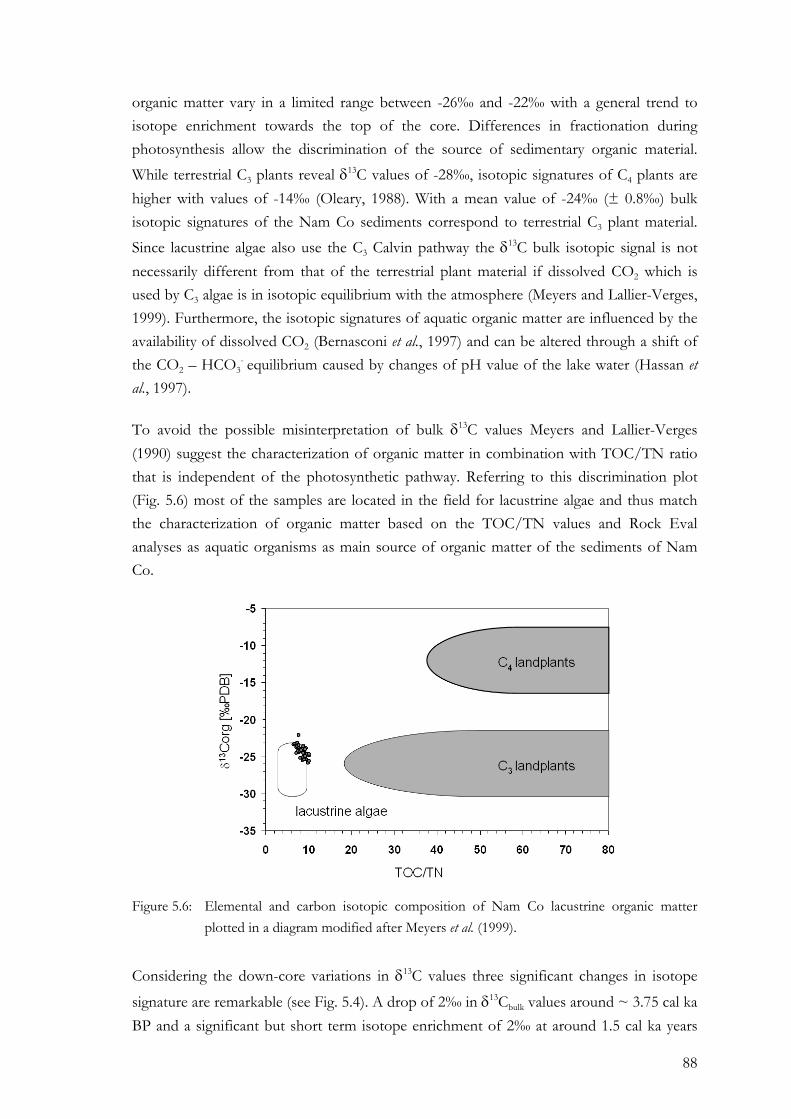
88
organic matter vary in a limited range between -26‰ and -22‰ with a general trend to isotope enrichment towards the top of the core. Differences in fractionation during photosynthesis allow the discrimination of the source of sedimentary organic material. While terrestrial C3 plants reveal δ13C values of -28‰, isotopic signatures of C4 plants are higher with values of -14‰ (Oleary, 1988). With a mean value of -24‰ (± 0.8‰) bulk isotopic signatures of the Nam Co sediments correspond to terrestrial C3 plant material. Since lacustrine algae also use the C3 Calvin pathway the δ13C bulk isotopic signal is not necessarily different from that of the terrestrial plant material if dissolved CO2 which is used by C3 algae is in isotopic equilibrium with the atmosphere (Meyers and Lallier-Verges, 1999). Furthermore, the isotopic signatures of aquatic organic matter are influenced by the availability of dissolved CO2 (Bernasconi et al., 1997) and can be altered through a shift of the CO2 – HCO3
- equilibrium caused by changes of pH value of the lake water (Hassan et al., 1997).
To avoid the possible misinterpretation of bulk δ13C values Meyers and Lallier-Verges (1990) suggest the characterization of organic matter in combination with TOC/TN ratio that is independent of the photosynthetic pathway. Referring to this discrimination plot (Fig. 5.6) most of the samples are located in the field for lacustrine algae and thus match the characterization of organic matter based on the TOC/TN values and Rock Eval analyses as aquatic organisms as main source of organic matter of the sediments of Nam Co.
Figure 5.6: Elemental and carbon isotopic composition of Nam Co lacustrine organic matter plotted in a diagram modified after Meyers et al. (1999).
Considering the down-core variations in δ13C values three significant changes in isotope
signature are remarkable (see Fig. 5.4). A drop of 2‰ in δ13Cbulk values around ~ 3.75 cal ka BP and a significant but short term isotope enrichment of 2‰ at around 1.5 cal ka years
89
BP. Afterwards δ13C values fluctuate around the mean value (~ 24.5‰) whereas amplitudes become significantly smaller during the last 400 years. For the 13C enrichment we either assume an increase in pH value of lake water and salinity in consequence of a lower lake level that reduced the concentration of dissolved CO2 in the lake water and lead to a change of metabolism of photosynthetic aquatic plants from CO2
- to HCO3- (Smith and
Walker, 1980). Simultaneously, enhanced productivity could have caused the enrichment of the carbon pool in the water in 13C leading to higher δ13C values of dissolved organic
carbon and consequently enriched plant δ13C values (Leng et al., 2006). Lower δ13C values could thus be a result of wetter climate conditions that cause an influx of depleted soil-derived CO2.
In addition, the δ13C values were determined compound-specific on n-alkanes (see Fig. 5.4). Referring to the distribution of n-alkanes in lake surrounding vegetation and aquatic plant material (Mügler et al., 2008) we distinguish between n-alkanes of terrestrial (nC27-nC31) and of aquatic origin (nC21–nC25) and thus the corresponding δ13C signal. Terrestrial n-alkanes
exhibit mean δ13C values around -30±1 ‰ whereas aquatic n-alkanes show enriched values around -25 ±1.5 ‰. These values are consistent with previous studies (Chikaraishi and Naraoka, 2003; Collister et al., 1994). The 13C enrichment in aquatic plants is known to result from the use of enriched HCO-
3 for carbon fixation when dissolved CO2 in the lake water is low (Hayes, 1993; Keeley and Sandquist, 1992). Thus, the carbon isotope signal from the medium chain n-alkanes is assumed to reflect the availability of bicarbonate and dissolved CO2 to the aquatic plant biomass.
In addition, δ13C values of aquatic and terrestrial n-alkanes are not correlated giving further evidence that both groups of plants used different carbon sources during photosynthesis. The mean carbon isotope ratios of the bulk organic matter are well in the range of δ13C values of aquatic n-alkanes and thus additionally approve the assumption of a dominant aquatic source of organic matter in the Nam Co sediments. Both isotope signal show comparable down core variations until around 1.5 cal ka BP where δ13C values of aquatic n-alkanes become significantly depleted by ~3‰ and keep this lower level until the core top except of a short-term positive excursion around 300 cal yr. BP. Down core variations in 13C of terrestrial derived n-alkanes are less pronounced suggesting that vegetation composition did not change during the last 7 cal ka BP dominated by C3 plants.
Furthermore, compound-specific δD values were measured on terrestrial and aquatic n-alkanes being widely used as a promising proxy to reconstruct paleoclimatic and paleohydrologic conditions (Huang et al., 2004; Ohkouchi et al., 1997; Pagani et al., 2006; Sachse et al., 2004; Schefuss et al., 2005; Shuman et al., 2006; Xie et al., 2004). We assumed that hydrogen isotope signatures of terrestrial plants reflect environmental conditions such as precipitation source and amount, air temperature, relative humidity or altitude
90
(Dansgaard, 1964; Huang et al., 2004; Rozanski et al., 1992; Sachse et al., 2004). In addition, evapotranspiration leads to deuterium enrichment in plants as well as in soil waters under arid climates and thus, δD values of terrestrial plants are indicative for the balance between precipitation and evaporation on land (Sachse et al., 2006; Sauer et al., 2001; Smith and Freeman, 2006b). Aquatic plants use the ambient lake water as hydrogen source. Since Nam Co has no outflow the δD value of lake water is primarily controlled by the balance between inflow through precipitation or melt water and evaporation.
The ranges of compound-specific stable hydrogen isotope ratios for terrestrial and aquatic n-alkanes are comparable with mean values around -195±40 ‰ and -200±30 ‰, respectively (see Fig. 5.4). Both show large variations up to 100 ‰ throughout the sediment sequence. These large changes are assumed to either indicate changes in the moisture source or precipitation regime alternating between monsoonal rains and convective rains through moisture recycling or variations between pronounced arid or humid climate conditions. The δD values of the aquatic n-alkanes show a trend to isotope enrichment towards the top of the core which is observed for terrestrial n-alkanes only during the last 300 years. It is remarkable that both the terrestrial and the aquatic δD values follow the same down core variations but reveal a significant time lag. The terrestrially derived n-alkanes record the isotope changes behind the aquatic n-alkanes. We assume that processes controlling the transport of terrestrial organic material to be decelerated leading to a delayed record of the terrestrial climate signal within the lacustrine sequence. This time lag has to be taken into account for the comparison of the aquatic and terrestrial stable isotope signal. If this assumption holds true, terrestrial n-alkanes are enriched in deuterium relative to the aquatic n-alkanes throughout the whole record except for the period between 1.3 cal ka BP and 350 cal yr. BP.
5.4.4 Mineralogical composition
Concentrations of quartz and silicates in the lake deposits are predominantly of allochthonous origin eroded from the catchment and transported by suspended load (Fig. 5.7). Quartz and feldspar are mainly formed in magmatic rocks. Calcite is derived from weathering of calcium-bearing feldspars (hydrolysis). Higher water temperatures and increased pH values lower its solubility leading to the precipitation and sedimentation of calcite. High amounts of calcite may also be produced by biomineralization. In general, the concentrations of quartz and silicates reflect the allochthonous input into the lake that represents the magnitude and variability of external environmental processes e.g. weathering, runoff or erosion within the catchment. Authigenic formation of different forms of calcite and pyrite reflects changes of the lake itself such as water chemistry, temperature and salinity. At Nam Co calcite is also likely to be produced by ostracoda, mollusca, eubacteria or cyanobacteria. A fairly uncommon mineral monohydrocalcite (MHC) appears initially around 1.5 cal ka BP and retains constant concentrations until
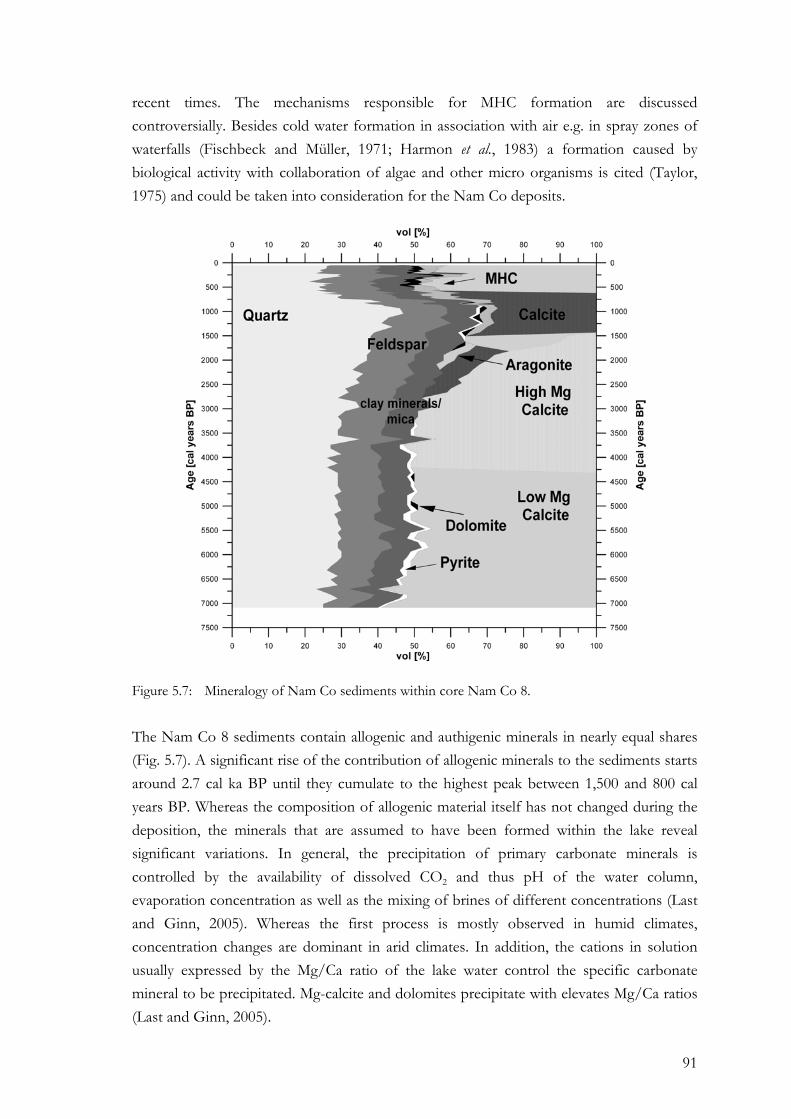
91
recent times. The mechanisms responsible for MHC formation are discussed controversially. Besides cold water formation in association with air e.g. in spray zones of waterfalls (Fischbeck and Müller, 1971; Harmon et al., 1983) a formation caused by biological activity with collaboration of algae and other micro organisms is cited (Taylor, 1975) and could be taken into consideration for the Nam Co deposits.
Figure 5.7: Mineralogy of Nam Co sediments within core Nam Co 8.
The Nam Co 8 sediments contain allogenic and authigenic minerals in nearly equal shares (Fig. 5.7). A significant rise of the contribution of allogenic minerals to the sediments starts around 2.7 cal ka BP until they cumulate to the highest peak between 1,500 and 800 cal years BP. Whereas the composition of allogenic material itself has not changed during the deposition, the minerals that are assumed to have been formed within the lake reveal significant variations. In general, the precipitation of primary carbonate minerals is controlled by the availability of dissolved CO2 and thus pH of the water column, evaporation concentration as well as the mixing of brines of different concentrations (Last and Ginn, 2005). Whereas the first process is mostly observed in humid climates, concentration changes are dominant in arid climates. In addition, the cations in solution usually expressed by the Mg/Ca ratio of the lake water control the specific carbonate mineral to be precipitated. Mg-calcite and dolomites precipitate with elevates Mg/Ca ratios (Last and Ginn, 2005).
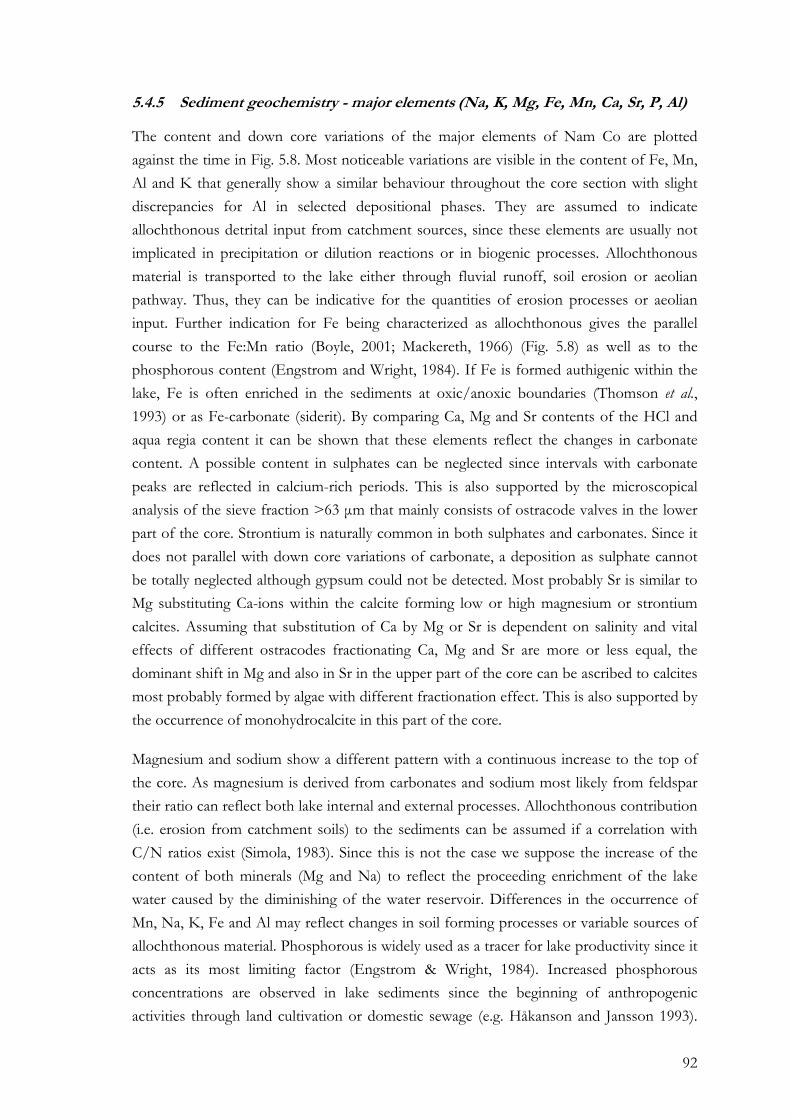
92
5.4.5 Sediment geochemistry - major elements (Na, K, Mg, Fe, Mn, Ca, Sr, P, Al)
The content and down core variations of the major elements of Nam Co are plotted against the time in Fig. 5.8. Most noticeable variations are visible in the content of Fe, Mn, Al and K that generally show a similar behaviour throughout the core section with slight discrepancies for Al in selected depositional phases. They are assumed to indicate allochthonous detrital input from catchment sources, since these elements are usually not implicated in precipitation or dilution reactions or in biogenic processes. Allochthonous material is transported to the lake either through fluvial runoff, soil erosion or aeolian pathway. Thus, they can be indicative for the quantities of erosion processes or aeolian input. Further indication for Fe being characterized as allochthonous gives the parallel course to the Fe:Mn ratio (Boyle, 2001; Mackereth, 1966) (Fig. 5.8) as well as to the phosphorous content (Engstrom and Wright, 1984). If Fe is formed authigenic within the lake, Fe is often enriched in the sediments at oxic/anoxic boundaries (Thomson et al., 1993) or as Fe-carbonate (siderit). By comparing Ca, Mg and Sr contents of the HCl and aqua regia content it can be shown that these elements reflect the changes in carbonate content. A possible content in sulphates can be neglected since intervals with carbonate peaks are reflected in calcium-rich periods. This is also supported by the microscopical analysis of the sieve fraction >63 μm that mainly consists of ostracode valves in the lower part of the core. Strontium is naturally common in both sulphates and carbonates. Since it does not parallel with down core variations of carbonate, a deposition as sulphate cannot be totally neglected although gypsum could not be detected. Most probably Sr is similar to Mg substituting Ca-ions within the calcite forming low or high magnesium or strontium calcites. Assuming that substitution of Ca by Mg or Sr is dependent on salinity and vital effects of different ostracodes fractionating Ca, Mg and Sr are more or less equal, the dominant shift in Mg and also in Sr in the upper part of the core can be ascribed to calcites most probably formed by algae with different fractionation effect. This is also supported by the occurrence of monohydrocalcite in this part of the core.
Magnesium and sodium show a different pattern with a continuous increase to the top of the core. As magnesium is derived from carbonates and sodium most likely from feldspar their ratio can reflect both lake internal and external processes. Allochthonous contribution (i.e. erosion from catchment soils) to the sediments can be assumed if a correlation with C/N ratios exist (Simola, 1983). Since this is not the case we suppose the increase of the content of both minerals (Mg and Na) to reflect the proceeding enrichment of the lake water caused by the diminishing of the water reservoir. Differences in the occurrence of Mn, Na, K, Fe and Al may reflect changes in soil forming processes or variable sources of allochthonous material. Phosphorous is widely used as a tracer for lake productivity since it acts as its most limiting factor (Engstrom & Wright, 1984). Increased phosphorous concentrations are observed in lake sediments since the beginning of anthropogenic activities through land cultivation or domestic sewage (e.g. Håkanson and Jansson 1993).
93
Within the sediment core P gradually increases. Sources of phosphorous within the catchment from bedrock weathering can be neglected. Thus, besides the natural atmospheric deposition the increasing phosphorous content is ascribed to the increasing importance of human activities within the study area which is especially significant during the last 400 cal years BP.
Figure 5.8: Major geochemical data of Nam Co 8 sediments.
5.4.6 Hydrological changes inferred from Nam Co lake sediments
With respect to the down core variations of the above described geochemical and mineralogical parameters (Fig. 5.4, 5.7, 5.8, 5.9) we divided the core section of Nam Co 8 into five distinct depositional units. The sedimentation of the analysed Nam Co 8 deposits started at least at 7,237±193 cal years BP where the maximum lake level within this sequence is assumed. The proximate deposition occurred under continuous shrinking of the lake with increasing salinity.
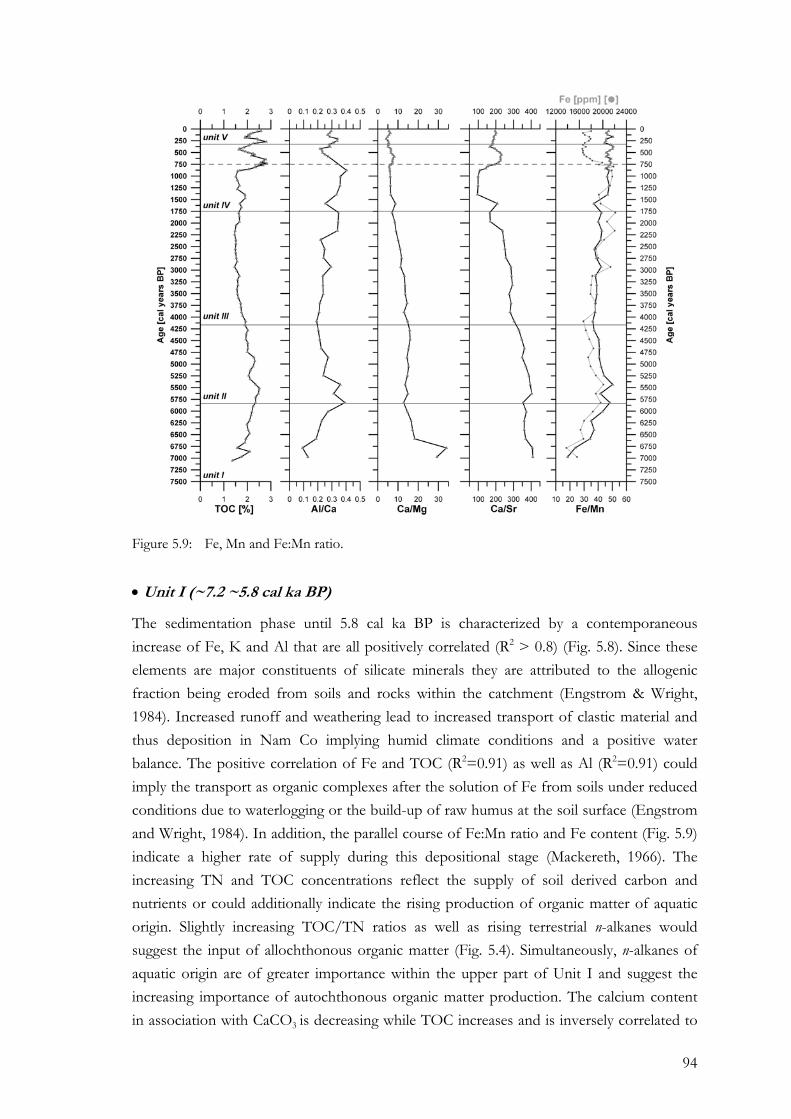
94
Figure 5.9: Fe, Mn and Fe:Mn ratio.
• Unit I (~7.2 ~5.8 cal ka BP)
The sedimentation phase until 5.8 cal ka BP is characterized by a contemporaneous increase of Fe, K and Al that are all positively correlated (R2 > 0.8) (Fig. 5.8). Since these elements are major constituents of silicate minerals they are attributed to the allogenic fraction being eroded from soils and rocks within the catchment (Engstrom & Wright, 1984). Increased runoff and weathering lead to increased transport of clastic material and thus deposition in Nam Co implying humid climate conditions and a positive water balance. The positive correlation of Fe and TOC (R2=0.91) as well as Al (R2=0.91) could imply the transport as organic complexes after the solution of Fe from soils under reduced conditions due to waterlogging or the build-up of raw humus at the soil surface (Engstrom and Wright, 1984). In addition, the parallel course of Fe:Mn ratio and Fe content (Fig. 5.9) indicate a higher rate of supply during this depositional stage (Mackereth, 1966). The increasing TN and TOC concentrations reflect the supply of soil derived carbon and nutrients or could additionally indicate the rising production of organic matter of aquatic origin. Slightly increasing TOC/TN ratios as well as rising terrestrial n-alkanes would suggest the input of allochthonous organic matter (Fig. 5.4). Simultaneously, n-alkanes of aquatic origin are of greater importance within the upper part of Unit I and suggest the increasing importance of autochthonous organic matter production. The calcium content in association with CaCO3 is decreasing while TOC increases and is inversely correlated to
95
TIC or CaCO3, respectively, which could be attributed to biological activity leading to an increased production of respiratory CO2 that increases calcite solubility (Hakanson and Jansson, 1983). Low-Mg calcite is precipitated during this stage (Fig. 5.7) which is assumed to be less soluble compared to the other carbonate minerals aragonite, calcite and high-Mg calcite additionally implying low pH values and increased dissolved CO2 concentrations in the lake water as well as comparably low Mg/Ca ratios (Müller et al., 1972). Alternatively, increased water supply either as melt water from surrounding glaciers or as runoff due to higher precipitation could have led to the dilution of the minerals. Hydrogen isotope ratios of the aquatic n-alkanes are most depleted in deuterium during this unit also suggesting large input of water from an isotopically light source such as melt water or intensive monsoonal rains (Fig. 5.4). Further, a positive water balance with precipitation that exceeded evaporation rates is reflected by the hydrogen isotope enrichment of precipitation relative to the lake water. Aquatic and terrestrial n-alkane δD values show a parallel course during this unit (R2=0.89). This implies fast transport of allochthonous material. Sedimentation during Unit I occurred under the highest lake levels with respect to the analysed sequence of Nam Co 8 sediment core. A positive water balance is assumed that implies humid climate conditions with pronounced monsoonal precipitation and increased contribution of fluvial runoff and potential melt water input to the lake.
• Unit II (~5.8 to ~4.2 cal ka BP)
During this depositional stage most of the analysed elements and minerals display minor variations or exhibit a constant down core course. Only Fe, Al and K significantly decrease which is attributed to a reduced input of terrestrial material from the catchment mobilized either from soils or through weathering of rocks (Fig. 5.8). We characterize this period as more or less stable with respect to the lake level although the slight increase of sodium, calcium and manganese may suggest a diminishing of the water volume, probably increasing salinity and the enrichment of these elements within the sediments. Low-Mg calcite is again the carbonate mineral to be precipitated (Fig. 5.7). This indicates that the environmental conditions within the lake did not significantly change during this Unit II and low Mg/Ca ratios (<2) are assumed for the lake water (Müller et al., 1972). We suggest that lake hydrology and chemistry were controlled by decreased precipitation or melt water inflow that reduced erosion input into the lake. In consequence the lake water volume declined and the lake level decrease started. Possibly associated were higher air temperatures and increased radiation since the enrichment of δD values of both n-alkanes of terrestrial and aquatic origin, respectively point to higher evaporation rates (Fig. 5.4). Besides the gradual trend of hydrogen isotope enrichment that is observed towards the top of the Nam Co 8 core section, two phases of significant enrichment in deuterium of the lake water are visible. Around 5.75 cal ka BP aquatic n-alkanes become enriched in deuterium by about 25‰. Terrestrial n-alkanes reveal a positive excursion with even 75‰ increased δD values. Both, in-lake and catchment environmental conditions changed
96
whereas the impact on the lake hydrology is of minor importance. In contrast, the increase in δD values by about 50‰ for the aquatic n-alkanes around 4.75 cal ka BP is ascribed to a period with a negative water balance during arid climate conditions and resulted in a pronounced drop of the Nam Co lake level. The isotope enrichment of terrestrial n-alkanes in the same range appeared delayed. This also indicates that erosion processes were reduced compared to Unit I and transport of terrestrial organic material is decelerated relative to the autochthonous sedimentation. Unit II reflects the beginning of the lake shrinking which is initially caused by the reduced contribution of water supply either through precipitation and/or melt water.
• Unit III (~4.2 cal ka BP to ~1.75 cal ka BP)
Most of the parameters continue their trend from the previous depositional stage. TOC, TN, TIC and Ca decrease suggesting lower productivity of organic matter as well as decreasing pH values that lead to higher solubility of calcium (Fig. 5.4, 5.8) (Hakanson and Jansson, 1983). The elements that characterize slight but ongoing salinisation such as Mg, Na, Sr gradually increase with simultaneously decreasing Ca/Mg and Ca/Sr ratios that support this assumption. Elevated contents of Fe, Al and K (Fig. 5.8) which are associated to allochthonous input are not interpreted as a result of high runoff during this stage but are assumed to originate from reworked material from the lake shore through wave activity. Alternatively, low precipitation rates could have caused less vegetation cover on the soil surface leading to increased sediment input during accented precipitation events. Material reworking is presumed since the correlation between Al, Fe and/or TOC is not significant anymore which would suggest that dissolved metals are transported in association to soil organics (Engstrom and Wright, 1984). In addition, the precipitation of high-Mg calcite in the lower part of the core section implies elevated Mg/Ca ratios of the lake water (2-12) associated to higher salinities that point to the proceeding lake shrinkage (Fig. 5.7) (Müller et al., 1972; Vasconcelos and McKenzie, 1997). The parallel precipitation of calcite, aragonite and high-Mg calcite in the upper part of Unit III indicates major fluctuations of the water volume and level giving further evidence for the reworking of material from the lake shore (Müller et al., 1972). Although the lake level is gradually decreasing the aquatic organic matter production still remains of major importance as indicated by constantly decreasing TOC/TN values and the content of nC21 to nC25 that dominates the amount of terrestrial n-alkanes (Fig. 5.4). Stable hydrogen isotope ratios are highly variable during Unit III. The down core course of the aquatic and terrestrial isotope signal also shows a time lag comparable to Unit II. Significant enrichment in deuterium (~50‰) of aquatic n-alkanes is observed between ~ 3.75 and 3.5 cal ka BP and between ~ 2 and 1.8 cal ka BP. Isotopically heavier lake water is ascribed to pronounced arid climate conditions caused by increased incoming radiation and favoured by less intensive monsoonal precipitation. In addition, the δ13C values of aquatic n-alkanes show a comparable enrichment by about 3‰ that indicate that C3 algae used lake water that is concentrated by evaporation (Meyers and Lallier-
97
Verges, 1999). These periods are further associated to increased concentrations in K, Fe and Al giving additional evidence that these metals were remobilized from the lake shore (Fig. 5.8). Lower lake levels are also indicated by elevated manganese concentrations that point to oxidation of the hypolimnion and good mixing of the water body (Yancheva et al., 2007). In general, the hydrological conditions were highly variable with shifts between negative and positive evaporation to transpiration ratios under a significant lower lake level compared to the previous unit.
• Unit IV (~1.75 cal ka BP to ~750 cal years BP to ~400 cal years BP)
Sedimentation in this unit is divided into two subunits. The down core trend of the compound-specific stable hydrogen and carbon isotope ratios would suggest only one depositional phase characterized by significant isotopic depletion (Fig. 5.4). Concentrations of minerals and elements indicate a two-phased sedimentation during this Unit (Fig. 5.8). Terrestrial n-alkanes are ~20 ‰ depleted in deuterium than the observed mean (-195‰). Hydrogen isotopes of aquatic n-alkanes are not depleted but show stable values around the mean (-199‰) throughout the Unit IV. Carbon isotope depletion by ~2‰ is only recorded by aquatic n-alkanes. The depletion and stable course of the δD values indicates the supply of water either from a different and isotopically lighter water source or the input of significantly larger amounts. The impact was obviously of greater importance for the terrestrial ecosystem but nevertheless led to stable conditions within the lake. Elevated inflow is further reflected in a significant contribution of coarser material and the increase of the sedimentation rate (Fig. 5.3). In contrast, the lower part of Unit IV is characterized by correlative negative shifts of Fe, Al, Mn and K as indicators for allochthonous detrital input (Fig. 5.8). Reduced input of dissolved metals would contradict elevated precipitation amounts that would imply increased runoff. In addition, allogenic minerals that originate from the surrounding catchment significantly increase during the lower part of this Unit (Fig. 5.7). Since the solubility of the above mentioned elements are strongly dependant on pH and rises with increasing acidity (Engstrom and Wright, 1984; Hakanson and Jansson, 1983) we assume that increased runoff led to the input of soil derived humic substances into the lake which reduced pH and thus favoured their solution. The occurrence of pyrite and the precipitation of calcite (Fig. 5.7) as carbonate mineral as well as the reduced concentrations of Ca further suggest the acidity of lake water (Holmer and Storkholm, 2001; Last and Ginn, 2005; Müller et al., 1972; Simola, 1983; Young and Harvey, 1992). Increased lake acidity would also affirm the hypothesis of increased contribution of soil organic substances increasing the 14C ages which is observed during this Unit (Fig. 5.2).
Increased runoff that would imply fast transport of terrestrial material into the lake further indicated by the parallel course of terrestrial and aquatic n-alkane δD values (Fig. 5.4). The possible lake level rise in this period is not supported by the increasing Mg values. The only explanation could be a change in the fractionation of Mg and Sr during the formation of
98
calcite due to higher contribution from algae than from ostracodes (Delorme, 1989; Keatings et al., 2002). Furthermore, Na concentrations gradually decrease and thus point to the dilution of lake water, the sediments of the lower part of Unit IV are suggested to have been deposited during humid climate conditions resulting in a minor rising lake level.
During the upper part of Unit IV allogenic minerals and the concentrations of Fe, Al, K and Mn significantly decrease (Fig. 5.7, 5.8). Compound-specific stable isotopes show a slight enrichment in terrestrial and aquatic substances (Fig. 5.4). After a maximum around 750 cal years BP the concentrations of n-alkanes, TOC and TN significantly decreased whereas Ca, Mg and Na gradually increased. The integration of these proxies suggests that the water level and volume of Nam Co was again declining. Lower concentrations of allochthonous material from the catchment imply reduced runoff due to less intensive precipitation. Stable isotopes enrichment suggests elevated evaporation indicating dry climate conditions. The decline of the water volume is reflected by the concentration of the cations in solution.
• Unit V (since ~400 cal years BP)
The interpretation of Unit V is difficult since there are only few data points available. All proxies are subjected to large fluctuations but with an underlying general trend to either increased or decreased levels (Fig. 5.4, 5.7, 5.8). Increasing Mg, Na and lowest Ca/Mg ratios (Fig. 5.9) suggest that the water level and volume gradually decreased and highest salinities of the entire record are assumed. δD values of terrestrial and aquatic n-alkanes show large fluctuations by about 60 ‰ that again occur with a temporal delay for terrestrial substances. This indicates that terrestrial organic matter transport was decelerated and implies reduced runoff. Large isotope fluctuations can be caused by changes in the water source or when precipitation regimes changed between convective rains that is expected to be isotopically heavier due to moisture recycling and monsoonal precipitation which is assumed to show depleted values. Overall, δD values show trend to isotope enrichment and thus, favour the hypothesis of a decreasing lake level. Fe, K and Al as well as TN and TOC exhibit parallel fluctuations. We assume that short-term intensive precipitation periods led to periodical increased input of detrital material. Nevertheless, precipitation amount never exceeded evaporation and a negative water balance is assumed during Unit V. Occasional contribution of fresh precipitation water resulted in the precipitation of mainly low Mg-calcite and calcite which actually would point to lower salinities than expected (Müller et al., 1972).
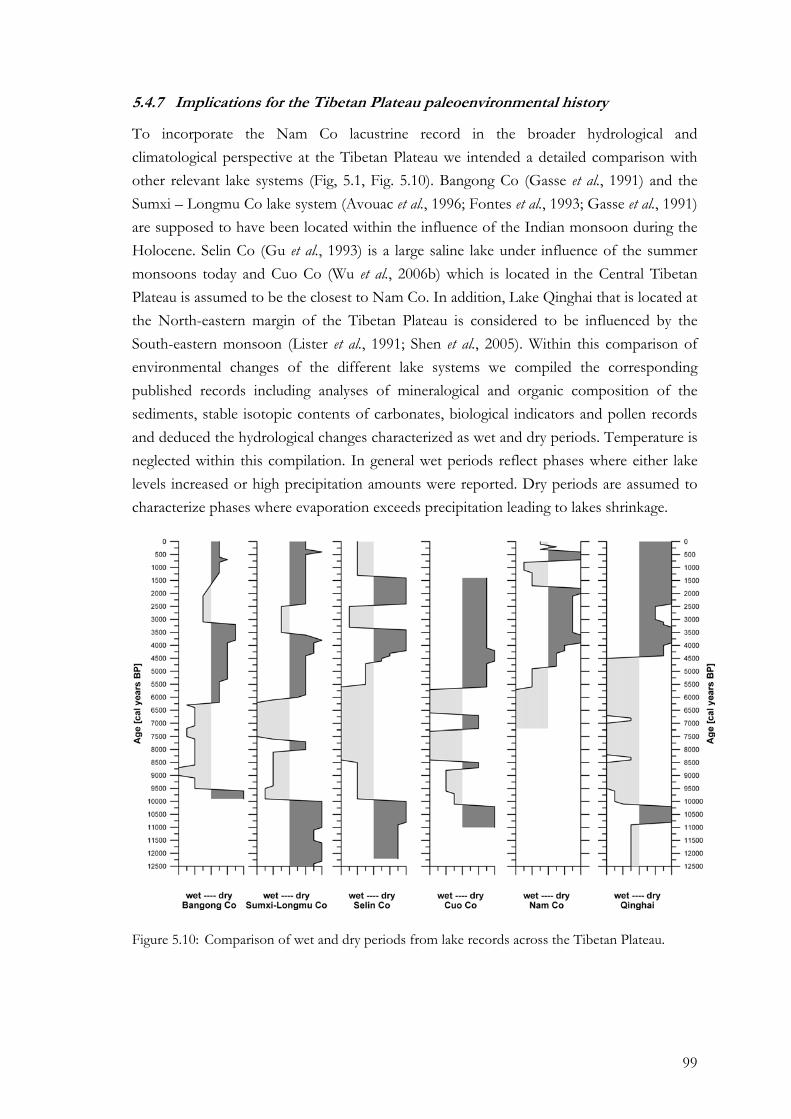
99
5.4.7 Implications for the Tibetan Plateau paleoenvironmental history
To incorporate the Nam Co lacustrine record in the broader hydrological and climatological perspective at the Tibetan Plateau we intended a detailed comparison with other relevant lake systems (Fig, 5.1, Fig. 5.10). Bangong Co (Gasse et al., 1991) and the Sumxi – Longmu Co lake system (Avouac et al., 1996; Fontes et al., 1993; Gasse et al., 1991) are supposed to have been located within the influence of the Indian monsoon during the Holocene. Selin Co (Gu et al., 1993) is a large saline lake under influence of the summer monsoons today and Cuo Co (Wu et al., 2006b) which is located in the Central Tibetan Plateau is assumed to be the closest to Nam Co. In addition, Lake Qinghai that is located at the North-eastern margin of the Tibetan Plateau is considered to be influenced by the South-eastern monsoon (Lister et al., 1991; Shen et al., 2005). Within this comparison of environmental changes of the different lake systems we compiled the corresponding published records including analyses of mineralogical and organic composition of the sediments, stable isotopic contents of carbonates, biological indicators and pollen records and deduced the hydrological changes characterized as wet and dry periods. Temperature is neglected within this compilation. In general wet periods reflect phases where either lake levels increased or high precipitation amounts were reported. Dry periods are assumed to characterize phases where evaporation exceeds precipitation leading to lakes shrinkage.
Figure 5.10: Comparison of wet and dry periods from lake records across the Tibetan Plateau.
100
• Warmer and wetter climate conditions than those of today – early to mid
Holocene
The analysed sequence of the Nam Co lacustrine record up to now only starts ~7.3 cal ka BP. Thus, the major and abrupt environmental changes from cool and dry arid to wet climate conditions during the early to mid Holocene as they are reported for the above mentioned lakes between 10.8 to 9.6 ka BP are not recorded in the Nam Co 8 sediments. Since the basal part of the Nam Co 8 core which is yet not analysed and dated consists of coarse sands that are interpreted as transgressive facies deposited during a rising lake level we presume that the humid period with intensified monsoonal precipitation is recorded at Nam Co, although a temporal delineation is currently not possible. The wet and warmer conditions due to an intensified monsoon circulation remained until around 6.3 to 6.0 ka BP for Bangong Co (Gasse et al., 1996) and Sumxi-Longmu Co, until around 5.5 ka BP at Selin Co, until 5.7 ka BP at Cuo Co and until 4.5 ka BP at Lake Qinghai (Shen et al., 2005). Maximum intensities of monsoonal precipitation, associated to highest lake levels and the maximum extent of monsoonal circulation is recorded at all sites between 6.5 to 5.5 ka BP. Generally, this period of favourable environmental conditions is termed as the Holocene Optimum. Within the analysed sediments of Nam Co 8 we record the remainder of the climate optimum until around 5.8 cal ka BP summarized in the depositional Unit I. From 6.2 to 5.7 ka BP the end of the Holocene hydrological and climate optimum with a deficit of precipitation-evaporation balance is reflected in the enrichment of δ18O values at Bangong Co and Sumxi-Longmu Co. At Lake Qinghai environmental proxies indicate the termination of the Holocene Optimum around 6 cal ka BP (Shen et al., 2005). A comparable dry spell around 5.75 to 5.5 cal ka BP is recorded based on the enrichment of aquatic and terrestrial δD values at Nam Co. A similar phenomenon is not reflected at the Selin Co or Cuo Co sediments possibly due to the lower temporal resolution of the cores. The relative timing of termination of the early to mid-Holocene humid climate conditions at the different lake sites shows a movement of monsoonal precipitation boundary towards a south-eastern direction. This implies a gradual decrease in rainfall intensity and thus a weakening of the southern monsoons during the early Holocene first affecting the north-western Bangong Co and Sumxi-Longmu Co and afterwards the central and Southern lakes including Nam Co. The gradual retreat of highest precipitation intensity in south-eastern direction is further confirmed by the stable isotope record of the Linxia basin situated southeast from Nam Co and a mid-Holocene record from Lake Daihai which is located in east China. There, the Holocene Optimum is recorded until ~5 cal ka BP (Fan et al., 2007) and even until 3.6 cal ka BP (Sun et al., 2006), respectively.
• Increasing aridity during the mid – Holocene
After the highest lake levels are recorded the lacustrine records of the lakes consistently indicate a general trend towards aridity. Referring to the above temporally classified end of
101
the Holocene Optimum the gradual drying and cooling of climate conditions started at Bangong Co and Sumxi-Longmu Co around 6.0 ka BP, lasted until 3.8 ka BP and terminated in an extreme dry period around 3.2 ka BP. Starting about 500 years later at Cuo Co and Selin Co maximum aridity is reached at the same time around 3.0 to 3.3 ka BP (Gasse et al., 1996; Wu et al., 2006a). Comparable to Selin Co Nam Co sediments indicate a transition period until ~4.2 cal ka BP and a first aridity maximum between ~4.2 and ~3.3 ka BP that is coincident with a pronounced dry period at Nam Co between ~3.75 and ~3.5 cal ka BP. Lake Qinghai also shows a maximum of aridity around 3.9 cal ka BP (Shen et al., 2005). Records at Bangong Co and Sumxi-Longmu Co indicate significant increased aridity between 3.8 and 3.2 ka BP. The contemporaneous occurrence of pronounced dry climate conditions could indicate the 4.2 ka event which is documented in a number of archives in Asia (Arz et al., 2006; Staubwasser et al., 2003) as well as monsoonal Africa (Booth et al., 2005; Gasse, 2000). Although the understanding of causes of the 4.2 ka event is yet incomplete the authors presume external forcing and solar variability to have induced a weakening of monsoonal circulation. A moister period of minor amplitude is recorded for Bangong Co, Sumxi-Longmu Co and Selin Co between ~ 3.5 and ~ 2.1 ka BP (Gasse et al., 1996). Lacustrine sediments of Cuo Co and Nam Co indicate that less intense aridity during this period whereas the Qinghai record only shows proceeding dry climate conditions (Shen et al., 2005; Wu et al., 2006a). The significant moisture indication of the western lakes, the minor impact at Nam Co and Cuo Co that are located in the Central Plateau and the missing signal at Qinghai Lake could suggest that this wet interval was caused by a pronounced influence of air masses originating from the Westerlies. Afterwards, the records clearly indicate increased aridity whereas only Selin Co and Nam Co sediments show an episode with significantly higher amplitudes of dryness between ~ 2.4 and ~ 1.4 ka BP and ~ 2.0 and ~ 1.8 cal ka BP, respectively. This suggests that climate effective processes impacted at a smaller scale and may imply particularly weak southern monsoons during this time period.
• Late – Holocene modern climate conditions
Correlation of the establishment of modern climate conditions appears to be most challenging since the chronologies reveal several uncertainties and the general picture of actual climate development seems to be contradictory for the single lake records. While aridity is continuously proceeding at Bangong Co and Sumxi-Longmu Co and Lake Qinghai (Gasse et al., 1996; Shen et al., 2005), the record from Selin Co indicates a moister period since 1.4 ka BP to present (Gasse et al., 1996). At Nam Co the environmental proxies reflect also an increase in precipitation and runoff between ~ 1.75 cal ka BP and ~ 750 cal yr. BP that are followed immediately by drier conditions.
102
5.5 Conclusions
The lacustrine sequence of Nam Co 8 sediment core provided a valuable insight into paleoenvironmental history of the Nam Co since ~ 7.3 cal ka PB. During this time period covering the middle and late Holocene the lake system underwent changes between pronounced humid and arid climate conditions that resulted either in an increase of lake level and volume or the decline of the water body basically controlled by monsoonal moisture availability. The basal part of the analysed core section was deposited under transgressive conditions that started before 7.3 cal ka BP when the summer monsoonal circulation was rapidly strengthened at the Tibetan Plateau and caused a warm and wet climate. The long term trend towards aridity was initiated between ~5.8 and ~ 4.2 cal ka BP and culminated in two pronounced dry episodes between ~ 3.75 and ~ 3.5 cal ka BP and between ~ 2 and ~ 1.8 cal ka BP whereas the first event could possibly be associated to the 4.2 ka event recorded widely in monsoonal Asia. After a marked wet spell from 1,750 to 750 cal years BP lake shrinking proceeds gradually in association to a decrease in monsoonal rain intensity as well as increasing mean air temperatures. The comparison with lake records across the Tibetan Plateau showed an overall agreement of their paleohydrological evolution. Most strikingly the timing of the termination of the Holocene Climate Optimum suggests a gradual movement of southern monsoonal precipitation boundary towards a south-eastern direction and thus, implies a gradual decrease in rainfall intensity related to a weakening of the southern monsoons. In addition, major events such as around 8 ka and ~ 4 ka dry event appear in phase across the Tibetan Plateau as well as with climatic changes that are recorded on a global scale in monsoonal Africa, India and China which implies these events to be caused by large scale changes in energy redistribution of the ocean – atmosphere and land system. A comprehensive picture on the establishment of modern climate conditions for the last 2,000 years is yet incomplete and principally lacks high resolution records due to lake desiccation that widely led to the loss of archive material. Thus, a detailed compilation of lake records across the Tibetan Plateau covering of the most recent time period of the Holocene is essential to clearly assess the impact of environmental change on the Asian monsoon system.
103
6 Synthesis Chapter 6
Synthesis
6.1 Use of δD values from terrestrial and aquatic lacustrine n-alkanes for
paleoclimatic reconstruction
The establishment of a novel climate proxy is based on extensive present day calibration studies. They successively elaborate the controlling parameter and mechanisms that are necessary to relate the proxy characteristics to the actual climate signal. Numerous compound-specific hydrogen isotope measurements from n-alkanes assessed that their stable hydrogen isotopic composition (expressed as δD value with δD = (D/Hsample/ D/Hstandard) x 1000) record the hydrogen isotope composition of the water used by the photosynthetic organisms (e.g. Sachse et al., 2004; Chikaraishi and Naraoka, 2003). The hydrogen isotopic composition of the source water is incorporated within the lipids with a biosynthetic fractionation that is additionally influenced by a yet unquantified impact from environmental factors. With the findings of this thesis a novel set of data is provided that quantitatively improved the understanding of possible responses to environmental conditions involved during hydrogen isotope fractionation and further paves the way to apply n-alkane δD values to reconstruct the hydrological cycle in the past [Chapter 3 and 4].
In addition, with the implementation of n-alkane δD values in a multi-proxy approach it is shown, that the combination of this novel climate proxy with standardised methods in paleoclimate research, significantly enhanced the interpretation strength of n-alkane δD values and enabled to reconstruct changes in Asian Monsoon intensity during the Late Quaternary [Chapter 5]. Based on the results of the studies on δD values from terrestrial and aquatic n-alkanes in various environments presented in this thesis, a summary of the climate information that is provided by the n-alkane δD values is given. These findings are then implemented into the current knowledge on the isotopic relationships between source water and n-alkanes in aquatic and terrestrial ecosystems.
• n-alkane δD values record the strength of evaporation and the associated lake
water loss
It is well established that evapotranspiration of soil and leaf water leads to deuterium enrichment in terrestrial vascular plants n-alkanes. In combination with the biochemical hydrogen isotope fractionation it is termed “apparent fractionation” and was yet described only for terrestrial-derived n-alkanes (Sachse et al., 2006; Smith and Freeman 2006). Established for mid-European humid climate conditions, this soil and leaf water
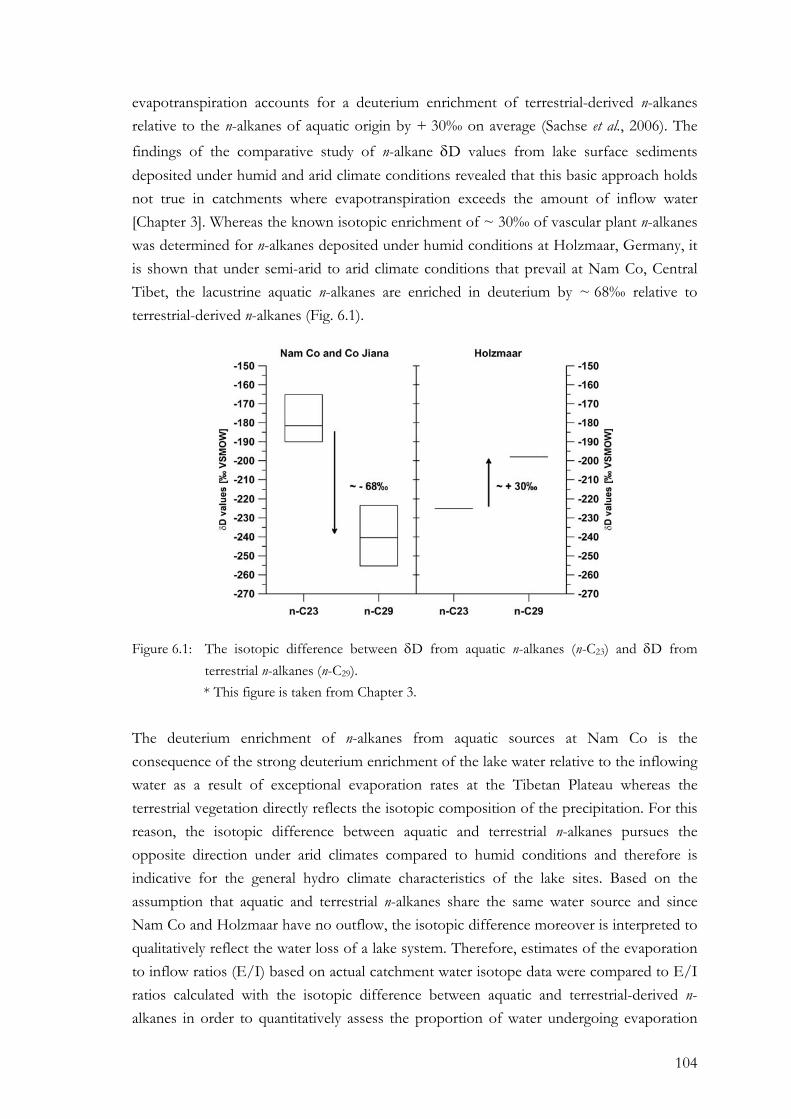
104
evapotranspiration accounts for a deuterium enrichment of terrestrial-derived n-alkanes relative to the n-alkanes of aquatic origin by + 30‰ on average (Sachse et al., 2006). The findings of the comparative study of n-alkane δD values from lake surface sediments deposited under humid and arid climate conditions revealed that this basic approach holds not true in catchments where evapotranspiration exceeds the amount of inflow water [Chapter 3]. Whereas the known isotopic enrichment of ~ 30‰ of vascular plant n-alkanes was determined for n-alkanes deposited under humid conditions at Holzmaar, Germany, it is shown that under semi-arid to arid climate conditions that prevail at Nam Co, Central Tibet, the lacustrine aquatic n-alkanes are enriched in deuterium by ~ 68‰ relative to terrestrial-derived n-alkanes (Fig. 6.1).
Figure 6.1: The isotopic difference between δD from aquatic n-alkanes (n-C23) and δD from terrestrial n-alkanes (n-C29). * This figure is taken from Chapter 3.
The deuterium enrichment of n-alkanes from aquatic sources at Nam Co is the consequence of the strong deuterium enrichment of the lake water relative to the inflowing water as a result of exceptional evaporation rates at the Tibetan Plateau whereas the terrestrial vegetation directly reflects the isotopic composition of the precipitation. For this reason, the isotopic difference between aquatic and terrestrial n-alkanes pursues the opposite direction under arid climates compared to humid conditions and therefore is indicative for the general hydro climate characteristics of the lake sites. Based on the assumption that aquatic and terrestrial n-alkanes share the same water source and since Nam Co and Holzmaar have no outflow, the isotopic difference moreover is interpreted to qualitatively reflect the water loss of a lake system. Therefore, estimates of the evaporation to inflow ratios (E/I) based on actual catchment water isotope data were compared to E/I ratios calculated with the isotopic difference between aquatic and terrestrial-derived n-alkanes in order to quantitatively assess the proportion of water undergoing evaporation
105
relative to the inflow. The results imply that this difference serves as a direct analogue for the deviation in the deuterium content of the lake water and the inflows and thus provides the input parameter for E/I ratio estimates back in time to reconstruct lake water balances in the past.
• Terrestrial n-alkane δD values record temperature induced changes in
precipitation stable isotope composition and give indication on changes in
vegetation composition, evapotranspiration and moisture source area
Terrestrial vascular plants n-alkanes have been shown to track changes in the isotopic composition of precipitation (e. g. Huang et al., 2004; Sachse et al., 2004; Sessions et al., 1999). Therefore the controlling parameter such as the water vapour source area, the amount of precipitation, air temperature and relative humidity can potentially be inferred from the n-alkane δD values although the contribution of each parameter to the n-alkane deuterium content yet remains to be quantitatively assessed. The results of the comparison between lacustrine terrestrial leaf wax n-alkane δD values and δ18O values from benthic ostracodes from the Ammersee, Germany and Lac d’Annecy, France during the end of the last deglaciation (13.6 ka to 11.1 ka BP) gave valuable insights into the nature of the climate signal provided by the n-alkanes δD values [Chapter 4]. The aquatic-derived δ18O values represent variations in the stable isotope composition of precipitation that in turn are a function of mean air temperatures in both study sites. The n-alkane δD values likewise record the rapid temperature induced changes with the transition from the Allerød and the Younger Dryas cold period reflected by a depletion in deuterium by about 30‰ at the Ammersee and 20‰ at Lac d’Annecy (Fig. 6.2). The data further indicate that changes in mean air temperatures only account for ~ 50% of the differences in the mean hydrogen isotope signature between the Allerød and the Younger Dryas. The residual fraction is ascribed to changes in the vegetation composition associated to the abrupt shift in environmental conditions during that time as well as to differences in evapotranspiration rates. Based on the dataset quantitative estimates of the contribution from these processes to the changes in leaf wax n-alkane δD values were not possible. The comparison between the proxy data from an aquatic and a terrestrial source further emphasized the differences in the temporal resolution of the corresponding recorded climate fluctuations. Whereas the δ18O values reflect temperature changes at annual time scales, the δD values were proved to record changes in environmental conditions at shorter most likely seasonal time scales since n-alkanes preserve the stable isotope composition of precipitation at the end of the vegetation period. Moreover, it is indicated that terrestrial n-alkane δD values reveal a higher sensitivity to climate induced changes in their source water isotopic composition when compared to the amplitudes of the climate signal provided by the δ18O values.
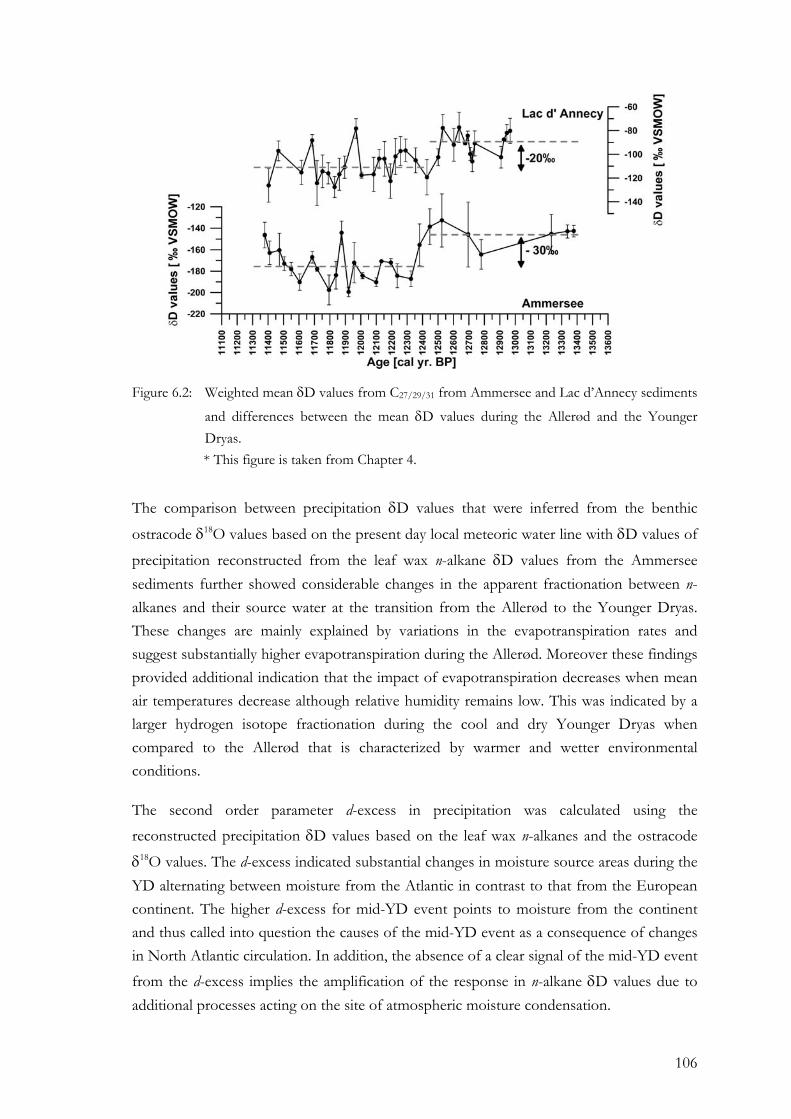
106
Figure 6.2: Weighted mean δD values from C27/29/31 from Ammersee and Lac d’Annecy sediments
and differences between the mean δD values during the Allerød and the Younger Dryas. * This figure is taken from Chapter 4.
The comparison between precipitation δD values that were inferred from the benthic
ostracode δ18O values based on the present day local meteoric water line with δD values of
precipitation reconstructed from the leaf wax n-alkane δD values from the Ammersee sediments further showed considerable changes in the apparent fractionation between n-alkanes and their source water at the transition from the Allerød to the Younger Dryas. These changes are mainly explained by variations in the evapotranspiration rates and suggest substantially higher evapotranspiration during the Allerød. Moreover these findings provided additional indication that the impact of evapotranspiration decreases when mean air temperatures decrease although relative humidity remains low. This was indicated by a larger hydrogen isotope fractionation during the cool and dry Younger Dryas when compared to the Allerød that is characterized by warmer and wetter environmental conditions.
The second order parameter d-excess in precipitation was calculated using the reconstructed precipitation δD values based on the leaf wax n-alkanes and the ostracode
δ18O values. The d-excess indicated substantial changes in moisture source areas during the YD alternating between moisture from the Atlantic in contrast to that from the European continent. The higher d-excess for mid-YD event points to moisture from the continent and thus called into question the causes of the mid-YD event as a consequence of changes in North Atlantic circulation. In addition, the absence of a clear signal of the mid-YD event from the d-excess implies the amplification of the response in n-alkane δD values due to additional processes acting on the site of atmospheric moisture condensation.
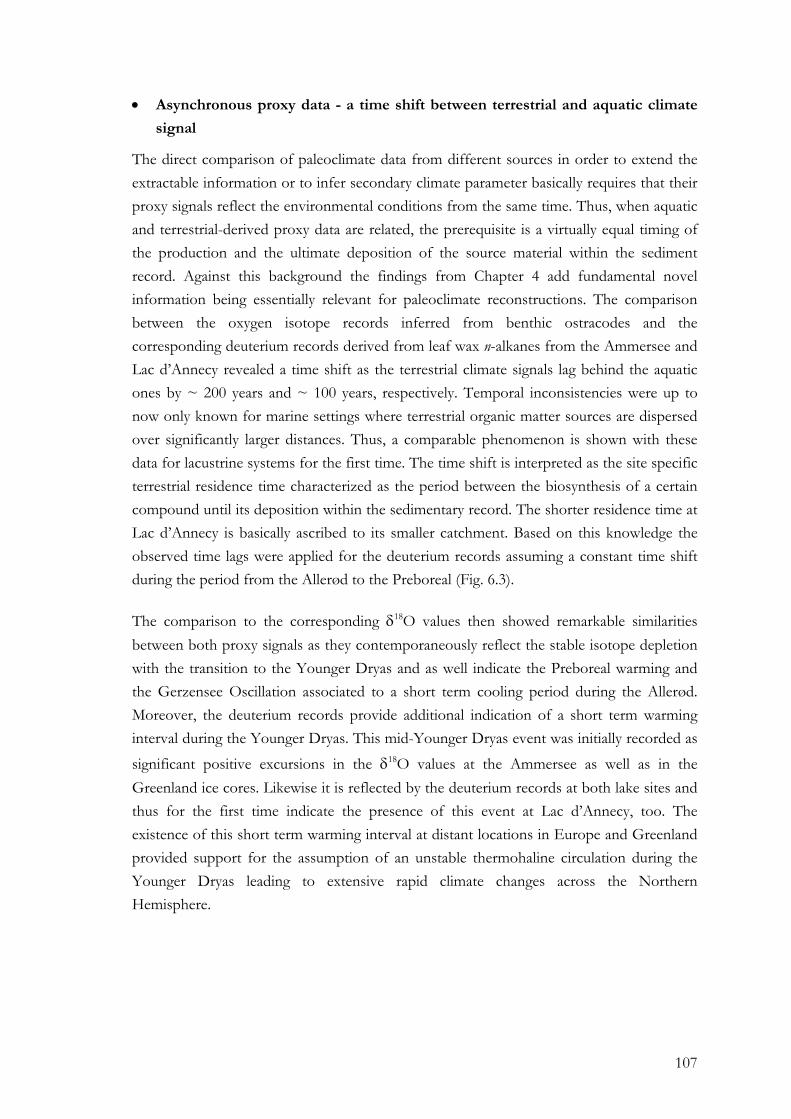
107
• Asynchronous proxy data - a time shift between terrestrial and aquatic climate
signal
The direct comparison of paleoclimate data from different sources in order to extend the extractable information or to infer secondary climate parameter basically requires that their proxy signals reflect the environmental conditions from the same time. Thus, when aquatic and terrestrial-derived proxy data are related, the prerequisite is a virtually equal timing of the production and the ultimate deposition of the source material within the sediment record. Against this background the findings from Chapter 4 add fundamental novel information being essentially relevant for paleoclimate reconstructions. The comparison between the oxygen isotope records inferred from benthic ostracodes and the corresponding deuterium records derived from leaf wax n-alkanes from the Ammersee and Lac d’Annecy revealed a time shift as the terrestrial climate signals lag behind the aquatic ones by ~ 200 years and ~ 100 years, respectively. Temporal inconsistencies were up to now only known for marine settings where terrestrial organic matter sources are dispersed over significantly larger distances. Thus, a comparable phenomenon is shown with these data for lacustrine systems for the first time. The time shift is interpreted as the site specific terrestrial residence time characterized as the period between the biosynthesis of a certain compound until its deposition within the sedimentary record. The shorter residence time at Lac d’Annecy is basically ascribed to its smaller catchment. Based on this knowledge the observed time lags were applied for the deuterium records assuming a constant time shift during the period from the Allerød to the Preboreal (Fig. 6.3).
The comparison to the corresponding δ18O values then showed remarkable similarities between both proxy signals as they contemporaneously reflect the stable isotope depletion with the transition to the Younger Dryas and as well indicate the Preboreal warming and the Gerzensee Oscillation associated to a short term cooling period during the Allerød. Moreover, the deuterium records provide additional indication of a short term warming interval during the Younger Dryas. This mid-Younger Dryas event was initially recorded as significant positive excursions in the δ18O values at the Ammersee as well as in the Greenland ice cores. Likewise it is reflected by the deuterium records at both lake sites and thus for the first time indicate the presence of this event at Lac d’Annecy, too. The existence of this short term warming interval at distant locations in Europe and Greenland provided support for the assumption of an unstable thermohaline circulation during the Younger Dryas leading to extensive rapid climate changes across the Northern Hemisphere.
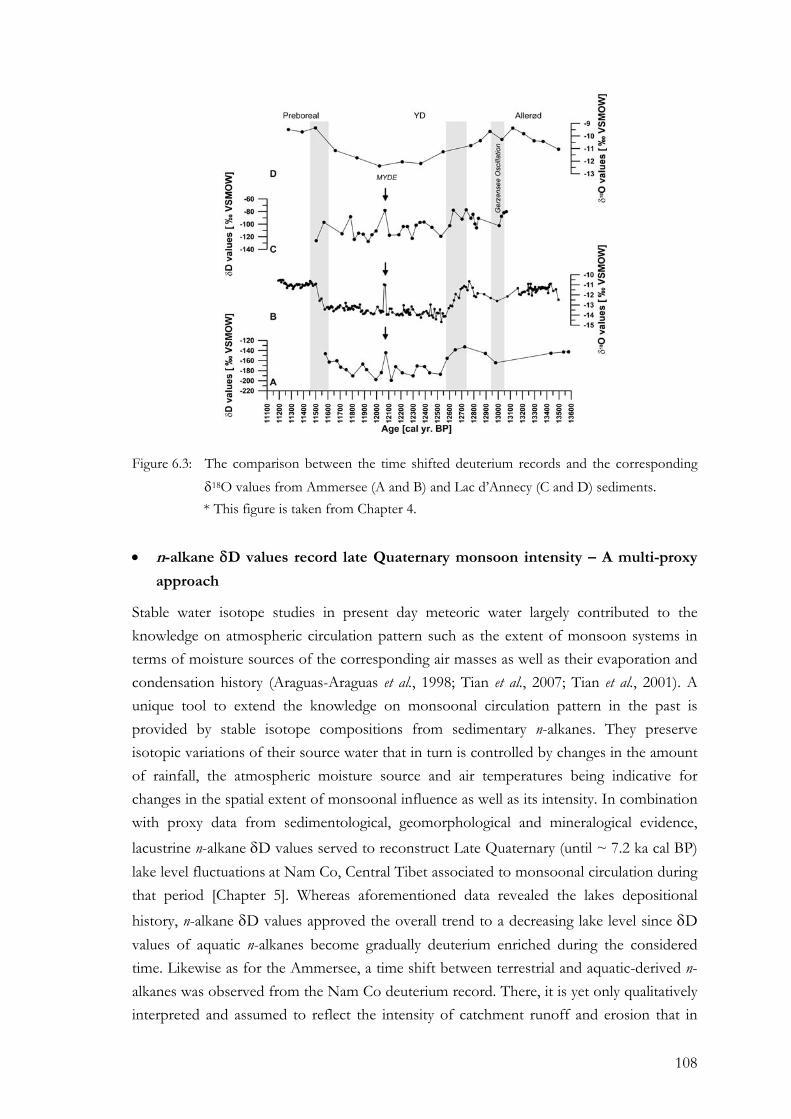
108
Figure 6.3: The comparison between the time shifted deuterium records and the corresponding δ18O values from Ammersee (A and B) and Lac d’Annecy (C and D) sediments. * This figure is taken from Chapter 4.
• n-alkane δD values record late Quaternary monsoon intensity – A multi-proxy
approach
Stable water isotope studies in present day meteoric water largely contributed to the knowledge on atmospheric circulation pattern such as the extent of monsoon systems in terms of moisture sources of the corresponding air masses as well as their evaporation and condensation history (Araguas-Araguas et al., 1998; Tian et al., 2007; Tian et al., 2001). A unique tool to extend the knowledge on monsoonal circulation pattern in the past is provided by stable isotope compositions from sedimentary n-alkanes. They preserve isotopic variations of their source water that in turn is controlled by changes in the amount of rainfall, the atmospheric moisture source and air temperatures being indicative for changes in the spatial extent of monsoonal influence as well as its intensity. In combination with proxy data from sedimentological, geomorphological and mineralogical evidence, lacustrine n-alkane δD values served to reconstruct Late Quaternary (until ~ 7.2 ka cal BP) lake level fluctuations at Nam Co, Central Tibet associated to monsoonal circulation during that period [Chapter 5]. Whereas aforementioned data revealed the lakes depositional history, n-alkane δD values approved the overall trend to a decreasing lake level since δD values of aquatic n-alkanes become gradually deuterium enriched during the considered time. Likewise as for the Ammersee, a time shift between terrestrial and aquatic-derived n-alkanes was observed from the Nam Co deuterium record. There, it is yet only qualitatively interpreted and assumed to reflect the intensity of catchment runoff and erosion that in
109
turn are directly associated to the amount of rainfall and thus monsoonal strength. Phases where an asynchronous timing between the terrestrial and the aquatic signal is visible thus point to decreased monsoonal precipitation, whereas the simultaneous variations in both signals indicate higher rainfall intensity. Considering the periodically delayed terrestrial δD
values, the isotopic difference between terrestrial and aquatic-derived n-alkane δD values gave indication on the strength of lake water evaporation. Thus, based on the direction of the isotopic difference between terrestrial and aquatic n-alkanes it was shown that the lake system experienced periods where either pronounced humid or arid climate conditions prevailed. These periods were associated with episodically increasing or declining lake levels that were reflected by great variations in n-alkane δD values of aquatic origin. Large stable isotope fluctuations of the terrestrial derived n-alkanes gave evidence for changes in the precipitation regime. Remarkable deuterium depletion resulted from intense monsoonal rainfall, while higher δD values indicated convective rains characterized by moisture recycling and increased evaporation rates. In general, the variations of all environmental proxies including grain size, major elements, biomarker stable isotopes and minerals from the Nam Co sediment core suggested a climate evolution in at least five depositional units and subunits that were shown to be basically controlled by monsoonal moisture availability.
Although the overall picture on the Holocene environmental development on the Tibetan Plateau in relation with the monsoon history is well established and the number of monsoon records is increasing constantly, the correlation of environmental records in order to provide a spatio-temporal consistent late Quaternary climate development is yet not straightforward. Particularly difficult is the assessment whether the asynchronous responses of the Tibetan Plateau lake systems reflect variable moisture supply associated to monsoonal circulation boundaries or are only a result of the lack of precise correspondence of climate records. The inconsistencies are caused mainly by inaccurate age models (Morrill et al., 2003; Sun et al., 2006; Wu et al., 2006b; Xu and Zheng, 2003) and by different locations (altitude, climate conditions) or are the result of different climate archives and resolutions of material (An et al., 2000; He et al., 2004; Morrill et al., 2003).
The correlation of the Nam Co record with other lake records from the Tibetan Plateau, which were interpreted in terms of wet and dry periods, suggested an overall agreement (Fig. 6.4). Most interestingly, the timing of dry and wet climate conditions at the lakes sites across Tibet imply a gradual decrease in rainfall intensity related to a weakening of the southern monsoons during the Holocene along a NW to SE transect. Also, major events such as around 8 ka and the ~ 4 ka dry event appear in phase across the Tibetan Plateau. Inconsistencies still exist concerning reliable chronologies. Thus, further research is needed to improve the spatiotemporal interpretation of hydrological variations in association with alternating monsoonal circulation across the Asian continent.
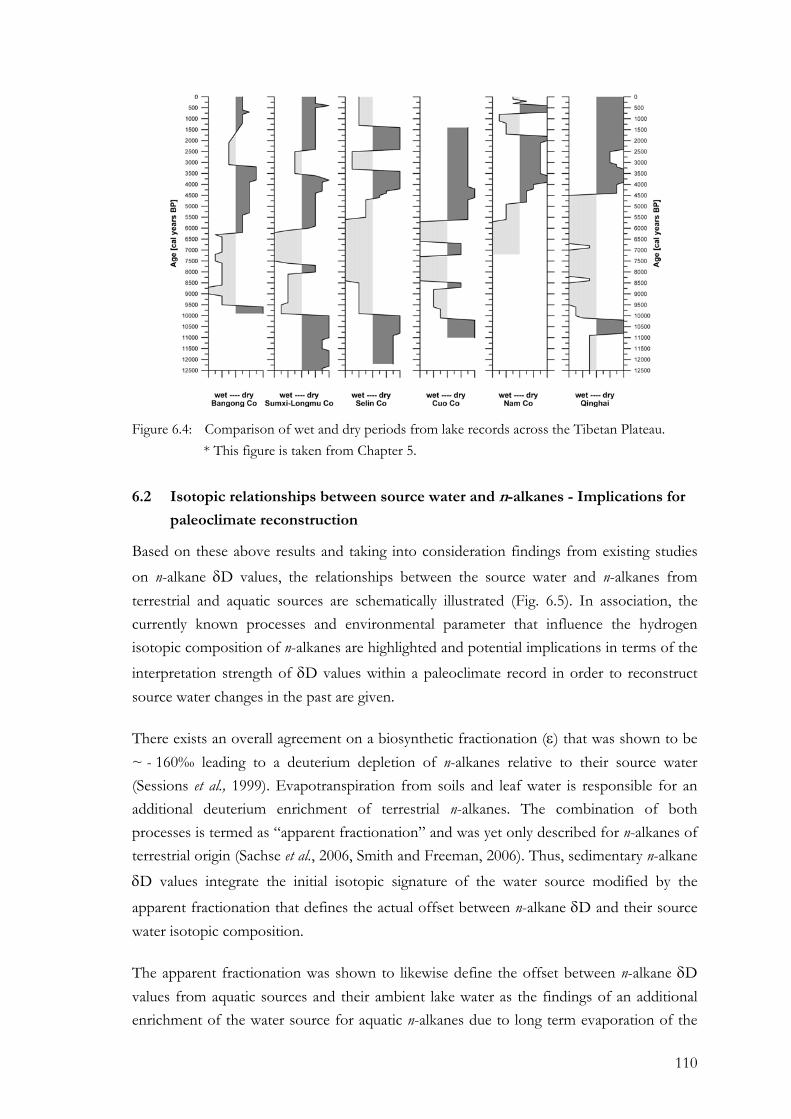
110
Figure 6.4: Comparison of wet and dry periods from lake records across the Tibetan Plateau. * This figure is taken from Chapter 5.
6.2 Isotopic relationships between source water and n-alkanes - Implications for
paleoclimate reconstruction
Based on these above results and taking into consideration findings from existing studies on n-alkane δD values, the relationships between the source water and n-alkanes from terrestrial and aquatic sources are schematically illustrated (Fig. 6.5). In association, the currently known processes and environmental parameter that influence the hydrogen isotopic composition of n-alkanes are highlighted and potential implications in terms of the interpretation strength of δD values within a paleoclimate record in order to reconstruct source water changes in the past are given.
There exists an overall agreement on a biosynthetic fractionation (ε) that was shown to be ~ - 160‰ leading to a deuterium depletion of n-alkanes relative to their source water (Sessions et al., 1999). Evapotranspiration from soils and leaf water is responsible for an additional deuterium enrichment of terrestrial n-alkanes. The combination of both processes is termed as “apparent fractionation” and was yet only described for n-alkanes of terrestrial origin (Sachse et al., 2006, Smith and Freeman, 2006). Thus, sedimentary n-alkane δD values integrate the initial isotopic signature of the water source modified by the
apparent fractionation that defines the actual offset between n-alkane δD and their source water isotopic composition.
The apparent fractionation was shown to likewise define the offset between n-alkane δD values from aquatic sources and their ambient lake water as the findings of an additional enrichment of the water source for aquatic n-alkanes due to long term evaporation of the
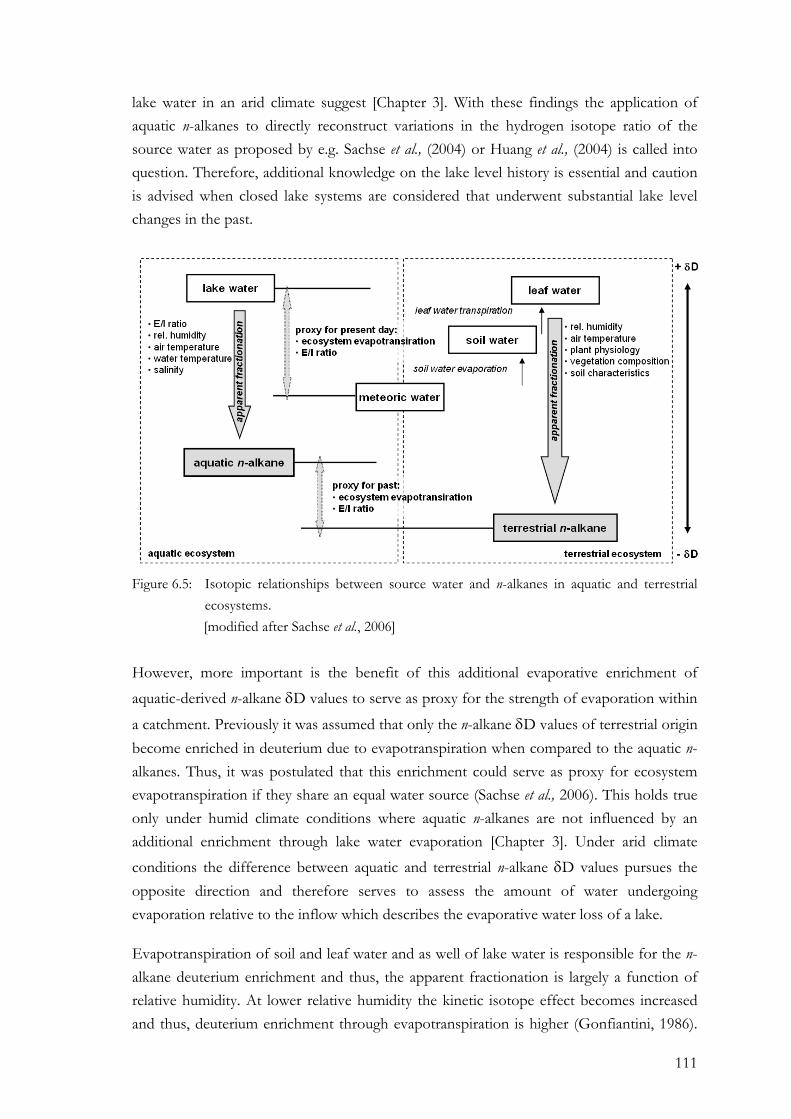
111
lake water in an arid climate suggest [Chapter 3]. With these findings the application of aquatic n-alkanes to directly reconstruct variations in the hydrogen isotope ratio of the source water as proposed by e.g. Sachse et al., (2004) or Huang et al., (2004) is called into question. Therefore, additional knowledge on the lake level history is essential and caution is advised when closed lake systems are considered that underwent substantial lake level changes in the past.
Figure 6.5: Isotopic relationships between source water and n-alkanes in aquatic and terrestrial
ecosystems. [modified after Sachse et al., 2006]
However, more important is the benefit of this additional evaporative enrichment of aquatic-derived n-alkane δD values to serve as proxy for the strength of evaporation within
a catchment. Previously it was assumed that only the n-alkane δD values of terrestrial origin become enriched in deuterium due to evapotranspiration when compared to the aquatic n-alkanes. Thus, it was postulated that this enrichment could serve as proxy for ecosystem evapotranspiration if they share an equal water source (Sachse et al., 2006). This holds true only under humid climate conditions where aquatic n-alkanes are not influenced by an additional enrichment through lake water evaporation [Chapter 3]. Under arid climate conditions the difference between aquatic and terrestrial n-alkane δD values pursues the opposite direction and therefore serves to assess the amount of water undergoing evaporation relative to the inflow which describes the evaporative water loss of a lake.
Evapotranspiration of soil and leaf water and as well of lake water is responsible for the n-alkane deuterium enrichment and thus, the apparent fractionation is largely a function of relative humidity. At lower relative humidity the kinetic isotope effect becomes increased and thus, deuterium enrichment through evapotranspiration is higher (Gonfiantini, 1986).
112
The reconstructed apparent fractionation values during the Younger Dryas and the Allerød based on leaf wax n-alkane δD values further indicate, that mean air temperatures also influence the extent of deuterium enrichment through evapotranspiration [Chapter 3]. It was shown that although relative humidity was assumed to be low, considerably lower mean air temperatures potentially decreased the kinetic isotope effect preventing strong evapotranspirative enrichment at the plants leaf level and thus led to an unexpected larger apparent fractionation.
Besides relative humidity and mean air temperature as climatic relevant factors, the plant physiology was shown to substantially control the degree of leaf water transpiration and so further modulates the apparent fractionation value. Within this context, currently discussed is the role of leaf architecture and growth form, since it is indicated that differences in veinal structures influence the degree of deuterium enrichment of leaf water (Sachse et al., 2006; Santrucek et al., 2007; Smith and Freeman, 2006b; Yakir et al., 1990). In addition, the water use efficiency was shown to correlate with n-alkane δD values whereas trees with
higher water use efficiency exhibited lower δD values (Hou et al., 2007a). Controversially discussed is the influence of the plants photosynthetic pathway most likely as a consequence of the study designs where n-alkane δD values from C4 grasses were compared to C3 trees, shrubs or herbs disregarding site specific environmental conditions (Bi et al., 2005; Chikaraishi and Naraoka, 2003; Ziegler, 1989). Besides the evaporative impact on the vegetation level also the soil characteristics in terms of different water pools with distinct stable isotopic compositions were found to alter the leaf wax δD values (Krull et al., 2006). Recent studies further focus the major level of the plant community itself (Hou et al., 2007b). In this context variations in microclimate conditions leading to different degrees of evapotranspiration were held responsible for significant lower leaf wax n-alkane δD values from grasses when compared to trees growing under same environmental conditions.
Whereas a variety of parameter are shown to control the extent of the evapotranspirative impact on terrestrial n-alkane δD values that in turn defines the apparent fractionation, the deuterium enrichment of lake water through evaporation is largely a function of the isotopic balance between the inflow waters and precipitation and the amount of water that undergoes evaporation, based on the assumption of a closed lake system. Thus, mainly relative humidity as well as air and water temperatures modulate the degree of lake water evaporation (Gonfiantini, 1986). Hence the aquatic n-alkanes directly preserve the amount of isotope enrichment through evaporation when compared to terrestrial n-alkane δD values that are not influenced by evapotranspiration as shown for plants growing under water saturation conditions [Chapter 3]. Within this context one should mention recent findings on the influence of salinity on the D/H fractionation between cyanobacterial n-alkanes and the source water (Sachse and Sachs, 2008). There, deuterium enrichment was
113
observed for aquatic n-alkanes with increasing salinity whereas a substantial increase in the δD values of the source water was not shown. Although the underlying mechanisms are yet unclear, the authors suggest that higher salinities lead to recycling of metabolic and intracellular waters and thus enrich the water available for biosynthesis. This indicates that aquatic n-alkane δD values are promising to be applied to reconstruct past salinities of their water source.
Concluding, the consistent paleoclimatic interpretation of an n-alkane deuterium record regardless of whether from aquatic or terrestrial sources requires elaborating the environmental factors integrated within the apparent fractionation in terms of their relevance for the climate reconstruction as well as of their significance to actually influence the sedimentary n-alkane δD values. Greatest importance is ascribed to the relative humidity since it controls the degree of evapotranspiration as an integrated effect from air temperature and moisture availability. This group of climate relevant parameter therefore has the potential to generate positive feedback mechanisms that amplify the climate signal provided by the n-alkanes relative to the initial signal from the water source when it enters the plant – soil system. Meaning on the one hand, higher mean air temperatures lead to deuterium enrichment of the meteoric water due to the temperature effect (Dansgaard, 1964). In association, evapotranspiration rates increase and result in an additional deuterium enrichment of n-alkane δD values. On the other hand, when the initial meteoric water becomes depleted under cool and moist climate conditions, associated lower evapotranspiration rates cause larger isotopic fractionation that additionally decrease the deuterium content of leaf wax n-alkanes. Thus, this interaction of processes presumably explains the virtually higher sensitivity of n-alkane δD values to record past climate conditions.
Indication on the strength of evapotranspiration is given by the isotopic difference between aquatic and terrestrial n-alkanes since it is shown to change its direction depending on whether arid or humid climate conditions prevail [Chapter 3]. Thus, if changes in the direction of the isotopic difference are observed within the paleoclimate record, substantial variations in evapotranspiration rates are presumable that in turn can be related to changes in relative humidity and thus, moisture conditions. Most promising is the application of the isotopic difference to quantitatively reconstruct past evaporation to inflow ratios that provide the basis for lake water balance estimates. Therefore it should be mentioned, that also the absolute δD values of aquatic and terrestrial n-alkanes need to be considered. This
is important because a significant change in terrestrial n-alkane δD values, for instance caused by variations in the water vapour source, as observed in monsoon influenced regions [Chapter 5], could change the isotopic difference although the δD values from aquatic n-alkanes remained unchanged. Thus, reliable interpretation of the isotopic difference in terms of evaporation strength requires a detailed assessment of the downcore
114
trend in aquatic and terrestrial n-alkane δD values. Within this context, the observed time shift between aquatic and terrestrial proxy sources has to be considered that potentially complicates their direct comparison in order to assess their isotopic difference [Chapter 4].
The residual factors that likewise influence the degree of evapotranspiration and therefore alter the apparent fractionation, largely act on the species level of terrestrial vegetation. Whereas the impact of plant physiology, water use efficiency as well as of soil characteristics is doubtlessly relevant for the comprehensive understanding of processes involved during the incorporation of the hydrogen isotope signal within the leaf wax n-alkanes, their significance within a sedimentary n-alkane record appears to be subordinate. On the one hand, a sedimentary leaf wax n-alkane deuterium record that reflects the weighted mean hydrogen isotope composition of the odd-carbon numbered long chain n-alkanes nC27/29/31 is assumed to minimize species specific effects. On the other hand, the sedimentary record temporally averages the hydrogen isotope signal depending on the general temporal resolution provided by the record. In addition, the observed time shift between terrestrial and aquatic-derived climate signal presumably points to additional integration of the terrestrial climate information over larger timescales. This is assumed, because a delay of terrestrial response likewise implies the combination of information throughout the period when the organic matter is sequestered in terrestrial reservoirs prior to its deposition in the lake record. Consequently, the changes in the deuterium content of a lacustrine record most likely reflect variations of the primary environmental factors that influence the impact of evapotranspiration and amplify the n-alkane δD value fluctuations when compared to the initial water signal.
Although the paleoclimatic interpretation of weighted mean δD values from terrestrial-derived n-alkanes minimizes species specific effects, substantial changes in the vegetation composition can nevertheless alter the apparent fractionation. This can provide the opportunity to derive information on past vegetation changes from the terrestrial-derived n-alkane δD values preserved in a sedimentary record if other proxy data on climate variability exist [Chapter 4]. When paleoclimate interpretation is solely based on sedimentary terrestrial-derived n-alkane δD values, additional palynological data is necessary to reliably interpret leaf wax deuterium records from regions with presumable vegetation composition variations in the past. Regions where the vegetation composition is less variable as shown for the semi-arid to arid steppe vegetation [Chapter 3, 5] a rather invariable apparent fractionation is assumed to represent the meteoric water isotope signal (Hou et al., 2007b).
115
7 Conclusion and future research Chapter 7
Conclusion and future research
7.1 Conclusion
The results from the studies of sedimentary n-alkane δD values and their application within a multi-proxy approach to reconstruct variations of the hydrological cycle at Nam Co, Central Tibet during the Late Quaternary showed that n-alkane δD values are suitable to reconstruct climate induced changes in the isotopic composition of their source water. In association with the existing knowledge on the hydrogen isotope fractionation, the relationships between the source water and n-alkane δD values and the driving forces that
influence the sedimentary n-alkane δD values were further specified and partially quantitatively assessed. It has been shown that the amplitudes of the climate signal provided by terrestrial n-alkane δD values are larger than initially induced by the primary signal of the meteoric water. This is interpreted as a consequence of positive feedback mechanisms due to the additional influence of evapotranspiration that amplifies the response in n-alkane δD values. Thus, leaf wax n-alkane δD values reveal as more sensitive
recorder of past climate conditions when compared with δ18O from lacustrine carbonates.
The relative humidity as an integral of moisture availability and air temperature is elaborated as the most important climate relevant factor influencing the sedimentary n-alkane δD values as it controls the degree of evapotranspiration and hence, the positive
feedback that amplifies the response of n-alkane δD values. Species specific influence on the degree of evapotranspiration due to plant physiology and water use efficiency is suggested to be of minor importance for the paleoclimatic interpretation of deuterium records if they are based on the weighted mean odd-carbon numbered long chain n-alkane nC27/29/31 δD values. In addition, the spatio-temporally integrated terrestrial deuterium signal as a result of prolonged residence times in catchments reservoirs further averages the hydrogen isotope signal likewise reducing the impact of factors acting on the species level.
Thus, with the possibility to reconstruct relative changes in the strength of evapotranspiration and to quantitatively assess past E/I ratios the basis is provided to deduct the evapotranspirative deuterium enrichment from sedimentary n-alkane δD values in order to recalculate the initial source water isotopic composition. Nevertheless, on the one hand this requires the calibration of present day E/I ratios to evapotranspiration rates of a catchment. On the other, there is still demand on general transfer functions being
116
essential to elaborate the actual influence of evapotranspiration on n-alkane δD values and moreover to differentiate between the primary environmental impact due to relative humidity and secondary alteration at the vegetation level.
It should finally be noted that the integration of multiple paleoclimate information substantially enhances the interpretative strength of a single climate proxy. Moreover it offers the possibility to further elaborate the environmental parameter that control the climate signal provided by a rather new and emerging climate proxy. In this context, especially climate proxies that provide independent information on the stable isotope signatures either representing the lake or the meteoric water are essential. In addition, modelling approaches need to be included since they are shown to provide substantial understanding of the mechanisms of climatic changes in the past and offer the possibility to disentangle their causes and effects.
7.2 Initial approaches for future research
7.2.1 Environmental impact on D/H fractionation between source water and n-
alkanes
The afore-going discussion above all emphasized the persisting need to quantitatively assess the influence of environmental conditions on the hydrogen isotopic composition of n-alkanes in order to strengthen the interpretation of sedimentary n-alkane δD values in paleoclimate studies. In this context, systematic studies on aquatic and terrestrial–derived n-alkane δD values and their source waters along well defined gradients of the influencing climatic parameter are essential. These transect studies provide present day local transfer functions for the incorporation of the stable isotope signal in the biomarker lipids that offer the basis for the interpretation of the paleoclimate records. Although already several surface sediment studies covering lake transects along climatic gradients in Europe and Northern America (Huang et al., 2004; Sachse et al., 2004) largely contributed to the current knowledge on the environmental impact on the hydrogen isotopic composition of n-alkanes, further transect studies need to specifically account for the above elaborated parameter. Thus, plants with different physiological characteristics in terms of their leaf architecture, rooting depth and water use efficiency need to be considered and interpreted separately. Moreover, the extraction of soil and leaf water is essential to specify the evapotranspirative enrichment as well as the isotopic composition of the water actually used for lipid biosynthesis. Therefore, multiple sampling during the course of the day as well as during the vegetation period needs to be performed since large daily variations in leaf water δD values have been shown (Cernusak et al., 2002; Cuntz et al., 2007). A reliable transfer function for aquatic-derived n-alkanes further requires a closed lake system where stable water isotopic measurements of all inflows are available in addition to the overall necessary meteoric water δD values.
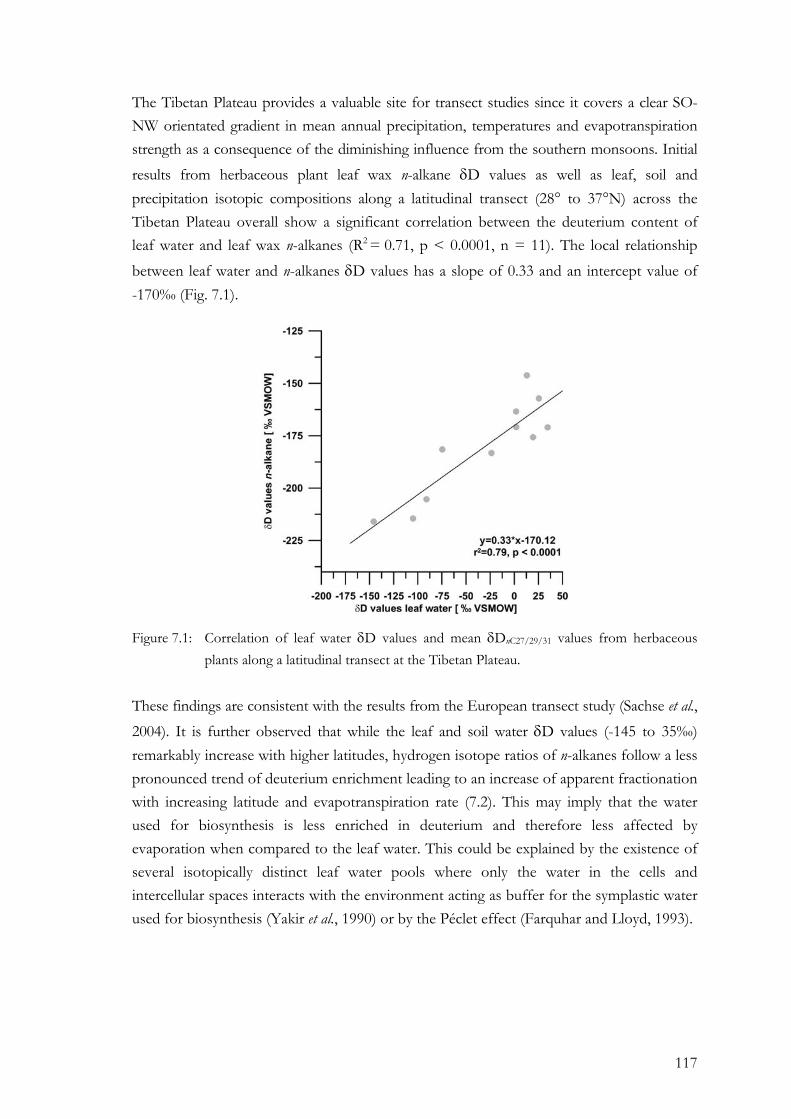
117
The Tibetan Plateau provides a valuable site for transect studies since it covers a clear SO-NW orientated gradient in mean annual precipitation, temperatures and evapotranspiration strength as a consequence of the diminishing influence from the southern monsoons. Initial results from herbaceous plant leaf wax n-alkane δD values as well as leaf, soil and precipitation isotopic compositions along a latitudinal transect (28° to 37°N) across the Tibetan Plateau overall show a significant correlation between the deuterium content of leaf water and leaf wax n-alkanes (R2 = 0.71, p < 0.0001, n = 11). The local relationship between leaf water and n-alkanes δD values has a slope of 0.33 and an intercept value of -170‰ (Fig. 7.1).
Figure 7.1: Correlation of leaf water δD values and mean δDnC27/29/31 values from herbaceous plants along a latitudinal transect at the Tibetan Plateau.
These findings are consistent with the results from the European transect study (Sachse et al., 2004). It is further observed that while the leaf and soil water δD values (-145 to 35‰) remarkably increase with higher latitudes, hydrogen isotope ratios of n-alkanes follow a less pronounced trend of deuterium enrichment leading to an increase of apparent fractionation with increasing latitude and evapotranspiration rate (7.2). This may imply that the water used for biosynthesis is less enriched in deuterium and therefore less affected by evaporation when compared to the leaf water. This could be explained by the existence of several isotopically distinct leaf water pools where only the water in the cells and intercellular spaces interacts with the environment acting as buffer for the symplastic water used for biosynthesis (Yakir et al., 1990) or by the Péclet effect (Farquhar and Lloyd, 1993).
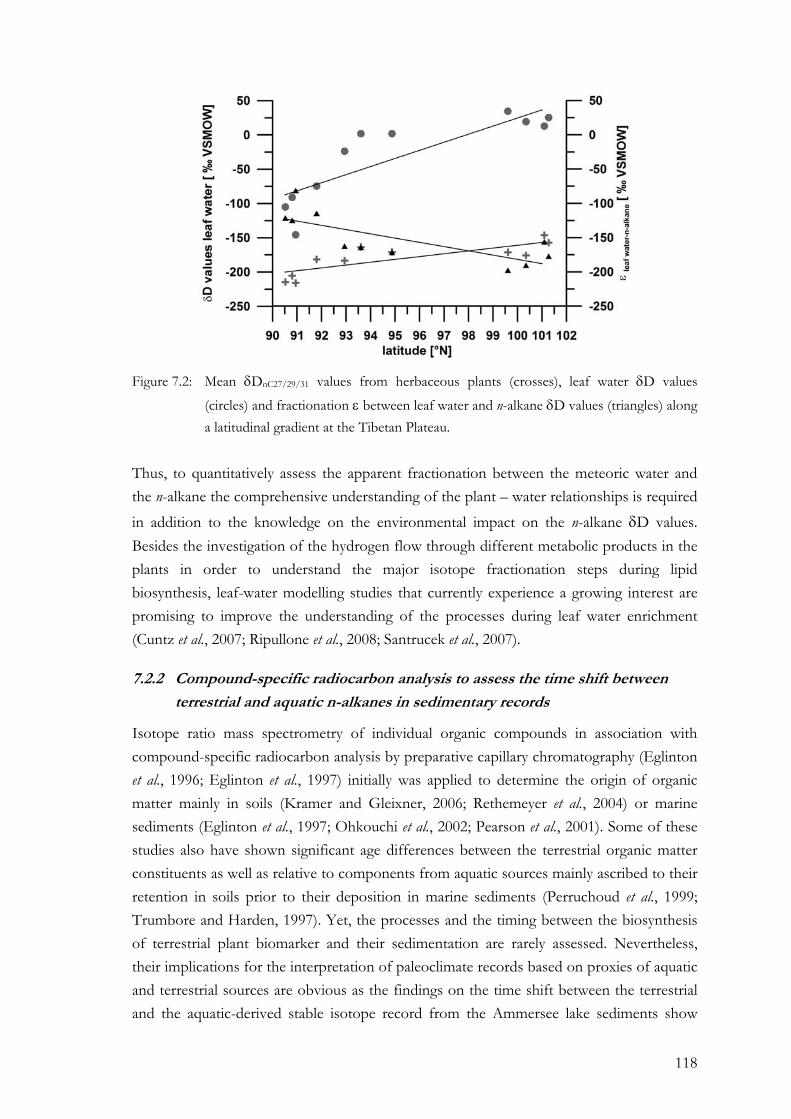
118
Figure 7.2: Mean δDnC27/29/31 values from herbaceous plants (crosses), leaf water δD values
(circles) and fractionation ε between leaf water and n-alkane δD values (triangles) along a latitudinal gradient at the Tibetan Plateau.
Thus, to quantitatively assess the apparent fractionation between the meteoric water and the n-alkane the comprehensive understanding of the plant – water relationships is required in addition to the knowledge on the environmental impact on the n-alkane δD values. Besides the investigation of the hydrogen flow through different metabolic products in the plants in order to understand the major isotope fractionation steps during lipid biosynthesis, leaf-water modelling studies that currently experience a growing interest are promising to improve the understanding of the processes during leaf water enrichment (Cuntz et al., 2007; Ripullone et al., 2008; Santrucek et al., 2007).
7.2.2 Compound-specific radiocarbon analysis to assess the time shift between
terrestrial and aquatic n-alkanes in sedimentary records
Isotope ratio mass spectrometry of individual organic compounds in association with compound-specific radiocarbon analysis by preparative capillary chromatography (Eglinton et al., 1996; Eglinton et al., 1997) initially was applied to determine the origin of organic matter mainly in soils (Kramer and Gleixner, 2006; Rethemeyer et al., 2004) or marine sediments (Eglinton et al., 1997; Ohkouchi et al., 2002; Pearson et al., 2001). Some of these studies also have shown significant age differences between the terrestrial organic matter constituents as well as relative to components from aquatic sources mainly ascribed to their retention in soils prior to their deposition in marine sediments (Perruchoud et al., 1999; Trumbore and Harden, 1997). Yet, the processes and the timing between the biosynthesis of terrestrial plant biomarker and their sedimentation are rarely assessed. Nevertheless, their implications for the interpretation of paleoclimate records based on proxies of aquatic and terrestrial sources are obvious as the findings on the time shift between the terrestrial and the aquatic-derived stable isotope record from the Ammersee lake sediments show
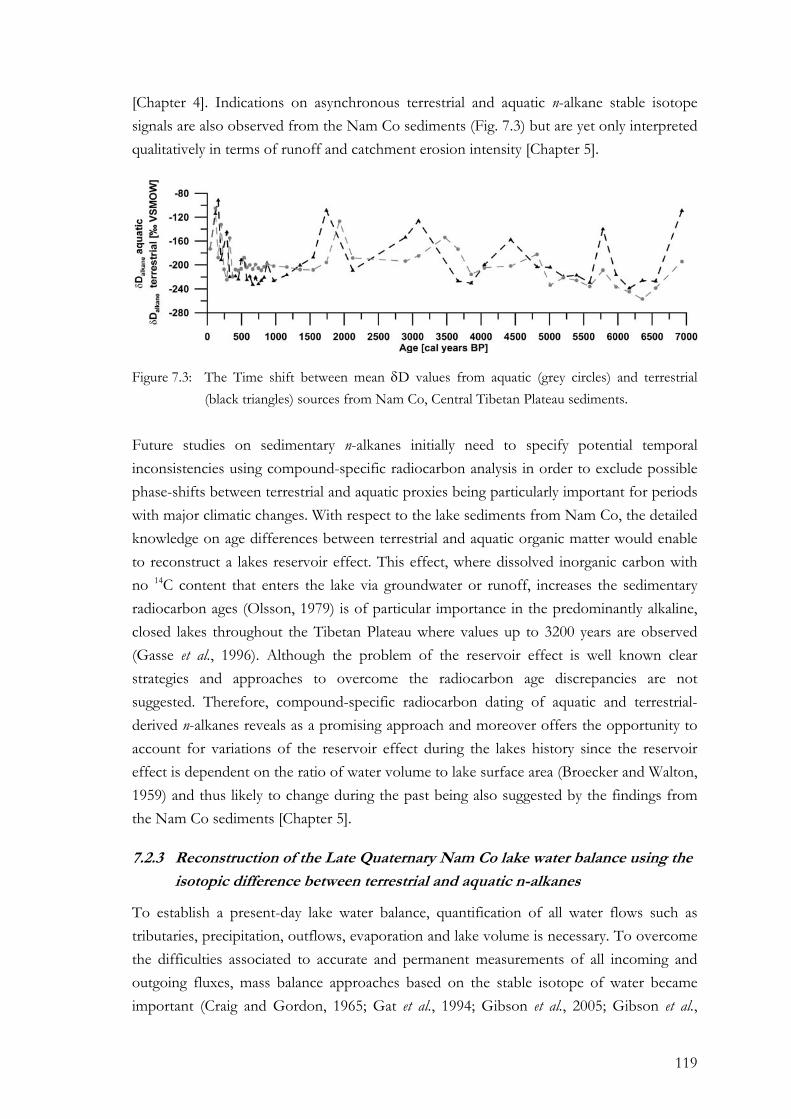
119
[Chapter 4]. Indications on asynchronous terrestrial and aquatic n-alkane stable isotope signals are also observed from the Nam Co sediments (Fig. 7.3) but are yet only interpreted qualitatively in terms of runoff and catchment erosion intensity [Chapter 5].
Figure 7.3: The Time shift between mean δD values from aquatic (grey circles) and terrestrial (black triangles) sources from Nam Co, Central Tibetan Plateau sediments.
Future studies on sedimentary n-alkanes initially need to specify potential temporal inconsistencies using compound-specific radiocarbon analysis in order to exclude possible phase-shifts between terrestrial and aquatic proxies being particularly important for periods with major climatic changes. With respect to the lake sediments from Nam Co, the detailed knowledge on age differences between terrestrial and aquatic organic matter would enable to reconstruct a lakes reservoir effect. This effect, where dissolved inorganic carbon with no 14C content that enters the lake via groundwater or runoff, increases the sedimentary radiocarbon ages (Olsson, 1979) is of particular importance in the predominantly alkaline, closed lakes throughout the Tibetan Plateau where values up to 3200 years are observed (Gasse et al., 1996). Although the problem of the reservoir effect is well known clear strategies and approaches to overcome the radiocarbon age discrepancies are not suggested. Therefore, compound-specific radiocarbon dating of aquatic and terrestrial-derived n-alkanes reveals as a promising approach and moreover offers the opportunity to account for variations of the reservoir effect during the lakes history since the reservoir effect is dependent on the ratio of water volume to lake surface area (Broecker and Walton, 1959) and thus likely to change during the past being also suggested by the findings from the Nam Co sediments [Chapter 5].
7.2.3 Reconstruction of the Late Quaternary Nam Co lake water balance using the
isotopic difference between terrestrial and aquatic n-alkanes
To establish a present-day lake water balance, quantification of all water flows such as tributaries, precipitation, outflows, evaporation and lake volume is necessary. To overcome the difficulties associated to accurate and permanent measurements of all incoming and outgoing fluxes, mass balance approaches based on the stable isotope of water became important (Craig and Gordon, 1965; Gat et al., 1994; Gibson et al., 2005; Gibson et al.,
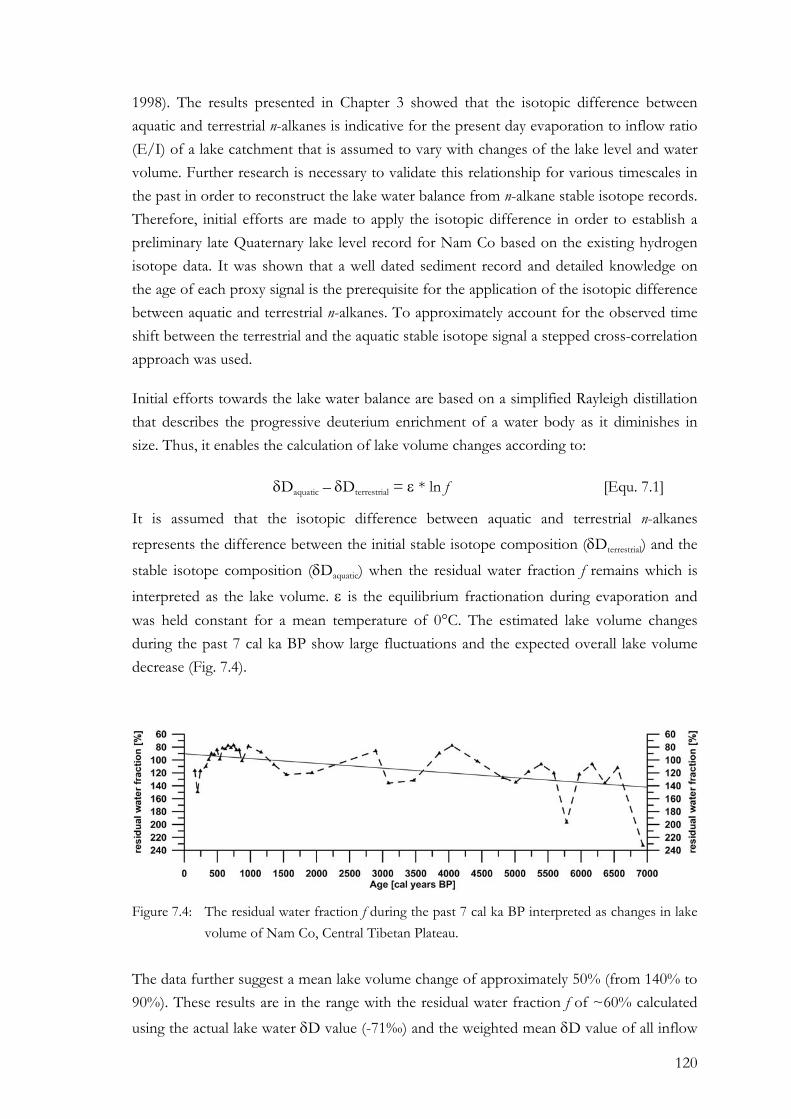
120
1998). The results presented in Chapter 3 showed that the isotopic difference between aquatic and terrestrial n-alkanes is indicative for the present day evaporation to inflow ratio (E/I) of a lake catchment that is assumed to vary with changes of the lake level and water volume. Further research is necessary to validate this relationship for various timescales in the past in order to reconstruct the lake water balance from n-alkane stable isotope records. Therefore, initial efforts are made to apply the isotopic difference in order to establish a preliminary late Quaternary lake level record for Nam Co based on the existing hydrogen isotope data. It was shown that a well dated sediment record and detailed knowledge on the age of each proxy signal is the prerequisite for the application of the isotopic difference between aquatic and terrestrial n-alkanes. To approximately account for the observed time shift between the terrestrial and the aquatic stable isotope signal a stepped cross-correlation approach was used.
Initial efforts towards the lake water balance are based on a simplified Rayleigh distillation that describes the progressive deuterium enrichment of a water body as it diminishes in size. Thus, it enables the calculation of lake volume changes according to:
δDaquatic – δDterrestrial = ε * ln f [Equ. 7.1]
It is assumed that the isotopic difference between aquatic and terrestrial n-alkanes represents the difference between the initial stable isotope composition (δDterrestrial) and the
stable isotope composition (δDaquatic) when the residual water fraction f remains which is
interpreted as the lake volume. ε is the equilibrium fractionation during evaporation and was held constant for a mean temperature of 0°C. The estimated lake volume changes during the past 7 cal ka BP show large fluctuations and the expected overall lake volume decrease (Fig. 7.4).
Figure 7.4: The residual water fraction f during the past 7 cal ka BP interpreted as changes in lake volume of Nam Co, Central Tibetan Plateau.
The data further suggest a mean lake volume change of approximately 50% (from 140% to 90%). These results are in the range with the residual water fraction f of ~60% calculated using the actual lake water δD value (-71‰) and the weighted mean δD value of all inflow
121
streams (-122‰) [Chapter 3]. These findings indicate that the isotopic difference serves to infer reliable data on past water balance fluctuations although yet, it provides only information on the relative changes of the water volume. Further research is needed to infer quantitative estimates. Therefore, knowledge on the actual lake volume is essential that above all requires detailed bathymetric data in order to provide lake water depths and to finally enable to infer the corresponding lake levels. In addition, species assemblages from benthic ostracodes could provide data on former lake levels that could be related to the relative changes in lake water volumes.
7.2.4 Comparison between the Nam Co deuterium records with ice core records
Ice cores directly capture the stable water isotope signal within the ice at high temporal resolutions and thus, are the most suitable archive for reconstructions of the hydrological cycle in the past. In order to provide an independent climate signal that reflects isotopic changes of meteoric water, future studies on the Late Quaternary monsoon history at the Tibetan Plateau should focus the comparison of the Nam Co deuterium record with suitable ice core data. The 18O ice core record from Dasuopu glacier located at the Central Tibetan Plateau is assumed to reflect variations of the southern monsoons with moisture coming mainly from the India Ocean during the summer and from the Atlantic Ocean during the winter (Thompson et al., 2006; Thompson et al., 2000b; Yao et al., 2002). The δ18O values from Dasuopu reflect mainly temperature induced changes in mean annual precipitation and additional changes in moisture availability ascribed to monsoonal rainfall intensity. The initial comparison between the δD n-alkane record from Nam Co and δ18O from Dasuopu during the last 1,000 cal years BP showed a remarkable enrichment in heavier isotopes almost synchronously at approximately 400 cal years BP (Fig. 7.5).
The enrichment is ascribed to increased mean air temperatures whereas the following larger amplitudes of isotope fluctuations result from changes in moisture availability. Pronounced positive δ18O excursions at Dasuopu reflect monsoon failures (Thompson et al., 2003). Although the Nam Co deuterium record shows episodes of significant deuterium enrichment, the low temporal resolution as well as the lack of data for the last 150 years does not account to accurately correlate both records. Nevertheless, these results may approve that climate variability during the late Holocene was mainly controlled by southern monsoon moisture supply.
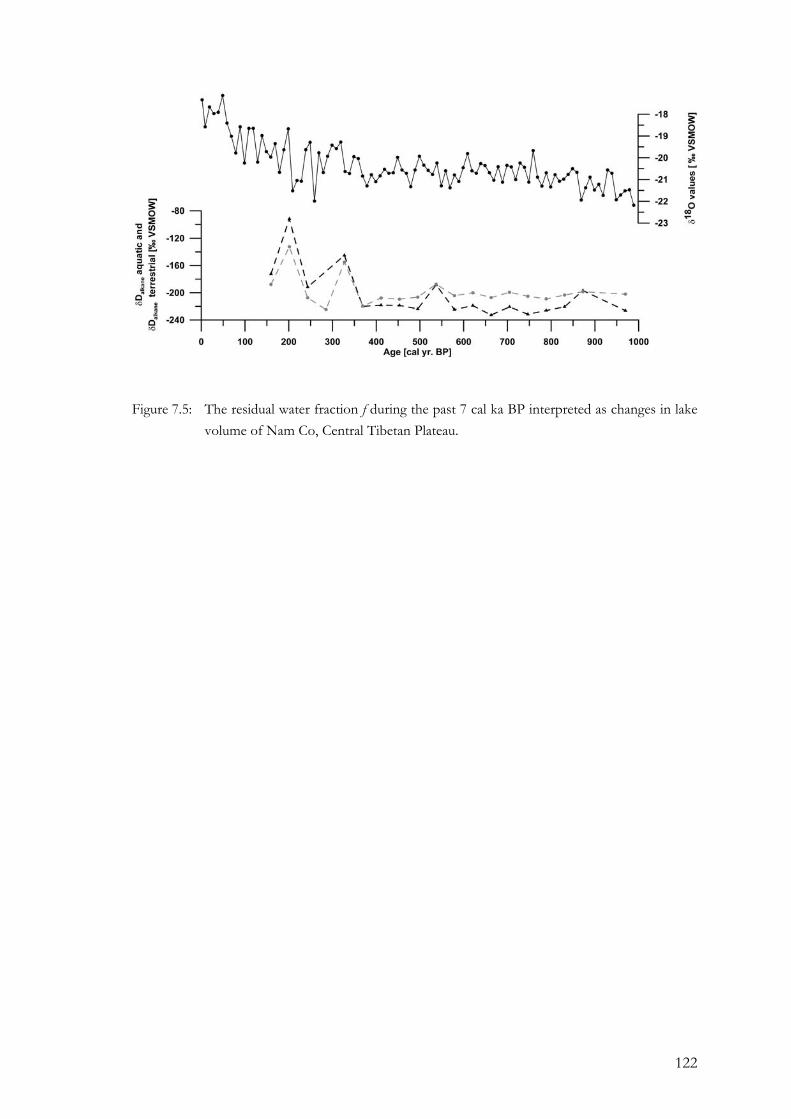
122
Figure 7.5: The residual water fraction f during the past 7 cal ka BP interpreted as changes in lake volume of Nam Co, Central Tibetan Plateau.
123
Summary
The present day understanding of the Earths climate and its natural variability is largely based on the reconstruction of past environmental conditions. Thus, qualitative and quantitative data characterizing these environmental conditions are required. Since direct observation of climate parameter through instrumental records only started in the 19th century, so called climate proxies are essential. Proxy data are based on measurements of chemical, physical or biological parameter that reflect past environmental conditions in a known and quantitative manner. A vast variety of proxy sources such as lake sediments, tree rings, pollen or ice cores is available. Lake sediments are particularly valuable as they preserve both terrestrial and aquatic records of climate conditions. In the deposited organic matter so called biomarkers are incorporated. These individual molecules derive from distinct biotic sources. Of particular interest amongst all biomarkers are n-alkanes because different classes of these aliphatic hydrocarbons serve to distinguish between terrestrial and aquatic sources. Organisms and plants that synthesize n-alkanes use their ambient water as their primary source of hydrogen. Thus, aquatic-derived n-alkanes from water plants and algae preserve the stable hydrogen isotopic composition of the lake water. In turn, n-alkanes from terrestrial plants record the isotopic signature of meteoric water modified by soil and leaf water evapotranspiration. Consequently, the analysis of δD values from sedimentary n-alkanes provides a valuable tool to reconstruct the isotopic composition of their hydrogen source and hence changes in the hydrological cycle in the past. The isotopic composition of the particular n-alkane reveals an isotopic difference relative to the source water. Although this hydrogen isotope fractionation is basically a function of the biosynthetic pathway, it additionally includes a yet unquantified modification by environmental factors that control the degree of the influence through evapotranspiration.
Addressing these issues, this thesis contributes to a better understanding of the environmental influences on the hydrogen isotope fractionation. The findings further provide knowledge to strengthen the interpretation of the climate signal recorded by sedimentary n-alkane δD values and to reconstruct climate induced changes in the hydrological cycle in the past.
The methodological approach of this research is based on the following key activities:
• A calibration study was performed in order to assess the influence of relative humidity and evapotranspiration on the hydrogen isotope fractionation. Therefore, the deuterium content of surface sedimentary n-alkanes and plant biomass from the arid Nam Co catchment, Central Tibet and the humid Holzmaar, Germany was investigated. The stable water isotopes (δD, δ18O) from the major fluxes of the Nam Co hydrological cycle (inflow streams, precipitation, lake water) were
124
measured and served to understand the present day environmental influence on the n-alkane δD values.
• The influence of temperature induced changes of the isotopic composition of the water source on lacustrine n-alkane δD values was evaluated through the analyses of sediments from the period of the last deglaciation during the Allerød and the Younger Dryas. Therefore, lacustrine n-alkane deuterium records were compared with δ18O values inferred from deep lake ostracods from Ammersee, Germany and Lac d’Annecy, France. The comparison between those two different climate proxy signals moreover specified the climatic information that is integrated by the sedimentary n-alkane δD values.
• Lacustrine n-alkane δD values were applied to reconstruct the climate induced changes of the hydrological cycle of the Nam Co, Central Tibet in association to monsoon circulation changes during the Late Quaternary. Using a multi-proxy approach the paleoclimate information from the sedimentary n-alkane δD values were correlated with paleoenvironmental signals from other independent proxies in order to enhance the interpretative strength of the proxy signal.
The following results contributed to a quantitative understanding on the responses
of stable hydrogen isotope signals from aquatic and terrestrial derived n-alkanes to
changes in environmental conditions:
1) The comparison between n-alkane δD values from lake surface sediments deposited under humid and arid climate conditions showed that under humid conditions vascular plant n-alkanes are deuterium enriched by ~ 30‰ when compared to aquatic n-alkanes due to soil- and leaf water evapotranspiration. In contrast, under semi-arid to arid climate conditions the lacustrine aquatic n-alkanes are enriched in deuterium and isotopically heavier by ~ 68‰ than terrestrial-derived n-alkanes. This enrichment is the result of exceptional lake water evaporation. Consequently, the isotopic difference between aquatic and terrestrial n-alkanes pursues the opposite direction under arid climates when compared to humid conditions and therefore reflects the general hydro-climate characteristics of the lake system.
2) The isotopic difference between aquatic and terrestrial derived n-alkanes provides a direct analogue for the deuterium content deviation from lake water and water inflow via tributaries and precipitation. As the degree of deuterium enrichment between present day lake water and inflows enables to estimate the proportion of evaporated water related to the inflow, the difference between aquatic and terrestrial n-alkane δD values can be applied to quantitatively reconstruct changes of lake water evaporation.
125
3) The comparison between δ18O values inferred from deep lake ostracods and terrestrial
derived n-alkane δD values revealed a time shift for the terrestrial signal of ~ 200 years at Ammersee and ~ 100 years at Lac d’Annecy. This time lag is interpreted as the site specific terrestrial residence time characterizing as the period between the biosynthesis of a certain compound until its deposition within the sedimentary record.
4) The evaluation of the paleoclimatic information from the Ammersee and the Lac d’Annecy stable isotope records showed that the temperature induced changes of precipitation account for only ~ 50% of the variation in the deuterium content while the residual is mainly a function of evapotranspiration and to a lesser degree of vegetation change. So, the primary induced isotopic signal by the source water is modified by additional climate parameters that control the strength of evapotranspiration. Thus, the amplitudes of response in terrestrial leaf wax n-alkane δD values are larger than the climate
induced changes of their source water and the n-alkane δD values reveal more sensitive to
climate induced changes of their water source when compared with ostracode δ18O.
The paleoclimatic interpretation of lacustrine n-alkane δD values from Ammersee,
Lac d’Annecy and Nam Co provided novel insights into the environmental
conditions during the last deglaciation and the Late Quaternary:
1) The mid-Younger Dryas (YD) event which is recorded as a short term positive excursion in the δ18O values at the Ammersee as well as in the Greenland ice cores is reflected in the deuterium records and thus, is described at Lac d’Annecy for the first time.
2) The Ammersee n-alkane deuterium record served to derive the deuterium-excess (d-excess) in precipitation as second order climate parameter. The d-excess revealed substantial changes in moisture source areas throughout the Younger Dryas. The sources of the local precipitation at Ammersee alternated between moisture from the Atlantic and moisture from the European continent via evapotranspiration.
3) The higher d-excess for mid-YD event points to moisture from the continent. Moreover, the mid-YD event is not significant within the d-excess record. Thus, the causes of the mid-YD event as a consequence of substantial changes in North Atlantic circulation are called into question. Hence, processes acting locally on the site of atmospheric moisture condensation are assumed to be responsible for the amplification of the response in n-alkane δD values for the mid-YD event.
4) The lacustrine n-alkane δD values served to reconstruct Late Quaternary lake level fluctuations at Nam Co, Central Tibet associated to monsoonal circulation:
126
• Aquatic n-alkane δD values approve the overall trend to a decreasing lake level since they become gradually deuterium enriched during the Late Quaternary.
• The isotopic difference between terrestrial and aquatic-derived n-alkane δD values showed changes of the evapotranspiration strength and emphasised that the lake experienced periods where either pronounced humid or arid climate conditions prevailed. These periods were associated with episodically increasing or declining lake levels.
• Large fluctuations of the terrestrial derived n-alkane δD values pointed to changes in the precipitation regime. Notable deuterium depletion resulted from intense monsoonal rainfall, while higher δD values indicated convective rains characterized by moisture recycling and increased evaporation rates.
• The time shift between terrestrial and aquatic-derived n-alkanes reflected the intensity of catchment runoff and erosion that in turn were directly associated to the amount of rainfall and thus to monsoonal intensity.
Based on the studies on sedimentary n-alkane δD values presented in this thesis it is
concluded that n-alkane δD values are suitable to reconstruct climate induced changes in the isotopic composition of their source water. The amplitudes of the climate signal provided by terrestrial n-alkane δD values are larger than initially induced by the primary signal of the meteoric water. This amplification is interpreted as a consequence of positive feedback mechanisms due to the additional influence of evapotranspiration that amplifies the response in n-alkane δD values. The relative humidity as an integral of moisture availability and air temperature is elaborated as the most important climate relevant factor influencing the n-alkane δD values. It controls the degree of evapotranspiration and hence,
the positive feedback that amplifies the response of n-alkane δD values. Species specific influence on the degree of evapotranspiration due to plant physiology and water use efficiency is assumed to be of minor importance for the paleoclimatic interpretation of deuterium records if they are based on the weighted mean odd-carbon numbered long chain n-alkane nC27/29/31 δD values. In addition, the spatio-temporally integrated terrestrial deuterium signal as a result of prolonged residence times in catchments reservoirs further averages the hydrogen isotope signal likewise reducing the impact of factors acting on the species level.
Overall, the study approach presented in this thesis where multiple paleoclimate information were combined showed that the integration of knowledge substantially enhanced the interpretative strength of a single climate proxy and offers the possibility to specify the environmental parameter controlling the climate signal provided by a rather new and emerging proxy.
127
Kurzfassung
Das heutige Verständnis unseres Klimas und seiner natürlichen Variabilität basiert zu einem großen Teil auf der Rekonstruktion von Umweltbedingungen in der Vergangenheit. Dafür werden sowohl qualitative als auch quantitative Datensätze klimarelevanter Parameter benötigt. Daten, die durch instrumentelle Aufzeichnungen erfasst wurden, liegen allerdings erst seit dem 19. Jahrhundert vor. Hier nutzt die Paläoklimaforschung so genannte Klimaproxies, das heißt indirekte Klimazeiger, die auf chemischen, physikalischen oder biologischen Messgrößen basieren und die Umweltbedingungen quantitativ widerspiegeln. Proxydaten können aus einer Vielzahl von natürlichen Archiven wie zum Beispiel Seesedimenten, Baumringen, Pollen oder Eiskernen abgeleitet werden. Seesedimente gelten als besonders geeignetes Archiv, da in ihnen Klimazeugen sowohl terrestrischer als auch aquatischer Umweltbedingungen abgelagert werden. Die sedimentäre organische Substanz enthält molekulare Fossilien, so genannte Biomarker, die eindeutig einer Herkunftsquelle zugeordnet werden können und damit Auskunft zur Zusammensetzung vergangener Lebensgemeinschaften geben. n-Alkane gehören zur Stoffgruppe der Kohlenwasserstoffe und lassen eine Unterscheidung zwischen aquatischer und terrestrischer sedimentärer organischer Substanz zu. Ihre primäre Wasserstoffquelle ist das unmittelbare Umgebungswasser. n-Alkane aquatischer Herkunft aus Wasserpflanzen und Algen spiegeln den Isotopengehalt des Seewassers wider. Die terrestrische Vegetation zeichnet hingegen ein durch Evapotranspiration des Boden- und Blattwassers beeinflusstes Niederschlagssignal auf. Wasserstoffisotopenverhältnisse (δD-Werte) sedimentärer n-Alkane können somit genutzt werden, die Isotopensignatur ihrer Wasserstoffquelle und damit Veränderungen des Wasserkreislaufes in der Vergangenheit zu rekonstruieren. Beim Einbau des Wasserstoffes in die Biosyntheseprodukte der n-Alkane kommt es zu einer Isotopenfraktionierung, die als eine Funktion der Biosynthese zusätzlich durch Umweltbedingungen beeinflusst wird. Die Einflussfaktoren wie die relative Luftfeuchte oder pflanzenphysiologische Eigenschaften sind zwar weitgehend bekannt, jedoch bisher nicht quantitativ erfasst.
Die vorliegende Arbeit trägt zu einem besseren Verständnis der Umwelteinflüsse bei der Wasserstoffisotopenfraktionierung bei. Die Ergebnisse dienen weiterhin dazu, die Interpretation des klimatischen Signals sedimentärer δD-Werte der n-Alkane zu stützen, um diese zur Rekonstruktion von klimainduzierten Veränderungen des Wasserkreislaufes in der Vergangenheit zu nutzen.
Die methodische Vorgehensweise wurde durch die folgenden Arbeitschwerpunkte bestimmt:
• Der Einfluss von relativer Luftfeuchte und Evapotranspiration auf die
128
Isotopenfraktionierung wurde im Rahmen einer Kalibrierungsstudie in rezenten Ökosystemen ermittelt. Dafür wurden Wasserstoffisotopenverhältnisse von n-Alkanen aus Oberflächensedimenten und Pflanzen des ariden Nam Co Einzugsgebietes (Zentrales Tibetisches Plateau) mit bestehenden Daten aus dem humiden Holzmaar (Deutschland) verglichen. Messungen der Isotopenverhältnisse (δD, δ18O) des Wassers des Nam Co, seiner wichtigsten Zuflüsse sowie des Niederschlages dienten dem Verständnis der aktuellen Umwelteinflussfaktoren auf die Isotopensignatur der n-Alkane.
• Die Auswirkung temperaturgesteuerter Änderungen der Isotopensignatur der Wasserquelle auf die δD-Werte lakustriner n-Alkane wurde durch die Analyse von Sedimenten aus dem Zeitraum der letzten Enteisung während des Allerød und der Jüngeren Dryas ermittelt. Dafür wurden δD-Werte lakustriner n-Alkane mit
δ18O-Werten benthischer Ostrakoden aus dem Ammersee (Deutschland) und dem Lac d’Annecy (Frankreich) verglichen. Der Vergleich der beiden Klimaproxies trug außerdem dazu bei, die klimarelevanten Informationen, die von sedimentären δD-Werten der n-Alkane integriert werden, zu spezifizieren.
• Die δD-Werte der lakustrinen n-Alkane wurden genutzt, um klimagesteuerte Schwankungen des hydrologischen Kreislaufes des Nam Co in Verbindung mit der Spätquartären Monsunzirkulation zu rekonstruieren. Durch die Verwendung eines Multi-Proxy-Ansatzes konnten die Paläoklimainformationen der δD-Werte mit sedimentologischen, mineralogischen und geomorphologischen Daten korreliert werden. Dadurch wurde die Interpretation des klimatischen Signals der sedimentären δD-Werte der n-Alkane gestützt.
Die Ergebnisse der vorliegenden Arbeit tragen zu einem besseren Verständnis der
Auswirkung von klimarelevanten Einflussfaktoren auf δD-Werte von n-Alkanen
aquatischer oder terrestrischer Herkunft bei:
1) Der Vergleich zwischen δD-Werten von sedimentären n-Alkanen, die unter humiden und ariden Klimabedingungen abgelagert wurden, hat gezeigt, dass die terrestrischen n-Alkane in humiden Klimaten relativ zu den aquatischen n-Alkanen um ~30‰ in Deuterium angereichert sind. Die Anreicherung ist die Folge der Evapotranspiration des Boden- und Blattwassers. Im Gegensatz dazu werden unter ariden Bedingungen die n-Alkane aquatischer Herkunft in Deuterium angereichert und sind um ~68‰ isotopisch schwerer als die terrestrischen n-Alkane. Die Anreicherung der aquatischen n-Alkane wird auf außergewöhnlich starke Evaporation des Seewassers zurückgeführt. Der isotopische Unterschied zwischen sedimentären terrestrischen und aquatischen n-Alkanen weist somit gegensätzliche Richtungen auf, je nachdem ob humide oder aride Klimabedingungen bei
129
deren Bildung vorherrschten.
2) Der isotopische Unterschied zwischen terrestrischen und aquatischen n-Alkanen ist direkt mit der Abweichung der Wasserstoffisotopensignatur des Seewassers von der gemittelten Wasserstoffisotopensignatur aller Zuflüsse einschließlich des Niederschlages vergleichbar. Die Stärke der Deuteriumanreicherung des Seewassers relativ zu allen Zuflüssen ermöglicht die Berechnung der Wassermenge, die verglichen mit der zugeführten Wassermenge verdunstet. Somit kann der isotopische Unterschied zwischen sedimentären terrestrischen und aquatischen n-Alkanen zur quantitativen Rekonstruktion von Änderungen der Evaporation des Seewassers verwendet werden.
3) Der Vergleich zwischen den δ18O-Werten benthischer Ostrakoden mit δD-Werten terrestrischer n-Alkane hat gezeigt, dass das Klimasignal terrestrischen Ursprungs um ~200 Jahre am Ammersee beziehungsweise um ~ 100 Jahre am Lac d’Annecy zeitverzögert nach dem aquatischen Signal aufgezeichnet wird. Dieser Zeitversatz wird als standortspezifische Verweilzeit terrestrischer organischer Substanz interpretiert, die den Zeitraum zwischen deren Biosynthese und ihrer Ablagerung im See umfasst.
4) Der Vergleich zwischen den paläoklimatischen Informationen aus beiden Isotopendatensätzen (δD, δ18O) des Ammersees und des Lac d’Annecy impliziert, dass lediglich 50% der Variationen des Wasserstoffisotopensignals durch Änderungen der mittleren Lufttemperaturen erklärt werden können. Der verbleibende Prozentsatz wird vorwiegend auf Änderungen der Evapotranspirationsrate sowie auf Änderungen in der Vegetationszusammensetzung zurückgeführt. Letzteren wird allerdings eine geringere Bedeutung beigemessen. Die primäre Isotopensignatur der Wasserquelle wird zusätzlich durch sekundäre beziehungsweise standortspezifische Einflussfaktoren modifiziert, sodass die Prozessantwort in den δD-Werten der terrestrischen n-Alkane verstärkt wird. Somit
zeigen sich die δD-Werte der terrestrischen n-Alkane als sensitiverer Klimaanzeiger als
δ18O-Werte des aquatischen Archivs.
Die paläoklimatische Interpretation der δD-Werte lakustriner n-Alkane aus dem
Ammersee, dem Lac d’Annecy und dem Nam Co liefert neue Erkenntnisse über die
Umweltbedingungen am Ende des Pleistozäns und des Spätquartärs.
1) Die δD-Werte der n-Alkane am Ammersee bestätigen eine kurze Wärmeperiode im
Verlauf der Jüngeren Dryas, die dort bisher als signifikante Anreicherung der δ18O-Werte
erfasst ist und durch einem zeitgleichen positiven Ausschlag der δ18O-Werte im
GRIP-Eiskern nachgewiesen ist. Auf Basis der δD-Werte wird dieses so genannte „mid-Younger Dryas event“ erstmals auch für den Lac d’Annecy nachgewiesen.
2) Mit Hilfe der δD-Werte lakustriner n-Alkane des Ammersees wurde der „Deuterium
130
Excess“ als Klimaparameter zweiter Ordnung abgeleitet. Dieser deutet im Verlauf der Jüngeren Dryas eine unterschiedliche Herkunft der niederschlagsbringenden Luftmassen im Ammerseeeinzugsgebiet an. Hohe Deuterium Excess Werte kennzeichnen Luftmassen aus dem Atlantik, während niedrige Deuterium Excess Werte atmosphärischer Feuchte, die durch Evaporation über dem Europäischen Kontinent generiert wird, charakterisieren.
3) Die hohen Deuterium Excess Werte während des „mid-Younger Dryas event“ verweisen auf eine kontinentale Quelle des Niederschlags. Des Weiteren ist das „mid-Younger Dryas event“ im Deuterium Excess Signal während der Jüngeren Dryas nicht signifikant ausgeprägt. Demnach müssen die bisherigen Hypothesen zur Ursache des „mid-Younger Dryas event“ als Folge von ausgeprägten Änderungen der Nordatlantischen Zirkulation hinterfragt werden. Die Prozesse, die zu einer starken Anreicherung der δD-Werte der n-Alkane geführt haben, wirkten somit am Ort der Kondensation der niederschlagsbringenden Luftmassen.
4) Die δD-Werte der lakustrinen n-Alkane des Nam Co ermöglichen die Rekonstruktion seiner Spätquartären Seespiegelschwankungen in Verbindung mit Schwankungen der Monsunintensität:
• Die graduelle Deuteriumanreicherung der n-Alkane aquatischer Herkunft spiegelt das kontinuierliche Absinken des Seespiegels des Nam Co seit dem mittleren Holozän wider.
• Schwankungen des isotopischen Unterschiedes zwischen den n-Alkanen terrestrischer und aquatischer Herkunft zeigen wechselnde Sedimentation unter humiden oder ariden Klimabedingungen. Diese Phasen zeichneten sich jeweils durch periodische Seespiegelanstiege beziehungsweise absinkende Seespiegel aus.
• Variationen der δD-Werte terrestrischer n-Alkane lassen Rückschlüsse auf das dominierende Niederschlagsregime zu. Deuteriumabgereicherte n-Alkane resultieren aus intensiven Monsunniederschlägen, während isotopisch schwere n-Alkane durch konvektive Niederschläge nach Rückgewinnung der Feuchte durch Evapotranspiration über der Seeoberfläche entstehen.
• Der Zeitversatz zwischen terrestrischem und aquatischem Klimasignal wurde lediglich qualitativ ausgewertet und als Anzeiger für niedrige beziehungsweise erhöhte Abfluss- und Erosionsraten, die wiederum direkt mit der Monsunintensität in Verbindung stehen, interpretiert.
Die Ergebnisse der vorliegenden Arbeit zeigen, dass substanzspezifische Wasserstoffisotopenverhältnisse sedimentärer n-Alkane geeignet sind, klimagesteuerte Schwankungen der Isotopenzusammensetzung der Wasserstoffquelle zu rekonstruieren.
131
Dabei fallen die Amplituden des Klimasignals der n-Alkane größer aus, als das induzierte Signal der Wasserquelle. Dieses Phänomen wird als Folge von positiven Rückkopplungsmechanismen, die die Prozessantwort der n-Alkan-δD-Werte durch den zusätzlichen Einfluss der Evapotranspiration verstärken, interpretiert. Als Integral der Lufttemperatur und der Feuchteverfügbarkeit der Atmosphäre stellt die relative Luftfeuchte den wichtigsten Umwelteinflussfaktor dar, welcher in den sedimentären δD-Werten der n-Alkane erhalten bleibt, da sie die Stärke der Evapotranspiration bestimmt
und somit die positive Rückkopplung und die Verstärkung der δD-Werte der n-Alkane steuert. Vegetationsspezifische Veränderungen der Auswirkungen der Evapotranspiration sind bei der paläoklimatischen Interpretation der δD-Werte von untergeordneter Bedeutung, wenn die Interpretation auf den gewichteten Mittelwerten der langkettigen n-Alkane (nC27/29/31) basiert. Die Verweilzeit des Signals der n-Alkane in terrestrischen Speichern führt weiterhin zu einer raumzeitlichen Integration der klimatischen Information. Dadurch werden untergeordnete Einflüsse auf Vegetationsebene zusätzlich gemittelt und treten bei paläoklimatischen Studien in den Hintergrund.
Die Studie hat gezeigt, dass die methodische Herangehensweise der vorliegenden Arbeit, welcher die komplementäre Interpretation verschiedener paläoklimatischer Datensätze zugrunde liegt, die Interpretationsstärke eines einzelnen Klimaproxies signifikant verbessert. Weiterhin wird deutlich, dass der Untersuchungsansatz gleichermaßen die Möglichkeit bietet, die das Klimasignal eines vergleichsweise neuen Klimaproxy steuernden Umwelteinflussfaktoren detaillierter zu beschreiben.
132
References
Ammann, B., 2000. Biotic responses to rapid climatic changes: Introduction to a multidisciplinary study of the Younger Dryas and minor oscillations on an altitudinal transect in the Swiss Alps. Palaeogeography Palaeoclimatology Palaeoecology 159, 191-201.
Ammann, B., Birks, H.J.B., Brooks, S.J., Eicher, U., von Grafenstein, U., Hofmann, W., Lemdahl, G., Schwander, J., Tobolski, K., Wick, L., 2000. Quantification of biotic responses to rapid climatic changes around the Younger Dryas - a synthesis. Palaeogeography Palaeoclimatology Palaeoecology 159, 313-347.
An, Z., Porter, S.C., Kutzbach, J.E., Xihao, W., Suming, W., Xiaodong, L., Xiaoqiang, L., Weijian, Z., 2000. Asynchronous Holocene optimum of the East Asian monsoon. Quaternary Science Reviews 19, 743-762.
Andersen, N., Paul, H.A., Bernasconi, S.M., McKenzie, J.A., Behrens, A., Schaeffer, P., Albrecht, P., 2001. Large and rapid climate variability during the Messinian salinity crisis: Evidence from deuterium concentrations of individual biomarkers. Geology 29, 799-802.
Anderson, N.J., Leng, M.J., 2004. Increased aridity during the early Holocene in West Greenland inferred from stable isotopes in laminated-lake sediments. Quaternary Science Reviews 23, 841-849.
Araguas-Araguas, L., Froehlich, K., Rozanski, K., 1998. Stable isotope composition of precipitation over southeast asia. Journal of Geophysical Research-Atmospheres 103, 28721-28742.
Araguas-Araguas, L., Froehlich, K., Rozanski, K., 2000. Deuterium and oxygen-18 isotope composition of precipitation and atmospheric moisture. Hydrological Processes 14, 1341-1355.
Araguas - Araguas, L., Froehlich, K., Rozanski, K., 1998. Stable isotope composition of precipitation over southeast asia. Journal of Geophysical Research-Atmospheres 103, 28721-28742.
Arp, G., Thiel, V., Reimer, A., Michaelis, W., Reitner, J., 1999. Biofilm exopolymers control microbialite formation at thermal springs discharging into the alkaline Pyramid Lake, Nevada, USA. Sedimentary Geology 126, 159-176.
Arz, H.W., Lamy, F., Patzold, J., 2006. A pronounced dry event recorded around 4.2 ka in brine sediments from the northern Red Sea. Quaternary Research 66, 432-441.
Augustin, L., Barbante, C., Barnes, P.R.F., Barnola, J.M., Bigler, M., Castellano, E., Cattani, O., Chappellaz, J., DahlJensen, D., Delmonte, B., Dreyfus, G., Durand, G., Falourd, S., Fischer, H., Fluckiger, J., Hansson, M.E., Huybrechts, P., Jugie, R., Johnsen, S.J., Jouzel, J., Kaufmann, P., Kipfstuhl, J., Lambert, F., Lipenkov, V.Y., Littot, G.V.C., Longinelli, A., Lorrain, R., Maggi, V., Masson-Delmotte, V., Miller, H., Mulvaney, R., Oerlemans, J., Oerter, H., Orombelli, G., Parrenin, F., Peel, D.A., Petit, J.R., Raynaud, D., Ritz, C., Ruth, U., Schwander, J., Siegenthaler, U., Souchez, R., Stauffer, B., Steffensen, J.P., Stenni, B., Stocker, T.F., Tabacco, I.E., Udisti, R., van de Wal, R.S.W., van den Broeke, M., Weiss, J., Wilhelms, F., Winther, J.G., Wolff, E.W., Zucchelli, M., Members, E.C., 2004. Eight glacial cycles from an Antarctic ice core. Nature 429, 623-628.
Avouac, J.P., Dobremez, J.F., Bourjot, L., 1996. Palaeoclimatic interpretation of a topographic profile across middle Holocene regressive shorelines of Longmu Co (western Tibet). Palaeogeography Palaeoclimatology Palaeoecology 120, 93-104.
Baas, M., Pancost, R., van Geel, B., Damste, J.S.S., 2000. A comparative study of lipids in Sphagnum species. Organic Geochemistry 31, 535-541.
Baertschi, P., 1976. Absolute O-18 Content of Standard Mean Ocean Water. Earth and Planetary Science Letters 31, 341-344.
133
Baier, J., Lucke, A., Negendank, J.F.W., Schleser, G.H., Zolitschka, B., 2004. Diatom and geochemical evidence of mid- to late Holocene climatic changes at Lake Holzmaar, West-Eifel (Germany). Quaternary International 113, 81-96.
Benedetti-Crouzet, E., 1972. Etude geodynamique du Lac d’Annecy et de son bassin versant. Universite de Paris VI Ph.D. thesis
Berking, J., 2007. Late Quaternary lake level changes of the lake Nam Co, Tibet, China, Diploma Thesis. Freie Universität, Berlin.
Bernasconi, S.M., Barbieri, A., Simona, M., 1997. Carbon and nitrogen isotope variations in sedimenting organic matter in Lake Lugano. Limnology and Oceanography 42, 1755-1765.
Bernstein, L., Bosch, P., Canziani, O., Chen, Z., Christ, R., Davidson, O., Hare, W., Huq, S., Karoly, D., Kattsov, V., Kundzewicz, Z., Liu, J., Lohmann, U., Manning, M., Matsuno, T., Menne, B., Metz, B., Mirza, M., Nicholls, N., Nurse, L., Pachauri, R., Palutikof, J., Parry, M., Qin, D., Ravindranath, N., Reisinger, A., Riahi, K., Rosenzweig, C., Rusticucci, M., Schneider, S., Sokona, Y., Solomon, S., Stott, P., Stouffer, R., Sugiyama, T., Swart, R., Tirpak, D., Vogel, C., Yohe, G., 2007. Climate Change 2007: Synthesis Report. An Assessment of the Intergovernmental Panel on Climate Change.
Bi, X., Sheng, G., Liu, X., Li, C., Fu, J., 2005. Molecular and carbon and hydrogen isotopic composition of n-alkanes in plant leaf waxes. Organic Geochemistry 36, 1405-1417.
Birks, H.H., Ammann, B., 2000. Two terrestrial records of rapid climatic change during the glacial-Holocene transition (14,000-9,000 calendar years BP) from Europe. Proceedings of the National Academy of Sciences of the United States of America 97, 1390-1394.
Booth, R.K., Jackson, S.T., Forman, S.L., Kutzbach, J.E., Bettis, E.A., Kreig, J., Wright, D.K., 2005. A severe centennial-scale drought in mid-continental North America 4200 years ago and apparent global linkages. Holocene 15, 321-328.
Bowen, G.J., Revenaugh, J., 2003. Interpolating the isotopic composition of modern meteoric precipitation. Water Resources Research 39, -.
Boyle, J.F., 2001. Inorganic geochemical methods in paleolimnology. In: W. Last, J.P. Smol (eds.), Tracking environmental change using lake sediments. Physical and geochemical methods. Kluwer, Dordrecht, Boston, London, pp. 83-142.
Brauer, A., Casanova, J., 2001. Chronology and depositional processes of the laminated sediment record from Lac d'Annecy, French Alps. Journal of Paleolimnology 25, 163-177.
Brauer, A., Endres, C., Gunter, C., Litt, T., Stebich, M., Negendank, J.F.W., 1999. High resolution sediment and vegetation responses to Younger Dryas climate change in varved lake sediments from Meerfelder Maar, Germany. Quaternary Science Reviews 18, 321-329.
Bray, E.E., Evans, E.D., 1961. Distribution of Normal-Paraffins as a Clue to Recognition of Source Beds. Geochimica Et Cosmochimica Acta 22, 2-15.
Brazdil, R., Pfister, C., Wanner, H., Von Storch, H., Luterbacher, J., 2005. Historical climatology in Europe - The state of the art. Climatic Change 70, 363-430.
Briffa, K.R., 2000. Annual climate variability in the Holocene: interpreting the message of ancient trees. Quaternary Science Reviews 19, 87-105.
Broecker, W.S., Kennett, J.P., Flower, B.P., Teller, J.T., Trumbore, S., Bonani, G., Wolfli, W., 1989. Routing of Meltwater from the Laurentide Ice-Sheet during the Younger Dryas Cold Episode. Nature 341, 318-321.
Broecker, W.S., Walton, A., 1959. The Geochemistry of C-14 in Fresh-Water Systems. Geochimica Et Cosmochimica Acta 16, 15-38.
Burgoyne, T.W., Hayes, J.M., 1998. Quantitative production of H-2 by pyrolysis of gas chromatographic effluents. Analytical Chemistry 70, 5136-5141.
Carlson, A.E., Clark, P.U., Haley, B.A., Klinkhammer, G.P., Simmons, K., Brook, E.J., Meissner, K.J., 2007. Geochemical proxies of North American freshwater routing during the Younger Dryas cold event. Proceedings of the National Academy of Sciences of the United States of America 104, 6556-6561.
Cernusak, L.A., Pate, J.S., Farquhar, G.D., 2002. Diurnal variation in the stable isotope composition of water and dry matter in fruiting Lupinus angustifolius under field conditions. Plant Cell and Environment 25, 893-907.
134
Chen, F.H., Cheng, B., Zhao, Y., Zhu, Y., Madsen, D.B., 2006a. Holocene environmental change inferred from a high-resolution pollen record, Lake Zhuyeze, arid China. Holocene 16, 675-684.
Chen, F.H., Huang, X.Z., Zhang, J.W., Holmes, J.A., Chen, J.H., 2006b. Humid Little Ice Age in and central Asia documented by Bosten Lake, Xinjiang, China. Science in China Series D-Earth Sciences 49, 1280-1290.
Chikaraishi, Y., Naraoka, H., 2003. Compound-specific delta D-delta C-13 analyses of n-alkanes extracted from terrestrial and aquatic plants. Phytochemistry 63, 361-371.
Chikaraishi, Y., Naraoka, H., Poulson, S.R., 2004. Carbon and hydrogen isotopic fractionation during lipid biosynthesis in a higher plant (Cryptomeria japonica). Phytochemistry 65, 323-330.
Clark, I., Fritz, P., 1997. Environmental isotopes in Hydrogeology. Lewis Publishers, New York. Closs, H., 1979. Die Klimasituation im Regierungsbezirk Trier. Beiträge zur Trierischen
Landeskunde, 326-377. Cole, J.E., Rind, D., Fairbanks, R.G., 1993. Isotopic responses to interannual climate variability
simulated by an atmospheric general circulation model. Quaternary Science Reviews 12, 387-406.
Collister, J.W., Rieley, G., Stern, B., Eglinton, G., Fry, B., 1994. Compound-specific [delta] 13C analyses of leaf lipids from plants with differing carbon dioxide metabolisms. Organic Geochemistry 21, 619-627.
Coplen, T.B., 1995. Reporting of stable hydrogen, carbon, and oxygen isotopic abundances - (Technical report). Geothermics 24, 708-712.
Craig, H., 1961. Isotopic Variations in Meteoric Waters. Science 133, 1702-1703. Craig, H., Gordon, L., 1965. Deuterium and oxygen 18 variation in the ocean and marine
atmosphere. Spoleto, Stable Isotopes in Oceanographic Studies and Paleotemperatures, 3-9.
Cranwell, P.A., Eglinton, G., Robinson, N., 1987. Lipids of Aquatic Organisms as Potential Contributors to Lacustrine Sediments .2. Organic Geochemistry 11, 513-527.
Cuntz, M., Ogee, J., Farquhar, G.D., Peylin, P., Cernusak, L.A., 2007. Modelling advection and diffusion of water isotopologues in leaves. Plant Cell and Environment 30, 892-909.
Danis, P.A., Masson-Delmotte, V., Stievenard, M., Guillemim, M.T., Daux, V., Naveau, P., von Grafenstein, U., 2006. Reconstruction of past precipitation beta O-18 using tree-ring cellulose delta O-18 and delta C-13: A calibration study near Lac d'Annecy, France. Earth and Planetary Science Letters 243, 439-448.
Danis, P.A., von Grafenstein, U., Masson-Delmotte, V., 2003. Sensitivity of deep lake temperature to past and future climatic changes: A modeling study for Lac d'Annecy, France, and Ammersee, Germany. Journal of Geophysical Research-Atmospheres 108
Danis, P.A., von Grafenstein, U., Masson-Delmotte, V., Planton, S., Gerdeaux, D., Moisselin, J.M., 2004. Vulnerability of two European lakes in response to future climatic changes. Geophysical Research Letters 31, -.
Dansgaard, W., 1964. Stable Isotopes in Precipitation. Tellus 16, 436-468. David, F., Farjanel, G., Jolly, M.P., 2001. Palyno- and chronostratigraphy of a long sequence from
Lac d'Annecy (northern outer Alps, France). Journal of Paleolimnology 25, 259-269. Dawson, D., Grice, K., Alexander, R., 2005. Effect of maturation on the indigenous delta D
signatures of individual hydrocarbons in sediments and crude oils from the Perth Basin (Western Australia). Organic Geochemistry 36, 95-104.
Dawson, T.E., 1993. Hydraulic Lift and Water-Use by Plants - Implications for Water-Balance, Performance and Plant-Plant Interactions. Oecologia 95, 565-574.
De Wit, J.C., Van der Sraaten, C.M., Mook, W.G., 1980. Determination of the absolute hydrogen isotopic ratio of V-SMOW and SLAP. Geostandards Newsletter 4, 33-36.
Delorme, L.D., 1989. Methods in Quaternary Ecology .7. Fresh-Water Ostracodes. Geoscience Canada 16, 85-90.
Deniro, M.J., Epstein, S., 1977. Mechanism of Carbon Isotope Fractionation Associated with Lipid-Synthesis. Science 197, 261-263.
135
Deniro, M.J., Epstein, S., 1981. Isotopic Composition of Cellulose from Aquatic Organisms. Geochimica Et Cosmochimica Acta 45, 1885-1894.
Dwyer, G.S., 2000. Geoscience: Unraveling the Signals of Global Climate Change. Science 287, 246-247.
Dykoski, C.A., Edwards, R.L., Cheng, H., Yuan, D., Cai, Y., Zhang, M., Lin, Y., Qing, J., An, Z., Revenaugh, J., 2005. A high-resolution, absolute-dated Holocene and deglacial Asian monsoon record from Dongge Cave, China. Earth and Planetary Science Letters 233, 71-86.
Eglinton, G., Hamilton, R.J., 1967. Leaf Epicuticular Waxes. Science 156, 1322. Eglinton, T.I., Aluwihare, L.I., Bauer, J.E., Druffel, E.R.M., McNichol, A.P., 1996. Gas
chromatographic isolation of individual compounds from complex matrices for radiocarbon dating. Analytical Chemistry 68, 904-912.
Eglinton, T.I., BenitezNelson, B.C., Pearson, A., McNichol, A.P., Bauer, J.E., Druffel, E.R.M., 1997. Variability in radiocarbon ages of individual organic compounds from marine sediments. Science 277, 796-799.
Ekpo, B.O., Oyo-Ita, O.E., Wehner, H., 2005. Even-n-alkane/alkene predominances in surface sediments from the Calabar River, SE Niger Delta, Nigeria. Naturwissenschaften 92, 341-346.
Elias, V.O., Simoneit, B.R.T., Cardoso, J.N., 1997. Even n-alkane predominances on the Amazon shelf and a Northeast Pacific hydrothermal system. Naturwissenschaften 84, 415-420.
Engstrom, D.R., Wright, H.D., 1984. Lake sediments and environmental history. In: W. Tutin, E.Y. Haworth, J.W.G. Lund (eds.), Studies in palaeoecolology in honour of Winifred Tutin. . Minneapolis, pp. 11-63.
Epstein, S., Mayeda, T., 1953. Variation of O-18 Content of Waters from Natural Sources. Geochimica Et Cosmochimica Acta 4, 213-224.
Espitalie, J., Deroo, G., Marquis, F., 1985. Rock-Eval Pyrolysis and Its Applications. Revue De L Institut Francais Du Petrole 40, 563-579.
Estep, M.F., Hoering, T.C., 1980. Biogeochemistry of the Stable Hydrogen Isotopes. Geochimica Et Cosmochimica Acta 44, 1197-1206.
Eusterhues, K., Lechterbeck, J., Schneider, J., Wolf-Brozio, U., 2002. Late- and Post-Glacial evolution of Lake Steisslingen (I).: Sedimentary history, palynological record and inorganic geochemical indicators. Palaeogeography, Palaeoclimatology, Palaeoecology 187, 341-371.
Fan, M.J., Dettman, D.L., Song, C.H., Fang, X.M., Garzione, C.N., 2007. Climatic variation in the Linxia basin, NE Tibetan Plateau, from 13.1 to 4.3 Ma: The stable isotope record. Palaeogeography Palaeoclimatology Palaeoecology 247, 313-328.
Fanning, A.F., Weaver, A.J., 1997. Temporal-geographical meltwater influences on the North Atlantic Conveyor: Implications for the Younger Dryas. Paleoceanography 12, 307-320.
Farquhar, G., Lloyd, J., 1993. Carbon and oxygen isotope effects in the exchange of carbon dioxide between terrestrial plants and the atmosphere. In: J.R. Ehleringer, A.E. Hass, G. Farquhar (eds.), Stable isotopes and plant carbon/water relations. Academic Press, New York, pp. 47-70.
Ficken, K.J., Li, B., Swain, D.L., Eglinton, G., 2000. An n-alkane proxy for the sedimentary input of submerged/floating freshwater aquatic macrophytes. Organic Geochemistry 31, 745-749.
Filippi, M.L., Lambert, P., Hunziker, J., Kubler, B., Bernasconi, S., 1999. Climatic and anthropogenic influence on the stable isotope record from bulk carbonates and ostracodes in Lake Neuchatel, Switzerland, during the last two millennia. Journal of Paleolimnology 21, 19-34.
Fischbeck, R., Müller, G., 1971. Monohydrocalcite, Hydromagnesite, Nesquehonite, Dolomite, Aragonite, and Calcite in Speleothems of Frankische Schweiz, Western Germany. Contributions to Mineralogy and Petrology 33, 87-&.
Fleitmann, D., Burns, S.J., Mangini, A., Mudelsee, M., Kramers, J., Villa, I., Neff, U., Al-Subbary, A.A., Buettner, A., Hippler, D., Matter, A., 2007. Holocene ITCZ and Indian monsoon
136
dynamics recorded in stalagmites from Oman and Yemen (Socotra). Quaternary Science Reviews 26, 170-188.
Fontes, J.C., Gasse, F., Gibert, E., 1996. Holocene environmental changes in Lake Bangong basin (western Tibet) .1. Chronology and stable isotopes of carbonates of a Holocene lacustrine core. Palaeogeography Palaeoclimatology Palaeoecology 120, 25-47.
Fontes, J.C., Melieres, F., Gibert, E., Qing, L., Gasse, F., 1993. Stable-Isotope and Radiocarbon Balances of 2 Tibetan Lakes (Sumxi Co, Longmu Co) from 13,000-Bp. Quaternary Science Reviews 12, 875-887.
Fuhrmann, A., Fischer, T., Lucke, A., Brauer, A., Zolitschka, B., Horsfield, B., Negendank, J.F.W., Schleser, G.H., Wilkes, H., 2004. Late Quaternary environmental and climatic changes in central Europe as inferred from the composition of organic matter in annually laminated maar lake sediments. Geochemistry Geophysics Geosystems 5, -.
Fuhrmann, A., Mingram, J., Lucke, A., Lu, H.Y., Horsfield, B., Liu, J.Q., Negendank, J.F.W., Schleser, G.H., Wilkes, H., 2003. Variations in organic matter composition in sediments from Lake Huguang Maar (Huguangyan), South China during the last 68 ka: implications for environmental and climatic change. Organic Geochemistry 34, 1497-1515.
Gajurel, A.P., France-Lanord, C., Huyghe, P., Guilmette, C., Gurung, D., 2006. C and O isotope compositions of modem fresh-water mollusc shells and river waters from the Himalaya and Ganga plain. Chemical Geology 233, 156-183.
Gao, Y.X., 1985. Tibetan Soil. Beijing: Science Press, 2-15. Garzione, C.N., Dettman, D.L., Horton, B.K., 2004. Carbonate oxygen isotope paleoaltimetry:
evaluating the effect of diagenesis on paleoelevation estimates for the Tibetan plateau. Palaeogeography Palaeoclimatology Palaeoecology 212, 119-140.
Gasse, F., 2000. Hydrological changes in the African tropics since the Last Glacial Maximum. Quaternary Science Reviews 19, 189-211.
Gasse, F., Arnold, M., Fontes, J.C., Fort, M., Gibert, E., Huc, A., Li, B.Y., Li, Y.F., Lju, Q., Melieres, F., Vancampo, E., Wang, F.B., Zhang, Q.S., 1991. A 13,000-Year Climate Record from Western Tibet. Nature 353, 742-745.
Gasse, F., Fontes, J.C., VanCampo, E., Wei, K., 1996. Holocene environmental changes in Bangong Co basin (western Tibet) .4. Discussion and conclusions. Palaeogeography Palaeoclimatology Palaeoecology 120, 79-92.
Gat, J.R., 1971. Comments on Stable Isotope Method in Regional Groundwater Investigattions. Water Resources Research 7, 980-&.
Gat, J.R., 1996. Oxygen and hydrogen isotopes in the hydrologic cycle. Annual Review of Earth and Planetary Sciences 24, 225-262.
Gat, J.R., Bowser, C.J., Kendall, C., 1994. The Contribution of Evaporation from the Great-Lakes to the Continental Atmosphere - Estimate Based on Stable-Isotope Data. Geophysical Research Letters 21, 557-560.
Gat, J.R., Levy, Y., 1978. Isotope Hydrology of Inland Sabkhas in Bardawil Area, Sinai. Limnology and Oceanography 23, 841-850.
Gehre, M., Geilmann, H., Richter, J., Werner, R.A., Brand, W.A., 2004. Continuous flow H-2/H-1 and and(18)O/O-16 analysis of water samples with dual inlet precision. Rapid Communications in Mass Spectrometry 18, 2650-2660.
Gibson, J.J., Edwards, T.W.D., Birks, S.J., St Amour, N.A., Buhay, W.M., McEachern, P., Wolfe, B.B., Peters, D.L., 2005. Progress in isotope tracer hydrology in Canada. Hydrological Processes 19, 303-327.
Gibson, J.J., Reid, R., Spence, C., 1998. A six-year isotopic record of lake evaporation at a mine site in the Canadian subarctic: results and validation. Hydrological Processes 12, 1779-1792.
Gonfiantini, R., 1986. Environmental isotopes in Lake studies. In: P. Fritz, J.C. Fontes (eds.), HAndbook of Environmental Isotope Geochemistry. Elsevier, Amsterdam, pp. 113-163.
Grimalt, J., Albaiges, J., 1987. Sources and Occurrence of C-12-C-22 Normal-Alkane Distributions with Even Carbon-Number Preference in Sedimentary Environments. Geochimica Et Cosmochimica Acta 51, 1379-1384.
137
Grimalt, J., Alsaad, H.T., Douabul, A.A.Z., Albaiges, J., 1985. Normal-Alkane Distributions in Surface Sediments from the Arabian Gulf. Naturwissenschaften 72, 35-37.
Grimalt, J.O., Dewit, R., Teixidor, P., Albaiges, J., 1992. Lipid Biogeochemistry of Phormidium and Microcoleus Mats. Organic Geochemistry 19, 509-530.
Gu, Z.Y., Liu, J.Q., Yuan, B.Y., Liu, D.S., Liu, R.M., Liu, Y., Yaskawa, K., 1993. Monsoon Variations of the Qinghai-Xizang Plateau during the Last 12,000 Years - Geochemical Evidence from the Sediments in the Siling Lake. Chinese Science Bulletin 38, 577-581.
Hakanson, L., Jansson, M., 1983. Principles of Lake Sedimentology. Springer, Berlin. Han, J., Calvin, M., 1969. Hydrocarbon Distribution of Algae and Bacteria, and Microbiological
Activity in Sediments. Proceedings of the National Academy of Sciences of the United States of America 64, 436-&.
Harmon, R.S., Atkinson, T.C., Atkinson, J.L., 1983. The Mineralogy of Castleguard Cave, Columbia Icefields, Alberta, Canada. Arctic and Alpine Research 15, 503-516.
Harris, N., 2006. The elevation history of the Tibetan Plateau and its implications for the Asian monsoon. Palaeogeography, Palaeoclimatology, Palaeoecology 241, 4-15.
Hassan, K.M., Swinehart, J.B., Spalding, R.F., 1997. Evidence for Holocene environmental change from C/N ratios, and delta C-13 delta N-15 values in Swan Lake sediments, western Sand Hills, Nebraska. Journal of Paleolimnology 18, 121-130.
Hayes, J.M., 1993. Factors Controlling C-13 Contents of Sedimentary Organic-Compounds - Principles and Evidence. Marine Geology 113, 111-125.
Hayes, J.M., 2001. Fractionation of carbon and hydrogen isotopes in biosynthetic processes. Stable Isotope Geochemistry 43, 225-277.
Hayes, J.M., Freeman, K.H., Popp, B.N., Hoham, C.H., 1990. Compound-Specific Isotopic Analyses - a Novel Tool for Reconstruction of Ancient Biogeochemical Processes. Organic Geochemistry 16, 1115-1128.
He, Y., Theakstone, W.H., Zhang, Z.L., Zhang, D.A., Yao, T.D., Chen, T., Shen, Y.P., Pang, H.X., 2004. Asynchronous Holocene climatic change across China. Quaternary Research 61, 52-63.
Herzschuh, U., 2006. Palaeo-moisture evolution in monsoonal Central Asia during the last 50,000 years. Quaternary Science Reviews 25, 163-178.
Herzschuh, U., Winter, K., Wunnemann, B., Li, S.J., 2006. A general cooling trend on the central Tibetan Plateau throughout the Holocene recorded by the Lake Zigetang pollen spectra. Quaternary International 154, 113-121.
Hilkert, A.W., Douthitt, C.B., Schluter, H.J., Brand, W.A., 1999. Isotope ratio monitoring gas chromatography mass spectrometry of D H by high temperature conversion isotope ratio mass spectrometry. Rapid Communications in Mass Spectrometry 13, 1226-1230.
Hoffmann, G., Heimann, M., 1993. Water tracers in the ECHAM general circulation model IAEA PROC SER, IAEA, no. 329, 3-14.
Hoffmann, G., Heimann, M., 1997. Water isotope modeling in the Asian monsoon region. Quaternary International 37, 115-128.
Hoffmann, G., Werner, M., Heimann, M., 1998. Water isotope module of the ECHAM atmospheric general circulation model: A study on timescales from days to several years (vol 103, pg 16871, 1998). Journal of Geophysical Research-Atmospheres 103, 23323-23323.
Holdsworth, G., Fogarasi, S., Krouse, H.R., 1991. Variation of the Stable Isotopes of Water with Altitude in the Saint Elias Mountains of Canada. Journal of Geophysical Research-Atmospheres 96, 7483-7494.
Holmer, M., Storkholm, P., 2001. Sulphate reduction and sulphur cycling in lake sediments: a review. Freshwater Biology 46, 431-451.
Hou, J., D'Andrea, W.J., MacDonald, D., Huang, Y., 2007a. Evidence for water use efficiency as an important factor in determining the [delta]D values of tree leaf waxes. Organic Geochemistry 38, 1251-1255.
138
Hou, J., D'Andrea, W.J., MacDonald, D., Huang, Y., 2007b. Hydrogen isotopic variability in leaf waxes among terrestrial and aquatic plants around Blood Pond, Massachusetts (USA). Organic Geochemistry 38, 977-984.
Hou, J.Z., Huang, Y.S., Wang, Y., Shuman, B., Oswald, W.W., Faison, E., Foster, D.R., 2006. Postglacial climate reconstruction based on compound-specific D/H ratios of fatty acids from Blood Pond, New England. Geochemistry Geophysics Geosystems 7, -.
Huang, Y., Lockheart, M.J., Logan, G.A., Eglinton, G., 1996. Isotope and molecular evidence for the diverse origins of carboxylic acids in leaf fossils and sediments from the Miocene Lake Clarkia deposit, Idaho, U.S.A. Organic Geochemistry 24, 289-299.
Huang, Y.S., Dupont, L., Sarnthein, M., Hayes, J.M., Eglinton, G., 2000. Mapping of C-4 plant input from North West Africa into North East Atlantic sediments. Geochimica Et Cosmochimica Acta 64, 3505-3513.
Huang, Y.S., Shuman, B., Wang, Y., Webb, T., 2002. Hydrogen isotope ratios of palmitic acid in lacustrine sediments record late Quaternary climate variations. Geology 30, 1103-1106.
Huang, Y.S., Shuman, B., Wang, Y., Webb, T., 2004. Hydrogen isotope ratios of individual lipids in lake sediments as novel tracers of climatic and environmental change: a surface sediment test. Journal of Paleolimnology 31, 363-375.
Hughen, K.A., Eglinton, T.I., Xu, L., Makou, M., 2004. Abrupt tropical vegetation response to rapid climate changes. Science 304, 1955-1959.
Huntington, T.G., 2006. Evidence for intensification of the global water cycle: Review and synthesis. Journal of Hydrology 319, 83-95.
IAEA, 2003. GNIP - Global Network of Isotopes in Precipitation. http://nds121.iaea.org/wiser/index.php
Indermühle, A., Stocker, T.F., Joos, F., Fischer, H., Smith, H.J., Wahlen, M., Deck, B., Mastroianni, D., Tschumi, J., Blunier, T., Meyer, R., Stauffer, B., 1999. Holocene carbon-cycle dynamics based on CO2 trapped in ice at Taylor Dome, Antarctica. Nature 398, 121-126.
Isarin, R.F.B., Renssen, H., Vandenberghe, J., 1998. The impact of the North Atlantic Ocean on the Younger Dryas climate in northwestern and central Europe. Journal of Quaternary Science 13, 447-453.
Jenkins, R., Snyder, R.L., 1996. Introduction to X-ray powder diffractometry. John Wiley & sons, New York.
Jennerjahn, T.C., Ittekkot, V., Arz, H.W., Behling, H., Patzold, J., Wefer, G., 2004. Asynchronous terrestrial and marine signals of climate change during Heinrich events. Science 306, 2236-2239.
Jiang, W.Y., Guo, Z.T., Sun, X.J., Wu, H.B., Chu, G.Q., Yuan, B.Y., Hatte, C., Guiot, J., 2006. Reconstruction of climate and vegetation changes of Lake Bayanchagan (Inner Mongolia): Holocene variability of the East Asian monsoon. Quaternary Research 65, 411-420.
Johnsen, S.J., Clausen, H.B., Dansgaard, W., Fuhrer, K., Gundestrup, N., Hammer, C.U., Iversen, P., Jouzel, J., Stauffer, B., Steffensen, J.P., 1992. Irregular glacial interstadials recorded in a new Greenland ice core. Nature 359, 311-313.
Johnson, K.R., Ingram, B.L., 2004. Spatial and temporal variability in the stable isotope systematics of modern precipitation in China: implications for paleoclimate reconstructions. Earth and Planetary Science Letters 220, 365-377.
Joussaume, S., Sadourny, R., Jouzel, J., 1984. A General-Circulation Model of Water Isotope Cycles in the Atmosphere. Nature 311, 24-29.
Jouzel, J., Koster, R.D., Suozzo, R.J., Russell, G.L., White, J.W.C., Broecker, W.S., 1991. Simulations of the Hdo and (H2O)-O-18 Atmospheric Cycles Using the Nasa Giss General-Circulation Model - Sensitivity Experiments for Present-Day Conditions. Journal of Geophysical Research-Atmospheres 96, 7495-7507.
Jouzel, J., Lorius, C., Johnsen, S., Grootes, P., 1994. Climate Instabilities - Greenland and Antarctic Records. Comptes Rendus De L Academie Des Sciences Serie Ii 319, 65-77.
Kaiser, K., Schoch, W.H., Miehe, G., 2007. Holocene paleosols and colluvial sediments in Northeast Tibet (Qinghai Province, China): Properties, dating and paleoenvironmental implications. Catena 69, 91-102.
139
Kapp, J.L.D., Harrison, T.M., Kapp, P., Grove, M., Lovera, O.M., Lin, D., 2005. Nyainqentanglha Shan: A window into the tectonic, thermal, and geochemical evolution of the Lhasa block, southern Tibet. Journal of Geophysical Research-Solid Earth 110, -.
Keatings, K.W., Heaton, T.H.E., Holmes, J.A., 2002. Carbon and oxygen isotope fractionation in non-marine ostracods: results from a `natural culture' environment. Geochimica et Cosmochimica Acta 66, 1701-1711.
Keeley, J.E., Sandquist, D.R., 1992. Carbon: freshwater plants. Plant, Cell & Environment 15, 1021-1035.
Kelts, K., Talbot, M.R., 1990. Lacustrine carbonates as geochemical archives of environmental change and biotic-abiotic interactions. In: M.M. Tilzer, C. Serruya (eds.), Large Lakes: Ecological Structure and Function. Springer Verlag, pp. 288-315.
Klug, H.P., Alexander, L.E., 1974. X-ray Diffraction Procedures. John Wiley & sons, New York. Knies, J., Matthiessen, J., Mackensen, A., Stein, R., Vogt, C., Frederichs, T., Nam, S.I., 2007.
Effects of Arctic freshwater forcing on thermohaline circulation during the Pleistocene. Geology 35, 1075-1078.
Kramer, C., Gleixner, G., 2006. Variable use of plant- and soil-derived carbon by microorganisms in agricultural soils. Soil Biology & Biochemistry 38, 3267-3278.
Krause, W.J., 1980. Tritium-Bilanzierung kleiner Einzugsgebiete in der Eifel. Teil 1 - Wasserbilanz. Deutsche Gewaesserkundliche Mitteilungen 24, 2-14.
Krishnamurthy, R.V., Syrup, K.A., Baskaran, M., Long, A., 1995. Late-Glacial Climate Record of Midwestern United-States from the Hydrogen Isotope Ratio of Lake Organic-Matter. Science 269, 1565-1567.
Krull, E., Sachse, D., Mugler, I., Thiele, A., Gleixner, G., 2006. Compound-specific delta C-13 and delta H-2 analyses of plant and soil organic matter: A preliminary assessment of the effects of vegetation change on ecosystem hydrology. Soil Biology & Biochemistry 38, 3211-3221.
Kürschner, H., Herzschuh, U., Wagner, D., 2005. Phytosociological studies in the north-eastern Tibetan Plateau (NW China) — A first contribution to the subalpine scrub and alpine meadow vegetation. Botanisches Jahrbuch der Systematics 125, 273-315.
Last, W., Ginn, F., 2005. Saline systems of the Great Plains of western Canada: an overview of the limnogeology and paleolimnology. Saline Systems 1, 10.
Leaney, F.W., Osmond, C.B., Allison, G.B., Ziegler, H., 1985. Hydrogen-Isotope Composition of Leaf Water in C-3 and C-4 Plants - Its Relationship to the Hydrogen-Isotope Composition of Dry-Matter. Planta 164, 215-220.
Lehmkuhl, F., Haselein, F., 2000. Quaternary paleoenvironmental change on the Tibetan Plateau and adjacent areas (Western China and Western Mongolia). Quaternary International 65-6, 121-145.
Lehmkuhl, F., Klinge, M., Rees-Jones, J., Rhodes, E.J., 2000. Late Quaternary aeolian sedimentation in central and south-eastern Tibet. Quaternary International 68, 117-132.
Leng, M.J., Lamb, A.L., Heaton, T.H.E., Marshall, J.D., Wolfe, B.B., Jones, D.M., Holmes, J.A., Arrowsmith, C., 2006. Isotopes in lake sediments. In: M.J. Leng (eds.), Isotopes in Paleoenvironmental Research. Springer, pp. 147-184.
Leng, M.J., Marshall, J.D., 2004. Palaeoclimate interpretation of stable isotope data from lake sediment archives. Quaternary Science Reviews 23, 811-831.
Lister, G.S., Kelts, K., Zao, C.K., Yu, J.Q., Niessen, F., 1991. Lake Qinghai, China - Closed-Basin Lake Levels and the Oxygen Isotope Record for Ostracoda since the Latest Pleistocene. Palaeogeography Palaeoclimatology Palaeoecology 84, 141-162.
Litt, T., Brauer, A., Goslar, T., Merkt, J., Balaga, K., Muller, H., Ralska-Jasiewiczowa, M., Stebich, M., Negendank, J.F.W., 2001. Correlation and synchronisation of Lateglacial continental sequences in northern central Europe based on annually laminated lacustrine sediments. Quaternary Science Reviews 20, 1233-1249.
Liu, W.G., Huang, Y.S., 2005. Compound specific D/H ratios and molecular distributions of higher plant leaf waxes as novel pale oenvironmental indicators in the Chinese Loess Plateau. Organic Geochemistry 36, 851-860.
140
Liu, W.G., Yang, H., Li, L.W., 2006. Hydrogen isotopic compositions of n-alkanes from terrestrial plants correlate with their ecological life forms. Oecologia 150, 330-338.
Lockheart, M.J., VanBergen, P.F., Evershed, R.P., 1997. Variations in the stable carbon isotope compositions of individual lipids from the leaves of modern angiosperms: Implications for the study of higher land plant-derived sedimentary organic matter. Organic Geochemistry 26, 137-153.
Lüniger, G., Schwark, L., 2002. Characterisation of sedimentary organic matter by bulk and molecular geochemical proxies: an example from Oligocene maar-type Lake Enspel, Germany. Sedimentary Geology 148, 275-288.
Mackereth, F.J.H., 1966. Some Chemical Observations of Post-Glacial Lake Sediments. Philosophical Transactions of the Royal Society of London Series B-Biological Sciences 250, 165-&.
Maffei, M., 1996. Chemotaxonomic significance of leaf wax alkanes in the gramineae. Biochemical Systematics and Ecology 24, 53-64.
Maffei, M., Mucciarelli, M., Scannerini, S., 1993. Environmental factors affecting the lipid metabolism in Rosmarinus officinalis L. Biochemical Systematics and Ecology 21, 765-784.
Magny, M., 2001. Palaeohydrological changes as reflected by lake-level fluctuations in the Swiss Plateau, the Jura Mountains and the northern French Pre-Alps during the Last Glacial-Holocene transition: a regional synthesis. Global and Planetary Change 30, 85-101.
Majoube, M., 1971. Fractionation in O-18 between Ice and Water Vapor. Journal De Chimie Physique Et De Physico-Chimie Biologique 68, 625-627.
Manabe, S., Stouffer, R.J., 1997. Coupled ocean-atmosphere model response to freshwater input: Comparison to Younger Dryas event. Paleoceanography 12, 728-728.
Marzi, R., Torkelson, B.E., Olson, R.K., 1993. A Revised Carbon Preference Index. Organic Geochemistry 20, 1303-1306.
Mathieu, A., Seze, G., Guerin, C., Dupuis, H., Weill, A., 1999. Mesoscale boundary layer clouds structures as observed during the semaphore campaign. Physics and Chemistry of the Earth Part B-Hydrology Oceans and Atmosphere 24, 933-938.
Mayewski, P.A., Meeker, L.D., Whitlow, S., Twickler, M.S., Morrison, M.C., Bloomfield, P., Bond, G.C., Alley, R.B., Gow, A.J., Grootes, P.M., Meese, D.A., Ram, M., Taylor, K.C., Wumkes, W., 1994. Changes in Atmospheric Circulation and Ocean Ice Cover over the North-Atlantic During the Last 41,000 Years. Science 263, 1747-1751.
McCarthy, R.D., Duthie, A.H., 1962. A rapid quantitative method for the separation of free fatty acids from other lipids. J. Lipid Res. 3, 117-119.
Merlivat, L., 1978. Molecular Diffusivities of (H2o)-O-1 6 Hd16o, and (H2o)-O-18 in Gases. Journal of Chemical Physics 69, 2864-2871.
Merlivat, L., Jouzel, J., 1979. Global Climatic Interpretation of the Deuterium-Oxygen-18 Relationship for Precipitation. Journal of Geophysical Research-Oceans and Atmospheres 84, 5029-5033.
Meyers, P.A., 2003. Applications of organic geochemistry to paleolimnological reconstructions: a summary of examples from the Laurentian Great Lakes. Organic Geochemistry 34, 261-289.
Meyers, P.A., Ishiwatari, R., 1993. Lacustrine Organic Geochemistry - an Overview of Indicators of Organic-Matter Sources and Diagenesis in Lake-Sediments. Organic Geochemistry 20, 867-900.
Meyers, P.A., Lallier-Verges, E., 1999. Lacustrine sedimentary organic matter records of Late Quaternary paleoclimates. Journal of Paleolimnology 21, 345-372.
Miehe, G., Miehe, S., Schlutz, F., Kaiser, K., Duo, L., 2006. Palaeoecological and experimental evidence of former forests and woodlands in the treeless desert pastures of Southern Tibet (Lhasa, AR Xizang, China). Palaeogeography Palaeoclimatology Palaeoecology 242, 54-67.
Mingram, J., Schettler, G., Nowaczyk, N., Luo, X.J., Lu, H.Y., Liu, J.Q., Negendank, J.F.W., 2004. The Huguang maar lake - a high-resolution record of palaeoenvironmental and palaeoclimatic changes over the last 78,000 years from South China. Quaternary International 122, 85-107.
141
Morinaga, H., Itota, C., Isezaki, N., Goto, H., Yaskawa, K., Kusakabe, M., Liu, J., Gu, Z., Yuan, B., Cong, S., 1993. Oxygen-18 and carbon-13 records for the last 14,000 years from lacustrine carbonates of siling-co (lake) in the qinghai-tibetan plateau. Geophysical Research Letters 20, 2909-2912.
Morrill, C., 2004. The influence of Asian summer monsoon variability on the water balance of a Tibetan lake. Journal of Paleolimnology 32, 273-286.
Morrill, C., Overpeck, J.T., Cole, J.E., 2003. A synthesis of abrupt changes in the Asian summer monsoon since the last deglaciation. Holocene 13, 465-476.
Morrill, C., Overpeck, J.T., Cole, J.E., Liu, K.B., Shen, C.M., Tang, L.Y., 2006. Holocene variations in the Asian monsoon inferred from the geochemistry of lake sediments in central Tibet. Quaternary Research 65, 232-243.
Moschen, R., Lücke, A., Parplies, J., Radtke, U., Schleser, G.H., 2006. Transfer and early diagenesis of biogenic silica oxygen isotope signals during settling and sedimentation of diatoms in a temperate freshwater lake (Lake Holzmaar, Germany). Geochimica et Cosmochimica Acta 70, 4367-4379.
Mügler, I., Sachse, D., Werner, M., Xu, B.W., G.; , Yao, T., Gleixner, G., 2008. Effect of lake evaporation on δD values of lacustrine n-alkanes: A comparison of Nam Co, Tibetan Plateau and Holzmaar, Germany. Organic Geochemistry in print
Müller, G., Irion, G., Förstner, U., 1972. Formation and Diagenesis of Inorganic Ca-Mg Carbonates in the Lacustrine Environment. Naturwissenschaften 59, 158-164.
Nomade, J., 2005. Chronologie et sédimentologie du remplissage du lac d’Annecy depuis le Tardiglaciaire: Implications paléoclimatologiques et paléohydrologiques. Observatoire des Sciences de l'Univers de Grenoble PhD Thesis, 197.
Oehms, M., 1995. Zur Limnologie des Holzmaars. Scientific Technical Report 95/16: Das Holzmaar und seine Sedimente.
Ohkouchi, N., Eglinton, T.I., Hayes, J.M., 2003. Radiocarbon dating of individual fatty acids as a tool for refining Antarctic margin sediment chronologies. Radiocarbon 45, 17-24.
Ohkouchi, N., Eglinton, T.I., Keigwin, L.D., Hayes, J.M., 2002. Spatial and temporal offsets between proxy records in a sediment drift. Science 298, 1224-1227.
Ohkouchi, N., Kawamura, K., Taira, A., 1997. Molecular paleoclimatology: reconstruction of climate variabilities in the late Quaternary. Organic Geochemistry 27, 173-183.
Oleary, M.H., 1988. Carbon Isotopes in Photosynthesis. Bioscience 38, 328-336. Olsson, I.U., 1979. Warning against Radiocarbon Dating of Samples Containing Little Carbon.
Boreas 8, 203-207. Pagani, M., Pedentchouk, N., Huber, M., Sluijs, A., Schouten, S., Brinkhuis, H., Damste, J.S.S.,
Dickens, G.R., 2006. Arctic hydrology during global warming at the Palaeocene/Eocene thermal maximum. Nature 442, 671-675.
Pearson, A., McNichol, A.P., Benitez-Nelson, B.C., Hayes, J.M., Eglinton, T.I., 2001. Origins of lipid biomarkers in Santa Monica Basin surface sediment: A case study using compound-specific Delta C-14 analysis. Geochimica Et Cosmochimica Acta 65, 3123-3137.
Pedentchouk, N., Freeman, K.H., Harris, N.B., 2006. Different response of delta D values of n-alkanes, isoprenoids, and kerogen during thermal maturation. Geochimica Et Cosmochimica Acta 70, 2063-2072.
Pendall, E., Betancourt, J.L., Leavitt, S.W., 1999. Paleoclimatic significance of delta D and delta C-13 values in pinon pine needles from packrat middens spanning the last 40,000 years. Palaeogeography Palaeoclimatology Palaeoecology 147, 53-72.
Perruchoud, D., Joos, F., Fischlin, A., Hajdas, I., Bonani, G., 1999. Evaluating timescales of carbon turnover in temperate forest soils with radiocarbon data. Global Biogeochemical Cycles 13, 555-573.
Petit, J.R., Briat, M., Royer, A., 1981. Ice-Age Aerosol Content from East Antarctic Ice Core Samples and Past Wind Strength. Nature 293, 391-394.
Peyron, O., Begeot, C., Brewer, S., Heiri, O., Magny, M., Millet, L., Ruffaldi, P., Van Campo, E., Yu, G., 2005. Late-Glacial climatic changes in Eastern France (Lake Lautrey) from pollen, lake-levels, and chironomids. Quaternary Research 64, 197-211.
142
Radke, J., Bechtel, A., Gaupp, R., Puttmann, W., Schwark, L., Sachse, D., Gleixner, G., 2005. Correlation between hydrogen isotope ratios of lipid biomarkers and sediment maturity. Geochimica Et Cosmochimica Acta 69, 5517-5530.
Radke, M., Willsch, H., Welte, D.H., 1980. Preparative Hydrocarbon Group Type Determination by Automated Medium Pressure Liquid-Chromatography. Analytical Chemistry 52, 406-411.
Ramsey, M., Bronk, C., 2001. Development of the radiocarbon calibration program. Radiocarbon 43, 355-363.
Rapalee, G., Trumbore, S.E., Davidson, E.A., Harden, J.W., Veldhuis, H., 1998. Soil carbon stocks and their rates of accumulation and loss in a boreal forest landscape. Global Biogeochemical Cycles 12, 687-701.
Raynaud, D., Barnola, J.M., Souchez, R., Lorrain, R., Petit, J.R., Duval, P., Lipenkov, V.Y., 2005. Palaeoclimatology - The record for marine isotopic stage 11. Nature 436, 39-40.
Renssen, H., Lautenschlager, M., Schuurmans, C.J.E., 1996. The atmospheric winter circulation during the Younger Dryas stadial in the Atlantic/European sector. Climate Dynamics 12, 813-824.
Rethemeyer, J., Kramer, C., Gleixner, G., Wiesenberg, G.L.B., Schwark, L., Andersen, N., Nadeau, M.J., Grootes, P.M., 2004. Complexity of soil organic matter: AMS C-14 analysis of soil lipid fractions and individual compounds. Radiocarbon 46, 465-473.
Rhodes, T.E., Gasse, F., Lin, R.F., Fontes, J.C., Wei, K.Q., Bertrand, P., Gibert, E., Melieres, F., Tucholka, P., Wang, Z.X., Cheng, Z.Y., 1996. A late Pleistocene-Holocene lacustrine record from Lake Manas, Zunggar (northern Xinjiang, western China). Palaeogeography Palaeoclimatology Palaeoecology 120, 105-121.
Ripullone, F., Matsuo, N., Stuart-Williams, H., Wong, S.C., Borghetti, M., Tani, M., Farquhar, G., 2008. Environmental effects on oxygen isotope enrichment of leaf water in cotton leaves. Plant Physiology 146, 729-736.
Roden, J.S., Lin, G.G., Ehleringer, J.R., 2000. A mechanistic model for interpretation of hydrogen and oxygen isotope ratios in tree-ring cellulose. Geochimica Et Cosmochimica Acta 64, 21-35.
Routh, J., Meyers, P.A., Gustafsson, O., Baskaran, M., Hallberg, R., Scholdstrom, A., 2004. Sedimentary geochemical record of human-induced environmental changes in the Lake Brunnsviken watershed, Sweden. Limnology and Oceanography 49, 1560-1569.
Rozanski, K., Araguasaraguas, L., Gonfiantini, R., 1992. Relation between Long-Term Trends of O-18 Isotope Composition of Precipitation and Climate. Science 258, 981-985.
Rozanski, K., Johnsen, S.J., Schotterer, U., Thompson, L.G., 1997. Reconstruction of past climates from stable isotope records of palaeo-precipitation preserved in continental archives. Hydrological Sciences Journal-Journal Des Sciences Hydrologiques 42, 725-745.
Rozanski, K., Sonntag, C., Munnich, K.O., 1982. Factors Controlling Stable Isotope Composition of European Precipitation. Tellus 34, 142-150.
Sachse, D., Radke, J., Gleixner, G., 2004. Hydrogen isotope ratios of recent lacustrine sedimentary n-alkanes record modern climate variability. Geochimica Et Cosmochimica Acta 68, 4877-4889.
Sachse, D., Radke, J., Gleixner, G., 2006. delta D values of individual n-alkanes from terrestrial plants along a climatic gradient - Implications for the sedimentary biomarker record. Organic Geochemistry 37, 469-483.
Sachse, D., Sachs, J.P., 2008. Inverse relationship between D/H fractionation in cyanobacterial lipids and salinity in Christmas Island saline ponds. Geochimica Et Cosmochimica Acta 72, 793-806.
Sachsenhofer, R.F., Bechtel, A., Reischenbacher, D., Weiss, A., 2003. Evolution of lacustrine systems along the Miocene Mur-Murz fault system (Eastern Alps, Austria) and implications on source rocks in pull-apart basins. Marine and Petroleum Geology 20, 83-110.
Santrucek, J., Kveton, J., Setlik, J., Bulickova, L., 2007. Spatial variation of deuterium enrichment in bulk water of snowgum leaves. Plant Physiology 143, 88-97.
143
Sauer, P.E., Eglinton, T.I., Hayes, J.M., Schimmelmann, A., Sessions, A.L., 2001. Compound-specific D/H ratios of lipid biomarkers from sediments as a proxy for environmental and climatic conditions. Geochimica Et Cosmochimica Acta 65, 213-222.
Schefuss, E., Schouten, S., Schneider, R.R., 2005. Climatic controls on central African hydrology during the past 20,000 years. Nature 437, 1003-1006.
Schettler, G., Liu, Q., Mingram, J., Stebich, M., Dulski, P., 2006. East-Asian monsoon variability between 15 000 and 2000 cal. yr BP recorded in varved sediments of Lake Sihailongwan (northeastern China, Long Gang volcanic field). Holocene 16, 1043-1057.
Schimmelmann, A., Lewan, M.D., Wintsch, R.P., 1999. D/H isotope ratios of kerogen, bitumen, oil, and water in hydrous pyrolysis of source rocks containing kerogen types I, II, IIS, and III. Geochimica Et Cosmochimica Acta 63, 3751-3766.
Schimmelmann, A., Sessions, A.L., Boreham, C.J., Edwards, D.S., Logan, G.A., Summons, R.E., 2004. D/H ratios in terrestrially sourced petroleum systems. Organic Geochemistry 35, 1169-1195.
Schimmelmann, A., Sessions, A.L., Mastalerz, M., 2006. Hydrogen isotopic (D/H) composition of organic matter during diagenesis and thermal maturation. Annual Review of Earth and Planetary Sciences 34, 501-533.
Schmidt, T.C., Zwank, L., Elsner, M., Berg, M., Meckenstock, R.U., Haderlein, S.B., 2004. Compound-specific stable isotope analysis of organic contaminants in natural environments: a critical review of the state of the art, prospects, and future challenges. Analytical and Bioanalytical Chemistry 378, 283-300.
Schouten, S., Ossebaar, J., Schreiber, K., Kienhuis, M.V.M., Langer, G., Benthien, A., Bijma, J., 2006. The effect of temperature, salinity and growth rate on the stable hydrogen isotopic composition of long chain alkenones produced by Emiliania huxleyi and Gephyrocapsa oceanica. Biogeosciences 3, 113-119.
Schwalb, A., 2003. Lacustrine ostracodes as stable isotope recorders of late-glacial and Holocene environmental dynamics and climate. Journal of Paleolimnology 29, 267-351.
Schwark, L., Zink, K., Lechterbeck, J., 2002. Reconstruction of postglacial to early Holocene vegetation history in terrestrial Central Europe via cuticular lipid biomarkers and pollen records from lake sediments. Geology 30, 463-466.
Sessions, A.L., 2006. Seasonal changes in D/H fractionation accompanying lipid biosynthesis in Spartina alterniflora. Geochimica Et Cosmochimica Acta 70, 2153-2162.
Sessions, A.L., Burgoyne, T.W., Schimmelmann, A., Hayes, J.M., 1999. Fractionation of hydrogen isotopes in lipid biosynthesis. Organic Geochemistry 30, 1193-1200.
Sessions, A.L., Jahnke, L.L., Schimmelmann, A., Hayes, J.M., 2002. Hydrogen isotope fractionation in lipids of the methane-oxidizing bacterium Methylococcus capsulatus. Geochimica Et Cosmochimica Acta 66, 3955-3969.
Sessions, A.L., Sylva, S.P., Summons, R.E., Hayes, J.M., 2004. Isotopic exchange of carbon-bound hydrogen over geologic timescales. Geochimica Et Cosmochimica Acta 68, 1545-1559.
Shen, J., Liu, X.Q., Wang, S.M., Matsumoto, R., 2005. Palaeoclimatic changes in the Qinghai Lake area during the last 18,000 years. Quaternary International 136, 131-140.
Shuman, B., Huang, Y.S., Newby, P., Wang, Y., 2006. Compound-specific isotopic analyses track changes in seasonal precipitation regimes in the Northeastern United States at ca 8200cal yrBP. Quaternary Science Reviews 25, 2992-3002.
Shuman, B., Newby, P., Huang, Y.S., Webb, T., 2004. Evidence for the close climatic control of New England vegetation history. Ecology 85, 1297-1310.
Simola, H., 1983. Limnological Effects of Peatland Drainage and Fertilization as Reflected in the Varved Sediment of a Deep Lake. Hydrobiologia 106, 43-58.
Simoneit, B.R.T., 1977. Diterpenoid Compounds and Other Lipids in Deep-Sea Sediments and Their Geochemical Significance. Geochimica Et Cosmochimica Acta 41, 463-476.
Smith, F.A., Freeman, K.H., 2006a. Influence of physiology and climate on δD of leaf wax n-alkanes from C3 and C4 grasses. Geochimica et Cosmochimica Acta 70, 1172-1187.
Smith, F.A., Freeman, K.H., 2006b. Influence of physiology and climate on delta D of leaf wax n-alkanes from C-3 and C-4 grasses. Geochimica Et Cosmochimica Acta 70, 1172-1187.
144
Smith, F.A., Walker, N.A., 1980. Photosynthesis by Aquatic Plants - Effects of Unstirred Layers in Relation to Assimilation of Co2 and Hco3- and to Carbon Isotopic Discrimination. New Phytologist 86, 245-259.
Smittenberg, R.H., Eglinton, T.I., Schouten, S., Damste, J.S.S., 2006. Ongoing buildup of refractory organic carbon in boreal soils during the Holocene. Science 314, 1283-1286.
Staubwasser, M., Sirocko, F., Grootes, P.M., Segl, M., 2003. Climate change at the 4.2 ka BP termination of the Indus valley civilization and Holocene south Asian monsoon variability. Geophysical Research Letters 30, -.
Steinhof, A., Adamiec, G., Gleixner, G., van Klinken, G.J., Wagner, T., 2004. The new C-14 analysis laboratory in Jena, Germany. Radiocarbon 46, 51-58.
Sternberg, L., Deniro, M.J., Ajie, H., 1984. Stable Hydrogen Isotope Ratios of Saponifiable Lipids and Cellulose Nitrate from Cam, C-3 and C-4 Plants. Phytochemistry 23, 2475-2477.
Sternberg, L.D.L.O., Deniro, M.J.D., 1983. Biogeochemical Implications of the Isotopic Equilibrium Fractionation Factor between the Oxygen-Atoms of Acetone and Water. Geochimica Et Cosmochimica Acta 47, 2271-2274.
Street-Perrott, F.A., Ficken, K.J., Huang, Y., Eglinton, G., 2004. Late Quaternary changes in carbon cycling on Mt. Kenya, East Africa: an overview of the [delta]13C record in lacustrine organic matter. Quaternary Science Reviews 23, 861-879.
Sun, Q.L., Zhou, J., Shen, J., Chen, P., Wu, F., Xie, X.P., 2006. Environmental characteristics of Mid-Holocene recorded by lacustrine sediments from Lake Daihai, north environment sensitive zone, China. Science in China Series D-Earth Sciences 49, 968-981.
Talbot, M.R., Jensen, N.B., Laerdal, T., Filippi, M.L., 2006. Geochemical responses to a major transgression in giant African Lakes. Journal of Paleolimnology 35, 467-489.
Taylor, G.F., 1975. Occurrence of Monohydrocalcite in 2 Small Lakes in Southeast of South-Australia. American Mineralogist 60, 690-697.
Thompson, L.G., 2000. Ice core evidence for climate change in the Tropics: implications for our future. Quaternary Science Reviews 19, 19-35.
Thompson, L.G., Mosley-Thompson, E., Davis, M.E., Henderson, K.A., Brecher, H.H., Zagorodnov, V.S., Mashiotta, T.A., Lin, P.N., Mikhalenko, V.N., Hardy, D.R., Beer, J., 2002. Kilimanjaro ice core records: Evidence of Holocene climate change in tropical Africa. Science 298, 589-593.
Thompson, L.G., Mosley-Thompson, E., Davis, M.E., Lin, P.N., Henderson, K., Mashiotta, T.A., 2003. Tropical glacier and ice core evidence of climate change on annual to millennial time scales. Climatic Change 59, 137-155.
Thompson, L.G., Mosley-Thompson, E., Davis, M.E., Mashiotta, T.A., Henderson, K.A., Lin, P.N., Yao, T.D., 2006. Ice core evidence for asynchronous glaciation on the Tibetan Plateau. Quaternary International 154, 3-10.
Thompson, L.G., Mosley-Thompson, E., Henderson, K.A., 2000a. Ice-core palaeoclimate records in tropical South America since the Last Glacial Maximum. Journal of Quaternary Science 15, 377-394.
Thompson, L.G., Yao, T., Mosley-Thompson, E., Davis, M.E., Henderson, K.A., Lin, P.N., 2000b. A high-resolution millennial record of the South Asian Monsoon from Himalayan ice cores. Science 289, 1916-1919.
Thomson, J., Higgs, N.C., Croudace, I.W., Colley, S., Hydes, D.J., 1993. Redox Zonation of Elements at an Oxic Post-Oxic Boundary in Deep-Sea Sediments. Geochimica Et Cosmochimica Acta 57, 579-595.
Tian, L.D., Yao, T.D., MacClune, K., White, J.W.C., Schilla, A., Vaughn, B., Vachon, R., Ichiyanagi, K., 2007. Stable isotopic variations in west China: A consideration of moisture sources. Journal of Geophysical Research-Atmospheres 112, -.
Tian, L.D., Yao, T.D., Sun, W., Stievenard, M., Jouzel, J., 2001. Relationship between δD and δ18O in precipitation on north and south Tibetan Plateau and moisture recycling. Science in China Series D-Earth Sciences 44, 789-796.
Tissot, B., Welte, D.H., 1984. Petroleum Formation and Occurence. Springer, Berlin.
145
Trumbore, S.E., 1993. Comparison of Carbon Dynamics in Tropical and Temperate Soils Using Radiocarbon Measurements. Global Biogeochemical Cycles 7, 275-290.
Trumbore, S.E., Harden, J.W., 1997. Accumulation and turnover of carbon in organic and mineral soils of the BOREAS northern study area. Journal of Geophysical Research-Atmospheres 102, 28817-28830.
UNEP, 2002. Global Environment Outlook 3 (GEO-3). Utermann, J., Gorny, A., Hauenstein, M., Malessa, V., Müller, U., Scheffer, B., 2000.
Labormethoden-Dokumentation. Geologisches Jahrbuch Reihe G v. Grafenstein, U., Eicher, U., Erlenkeuser, H., Ruch, P., Schwander, J., Ammann, B., 2000. Isotope
signature of the Younger Dryas and two minor oscillations at Gerzensee (Switzerland): palaeoclimatic and palaeolimnologic interpretation based on bulk and biogenic carbonates. Palaeogeography, Palaeoclimatology, Palaeoecology 159, 215-229.
v. Grafenstein, U., Erlenkeuser, H., Brauer, B., Jouzel, J., Johnsen, S.J., 1999. A Mid-European Decadal Isotope-Climate Record from 15,500 to 5000 Years B.P. Science 284, 1654-1657.
v. Grafenstein, U., Erlenkeuser, H., Kleinmann, A., Müller, J., Trimborn, P., 1994. High-frequency climatic oscillations during the last deglaciation as revealed by oxygen-isotope records of benthic organisms (Ammersee, southern Germany). Journal of Paleolimnology 11, 349-357.
Vasconcelos, C., McKenzie, J.A., 1997. Microbial mediation of modern dolomite precipitation and diagenesis under anoxic conditions (Lagoa Vermelha, Rio de Janeiro, Brazil). Journal of Sedimentary Research 67, 378-390.
Veizer, J., Ala, D., Azmy, K., Bruckschen, P., Buhl, D., Bruhn, F., Carden, G.A.F., Diener, A., Ebneth, S., Godderis, Y., Jasper, T., Korte, G., Pawellek, F., Podlaha, O.G., Strauss, H., 1999. Sr-87/Sr-86, delta C-13 and delta O-18 evolution of Phanerozoic seawater. Chemical Geology 161, 59-88.
Walther, G.-R., Post, E., Convey, P., Menzel, A., Parmesan, C., Beebee, T.J.C., Fromentin, J.-M., Hoegh-Guldberg, O., Bairlein, F., 2002. Ecological responses to recent climate change. Nature 416, 389-395.
Wang, J., Zhu, L., 2006. Preliminary study on the field investigation of Nam Co. Annual report of Nam Co montoring and research station for multisphere interactions.
Watanabe, O., Jouzel, J., Johnsen, S., Parrenin, F., Shoji, H., Yoshida, N., 2003. Homogeneous climate variability across East Antarctica over the past three glacial cycles. Nature 422, 509-512.
Werner, M., Heimann, M., Hoffmann, G., 2001. Isotopic composition and origin of polar precipitation in present and glacial climate simulations. Tellus Series B-Chemical and Physical Meteorology 53, 53-71.
Werner, R.A., Brand, W.A., 2001. Referencing strategies and techniques in stable isotope ratio analysis. Rapid Communications in Mass Spectrometry 15, 501-519.
White, J.W.C., Lawrence, J.R., Broecker, W.S., 1994. Modeling and Interpreting D/H Ratios in Tree-Rings - a Test-Case of White-Pine in the Northeastern United-States. Geochimica Et Cosmochimica Acta 58, 851-862.
Williams, W.D., 1991. Chinese and Mongolian Saline Lakes - a Limnological Overview. Hydrobiologia 210, 39-66.
Wu, J.L., Schleser, G.H., Lucke, A., Li, S.J., 2007. A stable isotope record from freshwater lake shells of the eastern Tibetan Plateau, China, during the past two centuries. Boreas 36, 38-46.
Wu, Y.H., Lucke, A., Jin, Z.D., Wang, S.M., Schleser, G.H., Battarbee, R.W., Xia, W.L., 2006a. Holocene climate development on the central Tibetan Plateau: A sedimentary record from Cuoe Lake. Palaeogeography Palaeoclimatology Palaeoecology 234, 328-340.
Wu, Y.H., Wang, S.M., Hou, X.H., 2006b. Chronology of Holocene lacustrine sediments in Co Ngoin, central Tibetan Plateau. Science in China Series D-Earth Sciences 49, 991-1001.
Wünnemann, B., Chen, F.H., Riedel, F., Zhang, C.J., Mischke, S., Chen, G.J., Demske, D., Ming, J., 2003. Holocene lake deposits of Bosten Lake, southern Xinjiang, China. Chinese Science Bulletin 48, 1429-1432.
146
Wünnemann, B., Mischke, S., Chen, F.H., 2006. A Holocene sedimentary record from Bosten Lake, China. Palaeogeography Palaeoclimatology Palaeoecology 234, 223-238.
Wunsch, C., 2006. Abrupt climate change: An alternative view. Quaternary Research 65, 191-203. Xie, S., Nott, C.J., Avsejs, L.A., Volders, F., Maddy, D., Chambers, F.M., Gledhill, A., Carter, J.F.,
Evershed, R.P., 2000. Palaeoclimate records in compound-specific delta D values of a lipid biomarker in ombrotrophic peat. Organic Geochemistry 31, 1053-1057.
Xie, S.C., Lai, X.L., Yi, Y., Gu, Y.S., Liu, Y.Y., Wang, X.Y., Liu, G., Liang, B., 2003. Molecular fossils in a Pleistocene river terrace in southern China related to paleoclimate variation. Organic Geochemistry 34, 789-797.
Xie, S.C., Nott, C.J., Avsejs, L.A., Maddy, D., Chambers, F.M., Evershed, R.P., 2004. Molecular and isotopic stratigraphy in an ombrotrophic mire for paleoclimate reconstruction. Geochimica Et Cosmochimica Acta 68, 2849-2862.
Xu, H., Ai, L., Tan, L.C., An, Z.S., 2006a. Stable isotopes in bulk carbonates and organic matter in recent sediments of Lake Qinghai and their climatic implications. Chemical Geology 235, 262-275.
Xu, S., Zheng, G.D., 2003. Variations in radiocarbon ages of various organic fractions in core sediments from Erhai Lake, SW China. Geochemical Journal 37, 135-144.
Xu, Y., Kang, S., Zhou, S., You, Q., Tian, K., 2006b. Characteristics of d18O in waters and the oxygen isotopic equilibrium of lake water in Nam Co basin, Tibetan Plateau. Annual report of Nam Co monitoring and research station fpr multisphere interactions Vol. 1, 114-121.
Yakir, D., Deniro, M.J., 1990. Oxygen and Hydrogen Isotope Fractionation During Cellulose Metabolism in Lemna-Gibba L. Plant Physiology 93, 325-332.
Yakir, D., DeNiro, M.J., Gat, J.R., 1990. Natural deuterium and oxygen-18 enrichment in leaf water of cotton plants grown under wet and dry conditions: evidence for water compartmentation and its dynamics. Plant, Cell & Environment 13, 49-56.
Yamanaka, T., Shimada, J., Hamada, Y., Tanaka, T., Yang, Y.H., Zhang, W.J., Hu, C.S., 2004. Hydrogen and oxygen isotopes in precipitation in the northern part of the North China Plain: climatology and inter-storm variability. Hydrological Processes 18, 2211-2222.
Yancheva, G., Nowaczyk, N.R., Mingram, J., Dulski, P., Schettler, G., Negendank, J.F.W., Liu, J.Q., Sigman, D.M., Peterson, L.C., Haug, G.H., 2007. Influence of the intertropical convergence zone on the East Asian monsoon. Nature 445, 74-77.
Yang, H., Equiza, M.A., Jagels, R., Pagani, M., Briggs, D.E.G., (2006) Hydrogen and carbon isotopic compositions of high-latitudinal plants in Paleocene and Eocene. In: EGU, 8, Geophysical Research Abstracts, pp. 10652. European Geosciences Union 2006, Vienna.
Yang, H., Huang, Y.S., 2003. Preservation of lipid hydrogen isotope ratios in Miocene lacustrine sediments and plant fossils at Clarkia, northern Idaho, USA. Organic Geochemistry 34, 413-423.
Yanhong, W., Lucke, A., Zhangdong, J., Sumin, W., Schleser, G.H., Battarbee, R.W., Weilan, X., 2006. Holocene climate development on the central Tibetan Plateau: A sedimentary record from Cuoe Lake. Palaeogeography, Palaeoclimatology, Palaeoecology 234, 328-340.
Yao, T.D., Shi, Y.F., Thompson, L.G., 1997. High resolution record of paleoclimate since the little ice age from the tibetan ice cores. Quaternary International 37, 19-23.
Yao, T.D., Thompson, L.G., Duan, K.Q., Xu, B.Q., Wang, N.L., Pu, J.C., Tian, L.D., Sun, W.Z., Kang, S.C., Qin, X.A., 2002. Temperature and methane records over the last 2 ka in Dasuopu ice core. Science in China Series D-Earth Sciences 45, 1068-1074.
Yapp, C.J., Epstein, S., 1982. A Re-Examination of Cellulose Carbon-Bound Hydrogen Delta-D Measurements and Some Factors Affecting Plant-Water D/H Relationships. Geochimica Et Cosmochimica Acta 46, 955-965.
Yokoyama, Y., Naruse, T., Ogawa, N.O., Tada, R., Kitazato, H., Ohkouchi, N., 2006. Dust influx reconstruction during the last 26,000 years inferred from a sedimentary leaf wax record from the Japan Sea. Global and Planetary Change 54, 239-250.
Yoshimura, K., Oki, T., Ohte, N., Kanae, S., 2003. A quantitative analysis of short-term O-18 variability with a Rayleigh-type isotope circulation model. Journal of Geophysical Research-Atmospheres 108, -.
147
You, Q., Kang, S., Li, C., Li, M., Liu, J., 2006. Featrures of Meteorological Parameters at Nam Co Station, Tibetan Plateau. Annual report of Nam Co monitoring and research station fpr multisphere interactions 1, 8-15.
Young, L.B., Harvey, H.H., 1992. Geochemistry of Mn and Fe in Lake-Sediments in Relation to Lake Acidity. Limnology and Oceanography 37, 603-613.
Zhai, Q., Guo, Z., Li, Y., Li, R., 2006. Annually laminated lake sediments and environmental changes in Bashang Plateau, North China. Palaeogeography, Palaeoclimatology, Palaeoecology 241, 95-102.
Zhang, J.W., Jin, M., Chen, F.H., Battarbee, R.W., Henderson, A.C.G., 2003. High-resolution precipitation variations in the Northeast Tibetan Plateau over the last 800 years documented by sediment cores of Qinghai Lake. Chinese Science Bulletin 48, 1451-1456.
Zhang, W., Cui, Z.J., Li, Y.H., 2006. Review of the timing and extent of glaciers during the last glacial cycle in the bordering mountains of Tibet and in East Asia. Quaternary International 154, 32-43.
Zhang, Z.H., Sachs, J.P., 2007. Hydrogen isotope fractionation in freshwater algae: I. Variations among lipids and species. Organic Geochemistry 38, 582-608.
Zhangdong Jin, S.W.J.S.E.Z.F.L.J.J.X.L., 2001. Chemical weathering since the Little Ice Age recorded in lake sediments: a high-resolution proxy of past climate. Earth Surface Processes and Landforms 26, 775-782.
Zhou, W.J., Xie, S.C., Meyers, P.A., Zheng, Y.H., 2005. Reconstruction of late glacial and Holocene climate evolution in southern China from geolipids and pollen in the Dingnan peat sequence. Organic Geochemistry 36, 1272-1284.
Zhu, D.A., Zhao, X.T., Meng, X.A., Wu, Z.H., Wu, Z.H., Feng, X.Y., Shao, Z.G., Liu, Q.S., Yang, M.L., 2002. Quaternary lake deposits of Nam Co, Tibet, with a discussion of the connection of Nam Co with Ring Co-Jiuru Co. Acta Geologica Sinica-English Edition 76, 283-291.
Zhu, D.G., Meng, X.G., Zhao, X.T., Shao, Z.G., Xu, Z.F., Yang, C.B., Ma, Z.B., Wu, Z.G., Wu, Z.H., Wang, J.P., 2004. Evolution of an ancient large lake in the southeast of the northern Tibetan Plateau. Acta Geologica Sinica-English Edition 78, 982-992.
Zhu, L., Wang, J., Lin, X., Ju, J., Xie, M., Li, M.C., Wu, Y., Daut, G., Mäusbacher, R., Schwalb, A., 2007. Environmental changes reflected by core sediments since 8.4 ka in Nam Co, Central Tibet of China. Quaternary Sciences 27, 588-597.
Ziegler, H., 1989. Hydrogen isotope fractionation in plant tissue. In: P.W. Rundel, J.R. Ehleringer, K.A. Nagy (eds.), Stable Isotopes in Ecological Research. Springer Verlag, pp. 105-123.
Zielinski, G.A., Mayewski, P.A., Meeker, L.D., Whitlow, S., Twickler, M.S., Morrison, M., Meese, D.A., Gow, A.J., Alley, R.B., 1995. The Gisp Ice Core Record of Volcanism since 7000-Bc - Reply. Science 267, 257-258.
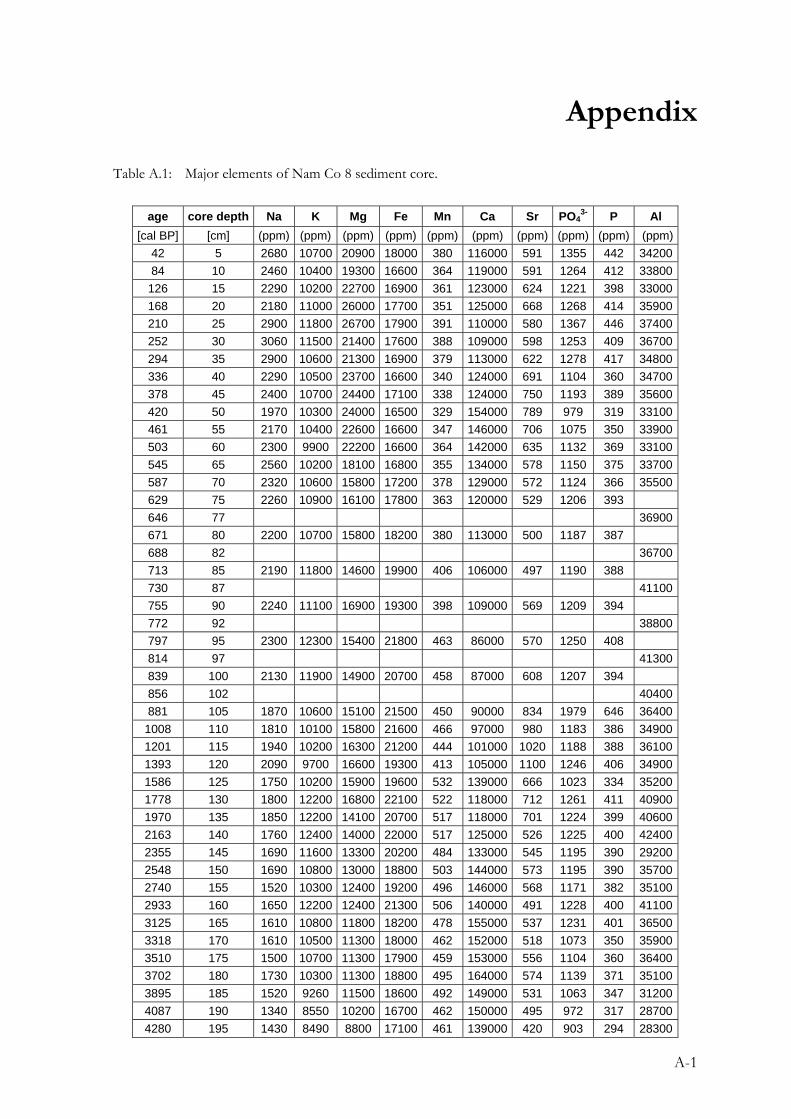
A-1
Appendix
Table A.1: Major elements of Nam Co 8 sediment core.
age core depth Na K Mg Fe Mn Ca Sr PO43- P Al
[cal BP] [cm] (ppm) (ppm) (ppm) (ppm) (ppm) (ppm) (ppm) (ppm) (ppm) (ppm)42 5 2680 10700 20900 18000 380 116000 591 1355 442 3420084 10 2460 10400 19300 16600 364 119000 591 1264 412 33800
126 15 2290 10200 22700 16900 361 123000 624 1221 398 33000168 20 2180 11000 26000 17700 351 125000 668 1268 414 35900210 25 2900 11800 26700 17900 391 110000 580 1367 446 37400252 30 3060 11500 21400 17600 388 109000 598 1253 409 36700294 35 2900 10600 21300 16900 379 113000 622 1278 417 34800336 40 2290 10500 23700 16600 340 124000 691 1104 360 34700378 45 2400 10700 24400 17100 338 124000 750 1193 389 35600420 50 1970 10300 24000 16500 329 154000 789 979 319 33100461 55 2170 10400 22600 16600 347 146000 706 1075 350 33900503 60 2300 9900 22200 16600 364 142000 635 1132 369 33100545 65 2560 10200 18100 16800 355 134000 578 1150 375 33700587 70 2320 10600 15800 17200 378 129000 572 1124 366 35500629 75 2260 10900 16100 17800 363 120000 529 1206 393 646 77 36900671 80 2200 10700 15800 18200 380 113000 500 1187 387 688 82 36700713 85 2190 11800 14600 19900 406 106000 497 1190 388 730 87 41100755 90 2240 11100 16900 19300 398 109000 569 1209 394 772 92 38800797 95 2300 12300 15400 21800 463 86000 570 1250 408 814 97 41300839 100 2130 11900 14900 20700 458 87000 608 1207 394 856 102 40400881 105 1870 10600 15100 21500 450 90000 834 1979 646 36400
1008 110 1810 10100 15800 21600 466 97000 980 1183 386 349001201 115 1940 10200 16300 21200 444 101000 1020 1188 388 361001393 120 2090 9700 16600 19300 413 105000 1100 1246 406 349001586 125 1750 10200 15900 19600 532 139000 666 1023 334 352001778 130 1800 12200 16800 22100 522 118000 712 1261 411 409001970 135 1850 12200 14100 20700 517 118000 701 1224 399 406002163 140 1760 12400 14000 22000 517 125000 526 1225 400 424002355 145 1690 11600 13300 20200 484 133000 545 1195 390 292002548 150 1690 10800 13000 18800 503 144000 573 1195 390 357002740 155 1520 10300 12400 19200 496 146000 568 1171 382 351002933 160 1650 12200 12400 21300 506 140000 491 1228 400 411003125 165 1610 10800 11800 18200 478 155000 537 1231 401 365003318 170 1610 10500 11300 18000 462 152000 518 1073 350 359003510 175 1500 10700 11300 17900 459 153000 556 1104 360 364003702 180 1730 10300 11300 18800 495 164000 574 1139 371 351003895 185 1520 9260 11500 18600 492 149000 531 1063 347 312004087 190 1340 8550 10200 16700 462 150000 495 972 317 287004280 195 1430 8490 8800 17100 461 139000 420 903 294 28300
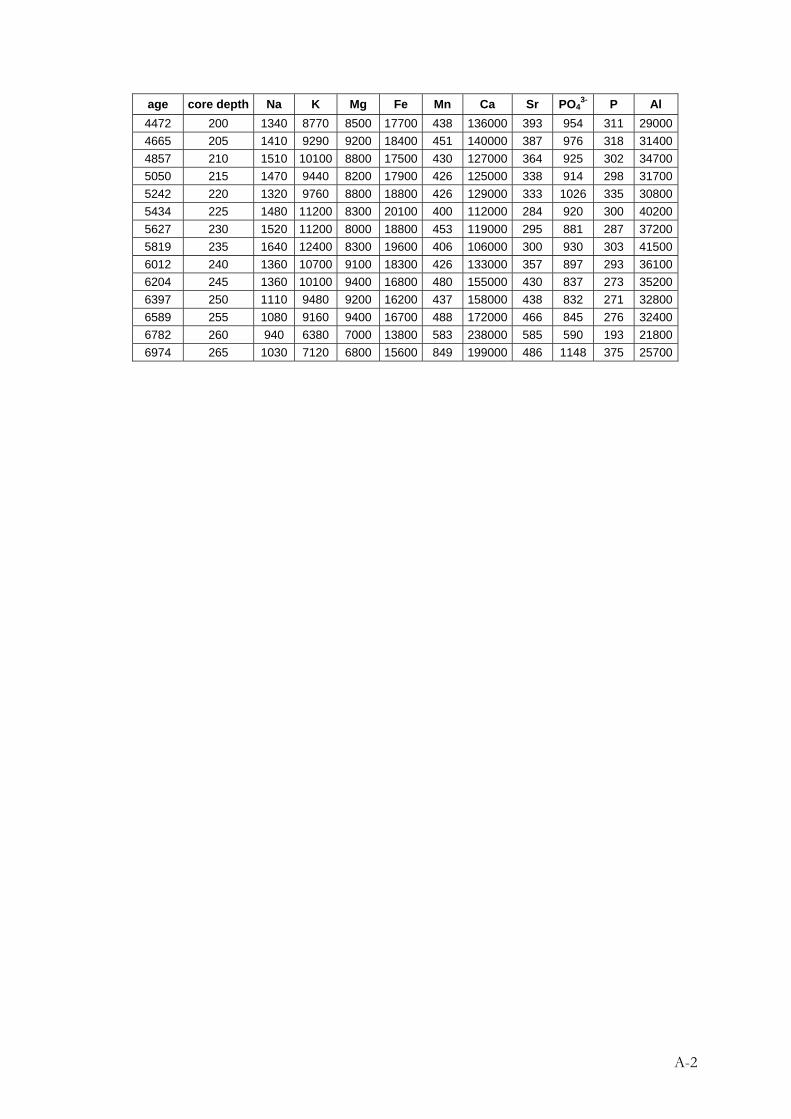
A-2
age core depth Na K Mg Fe Mn Ca Sr PO43- P Al
4472 200 1340 8770 8500 17700 438 136000 393 954 311 290004665 205 1410 9290 9200 18400 451 140000 387 976 318 314004857 210 1510 10100 8800 17500 430 127000 364 925 302 347005050 215 1470 9440 8200 17900 426 125000 338 914 298 317005242 220 1320 9760 8800 18800 426 129000 333 1026 335 308005434 225 1480 11200 8300 20100 400 112000 284 920 300 402005627 230 1520 11200 8000 18800 453 119000 295 881 287 372005819 235 1640 12400 8300 19600 406 106000 300 930 303 415006012 240 1360 10700 9100 18300 426 133000 357 897 293 361006204 245 1360 10100 9400 16800 480 155000 430 837 273 352006397 250 1110 9480 9200 16200 437 158000 438 832 271 328006589 255 1080 9160 9400 16700 488 172000 466 845 276 324006782 260 940 6380 7000 13800 583 238000 585 590 193 218006974 265 1030 7120 6800 15600 849 199000 486 1148 375 25700
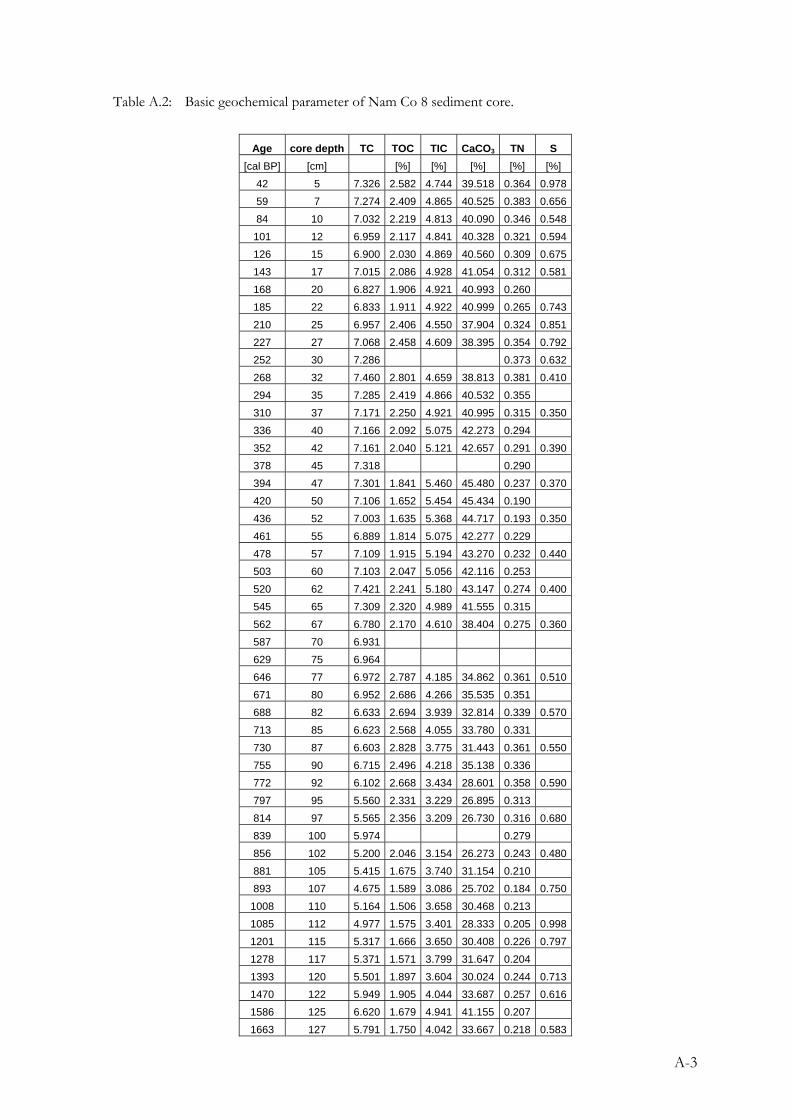
A-3
Table A.2: Basic geochemical parameter of Nam Co 8 sediment core.
Age core depth TC TOC TIC CaCO3 TN S [cal BP] [cm] [%] [%] [%] [%] [%]
42 5 7.326 2.582 4.744 39.518 0.364 0.978 59 7 7.274 2.409 4.865 40.525 0.383 0.656 84 10 7.032 2.219 4.813 40.090 0.346 0.548
101 12 6.959 2.117 4.841 40.328 0.321 0.594 126 15 6.900 2.030 4.869 40.560 0.309 0.675 143 17 7.015 2.086 4.928 41.054 0.312 0.581 168 20 6.827 1.906 4.921 40.993 0.260 185 22 6.833 1.911 4.922 40.999 0.265 0.743 210 25 6.957 2.406 4.550 37.904 0.324 0.851 227 27 7.068 2.458 4.609 38.395 0.354 0.792 252 30 7.286 0.373 0.632 268 32 7.460 2.801 4.659 38.813 0.381 0.410 294 35 7.285 2.419 4.866 40.532 0.355 310 37 7.171 2.250 4.921 40.995 0.315 0.350 336 40 7.166 2.092 5.075 42.273 0.294 352 42 7.161 2.040 5.121 42.657 0.291 0.390 378 45 7.318 0.290 394 47 7.301 1.841 5.460 45.480 0.237 0.370 420 50 7.106 1.652 5.454 45.434 0.190 436 52 7.003 1.635 5.368 44.717 0.193 0.350 461 55 6.889 1.814 5.075 42.277 0.229 478 57 7.109 1.915 5.194 43.270 0.232 0.440 503 60 7.103 2.047 5.056 42.116 0.253 520 62 7.421 2.241 5.180 43.147 0.274 0.400 545 65 7.309 2.320 4.989 41.555 0.315 562 67 6.780 2.170 4.610 38.404 0.275 0.360 587 70 6.931 629 75 6.964 646 77 6.972 2.787 4.185 34.862 0.361 0.510 671 80 6.952 2.686 4.266 35.535 0.351 688 82 6.633 2.694 3.939 32.814 0.339 0.570 713 85 6.623 2.568 4.055 33.780 0.331 730 87 6.603 2.828 3.775 31.443 0.361 0.550 755 90 6.715 2.496 4.218 35.138 0.336 772 92 6.102 2.668 3.434 28.601 0.358 0.590 797 95 5.560 2.331 3.229 26.895 0.313 814 97 5.565 2.356 3.209 26.730 0.316 0.680 839 100 5.974 0.279 856 102 5.200 2.046 3.154 26.273 0.243 0.480 881 105 5.415 1.675 3.740 31.154 0.210 893 107 4.675 1.589 3.086 25.702 0.184 0.750
1008 110 5.164 1.506 3.658 30.468 0.213 1085 112 4.977 1.575 3.401 28.333 0.205 0.998 1201 115 5.317 1.666 3.650 30.408 0.226 0.797 1278 117 5.371 1.571 3.799 31.647 0.204 1393 120 5.501 1.897 3.604 30.024 0.244 0.713 1470 122 5.949 1.905 4.044 33.687 0.257 0.616 1586 125 6.620 1.679 4.941 41.155 0.207 1663 127 5.791 1.750 4.042 33.667 0.218 0.583
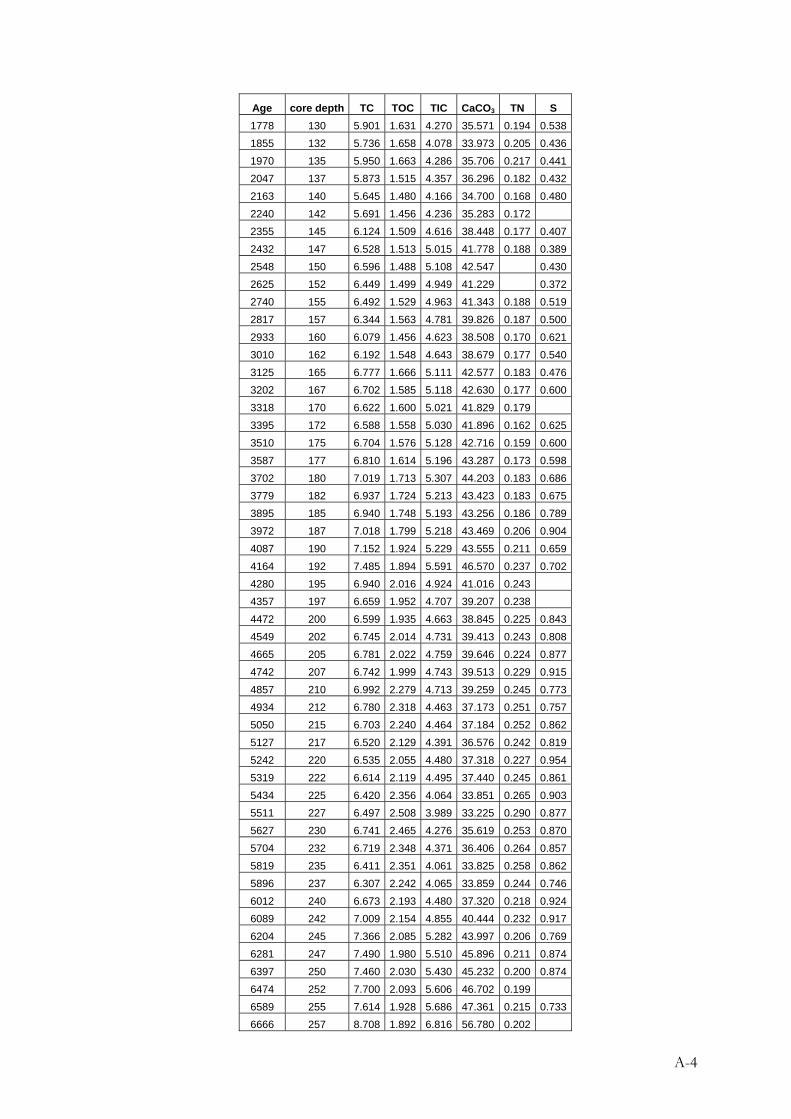
A-4
Age core depth TC TOC TIC CaCO3 TN S 1778 130 5.901 1.631 4.270 35.571 0.194 0.538 1855 132 5.736 1.658 4.078 33.973 0.205 0.436 1970 135 5.950 1.663 4.286 35.706 0.217 0.441 2047 137 5.873 1.515 4.357 36.296 0.182 0.432 2163 140 5.645 1.480 4.166 34.700 0.168 0.480 2240 142 5.691 1.456 4.236 35.283 0.172 2355 145 6.124 1.509 4.616 38.448 0.177 0.407 2432 147 6.528 1.513 5.015 41.778 0.188 0.389 2548 150 6.596 1.488 5.108 42.547 0.430 2625 152 6.449 1.499 4.949 41.229 0.372 2740 155 6.492 1.529 4.963 41.343 0.188 0.519 2817 157 6.344 1.563 4.781 39.826 0.187 0.500 2933 160 6.079 1.456 4.623 38.508 0.170 0.621 3010 162 6.192 1.548 4.643 38.679 0.177 0.540 3125 165 6.777 1.666 5.111 42.577 0.183 0.476 3202 167 6.702 1.585 5.118 42.630 0.177 0.600 3318 170 6.622 1.600 5.021 41.829 0.179 3395 172 6.588 1.558 5.030 41.896 0.162 0.625 3510 175 6.704 1.576 5.128 42.716 0.159 0.600 3587 177 6.810 1.614 5.196 43.287 0.173 0.598 3702 180 7.019 1.713 5.307 44.203 0.183 0.686 3779 182 6.937 1.724 5.213 43.423 0.183 0.675 3895 185 6.940 1.748 5.193 43.256 0.186 0.789 3972 187 7.018 1.799 5.218 43.469 0.206 0.904 4087 190 7.152 1.924 5.229 43.555 0.211 0.659 4164 192 7.485 1.894 5.591 46.570 0.237 0.702 4280 195 6.940 2.016 4.924 41.016 0.243 4357 197 6.659 1.952 4.707 39.207 0.238 4472 200 6.599 1.935 4.663 38.845 0.225 0.843 4549 202 6.745 2.014 4.731 39.413 0.243 0.808 4665 205 6.781 2.022 4.759 39.646 0.224 0.877 4742 207 6.742 1.999 4.743 39.513 0.229 0.915 4857 210 6.992 2.279 4.713 39.259 0.245 0.773 4934 212 6.780 2.318 4.463 37.173 0.251 0.757 5050 215 6.703 2.240 4.464 37.184 0.252 0.862 5127 217 6.520 2.129 4.391 36.576 0.242 0.819 5242 220 6.535 2.055 4.480 37.318 0.227 0.954 5319 222 6.614 2.119 4.495 37.440 0.245 0.861 5434 225 6.420 2.356 4.064 33.851 0.265 0.903 5511 227 6.497 2.508 3.989 33.225 0.290 0.877 5627 230 6.741 2.465 4.276 35.619 0.253 0.870 5704 232 6.719 2.348 4.371 36.406 0.264 0.857 5819 235 6.411 2.351 4.061 33.825 0.258 0.862 5896 237 6.307 2.242 4.065 33.859 0.244 0.746 6012 240 6.673 2.193 4.480 37.320 0.218 0.924 6089 242 7.009 2.154 4.855 40.444 0.232 0.917 6204 245 7.366 2.085 5.282 43.997 0.206 0.769 6281 247 7.490 1.980 5.510 45.896 0.211 0.874 6397 250 7.460 2.030 5.430 45.232 0.200 0.874 6474 252 7.700 2.093 5.606 46.702 0.199 6589 255 7.614 1.928 5.686 47.361 0.215 0.733 6666 257 8.708 1.892 6.816 56.780 0.202

A-5
Age core depth TC TOC TIC CaCO3 TN S 6782 260 9.082 1.567 7.515 62.598 0.170 0.505 6859 262 7.588 2.100 5.487 45.710 0.236 1.041 6974 265 8.043 1.735 6.308 52.543 0.208 0.448 7051 267 8.378 1.364 7.014 58.426 0.175 0.907
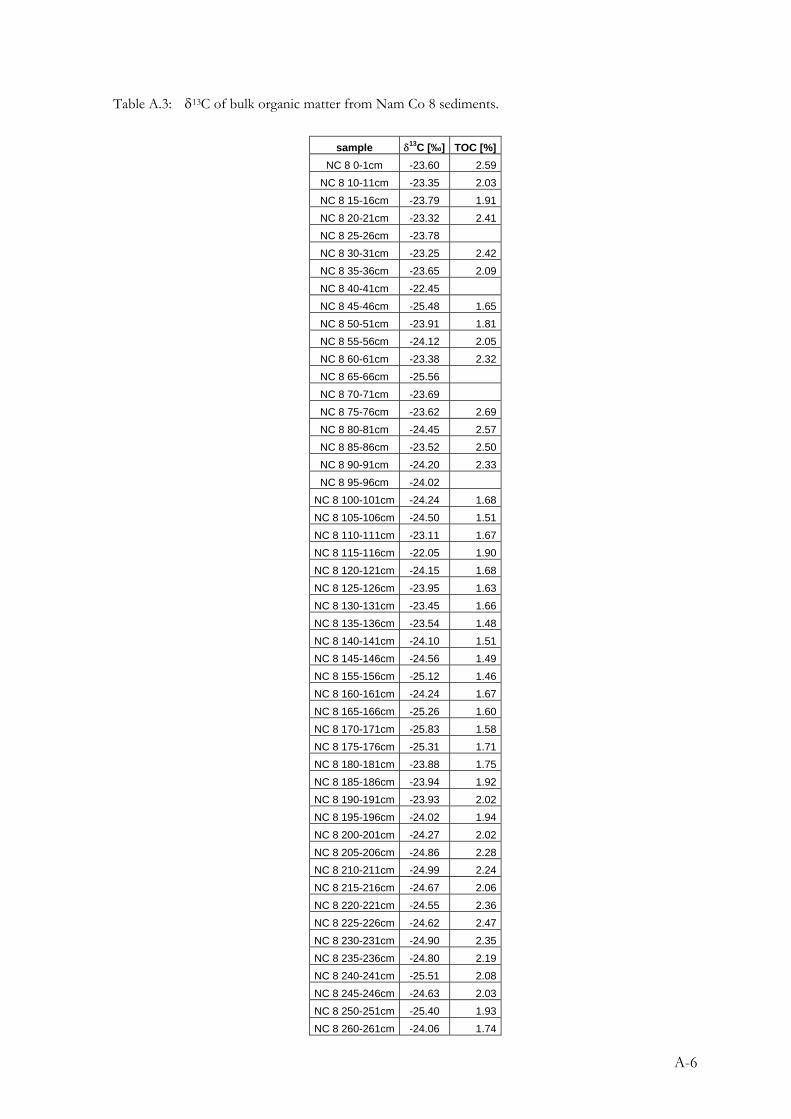
A-6
Table A.3: δ13C of bulk organic matter from Nam Co 8 sediments.
sample δ13C [‰] TOC [%]NC 8 0-1cm -23.60 2.59
NC 8 10-11cm -23.35 2.03NC 8 15-16cm -23.79 1.91NC 8 20-21cm -23.32 2.41NC 8 25-26cm -23.78 NC 8 30-31cm -23.25 2.42NC 8 35-36cm -23.65 2.09NC 8 40-41cm -22.45 NC 8 45-46cm -25.48 1.65NC 8 50-51cm -23.91 1.81NC 8 55-56cm -24.12 2.05NC 8 60-61cm -23.38 2.32NC 8 65-66cm -25.56 NC 8 70-71cm -23.69 NC 8 75-76cm -23.62 2.69NC 8 80-81cm -24.45 2.57NC 8 85-86cm -23.52 2.50NC 8 90-91cm -24.20 2.33NC 8 95-96cm -24.02
NC 8 100-101cm -24.24 1.68NC 8 105-106cm -24.50 1.51NC 8 110-111cm -23.11 1.67NC 8 115-116cm -22.05 1.90NC 8 120-121cm -24.15 1.68NC 8 125-126cm -23.95 1.63NC 8 130-131cm -23.45 1.66NC 8 135-136cm -23.54 1.48NC 8 140-141cm -24.10 1.51NC 8 145-146cm -24.56 1.49NC 8 155-156cm -25.12 1.46NC 8 160-161cm -24.24 1.67NC 8 165-166cm -25.26 1.60NC 8 170-171cm -25.83 1.58NC 8 175-176cm -25.31 1.71NC 8 180-181cm -23.88 1.75NC 8 185-186cm -23.94 1.92NC 8 190-191cm -23.93 2.02NC 8 195-196cm -24.02 1.94NC 8 200-201cm -24.27 2.02NC 8 205-206cm -24.86 2.28NC 8 210-211cm -24.99 2.24NC 8 215-216cm -24.67 2.06NC 8 220-221cm -24.55 2.36NC 8 225-226cm -24.62 2.47NC 8 230-231cm -24.90 2.35NC 8 235-236cm -24.80 2.19NC 8 240-241cm -25.51 2.08NC 8 245-246cm -24.63 2.03NC 8 250-251cm -25.40 1.93NC 8 260-261cm -24.06 1.74
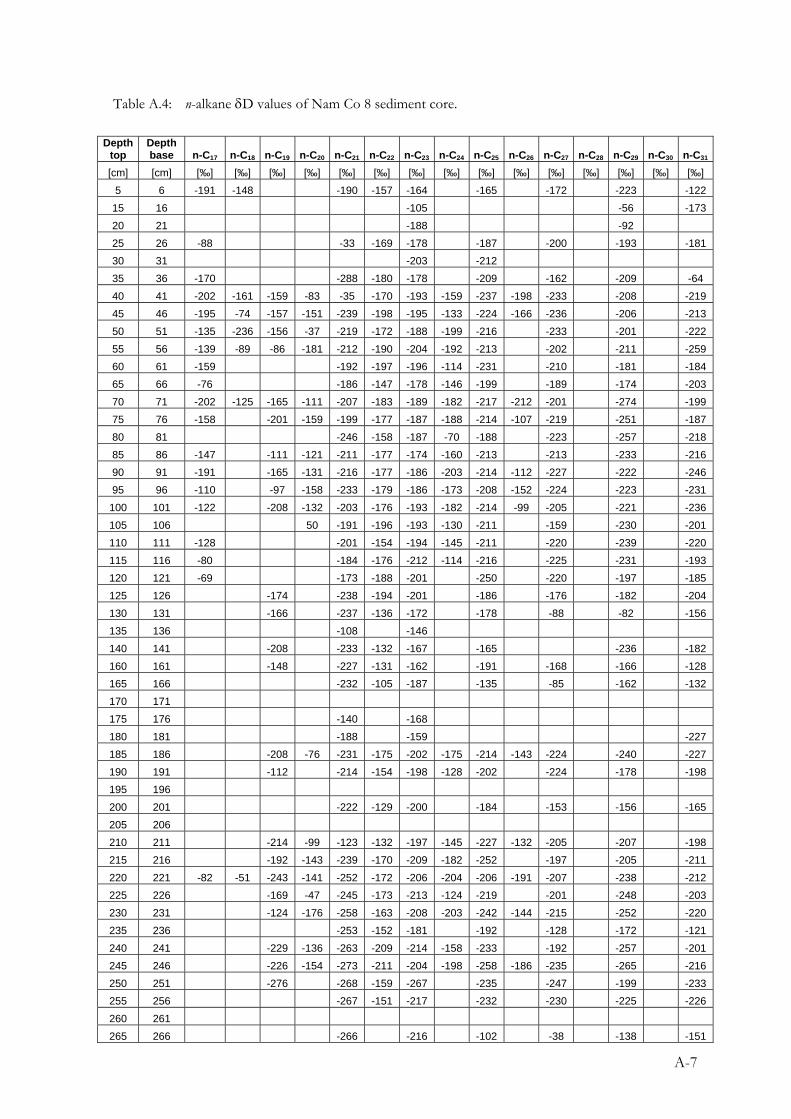
A-7
Table A.4: n-alkane δD values of Nam Co 8 sediment core.
Depth top
Depth base n-C17 n-C18 n-C19 n-C20 n-C21 n-C22 n-C23 n-C24 n-C25 n-C26 n-C27 n-C28 n-C29 n-C30 n-C31
[cm] [cm] [‰] [‰] [‰] [‰] [‰] [‰] [‰] [‰] [‰] [‰] [‰] [‰] [‰] [‰] [‰] 5 6 -191 -148 -190 -157 -164 -165 -172 -223 -122
15 16 -105 -56 -173 20 21 -188 -92 25 26 -88 -33 -169 -178 -187 -200 -193 -181 30 31 -203 -212 35 36 -170 -288 -180 -178 -209 -162 -209 -64 40 41 -202 -161 -159 -83 -35 -170 -193 -159 -237 -198 -233 -208 -219 45 46 -195 -74 -157 -151 -239 -198 -195 -133 -224 -166 -236 -206 -213 50 51 -135 -236 -156 -37 -219 -172 -188 -199 -216 -233 -201 -222 55 56 -139 -89 -86 -181 -212 -190 -204 -192 -213 -202 -211 -259 60 61 -159 -192 -197 -196 -114 -231 -210 -181 -184 65 66 -76 -186 -147 -178 -146 -199 -189 -174 -203 70 71 -202 -125 -165 -111 -207 -183 -189 -182 -217 -212 -201 -274 -199 75 76 -158 -201 -159 -199 -177 -187 -188 -214 -107 -219 -251 -187 80 81 -246 -158 -187 -70 -188 -223 -257 -218 85 86 -147 -111 -121 -211 -177 -174 -160 -213 -213 -233 -216 90 91 -191 -165 -131 -216 -177 -186 -203 -214 -112 -227 -222 -246 95 96 -110 -97 -158 -233 -179 -186 -173 -208 -152 -224 -223 -231
100 101 -122 -208 -132 -203 -176 -193 -182 -214 -99 -205 -221 -236 105 106 50 -191 -196 -193 -130 -211 -159 -230 -201 110 111 -128 -201 -154 -194 -145 -211 -220 -239 -220 115 116 -80 -184 -176 -212 -114 -216 -225 -231 -193 120 121 -69 -173 -188 -201 -250 -220 -197 -185 125 126 -174 -238 -194 -201 -186 -176 -182 -204 130 131 -166 -237 -136 -172 -178 -88 -82 -156 135 136 -108 -146 140 141 -208 -233 -132 -167 -165 -236 -182 160 161 -148 -227 -131 -162 -191 -168 -166 -128 165 166 -232 -105 -187 -135 -85 -162 -132 170 171 175 176 -140 -168 180 181 -188 -159 -227 185 186 -208 -76 -231 -175 -202 -175 -214 -143 -224 -240 -227 190 191 -112 -214 -154 -198 -128 -202 -224 -178 -198 195 196 200 201 -222 -129 -200 -184 -153 -156 -165 205 206 210 211 -214 -99 -123 -132 -197 -145 -227 -132 -205 -207 -198 215 216 -192 -143 -239 -170 -209 -182 -252 -197 -205 -211 220 221 -82 -51 -243 -141 -252 -172 -206 -204 -206 -191 -207 -238 -212 225 226 -169 -47 -245 -173 -213 -124 -219 -201 -248 -203 230 231 -124 -176 -258 -163 -208 -203 -242 -144 -215 -252 -220 235 236 -253 -152 -181 -192 -128 -172 -121 240 241 -229 -136 -263 -209 -214 -158 -233 -192 -257 -201 245 246 -226 -154 -273 -211 -204 -198 -258 -186 -235 -265 -216 250 251 -276 -268 -159 -267 -235 -247 -199 -233 255 256 -267 -151 -217 -232 -230 -225 -226 260 261 265 266 -266 -216 -102 -38 -138 -151
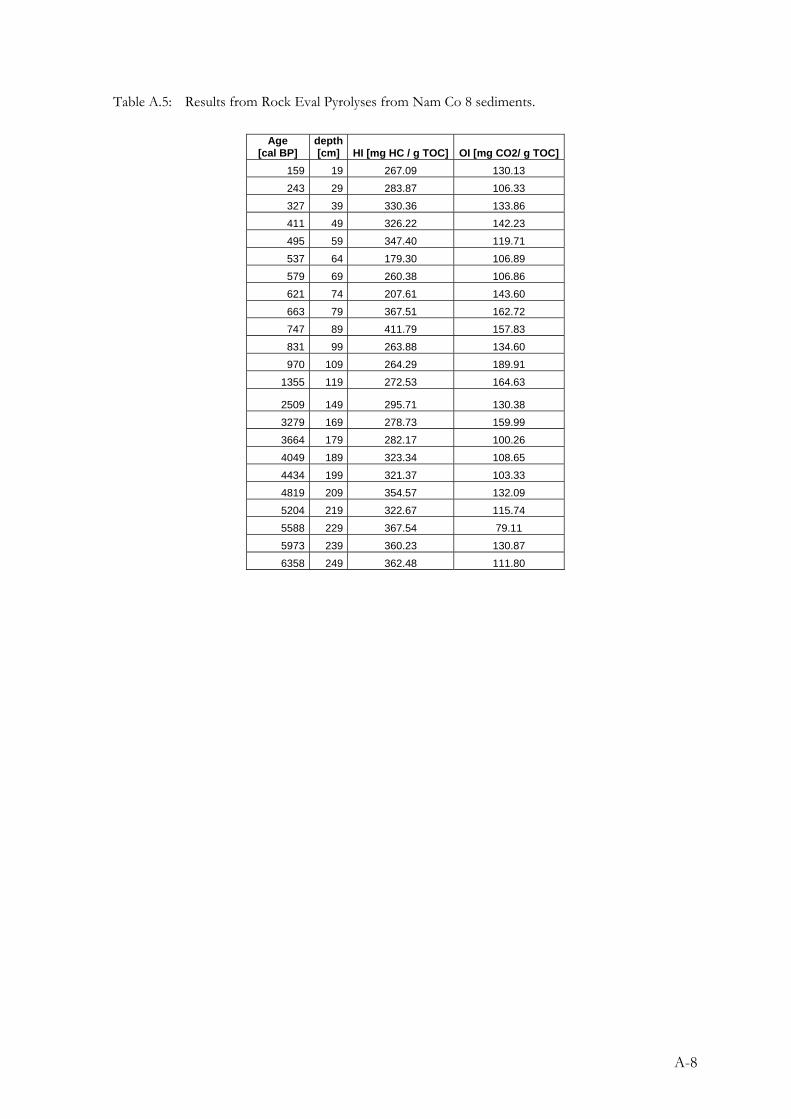
A-8
Table A.5: Results from Rock Eval Pyrolyses from Nam Co 8 sediments.
Age [cal BP]
depth [cm] HI [mg HC / g TOC] OI [mg CO2/ g TOC]
159 19 267.09 130.13 243 29 283.87 106.33 327 39 330.36 133.86 411 49 326.22 142.23 495 59 347.40 119.71 537 64 179.30 106.89 579 69 260.38 106.86 621 74 207.61 143.60 663 79 367.51 162.72 747 89 411.79 157.83 831 99 263.88 134.60 970 109 264.29 189.91
1355 119 272.53 164.63
2509 149 295.71 130.38 3279 169 278.73 159.99 3664 179 282.17 100.26 4049 189 323.34 108.65 4434 199 321.37 103.33 4819 209 354.57 132.09 5204 219 322.67 115.74 5588 229 367.54 79.11 5973 239 360.23 130.87 6358 249 362.48 111.80
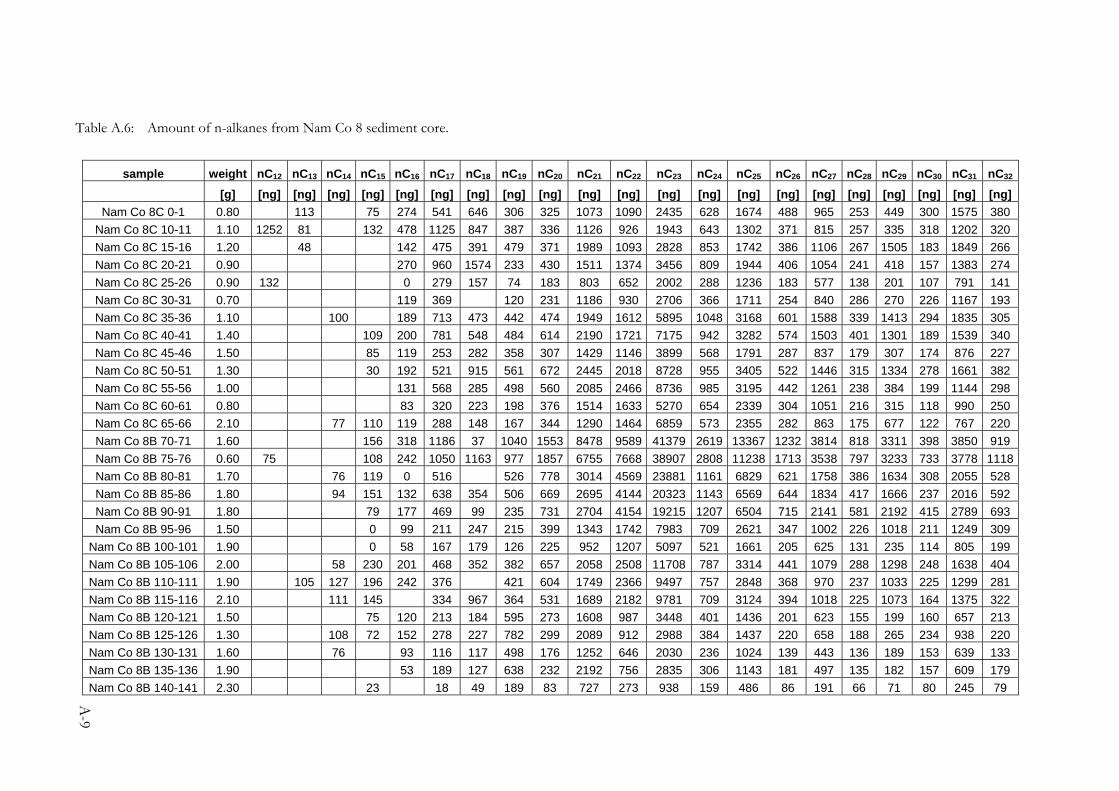
A-9
Table A.6: Amount of n-alkanes from Nam Co 8 sediment core.
sample weight nC12 nC13 nC14 nC15 nC16 nC17 nC18 nC19 nC20 nC21 nC22 nC23 nC24 nC25 nC26 nC27 nC28 nC29 nC30 nC31 nC32 [g] [ng] [ng] [ng] [ng] [ng] [ng] [ng] [ng] [ng] [ng] [ng] [ng] [ng] [ng] [ng] [ng] [ng] [ng] [ng] [ng] [ng]
Nam Co 8C 0-1 0.80 113 75 274 541 646 306 325 1073 1090 2435 628 1674 488 965 253 449 300 1575 380 Nam Co 8C 10-11 1.10 1252 81 132 478 1125 847 387 336 1126 926 1943 643 1302 371 815 257 335 318 1202 320 Nam Co 8C 15-16 1.20 48 142 475 391 479 371 1989 1093 2828 853 1742 386 1106 267 1505 183 1849 266 Nam Co 8C 20-21 0.90 270 960 1574 233 430 1511 1374 3456 809 1944 406 1054 241 418 157 1383 274 Nam Co 8C 25-26 0.90 132 0 279 157 74 183 803 652 2002 288 1236 183 577 138 201 107 791 141 Nam Co 8C 30-31 0.70 119 369 120 231 1186 930 2706 366 1711 254 840 286 270 226 1167 193 Nam Co 8C 35-36 1.10 100 189 713 473 442 474 1949 1612 5895 1048 3168 601 1588 339 1413 294 1835 305 Nam Co 8C 40-41 1.40 109 200 781 548 484 614 2190 1721 7175 942 3282 574 1503 401 1301 189 1539 340 Nam Co 8C 45-46 1.50 85 119 253 282 358 307 1429 1146 3899 568 1791 287 837 179 307 174 876 227 Nam Co 8C 50-51 1.30 30 192 521 915 561 672 2445 2018 8728 955 3405 522 1446 315 1334 278 1661 382 Nam Co 8C 55-56 1.00 131 568 285 498 560 2085 2466 8736 985 3195 442 1261 238 384 199 1144 298 Nam Co 8C 60-61 0.80 83 320 223 198 376 1514 1633 5270 654 2339 304 1051 216 315 118 990 250 Nam Co 8C 65-66 2.10 77 110 119 288 148 167 344 1290 1464 6859 573 2355 282 863 175 677 122 767 220 Nam Co 8B 70-71 1.60 156 318 1186 37 1040 1553 8478 9589 41379 2619 13367 1232 3814 818 3311 398 3850 919 Nam Co 8B 75-76 0.60 75 108 242 1050 1163 977 1857 6755 7668 38907 2808 11238 1713 3538 797 3233 733 3778 1118 Nam Co 8B 80-81 1.70 76 119 0 516 526 778 3014 4569 23881 1161 6829 621 1758 386 1634 308 2055 528 Nam Co 8B 85-86 1.80 94 151 132 638 354 506 669 2695 4144 20323 1143 6569 644 1834 417 1666 237 2016 592 Nam Co 8B 90-91 1.80 79 177 469 99 235 731 2704 4154 19215 1207 6504 715 2141 581 2192 415 2789 693 Nam Co 8B 95-96 1.50 0 99 211 247 215 399 1343 1742 7983 709 2621 347 1002 226 1018 211 1249 309
Nam Co 8B 100-101 1.90 0 58 167 179 126 225 952 1207 5097 521 1661 205 625 131 235 114 805 199 Nam Co 8B 105-106 2.00 58 230 201 468 352 382 657 2058 2508 11708 787 3314 441 1079 288 1298 248 1638 404 Nam Co 8B 110-111 1.90 105 127 196 242 376 421 604 1749 2366 9497 757 2848 368 970 237 1033 225 1299 281 Nam Co 8B 115-116 2.10 111 145 334 967 364 531 1689 2182 9781 709 3124 394 1018 225 1073 164 1375 322 Nam Co 8B 120-121 1.50 75 120 213 184 595 273 1608 987 3448 401 1436 201 623 155 199 160 657 213 Nam Co 8B 125-126 1.30 108 72 152 278 227 782 299 2089 912 2988 384 1437 220 658 188 265 234 938 220 Nam Co 8B 130-131 1.60 76 93 116 117 498 176 1252 646 2030 236 1024 139 443 136 189 153 639 133 Nam Co 8B 135-136 1.90 53 189 127 638 232 2192 756 2835 306 1143 181 497 135 182 157 609 179 Nam Co 8B 140-141 2.30 23 18 49 189 83 727 273 938 159 486 86 191 66 71 80 245 79
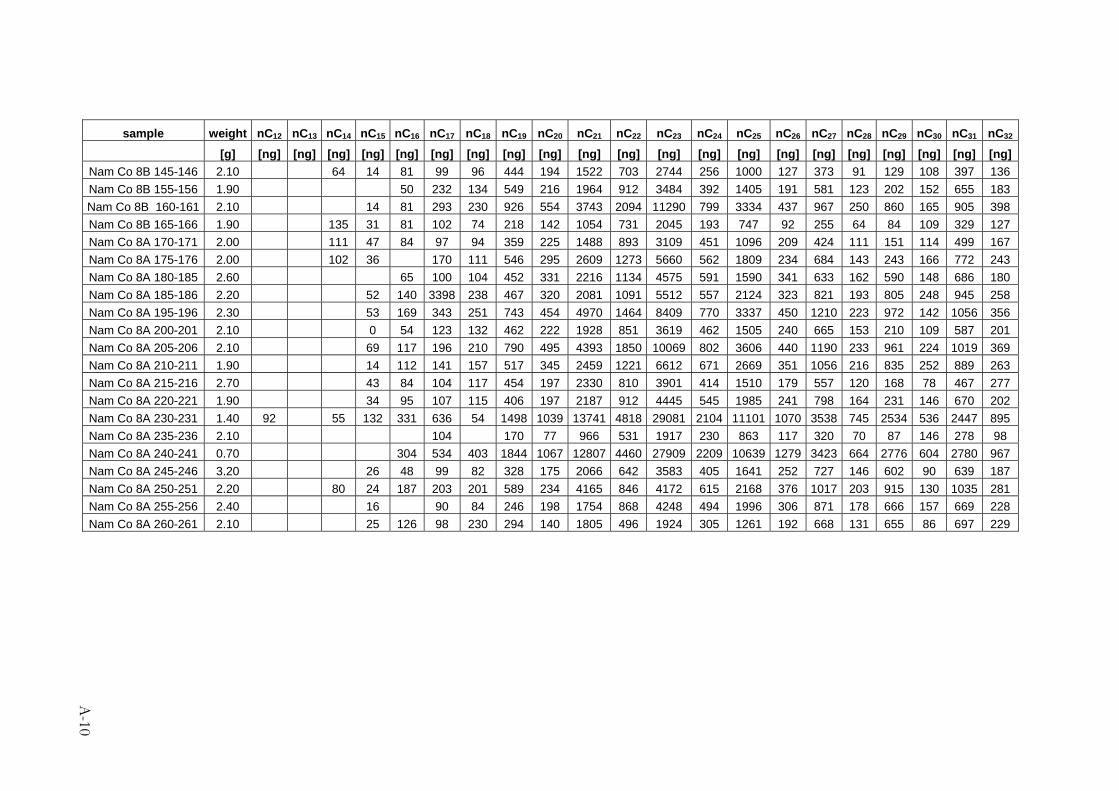
A-10
sample weight nC12 nC13 nC14 nC15 nC16 nC17 nC18 nC19 nC20 nC21 nC22 nC23 nC24 nC25 nC26 nC27 nC28 nC29 nC30 nC31 nC32 [g] [ng] [ng] [ng] [ng] [ng] [ng] [ng] [ng] [ng] [ng] [ng] [ng] [ng] [ng] [ng] [ng] [ng] [ng] [ng] [ng] [ng]
Nam Co 8B 145-146 2.10 64 14 81 99 96 444 194 1522 703 2744 256 1000 127 373 91 129 108 397 136 Nam Co 8B 155-156 1.90 50 232 134 549 216 1964 912 3484 392 1405 191 581 123 202 152 655 183 Nam Co 8B 160-161 2.10 14 81 293 230 926 554 3743 2094 11290 799 3334 437 967 250 860 165 905 398 Nam Co 8B 165-166 1.90 135 31 81 102 74 218 142 1054 731 2045 193 747 92 255 64 84 109 329 127 Nam Co 8A 170-171 2.00 111 47 84 97 94 359 225 1488 893 3109 451 1096 209 424 111 151 114 499 167 Nam Co 8A 175-176 2.00 102 36 170 111 546 295 2609 1273 5660 562 1809 234 684 143 243 166 772 243 Nam Co 8A 180-185 2.60 65 100 104 452 331 2216 1134 4575 591 1590 341 633 162 590 148 686 180 Nam Co 8A 185-186 2.20 52 140 3398 238 467 320 2081 1091 5512 557 2124 323 821 193 805 248 945 258 Nam Co 8A 195-196 2.30 53 169 343 251 743 454 4970 1464 8409 770 3337 450 1210 223 972 142 1056 356 Nam Co 8A 200-201 2.10 0 54 123 132 462 222 1928 851 3619 462 1505 240 665 153 210 109 587 201 Nam Co 8A 205-206 2.10 69 117 196 210 790 495 4393 1850 10069 802 3606 440 1190 233 961 224 1019 369 Nam Co 8A 210-211 1.90 14 112 141 157 517 345 2459 1221 6612 671 2669 351 1056 216 835 252 889 263 Nam Co 8A 215-216 2.70 43 84 104 117 454 197 2330 810 3901 414 1510 179 557 120 168 78 467 277 Nam Co 8A 220-221 1.90 34 95 107 115 406 197 2187 912 4445 545 1985 241 798 164 231 146 670 202 Nam Co 8A 230-231 1.40 92 55 132 331 636 54 1498 1039 13741 4818 29081 2104 11101 1070 3538 745 2534 536 2447 895 Nam Co 8A 235-236 2.10 104 170 77 966 531 1917 230 863 117 320 70 87 146 278 98 Nam Co 8A 240-241 0.70 304 534 403 1844 1067 12807 4460 27909 2209 10639 1279 3423 664 2776 604 2780 967 Nam Co 8A 245-246 3.20 26 48 99 82 328 175 2066 642 3583 405 1641 252 727 146 602 90 639 187 Nam Co 8A 250-251 2.20 80 24 187 203 201 589 234 4165 846 4172 615 2168 376 1017 203 915 130 1035 281 Nam Co 8A 255-256 2.40 16 90 84 246 198 1754 868 4248 494 1996 306 871 178 666 157 669 228 Nam Co 8A 260-261 2.10 25 126 98 230 294 140 1805 496 1924 305 1261 192 668 131 655 86 697 229
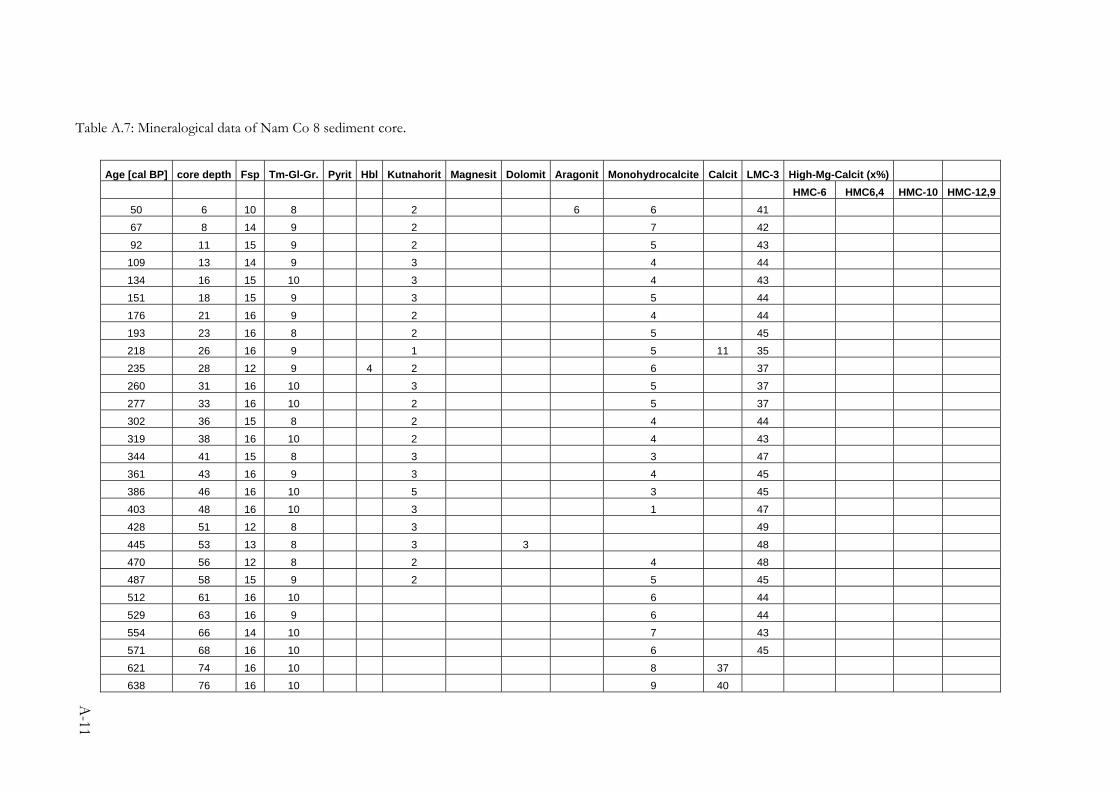
A-11
Table A.7: Mineralogical data of Nam Co 8 sediment core.
Age [cal BP] core depth Fsp Tm-Gl-Gr. Pyrit Hbl Kutnahorit Magnesit Dolomit Aragonit Monohydrocalcite Calcit LMC-3 High-Mg-Calcit (x%) HMC-6 HMC6,4 HMC-10 HMC-12,9
50 6 10 8 2 6 6 41 67 8 14 9 2 7 42 92 11 15 9 2 5 43
109 13 14 9 3 4 44 134 16 15 10 3 4 43 151 18 15 9 3 5 44 176 21 16 9 2 4 44 193 23 16 8 2 5 45 218 26 16 9 1 5 11 35 235 28 12 9 4 2 6 37 260 31 16 10 3 5 37 277 33 16 10 2 5 37 302 36 15 8 2 4 44 319 38 16 10 2 4 43 344 41 15 8 3 3 47 361 43 16 9 3 4 45 386 46 16 10 5 3 45 403 48 16 10 3 1 47 428 51 12 8 3 49 445 53 13 8 3 3 48 470 56 12 8 2 4 48 487 58 15 9 2 5 45 512 61 16 10 6 44 529 63 16 9 6 44 554 66 14 10 7 43 571 68 16 10 6 45 621 74 16 10 8 37 638 76 16 10 9 40
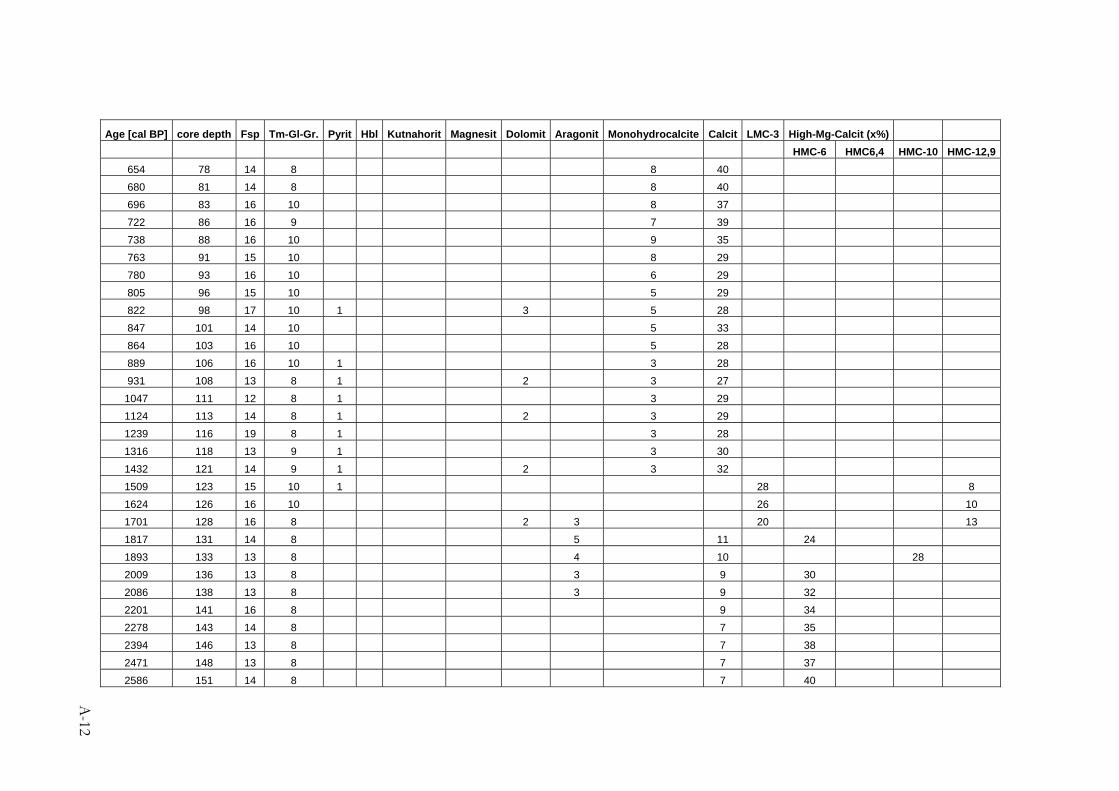
A-12
Age [cal BP] core depth Fsp Tm-Gl-Gr. Pyrit Hbl Kutnahorit Magnesit Dolomit Aragonit Monohydrocalcite Calcit LMC-3 High-Mg-Calcit (x%) HMC-6 HMC6,4 HMC-10 HMC-12,9
654 78 14 8 8 40 680 81 14 8 8 40 696 83 16 10 8 37 722 86 16 9 7 39 738 88 16 10 9 35 763 91 15 10 8 29 780 93 16 10 6 29 805 96 15 10 5 29 822 98 17 10 1 3 5 28 847 101 14 10 5 33 864 103 16 10 5 28 889 106 16 10 1 3 28 931 108 13 8 1 2 3 27
1047 111 12 8 1 3 29 1124 113 14 8 1 2 3 29 1239 116 19 8 1 3 28 1316 118 13 9 1 3 30 1432 121 14 9 1 2 3 32 1509 123 15 10 1 28 8 1624 126 16 10 26 10 1701 128 16 8 2 3 20 13 1817 131 14 8 5 11 24 1893 133 13 8 4 10 28 2009 136 13 8 3 9 30 2086 138 13 8 3 9 32 2201 141 16 8 9 34 2278 143 14 8 7 35 2394 146 13 8 7 38 2471 148 13 8 7 37 2586 151 14 8 7 40
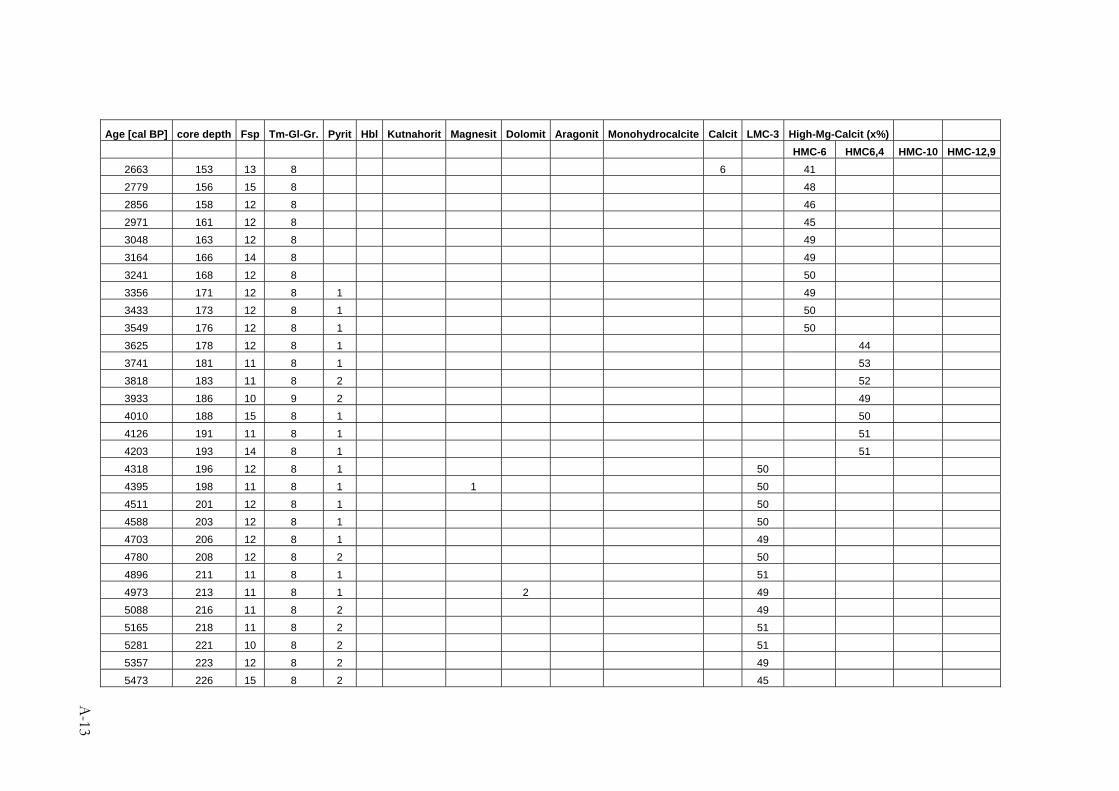
A-13
Age [cal BP] core depth Fsp Tm-Gl-Gr. Pyrit Hbl Kutnahorit Magnesit Dolomit Aragonit Monohydrocalcite Calcit LMC-3 High-Mg-Calcit (x%) HMC-6 HMC6,4 HMC-10 HMC-12,9
2663 153 13 8 6 41 2779 156 15 8 48 2856 158 12 8 46 2971 161 12 8 45 3048 163 12 8 49 3164 166 14 8 49 3241 168 12 8 50 3356 171 12 8 1 49 3433 173 12 8 1 50 3549 176 12 8 1 50 3625 178 12 8 1 44 3741 181 11 8 1 53 3818 183 11 8 2 52 3933 186 10 9 2 49 4010 188 15 8 1 50 4126 191 11 8 1 51 4203 193 14 8 1 51 4318 196 12 8 1 50 4395 198 11 8 1 1 50 4511 201 12 8 1 50 4588 203 12 8 1 50 4703 206 12 8 1 49 4780 208 12 8 2 50 4896 211 11 8 1 51 4973 213 11 8 1 2 49 5088 216 11 8 2 49 5165 218 11 8 2 51 5281 221 10 8 2 51 5357 223 12 8 2 49 5473 226 15 8 2 45
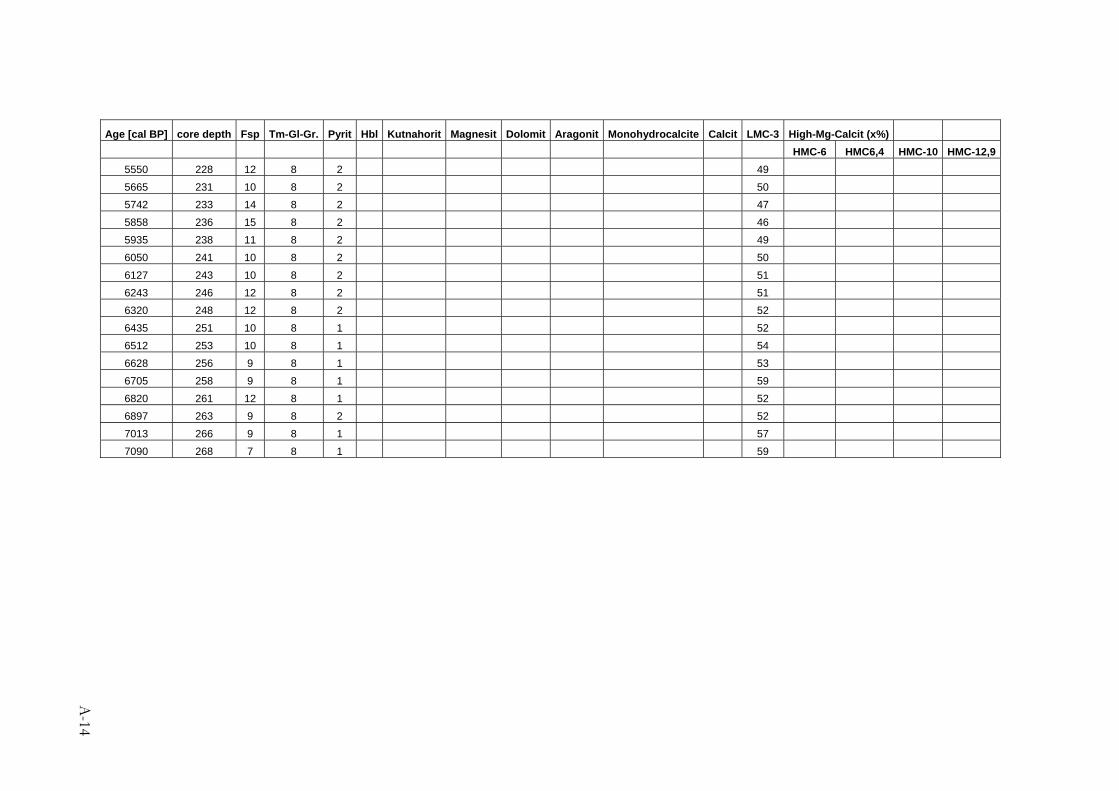
A-14
Age [cal BP] core depth Fsp Tm-Gl-Gr. Pyrit Hbl Kutnahorit Magnesit Dolomit Aragonit Monohydrocalcite Calcit LMC-3 High-Mg-Calcit (x%) HMC-6 HMC6,4 HMC-10 HMC-12,9
5550 228 12 8 2 49 5665 231 10 8 2 50 5742 233 14 8 2 47 5858 236 15 8 2 46 5935 238 11 8 2 49 6050 241 10 8 2 50 6127 243 10 8 2 51 6243 246 12 8 2 51 6320 248 12 8 2 52 6435 251 10 8 1 52 6512 253 10 8 1 54 6628 256 9 8 1 53 6705 258 9 8 1 59 6820 261 12 8 1 52 6897 263 9 8 2 52 7013 266 9 8 1 57 7090 268 7 8 1 59
Author Contributions to Manuscripts from the Dissertation of Ines Mügler
Manuscript 1: Compound–specific hydrogen isotope ratios of biomarkers – Tracing climatic changes in the past In: Dawson, T. E. and Siegwolf, R. T. W. (eds.), Stable Isotopes as Indicators of Ecological Change, 1. Academic Press.
Authors: Gerd Gleixner, Ines Mügler
• Ines Mügler is the second author and is responsible for writing this paper. She carried out the collection of data and she is responsible for literature review and publishing the manuscript.
• PD Dr. Gerd Gleixner is responsible for defining general objectives and reviewing the manuscript where he made several corrections on the drafts.
Manuscript 2: Effect of lake evaporation on δD values from lacustrine n-alkanes: A comparison of Nam Co, Tibetan Plateau and Holzmaar, Germany. Organic Geochemistry. In print.
Authors: Ines Mügler, Dirk Sachse, Martin Werner, Baiqing Xu, Guangjian Wu, Tandong Yao, Gerd Gleixner
• Ines Mügler is the first author and responsible for writing this paper. She performed the n-alkane extraction from the sample material and determined the n-alkane δD values. She is additionally responsible for literature review, formulating the hypothesis, data analysis and discussion, and publishing the manuscript.
• Dr. Dirk Sachse was involved in the sampling of the sediments at Holzmaar and Nam Co. He provided the n-alkane dD data from Holzmaar. He actively contributed with suggestions for data analysis and interpretation. He further reviewed and made several corrections on manuscript drafts.
• Dr. Martin Werner was involved in the sampling of the sediments at Nam Co. He further reviewed and made several corrections on manuscript drafts.
• Prof. Baiqing Xu was involved in the sampling of the sediments at Nam Co and provided
climate data for the Nam Co catchment. • Dr. Guangjian Wu was involved in the sampling of the sediments at Nam Co. • Prof. Tandong Yao facilitated the sampling of the sediments at Nam Co. • PD Dr. Gerd Gleixner is responsible for initiating this study. He actively contributed with
suggestions for data analysis and interpretation. He further reviewed and made several corrections on manuscript drafts.
Manuscript 3: Comparison between leaf wax δD values and benthic ostracoda δ18O values from two European lakes during the Younger Dryas – Evidence for a time lag between aquatic and terrestrial signal. Geochimica et Cosmochimca Acta. Submitted.
Authors: Ines Mügler, Dirk Sachse, Ulrich von Grafenstein, Gerd Gleixner.
• Ines Mügler is the first author and responsible for writing this paper. She was involved in the sampling of existing sediment cores and obtained the data in the laboratory. She carried
out the literature review, formulated the hypothesis, analyzed and discussed the data, and published the manuscript.
• Dr. Dirk Sachse was involved in the sampling and provided suggestions for data analysis and ideas for improving data interpretation. He further reviewed and made several corrections on manuscript drafts.
• Dr. Ulrich von Grafenstein provided the core material and was involved with the sampling. He provided δ18O datasets from both lake sites and several suggestions on data interpretation.
• PD Dr. Gerd Gleixner was involved in the sampling and formulating and discussing objectives. He carried out a critical review of the manuscript and made a number of suggestions for improvement.
Manuscript 4: A multi-proxy approach to reconstruct hydrological changes and Holocene climate development of Nam Co, Central Tibet. Journal of Paleolimnology. under review.
Authors: Ines Mügler, Gerd Gleixner, Roland Mäusbacher, Gerhard Daut, Brigitta Schütt, Jonas Berking, Antje Schwalb, Lorenz Schwark, Baiqing Xu, Tandong Yao, Liping Zhu, Chaolu Yi.
• Ines Mügler is the first author and responsible for the combination of the datasets from multiple sources and for writing this paper. She was involved in the coring and sampling at Nam Co. She performed the n-alkane extraction from the sample material and determined the n-alkane δD values. She carried out the literature review, formulated the hypothesis, analyzed and discussed the data, and published the manuscript.
• Gerd Gleixner was involved in the sediment sampling. He further contributed to the manuscript formulating and discussing objectives, discussing the results and reviewing.
• Roland Mäusbacher was involved in the sediment coring at Nam Co and in the sampling of the cores. He actively contributed with suggestions for data analysis and interpretation. He further reviewed and made several corrections on manuscript drafts.
• Gerhard Daut performed the sampling of the Nam Co sediment cores. He was involved in obtaining the sedimentological and basic geochemical data in the laboratory. He further reviewed and made several corrections on manuscript drafts.
• Brigitta Schütt provided the mineralogical data and additional information on the geomorphology of the Nam Co catchment.
• Jonas Berking provided information on the geomorphology of the Nam Co catchment. • Antje Schwalb carried out a critical review of the manuscript and made suggestions for
improvement. • Lorenz Schwark provided the Rock eval dataset. • Baiqing Xu was involved in the sediment coring at Nam Co. • Tandong Yao facilitated the sampling of the sediments at Nam Co. • Liping Zhu was involved in the sediment coring at Nam Co. • Chaolu Yi provided information on the geomorphology of the Nam Co catchment.
TABELLARISCHER LEBENSLAUF
Persönliche Daten
Name: Ines Mügler Geburtsdatum: 26.06.1978
Geburtsort: Meerane Staatszugehörigkeit: deutsch
Familienstand: ledig
Kurzbiographie
1985 - 1989 Tännichtschule Meerane
1989 - 1997 Pestalozzi Gymnasium Meerane,
August 1997 Allgemeine Hochschulreife (Abitur)
Sep 1997 - April 1998 Studium der Wirtschaftsgeographie Lüneburg
Mai 1998 - Apri 1999 Studium der Geographie and der Universität Hamburg
Mai 1999 - Okt 2004 Studium der Geographie (Diplom) an der Friedrich-Schiller-Universität Jena (Nebenfächer: Zoologie, Ökologie)
21.10.2004 Diplomgeographin (FSU Jena), Gesamtnote: 1.2
seit Jan 2005 wissenschaftlicher Mitarbeiter am Max Planck Institut für Biogeochemie in Jena
Auszeichnungen und Preise
2005 Poster Presentation Award auf der Konferenz: “2nd PAGES Open Science Meeting” Peking, 2005
2006 Poster Presentation Award in der “Monsoon Asia session” auf der Jahrestagung der “Earth System Science Partnership (ESSP)”, Peking, 2006
Mitgliedschaften
Seit 2006 Mitglied der American Geophysical Union (AGU)
Selbständigkeitserklärung
Ich erkläre, dass ich die vorliegende Arbeit selbständig und unter Verwendung der angegebenen Hilfsmittel, persönlicher Mitteilungen und Quellen angefertigt habe.
.………………………. ……………………………
Ort, Datum Ines Mügler